Biomedical Open Source Software: Crucial Packages and Hidden Heroes
Abstract
Despite the importance of scientific software for research, it is often not formally recognized and rewarded. This is especially true for foundation libraries, which are used by the software packages visible to the users, being “hidden” themselves. The funders and other organizations need to understand the complex network of computer programs that the modern research relies upon.
In this work we used CZ Software Mentions Dataset to map the dependencies of the software used in biomedical papers and find the packages critical to the software ecosystems. We propose the centrality metrics for the network of software dependencies, analyze three ecosystems (PyPi, CRAN, Bioconductor) and determine the packages with the highest centrality.
1 Introduction
Since the second half of the last century a computer became as ubiquitous a tool of a scientific lab as an alembic and burner in the previous ages. Thus computer software is now crucial to research, bringing new methods and new scale, and offering the potential for reproducibility and extension. This is true not only for the sciences, as well as scholarship more broadly (e.g., sociology and the humanities), making the software revolution both wide and deep. Yet we have very limited insight into the software actually used in science. This lack of infrastructural understanding means we are limited in our ability to reward developers and maintainers, encourage collaboration and coordination, and to direct science funding in a well-informed manner.
This problem is exacerbated by the fact that today software is a complex ecosystem with a myriad of dependencies. When a researcher uses a program, they rely on the work of the people that wrote, tested and maintained it—as well as the people that wrote, tested and maintained the packages and libraries that the program depends on, either at runtime or during the compilation phase. Thus funders who want to support and accelerate science need to find the critically important pieces, both among the user-facing programs, and those that are not known to the end users, i.e., the former’s dependencies. This fact has a number of implications including security ones (Goodin, 2024).
Scientific software is often invisible in publications, because citation practices in science have not changed at the same pace that software has become crucial. For example, software is infrequently and inconsistently formally cited (Howison and Herbsleb, 2011; Howison et al., 2015; Singh Chawla, 2016; Howison and Bullard, 2016; Knowles et al., 2021; Druskat et al., 2024). There have been recent efforts to extract the informal citations from the full text of articles (Schindler et al., 2021; Du et al., 2021; Istrate et al., 2022b, a) and to evaluate the “importance” of software packages by looking at papers that cite them (Bogart et al., 2020). Unfortunately, publications sometimes do not mention all of the software used in the course of the research.
Besides this, there is another kind of invisibility of scientific software. The programs visible to the user may rely on many other software packages (known in the software world as dependencies). While the end users may mention a package at the top of the software stack, they are likely not even aware of the packages that are further below in the stack. These may be packages that the used program depends on directly (direct dependencies), or indirectly, where the direct dependencies in turn depend on further packages. These latter packages thus become indirect, transitive dependencies of the user-facing program. All the work undertaken to develop, maintain, test, and distribute the underlying software is therefore not visible in the publication record itself, and is not included in derivatives such as citation graphs and knowledge graphs. The situation resembles the famous XKCD cartoon (Munroe, 2020), where “all modern infrastructure” critically depends on “a project some random person in Nebraska has been thanklessly maintaining since 2003”. The word “thanklessly” is important in this context: being unknown, these critical pieces of software get much less recognition and credit than they deserve—and than the science needs. There have been proposals to assign credit to these packages (Katz, 2014; Katz and Smith, 2014), but so far the problem has not yet been solved. To implement the proposed transitive credit mechanisms, software projects must start to publicize the packages they rely on in a way that enables recognition and citation, beyond the technical dependency already recorded in manifest files such as pyproject.toml, cargo.toml, pom.xml, etc. One way for projects to do this is the inclusion of citation information for their own software outputs as well as for their direct dependencies, e.g., in a citation file in the Citation File Format (Druskat et al., 2021). Were such citation information available for the complete dependency stack of a program, transitive credit could be implemented by building weighted software citation graphs (Druskat, 2020). At present the situation is quite different: sometimes even the maintainers of the down-stack software are not aware of the top stack programs that depend on their work. They need this knowledge when making breaking changes to their packages, that might negatively influence the software that depends on them (Bogart et al., 2021).
By distinguishing software packages as visible by the end users and important for other packages we follow the ideas described by Donald E. Stokes in his famous book (Stokes, 1997). In his book, Stokes distinguishes between applied research with the results visible to the general public, and the pure research, which is less visible, but important for the applied research. Following his ideas, we can put the software packages into a two dimensional plane with the axes corresponding to the frequency of software mentions and some measure of network centrality (Figure 1). The majority of the packages will occupy the lower left corner of the plot, having a fair usage both by the authors of scientific papers and the authors of the software package, who may intersect. Popular packages are used by many authors. We are interested in the “Nebraska” packages, not very visible, but of critical importance. Of course, one can think about highly visible and critical “Pasteur” packages, which are used both directly and as a foundation for other libraries.

We had a fortunate opportunity to explore these ideas due to the generosity of the Chan Zuckerberg Initiative (CZI). On 24–27 October 2023, CZI hosted a hackathon on Mapping the Impact of Research Software in Science (see https://github.com/chanzuckerberg/software-impact-hackathon-2023). One of the projects at this hackathon was Tracing the dependencies of open source software mentioned in the biomedical literature (Brown et al., 2023). In this project, we explored the dependencies of the open source software packages mentioned in CZ mentions dataset (Istrate et al., 2022b). We decided to limit the study to open source packages: first, because the dependencies of closed source packages are not public, and second, because we believe in the importance of open source for open and reproducible science. The result of this project is this paper. Here, we explore approaches to making the software package infrastructure underlying science more visible. We examine our findings to develop questions to better understand the idea of criticality and opportunity for improving science through software ecosystems.
2 Materials and Methods
2.1 Network construction
We combined two datasets: The CZI Software Mentions dataset (Istrate et al., 2022b) (which was built using a model trained on the Softcite Dataset gold standard dataset (Du et al., 2021)), and the Ecosyste.ms software dependency dataset (Nesbitt, 2023), which is built by gathering and normalizing the dependency information from three package managers, one for Python (PyPI) and two for R (CRAN and Bioconductor). The authorship data was scraped from Github metadata, for want of consistently available authoritative software authorship metadata.
The CZI Software Mentions dataset (Istrate et al., 2022b, a) identifies which mentions were traced to which ecosystem. In this way, package names from CRAN, Bioconductor and PyPi that have been parsed by the software-mentions project are collected. We used the latest release of the package at time of data collection (October 2023) along with the names of their dependencies. Those dependency names have then also been recursively fetched using the most recent release and dependencies until the full list of transitive dependencies is included. Limitations of this dependency resolution approach are discussed below.
After this data processing we produced a two-mode network, with nodes for papers and nodes for packages. Edges from papers to packages were added when a package was mentioned in the full-text of the paper. Edges between packages were added when package manager descriptions indicated a dependency (including both required and suggested dependencies, and including packaging related dependencies such as those needed for development, as well as testing and building documentation). The full code for the processing is available at (Brown et al., 2023). The network is available at (Brown, 2023) in GEXF format (GEXF Working Group, 2009). It has four classes of nodes:
- paper:
- pypi, cran, bioconductor:
The edges are directed and weighted. An edge from a paper node to a software node means that the given software is mentioned in the paper, the weight corresponds to the number of citation the paper received. An edge from software node to software node means that software depends on software as determined by the corresponding package manager.
2.2 Network analysis
To analyze the network, we relied on directed centrality analysis (Borgatti and Everett, 2021). There are several possible options for centrality measure. Our choice was determined by the following considerations. First, we wanted a centrality metric that accounts for papers even though in they have no incoming edges in our network (in other words papers do not receive centrality but should contribute to the centrality of software packages). This criterion excludes eigenvector centrality. Second, we wanted a centrality metric that accounts for the weight of edges from papers to software packages (i.e., some papers contribute more centrality through their citation counts). This criterion excludes the PageRank algorithm which normalizes weights of out-degree. We found that Katz centrality satisfies these criteria. This approach gives us a free parameter to control the importance of papers (which we set equal to 1) such that paper nodes contribute a factor proportional to times their citation count to the software packages they mention. In turn, these software packages contribute a factor proportional to their own centrality to their dependencies. A package can therefore be central by receiving mentions from well-cited papers, by having central dependents, or by a combination of both.
 (a)
(a)
 (b)
(b)
3 Results
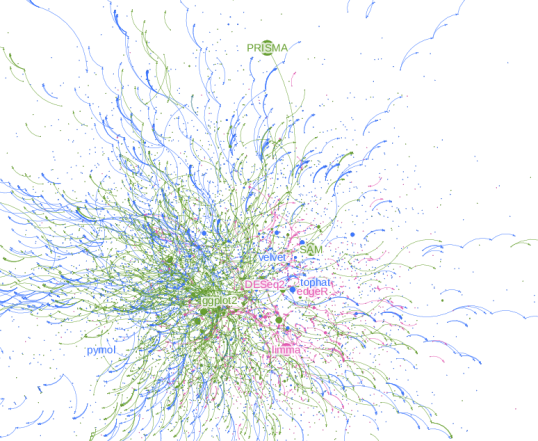
In Figure 2, we show the overall network of software packages connected through their dependencies within their ecosystem and interconnected through the papers that mention them. Edges from papers to software packages are directed and weighted by the number of citations the paper received. Edges between software dependencies are directed from a dependent to a dependency.
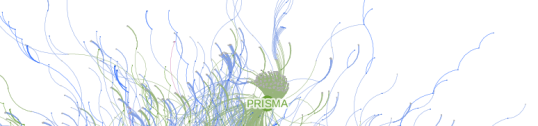
We found a dense core of popular packages that receive many mentions (e.g. ggplot2 in CRAN, tophat in PyPI and limma in Bioconductor), some of which have many dependencies themselves (e.g. ggplot2). We also found less central packages mentioned heavily by specific communities (e.g. PRISMA in CRAN or pymol in PyPI).
Analyzing the entire ecosystems of software dependency, we found that roughly 10% of software packages are part of dependency loops (i.e., cycles in the dependency networks). Interestingly, we found no cycles whatsoever in the connected component of networks that have received software mentions, and their dependencies. We discuss this finding below.
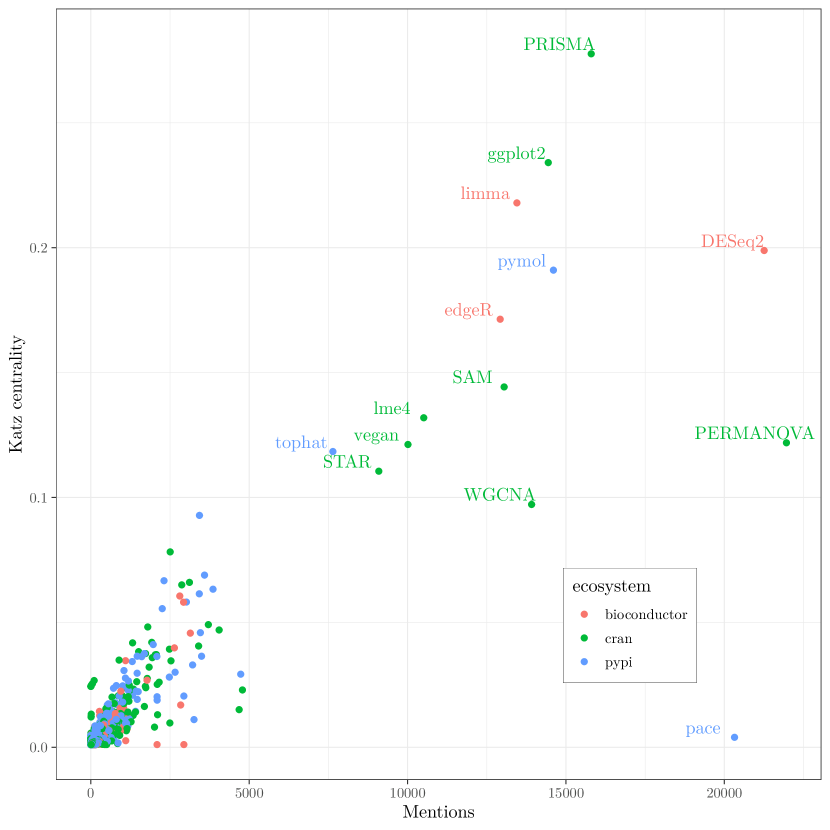
In Figure 3 we show the distribution of packages from the three investigated ecosystems over Katz centrality and mention counts. We found a dense cluster of packages with low Katz centrality and low mentions counts, i.e., the “Majority” quadrant (see Figure 1).
4 Discussion
The absence of cycles in the network of software packages used in science is quite interesting. It suggests a more robust design structure in the universe of scientific software than in the general software world. The lack of cycles also improves our analysis with Katz centrality as it excludes feedback mechanisms that can artificially inflate the centrality of packages on a loop. Packages with low mentions and high Katz centrality are therefore even more critical as they represent essential dependencies of packages that enable large volumes of research without receiving direct attention. These are exactly the “Nebraskan” packages referenced by Munroe (2020) that we set out to find. Figure 3 seems to show one clear example of such a package: velvet, a PyPI package with a mention count of , but a Katz centrality of .
Generally, the results verify our intuition that the majority of software packages will have a low Katz centrality and relatively few mentions.
Our paper tries to quantify impact as importance, and put some numbers behind the intuition. Of course this is by itself a perilous process: there could be various flavors of both impact and importance, and people may reasonably disagree about the details. Our contribution is to propose a certain quantification, which agrees with our intuitive understanding.
Besides the possible problems with the exact definition of importance, our work has a number of limitations:
-
1.
The network analysis is limited by the quality of disambiguation and linking in the CZI Mentions Dataset (see the discussion in (Istrate et al., 2022a)). Homonyms (different software packages with the same or close names) may change the network statistics, and preliminary research points to considerable potential for incorrect linking in the CZI Software Mentions dataset due to homonyms (Druskat et al., 2024). Notably, this affects the above-mentioned “Nebraskan” package velvet, which is linked to a Python package of the same name that provides signal processing and communications algorithms in Python (available on PyPI111https://pypi.org/project/velvet/). Meanwhile, all of the mentions of “velvet” point to different versions of algorithms for de novo short read assembly using de Bruijn graphs in genomics, described in (Zerbino and Birney, 2008) and implemented mostly in C (Zerbino et al., 2014). Sometimes an open source package shares a name with a proprietary software (e. g. PRISM, PACE), which leads to confusion and incorrect usage counts.
-
2.
Our approach is limited to the open source package included into one of the chosen package managers. This excludes proprietary software like Excel or GraphPad Prism, and open source non-packaged software like Gephi (Bastian et al., 2009). The number of missing packages may be estimated from Table 14 of (Istrate et al., 2022a) which gives the coverage linking coverage by GitHub at 64.39%, the coverage by CRAN at 8.36%, the coverage by PyPI at 5.86%, and the coverage by Bioconductor at 3.23%. GitHub coverage can be used as a proxy for the share of the open source software: while some packages are not hosted by GitHub, their fraction is anecdotally low. If we assume that each package exists only in one ecosystem (there are packages present in several, but we neglect this effect), the combined coverage by CRAN, PyPI, and Bioconductor is 17.45%, i.e. between the quarter and third of the open source packages. It is very likely that each of these non-package pieces of software do depend on packages in our focus ecosystems. For open source non-package software it may be feasible to identify source repository URLs and then to identify packages depended on by the software. That would need to be done by directly inspecting the source code, possibly using SBOM tools. OTOH, some non-package software do not have source code available (including proprietary GUI software such as SPSS, and cloud-based services); nonetheless these pieces of code may very well be based on packages in our focal ecosystem (especially those that use non-restrictive licenses such as BSD, MIT). In the long term there is a possibility that the requirement to provide SBOMs for federal government purchasers will give insight into the packages on which proprietary software relies.
-
3.
In our version of the dependency chart we always used the latest version of any package. In reality dependencies change between the versions. A study of development logs often reveals messages like “deleted the dependence on XYZ” or “added the dependence on ABC”. These changes often make the work of package management software very difficult. A software dependencies graph is a living network, constantly evolving, with links added and deleted. In this study we effectively collapse the time, making an (imperfect) snapshot of the long movie.
A future improvement would be to use each package ecosystem’s specific dependency resolution algorithm to compute the full transitive dependency tree for each mentioned software package. An even further extension would be to attempt to do this for the version of the package most likely used by a specific publication, based on aligning publication date with the current version used at that time.
-
4.
Our method captures the off the shelf software packages used for the papers. It does not capture ad hoc software written specifically for the given paper, which may be contained in the code accompanying the papers. This code may load software libraries, and thus add software dependencies absent in our graph.
-
5.
The dependencies reflected in the the package managers do not necessarily reflect the actual usage of the software. A library may be loaded, but not used for the actual execution path used in the given paper. A more reliable method would be to reproduce the analysis done in each paper and capture the actual library calls—which is probably prohibitively difficult for the number of papers covered.
-
6.
Many Python and R packages ultimately depend on libraries outside their ecosystems (most often C and Fortran libraries). These dependencies are not easily captured by the package management software, and thus are outside of our analysis.
-
7.
Our dependencies graph does not include the concept of alternatives, when package depends on the functionality that can be provided either by package , or package . Some package managers like Debian apt have the possibility of specifying alternatives, but this is not a common feature of package managers.
-
8.
Different communities place different emphasis in such elements of the infrastructure as tests. This may lead to the over-representation of testing infrastructure packages in some cases, for example in Python ecosystem. We do not try to attempt to decide which elements of the infrastructure are “actually important”, instead relying on the judgment of the community of users and developers—while recognizing that such judgment may be different across the landscape.
-
9.
There are several different Python package managers with greatly overlapping dependency graphs. We used PyPI for this study. Some competitors like pip and Vonda are also worth investigating.
5 Conclusions and future work
In this work we investigated the network of software packages used in the biomedical papers. We demonstrated that these packages follow the structure of “Stokes’ diagram” (famous for ”Pasteur’s quadrant”) with some packages highly visible to the end users, and some packages less visible, but important in the network due to their dependencies. We discussed the use of Katz centrality in discovering the important packages and found examples of such package in the biomedical field. We also discovered that the structure of the network of the software packages used in biomedical science is different from the structure of generic software packages: the absence of dependence loops may indicate a more robust, or intentional, design.
These findings and insights can be used in funding and development of the open source scientific software.
Of course there are many ways to extend this work. It would be interesting analyze common workflows for different disciplines, perhaps using co-occurrences of mentions, and map them into the dependence graph. This might help to discover packages important for specific sub-fields of biomedical sciences. Adding temporal dependencies to our graph my help to discover and predict the development trends.
Acknowledgments
The authors are grateful for Chan Zuckerberg Initiative for making this research possible and for sponsoring the Mapping the Impact of Research Software in Science hackathon.
References
- Bastian et al. (2009) Mathieu Bastian, Sebastien Heymann, and Mathieu Jacomy. Gephi: An open source software for exploring and manipulating networks. In International AAAI Conference on Weblogs and Social Media. AAAI, 2009. URL http://www.aaai.org/ocs/index.php/ICWSM/09/paper/view/154.
- Bogart et al. (2021) Chris Bogart, Christian Kästner, James Herbsleb, and Ferdian Thung. When and how to make breaking changes: Policies and practices in 18 open source software ecosystems. ACM Trans. Softw. Eng. Methodol., 30(4), jul 2021. ISSN 1049-331X. doi:10.1145/3447245. URL https://doi.org/10.1145/3447245.
- Bogart et al. (2020) Christopher Bogart, James Howison, and James Herbsleb. Guiding development work across a software ecosystem by visualizing usage data. arXiv e-prints, art. arXiv:2012.05987, December 2020. doi:10.48550/arXiv.2012.05987.
- Borgatti and Everett (2021) Stephen P. Borgatti and Martin G. Everett. Three perspectives on centrality. In Ryan Light and James Moody, editors, The Oxford Handbook of Social Networks, page 334–351. Oxford University Press, January 2021. ISBN 9780190251765. doi:10.1093/oxfordhb/9780190251765.013.22.
- Brown (2023) Eva Maxfield Brown. A Dependency Graph for 460,000 Papers and Their Software Mentions from the CZI Software Mentions Dataset, October 2023. URL https://doi.org/10.5281/zenodo.10048132.
- Brown et al. (2023) Eva Maxfield Brown, Andrew Nesbitt, Laurent Hébert-Dufresne, Boris Veytsman, João Felipe Pimentel, Stephan Druskat, Daniel Mietchen, and James Howison. Exploring the dependencies of the CZI mentions dataset, October 2023. URL https://github.com/borisveytsman/SoftwareImpactHackathon2023_Tracing_dependencies.
- Druskat (2020) Stephan Druskat. Software and dependencies in research citation graphs. Computing in Science & Engineering, 22(2):8–21, 2020. doi:10.1109/MCSE.2019.2952840.
- Druskat et al. (2021) Stephan Druskat, Jurriaan H. Spaaks, Neil Chue Hong, Robert Haines, James Baker, Spencer Bliven, Egon Willighagen, David Pérez-Suárez, and Alexander Konovalov. Citation File Format, August 2021. URL https://doi.org/10.5281/zenodo.5171937.
- Druskat et al. (2024) Stephan Druskat, Neil P. Chue Hong, Sammie Buzzard, Olexandr Konovalov, and Patrick Kornek. Don’t mention it: An approach to assess challenges to using software mentions for citation and discoverability research. arXiv, 2024(arXiv:2402.14602), February 2024. doi:10.48550/arXiv.2402.14602.
- Du et al. (2021) Caifan Du, Johanna Cohoon, Patrice Lopez, and James Howison. SoftCite dataset: A dataset of software mentions in biomedical and economic research publications. JASIST, 72(7):870–884, 2021. doi:10.1002/asi.24454. URL https://asistdl.onlinelibrary.wiley.com/doi/abs/10.1002/asi.24454.
- GEXF Working Group (2009) GEXF Working Group. GEXF file format, 2009. URL https://gexf.net/.
- Goodin (2024) Dan Goodin. What we know about the xz utils backdoor that almost infected the world. Ars Technica, March 2024. URL https://arstechnica.com/security/2024/04/what-we-know-about-the-xz-utils-backdoor-that-almost-infected-the-world/.
- Howison and Bullard (2016) James Howison and Julia Bullard. Software in the scientific literature: Problems with seeing, finding, and using software mentioned in the biology literature. JASIST, 67(9):2137–2155, 2016. doi:10.1002/asi.23538. URL https://asistdl.onlinelibrary.wiley.com/doi/abs/10.1002/asi.23538.
- Howison and Herbsleb (2011) James Howison and James D. Herbsleb. Scientific software production: Incentives and collaboration. In Proceedings of the ACM 2011 Conference on Computer Supported Cooperative Work, CSCW ’11, page 513–522, New York, NY, USA, 2011. Association for Computing Machinery. ISBN 9781450305563. doi:10.1145/1958824.1958904. URL https://doi.org/10.1145/1958824.1958904.
- Howison et al. (2015) James Howison, Ewa Deelman, Michael J. McLennan, Rafael Ferreira da Silva, and James D. Herbsleb. Understanding the scientific software ecosystem and its impact: Current and future measures. Research Evaluation, 24(4):454–470, 07 2015. ISSN 0958-2029. doi:10.1093/reseval/rvv014. URL https://doi.org/10.1093/reseval/rvv014.
- Istrate et al. (2022a) Ana-Maria Istrate, Donghui Li, Dario Taraborelli, Michaela Torkar, Boris Veytsman, and Ivana Williams. A large dataset of software mentions in the biomedical literature. arXiv, 2022a. doi:10.48550/ARXIV.2209.00693. URL https://arxiv.org/abs/2209.00693.
- Istrate et al. (2022b) Ana-Maria Istrate, Boris Veytsman, Donghui Li, Dario Taraborelli, Michaela Torkar, and Ivana Williams. CZ Software Mentions: A large dataset of software mentions in the biomedical literature, September 2022b. URL https://datadryad.org/stash/dataset/doi:10.5061/dryad.6wwpzgn2c.
- Katz (2014) Daniel S. Katz. Transitive credit as a means to address social and technological concerns stemming from citation and attribution of digital products. Journal of Open Research Software, July 2014. doi:10.5334/jors.be.
- Katz and Smith (2014) Daniel S. Katz and Arfon M. Smith. Implementing transitive credit with JSON-LD. arXiv, 2014. doi:10.48550/arXiv.1407.5117. URL https://arxiv.org/abs/1407.5117.
- Knowles et al. (2021) Rebecca Knowles, Bilal A. Mateen, and Yo Yehudi. We need to talk about the lack of investment in digital research infrastructure. Nature Computational Science, 1(3):169–171, Mar 2021. ISSN 2662-8457. doi:10.1038/s43588-021-00048-5. URL https://doi.org/10.1038/s43588-021-00048-5.
- Munroe (2020) Randall Patrick Munroe. Dependency, August 2020. URL https://xkcd.com/2347/.
- Nesbitt (2023) Andrew Nesbitt. Package and dependency metadata for CZI hackathon: Mapping the impact of research software in science. Zenodo, October 2023.
- Priem et al. (2022) Jason Priem, Heather Piwowar, and Richard Orr. OpenAlex: a fully-open index of scholarly works, authors, venues, institutions, and concepts. arXiv e-prints, art. arXiv:2205.01833, May 2022. doi:10.48550/arXiv.2205.01833.
- Schindler et al. (2021) David Schindler, Felix Bensmann, Stefan Dietze, and Frank Krüger. SoMeSci—a 5 star open data gold standard knowledge graph of software mentions in scientific articles. In Proceedings of the 30th ACM International Conference on Information & Knowledge Management, page 4574–4583, New York, NY, USA, 2021. Association for Computing Machinery. ISBN 9781450384469. URL https://doi.org/10.1145/3459637.3482017.
- Singh Chawla (2016) Dalmeet Singh Chawla. The unsung heroes of scientific software. Nature, 529(7584):115–116, Jan 2016. ISSN 1476-4687. doi:10.1038/529115a.
- Stokes (1997) Donald E. Stokes. Pasteur’s Quadrant: Basic Science and Technological Innovation. Brookings Institute Press, Washington, D. C., 1997. ISBN 978-0815781776.
- Zerbino and Birney (2008) Daniel R. Zerbino and Ewan Birney. Velvet: Algorithms for de novo short read assembly using de Bruijn graphs. Genome Research, 18(5):821–829, May 2008. ISSN 1088-9051. doi:10.1101/gr.074492.107.
- Zerbino et al. (2014) Daniel R. Zerbino, Sylvain Foret, John-Mark Gurney, Guy Slater, Ewan Birney, John Marshall, and Velvet authors. Velvet [Software]. Software Heritage, 2014. URL https://archive.softwareheritage.org/swh:1:rev:9adf09f7ded7fedaf6b0e5e4edf9f46602e263d3.