CausalBench: A Comprehensive Benchmark for Causal Learning Capability of Large Language Models
Abstract
Causality reveals fundamental principles behind data distributions in real-world scenarios, and the capability of large language models (LLMs) to understand causality directly impacts their efficacy across explaining outputs, adapting to new evidence, and generating counterfactuals. With the proliferation of LLMs, the evaluation of this capacity is increasingly garnering attention. However, the absence of a comprehensive benchmark has rendered existing evaluation studies being straightforward, undiversified, and homogeneous. To address these challenges, this paper proposes a comprehensive benchmark, namely CausalBench, to evaluate the causality understanding capabilities of LLMs. Originating from the causal research community, CausalBench encompasses three causal learning-related tasks, which facilitate a convenient comparison of LLMs’ performance with classic causal learning algorithms. Meanwhile, causal networks of varying scales and densities are integrated in CausalBench, to explore the upper limits of LLMs’ capabilities across task scenarios of varying difficulty. Notably, background knowledge and structured data are also incorporated into CausalBench to thoroughly unlock the underlying potential of LLMs for long-text comprehension and prior information utilization. Based on CausalBench, this paper evaluates nineteen leading LLMs and unveils insightful conclusions in diverse aspects. Firstly, we present the strengths and weaknesses of LLMs and quantitatively explore the upper limits of their capabilities across various scenarios. Meanwhile, we further discern the adaptability and abilities of LLMs to specific structural networks and complex chain of thought structures. Moreover, this paper quantitatively presents the differences across diverse information sources and uncovers the gap between LLMs’ capabilities in causal understanding within textual contexts and numerical domains.
Index Terms:
Large language models, causal learning, causality, benchmark, correlation, causal structureI Introduction
Recently, large language models (LLMs) have garnered significant interest in both academic and industry [1, 2]. These LLMs have shown exceptional performance, leading to the belief that they could approach artificial general intelligence in the current era. Unlike previous models limited to specific tasks, LLMs are capable of handling a wide range of tasks. Their effectiveness in various applications, from general natural language tasks to domain-specific challenges, has led to growing adoption by users with crucial information needs.
Impressively, LLMs have shown remarkable capabilities when asked to explain their outputs, update their conclusions in light of new evidence, and even generate counterfactuals [3, 4, 5]. These LLMs are capable of generating responses that appear plausible, indicating their ability to implicitly and explicitly consider causal factors. In fact, the comprehension of causality is vital for LLMs, as it underpins their ability to process language and make logical inferences accurately. This understanding not only enhances the performance of LLMs in complex tasks but also ensures the coherence and logical consistency of the outputs [6, 7]. Thus, LLMs with great ability of causal understanding could transform them from tools that merely predict or describe to ones that understand and explain, thereby bridging the gap between AI and genuine understanding, which is essential for the future of AI in complex and real-world applications. However, LLMs are not without their imperfections, and they have been known to make absurd claims and frequently commit basic errors in logic and mathematics, let alone engage in complex reasoning [8]. This reality has ignited a debate regarding the extent of LLMs’ capabilities in causal reasoning. Critics question whether these models genuinely understand and process causal relationships or if they are merely echoing memorized information [9, 10].
Considering the fundamental importance of understanding causality for LLMs, the task of evaluating their ability to discern causal relationships is crucial. Recent scholarly efforts have turned towards this issue, attempting to dissect and understand the capabilities of LLMs in the realm of causal learning. However, a significant challenge is the absence of comprehensive evaluation benchmarks. Although some basic evaluations [11, 12, 13, 14, 15, 16, 17, 18, 19, 20, 21, 22], as shown in Table I, have been conducted to evaluate the capabilities of causal learning for LLMs, these evaluation studies are either narrow-scale or straightforward, constrained by undiversified causal structures and homogeneous evaluative tasks. Specifically,
| Evaluation Framework | No. of Nodes | Prompt format | No. of Candidate LLMs |
| [11] | 210 | Variable name | 1 |
| [12] | 837 | Variable name | 2 |
| [13] | 34 | Variable name | 1 |
| [14] | 540 | Variable name | 2 |
| [15] | NA | Variable name | 2 |
| [16] | 220 | Variable name | 2 |
| [17] | 210 | Variable name | 4 |
| [18] | 26 | Variable name | 3 series (9 LLMs) |
| [19] | 210 | Variable name | 3 |
| [20] | 11 | Variable name | 1 |
| [21] | 820 | Variable name | 1 |
| [22] | 220 | Variable name | 1 |
| CausalBench | 2109 | Variable name | |
| Variable name + Structured data | 6 series | ||
| Variable name + Background knowledge | (19 LLMs) | ||
| Variable name + Background knowledge + Structured data |
-
1.
The causal learning datasets utilized in existing evaluation works either originate from private datasets or only comprise a few numbers of nodes, as shown in the second column in Table I, making it difficult to comprehensively evaluate the causality identification capabilities of LLMs. Meanwhile, the scale of datasets (i.e., the number of nodes) used in existing evaluation works is far from reaching the upper limitation of causal learning capabilities of LLMs.
-
2.
The evaluated tasks lack diversity, where the vast majority only aim at utilizing LLMs to identify the pairwise causal relationship [16, 17, 18]. This narrow evaluation perspective can only reflect the capabilities of LLMs to understand basic causal relationships and fails to demonstrate their ability to grasp causal relationships at different scales and difficulties, such as simpler correlations and more complex large-scale causal structures.
-
3.
The prompts used in existing evaluations lack rich semantic information, typically only containing variable names (as shown in the third column in Table I), which fails to fully leverage the prior knowledge and long-text comprehension capabilities of LLMs [19, 20, 22]. As Tang et al. point out in [15], a comprehensive evaluation should demonstrate the LLM’s ability to understand causal relationships with different formats of information.
-
4.
In the majority of current evaluative studies, the diversity of LLMs examined is limited, with a predominant focus on GPT series LLMs while neglecting other advanced LLM genres (as shown in the fourth column in Table I), which limited range potentially undermines the generalizability of the assessments.
To overcome these deficiencies, we create a comprehensive benchmark named CausalBench to evaluate the capacity of causality identification for LLMs, as shown in Fig. 1, which possesses at least four benefits as follows:
-
•
Diverse datasets from the causal learning community: CausalBench is an extension of the causal learning research community’s efforts, designed to offer a robust evaluation framework. It incorporates 15 commonly used real-world causal learning datasets of diverse sizes, enabling comprehensive comparisons with the classic causal learning algorithms. This foundation enables us to leverage existing research to rigorously and quantitatively measure an LLM’s causal learning capacity with the extensive evaluation results in the causal research community as a reference.
-
•
Evaluation tasks for understanding causal relationships of varying depths and difficulties: CausalBench contains three core evaluation tasks: to identify correlation, causal skeleton, and causality, respectively. Based on the different depths and difficulties of the evaluation tasks, CausalBench is capable of holistically assessing the capabilities of existing LLMs. Furthermore, CausalBench includes additional evaluation tasks to delve into the reasoning abilities of LLMs for causal learning.
-
•
Diverse information prompts to fully exploit the abilities of LLMs: CausalBench encompasses four distinct prompt formats, which include one or more elements of variable names, background knowledge, and structured data. Based on different prompt formats, CausalBench aims to fully exploit the prior information and long-text comprehension abilities of LLMs in understanding causal relationships, to demonstrate the upper limitations of LLMs’ capabilities with varying amounts of information and to showcase the differences in the capacities of LLMs when processing between text and data information.
-
•
Demonstration of the upper limitations of LLM capabilities across various scales and complexities: CausalBench evaluates causal relationships of varying scale and complexity. Specifically, CausalBench covers causal discovery datasets of various scales, ranging from 5 to 109 nodes, far exceeding what current evaluation works have explored. Meanwhile, CausalBench evaluates various types of causal structures and discusses different metrics. By CausalBench, we aim to evaluate the upper limit of each LLM’s capability to identify causality.
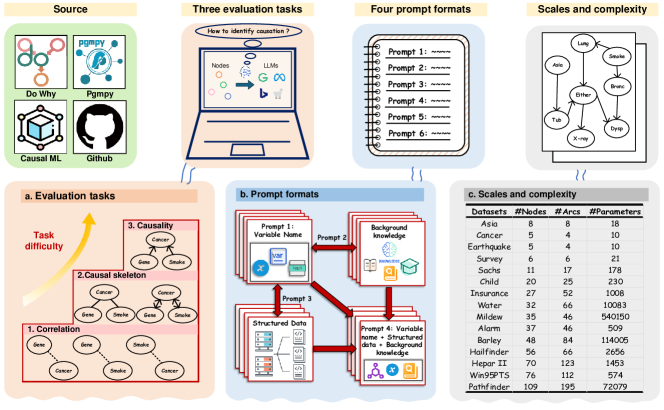
In order to construct CausalBench, we first collect the commonly-used real-world datasets for the causal learning community, as shown in Fig. 1-C. Then, we convert these datasets into four prompt formats, namely solely variable names, variable names combined with background knowledge, variable names combined with structured data, and variable names combined with background knowledge and structured data. After that, to gain deeper insights into the overall causal understanding capabilities of LLMs, we evaluate three closed-source LLMs, GPT3.5-Turbo, GPT4, and GPT4-Turbo, along with five open-source models: BERT series [23], LLAMA series [24] (i.e., 7B, 13B and 33B), OPT series [25] (i.e., 1.6B, 2.7B, 6.7B and 66B), Falcon series [26] (i.e., 7B and 40B), and InternLM series [27] (i.e., 7B and 20B), in zero-shot scenarios. The main evaluation tasks include identifying correlation, causal skeleton, and causality, respectively. Our empirical study reveals that:
-
1.
Overall, LLMs for causal learning fall short of human performance. Closed-source LLMs significantly surpass open-source ones but still fall short of the current performance of the classic and state-of-the-art (SOTA) causal learning methods (Section V-D). Specifically, the best-performing LLMs approach the performance of traditional causal methods on small scale datasets but are inferior to SOTA methods. Additionally, CausalBench demonstrates the difference of LLMs among various evaluation tasks. The evaluation task to identify correlation (Section III-C) and causality (Section III-E) are significantly more challenging than causal skeleton (Section III-D), which means LLMs are better at understanding causal learning rather than prior knowledge.
-
2.
From the perspective of causal networks, LLMs exhibit varying performances across different depths and difficulties. As the scales of the causal learning dataset increases, both the F1 score and the accuracy of LLMs decrease (Section III-E). Regarding the identification of different structures (Section III-E), current LLMs are more proficient at recognizing chain structures but struggle with collider structures. As for the complexity of the causal learning datasets, including network sparsity and in- and out-degree (Section V-C), the accuracy of LLMs in identifying causality structures correlates with the in-degree and out-degree of the derived directed acyclic graph (DAG). Furthermore, LLMs capable of effectively completing chain of thought (CoT) evaluation tasks (Section III-F).
-
3.
Background knowledge has a clear impact on LLM’s causality identification performance but is not always helpful in large sacle datasets (Section IV-A and IV-C). While background knowledge consistently boosts the causal learning performance of clear and easy-understanding variable names, the feedback information is unhelpful for unclear variable names. Meanwhile, structured data has a clear impact on LLM’s causality identification performance (Section IV-B and IV-C). However, only the latest closed-source LLMs can achieve it due to the capacity of identify data (Section V-B). Additionally, different sentence patterns and different meanings of variable names also affect the performance of identification causality for LLMs (Section V-A).
The paper is structured as follows: Section II introduces the construction of the benchmark. The evaluation results of different evaluation tasks and prompt formats are provided in Section III and Section IV, respectively. After that, Section V presents the analysis of the evaluation. Finally, Section VI concludes the paper and discusses the future direction. More details of related works are provided in Appendix I.
II Benchmark Construction
In this section, we first compare CausalBench with existing evaluations from data, task and prompt views and illustrate the superiority of CausalBench. Then, we introduce the detailed construction process of CausalBench from the three views. Specifically, we collect and construct datasets from the causal discovery community in the data view. After that, we provide three core evaluation tasks: identifying correlation, causal skeleton, and causality from the task view. Finally, different prompt formats are elaborated from the prompt view, which are different combinations of variable names, background knowledge and structured data.
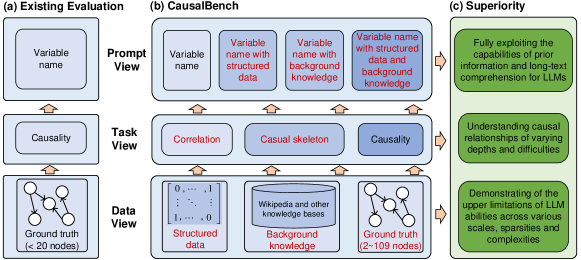
II-A CausalBench v.s. Existing Evaluation
In this section, we first elucidate the comparison between CausalBench and existing evaluation efforts. Fig. 2 juxtaposes CausalBench with these evaluations from three perspectives: Data view, Task view, and Prompt view. Part (a) of the figure delineates the three aspects of existing evaluations, namely covering ground truths (i.e., causal learning datasets) with no more than 20 nodes, focusing solely on tasks related to causality assessment, and directly employing Variable names as inputs for task evaluation prompts. In contrast, CausalBench, as depicted in part (b), incorporates structured data, background knowledge, and a wide range of ground truths in its data view—these range from datasets with 2 to 109 nodes from the causal inference community. This integration enables a comprehensive evaluation of the upper limitations of LLMs across various scales, sparsities, and complexities. Additionally, from the task view, CausalBench establishes three core evaluation tasks: correlation, Causal skeleton, and Causality, aiming to thoroughly explore the capabilities of LLMs in understanding causal relationships at different depths and difficulties. Lastly, regarding the Prompt view, aside from the conventional input format based on variable names, CausalBench introduces three additional prompt formats: variable names with structured data (commonly used in classical causal learning), with background knowledge, and both, which can fully exploit the capabilities of prior information and long-text comprehension for LLMs. Subsequently, we will detail the construction process of CausalBench from the perspectives of data, evaluation tasks, and prompt formats.
II-B Data View
As shown in Fig. 1-C, 15 commonly-used real-world datasets from the causal discovery community [28] are included in CausalBench.
According to the evaluation conclusions of this paper, the upper limit of LLMs’ ability to recognize causal structures is approximately 50 nodes 111Relevant conclusions are provided in Section VI. Therefore, CausalBench includes datasets of various sizes ranging from 2 to 109 nodes. Based on the performance of LLMs in the evaluation tasks for the different scales of nodes, we categorize them into small, medium, large, and very large scales. These include small scale (2-15 nodes): Asia, Cancer, Earthquake, Survey and Sachs; medium scale (15-50 nodes): Child, Insurance, Water, Mildew, Alarm and Barley; large scale(50-100 nodes): Hailfinder, Hepar II and Win95PTS; and one very large datasets (100 nodes): Pathfinder. In each datasets, three sample sizes of structured data are set to generate the sample data. Then we can use this sample data to verify the robustness and efficiency of causality identification for current LLMs.
II-C Task View
In order to assess the capability of LLMs for understanding causal relationships of various depths and complexities, we establish three core evaluation tasks within CausalBench: to identify correlation, causal skeleton, and causality, respectively. Specifically, CausalBench commences with an analysis of the correlations between variables, followed by the derivation of a fully connected undirected graph, i.e., the causal skeleton, based on correlations. Subsequently, an analysis of causal relationships within the causal skeleton is conducted, and the direction of other edges is iteratively examined until the entire causal graph aligns with all statistical correlations. Then, we illustrate the details of the main evaluation tasks: to identify correlation, causal skeleton and causality as follows.
II-C1 Correlation
Correlation is a statistical measure expressing the extent to which two or more variables fluctuate together. A positive correlation indicates that as one variable increases, the other variable tends to increase, whereas a negative correlation suggests that as one variable increases, the other tends to decrease [29]. Conversely, causality implies a cause-and-effect relationship between variables, where changes in one variable directly result in changes in another [30]. Thus, causality implies correlation, but correlation does not necessarily imply causality [31]. Correlation is a prerequisite for causation, and exploratory data analysis often begins with identifying correlations between variables, which can lead to hypotheses about causal mechanisms. In this paper, the standard answers for correlations in CausalBench are derived from the causal diagrams of the corresponding datasets. According to the theory of d-separation, if the correlation between two variables can be recognized from the causal graph, then they are considered to be correlated. In this paper, we consider direct correlation as a direct correlational factor between a pair of variables and indirect correlation as a correlation recognized from the causal graph. Thus, the evaluation task about correlation involves the identification of direct correlation and indirect correlation.
II-C2 Causal Skeleton
Causal skeleton refers to an undirected graph derived from a DAG by disregarding the directions of the edges. This skeleton encompasses all the variables and their connections within the graph, but it does not include information about the directionality of these connections. The purpose of the causal skeleton is to identify which variables are potentially causally related, while the specific directions of causality are to be determined by the following evaluation task. In previous studies, causal discovery methods based on conditional independence often utilize statistical tests to identify conditional independence and dependence among variables and then construct the causal skeleton based on the obtained information about conditional independence. Thus, CausalBenchmark aims to identify the interconnectedness of the variables and construct a causal skeleton by evaluating the conditional independence and dependence among pairs of variables. Precisely, the definition for conditional independence and dependence are provided as follows [31, 32]. For any variable or variable set , , and , is used as a condition set. If the probability distribution satisfies , then the variables or variable sets and are conditionally independent, denoted as . In contrast, indicates that is related to under the condition set . In the task of evaluating causal skeletons, the primary focus is on testing the causal reasoning capabilities of LLMs.
II-C3 Causality
According to the obtained causal skeleton, we subsequently utilize LLMs to determine the causal directions between pairs of variables in the undirected graph. This aims to assess the capacity of LLMs to identify causal relationships, leveraging their extensive prior knowledge. In this paper, we provide two methods to evaluate causality identification. The first method is to identify the direction through LLMs for the causal skeleton. The second method is to employ the d-separation method to derive six different descriptive characteristics of causal relationships. These encompass two types of direct causal relationships, parental and child relationships, and four types of indirect causal relationships: ancestral, descendant, those with a collider structure, and those with a confounder structure. Finally, we discover the causality based on these characteristics.
II-C4 Chain of Thought
To further evaluate the ability of LLMs to utilize their causal reasoning for identifying causal discovery datasets, we have added an additional experiment named chain-of-thought prompting for assessment, inspired by [17, 33]. Unlike human cognition, LLMs significantly depend on elaborate prompt engineering to grasp task descriptions accurately. Innovative approaches like the chain of thoughts and tree of thoughts prime the model with a structured answering format that sequentially addresses the components of the task, thereby enhancing LLMs’ precision and consistency in task resolution. This study introduces further experimentation with the chain of thoughts prompting technique on datasets.
II-D Prompt View
The prompts employed in the current studies are semantically few and are often limited to mere variable names. Such simple prompts do not fully harness the potential of the substantial capabilities in both long-text comprehension and the integration of prior knowledge for LLMs. In this paper, CausalBench incorporates four prompt formats: the combination of variable names, background knowledge, and structured data. These prompt formats serves to delineate the upper bounds of LLM performance across different information scopes and illustrate the variation in LLM efficiency when parsing textual versus data-centric information. To this end, we introduce detailed information on the four prompt formats.
II-D1 Variable Name
For existing LLMs, the design of prompts significantly impacts their performance. As shown in the third column of Table I, the prompt format of variable name is the most prevalent in existing works, which is derived from real-world causal networks. In this paper, we design six prompt templates for different evaluation tasks based on practical evaluation experiences and integrate the advantages of prompts from previous evaluation studies for LLMs [18, 17, 34], which are provided in Appendix III. Additionally, for different prompt formats, we design five different prompts, which are presented in Appendix IV. The impact of these prompts will be carefully considered in Section V-A.
Additionally, we introduce an alternative mode called modified variable names, which aims to enhance the understanding of LLMs regarding the real-world implications of variable names. For example, in Asia dataset, an original variable name is Asia, which literally refers to the continent of Asia. LLMs might interpret this in terms of geographical and climatic aspects of Asia, leading to an inference that there is no correlation or causality between Asia and other variables, such as Lung cancer. However, Asia in the dataset actually signifies the event Visiting to Asia. Given the prevalence of respiratory diseases in many Asian countries, the event Visiting to Asia could likely lead to respiratory diseases, subsequently causing lung cancer. This suggests a potential correlation and causality between Asia and Lung cancer. Therefore, we consider both the variable names and modified variable names to explore the disparities in the causal understanding capabilities of LLMs.
II-D2 Variable Name and Background Knowledge
In previous research on causal learning for LLMs, the prompt format was solely based on variable names. In reality, for LLMs, this involves searching across various domains associated with the variable names and then making corresponding interpretations of these variables within the context of the relevant dataset. This poses a challenge for zero-shot scenarios in LLMs. According to [17], each variable involves some meta-knowledge. Guiding LLMs to understand variable names specific to a particular domain from all potential domains covered by the meta-knowledge is a challenge. [35] posit that incorporating background knowledge and specific knowledge of the related domain into prompts can enhance the LLMs’ understanding of relevant names. Therefore, in this paper, we introduce an assessment task involving variable names and related background knowledge to test whether LLMs can enhance their causal understanding capabilities by incorporating additional knowledge in zero-shot scenarios.
II-D3 Variable Name and Structure Data
Existing causal learning methods typically use prompt formats ranging from 500 to 3000 dimensions of structured data. For instance, Alarm dataset, comprising 37 variables, requires a 37500 matrix as input, clearly indicating structured data. However, current LLM-based causal discovery evaluation methods are based on textual contexts, differing from classic causal discovery algorithms. This discrepancy prevents direct comparison between LLM-based and classical causal learning methods, which significantly limits the application of LLMs in causal understanding and reduces the feasibility of using LLMs for causal identification tasks. To this end, we design the prompt format as high-dimensional matrices of structured data to test the performance of LLMs with structured data. It is noteworthy that this is the first work in causal learning that directly uses structured data as a prompt format to evaluate causal understanding capabilities for LLMs.
II-D4 Variable Name, Structure Data and Background Knowledge
To further explore the impact of different input formats on LLMs, particularly the performance differences between LLMs in handling combined inputs of variable names with background knowledge versus variable names with structured data across four assessment tasks, we devised a composite input format based on variable names, background knowledge, and structured data. This approach allows for a controlled variable method to quantitatively assess the influence of each input factor on the causal discovery capabilities of LLMs.
III Evaluation Results of Different Evaluation Tasks
In this section, we first introduce the experimental settings, including evaluation metrics. Then, we present the LLMs used across different evaluation tasks. Finally, we provide the evaluation results of these tasks for various LLMs.
III-A Experimental Settings
To assess the effectiveness and efficiency of the existing LLMs, we employ the following metrics:
-
1.
F1 score: F1 score represents the harmonic mean of precision and recall, with values ranging from 0 to 1. A higher F1 score indicates superior structural accuracy.
-
2.
Structural hamming distance (SHD): This metric measures the average structural Hamming distance, penalizing discrepancies between the ground-truth structure and the learned graph. These discrepancies include incorrect edge additions, reversals, and deletions [36]. A lower SHD value indicates a more accurate graph. While SHD is a classic measure of classification accuracy in causal networks, it tends to be biased towards sensitivity [37].
-
3.
Structural intervention distance (SID): SID is a metric for measuring the accuracy of causality model predictions. It calculates the prediction error of a causal graph relative to a reference graph, and a lower SID value indicates a higher consistency between the model’s predicted causal structure and the true structure.
III-B Evaluated LLMs
In order to evaluate causal discovery ability gap among foundation models, we utilize five series of open-source LLMs: BERT series (i.e., BERT-large, RoBERTa-large, DeBERTa-v3-large, and DistilBERT-mnli), LLAMA series (i.e., LLAMA-7B, LLAMA-13B and LLAMA-33B), InternLM series (i.e., InternLM-7B and InternLM-20B), Falcon series (i.e., Falcon-7B and Falcon-40B) LLMs, along with three closed-source LLMs (i.e., GPT3.5-Turbo, GPT4 and GPT4-Turbo) in zero-shot scenarios. More details on these LLMs are provided in Appendix II. Through CausalBench, the comprehensive ability of LLMs in causal discovery and the differences between various LLMs can be thoroughly assessed.
Then, we will present the experimental results for different tasks. It is noted that we have only presented the results of 14 datasets except Pathfinder, because current LLMs have already shown poor performance in large scale experiments. Furthermore, CausalBench fully supports Pathfinder dataset, and its evaluation prompts are also provided in the source code. We plan to further enhance the capabilities of LLMs in causality identification to handle very large datasets.
III-C Results of identifying correlation task
In this paper, we define two types of correlation: direct and indirect correlation. In this subsection, we showcase the performance of identifying these types of correlation for LLMs.
III-C1 Direct Correlation
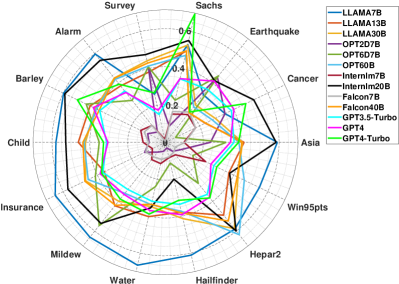
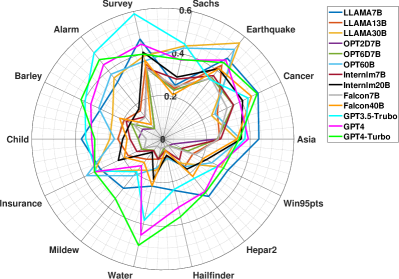
From Table II, all LLMs are capable of recognizing the direct correlation between two variables in small scale datasets, but they cannot fully discern the direct correlation relationships in more complex datasets. Specifically, for small scale datasets (i.e., Asia, Cancer, Earthquake, and Survey datasets), the average F1 scores for all LLMs are 0.4125, 0.5279, 0.4672, and 0.518, respectively. However, as the nodes within the causality detection datasets increase, there is a marked decline in the average performance of LLMs. For medium scale datasets, the average F1 scores range between 0.15 and 0.25, except Sachs dataset due to its fewer nodes. In the more complex large-scale tasks, LLMs almost entirely fail to correctly identify direct correlation, with average F1 scores falling below 0.16 for large scale datasets. As for accuracy, the trend in all LLMs’ average accuracy mirrors that of the average F1 scores. Considering different types of LLMs, it is observed that closed-source LLMs achieve the best performance across all datasets under zero-shot conditions. This might be because GPT series LLMs are trained on the largest number of samples and parameters (A parameter count of 180 billion) among all LLMs, allowing them to understand the correlation between variables more comprehensively.
| Causal networks | Direct Correlation | Indirect Correlation | ||
|---|---|---|---|---|
| F1 score | Accuracy | F1 score | Accuracy | |
| Asia | 0.4126 | 0.4059 | 0.3923 | 0.4008 |
| Cancer | 0.5279 | 0.5333 | 0.515 | 0.5161 |
| Earthquake | 0.5673 | 0.5775 | 0.5574 | 0.573 |
| Survey | 0.3479 | 0.3675 | 0.3309 | 0.3568 |
| Sachs | 0.5181 | 0.5242 | 0.5075 | 0.515 |
| Child | 0.1687 | 0.1879 | 0.1545 | 0.1919 |
| Insurance | 0.2601 | 0.3705 | 0.2647 | 0.3702 |
| Water | 0.2492 | 0.2551 | 0.2379 | 0.2459 |
| Mildew | 0.2379 | 0.2466 | 0.2236 | 0.2443 |
| Alarm | 0.1791 | 0.2425 | 0.1777 | 0.2257 |
| Barley | 0.2262 | 0.2644 | 0.2221 | 0.2531 |
| Hailfinder | 0.1257 | 0.1243 | 0.1158 | 0.1183 |
| Hepar II | 0.1592 | 0.1669 | 0.1485 | 0.161 |
| Win95PTS | 0.1541 | 0.1416 | 0.1369 | 0.1368 |
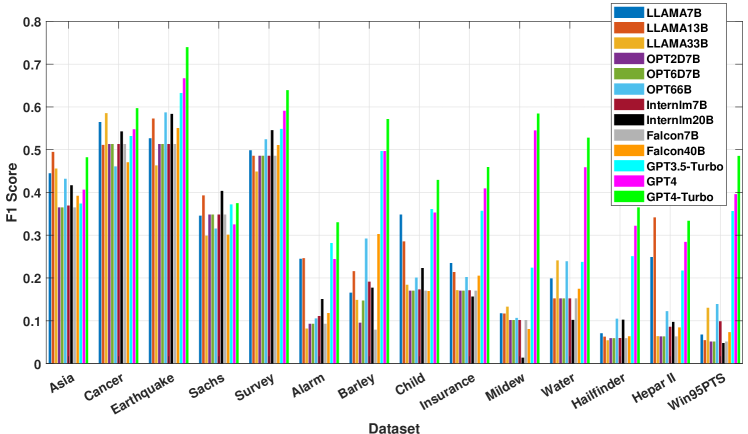
The performance of LLMs to identify direct correlation is presented in Fig. 3. From it, closed-source LLMs maintain a higher F1 score and accuracy compared to open-source LLMs. Among the open-source LLMs, LLAMA series LLMs generally outperform their counterparts, followed by InternLM series, even though all LLMs exhibit suboptimal overall performance. It is noteworthy that some open-source LLMs demonstrate superior performance on certain causality discovery datasets. For instance, InternLM-20B on Earthquake and Cancer datasets, LLAMA-33B on Water dataset, and Falcon40B on Barley dataset, all achieve performance that substantially exceeds that of other open-source LLMs and approaches that of closed-source LLMs. This variation may be attributed to these models having absorbed more knowledge relevant or analogous to specific datasets during the pre-training phase. For example, since Cancer dataset is from the medical domain, it is plausible that during the pre-training of InternLM-20B and OPT-66B, medical samples related to cancer were included, thereby endowing InternLM-20B and OPT-66B with a superior ability to recognize direct correlations on Cancer dataset.
III-C2 Indirect Correlation
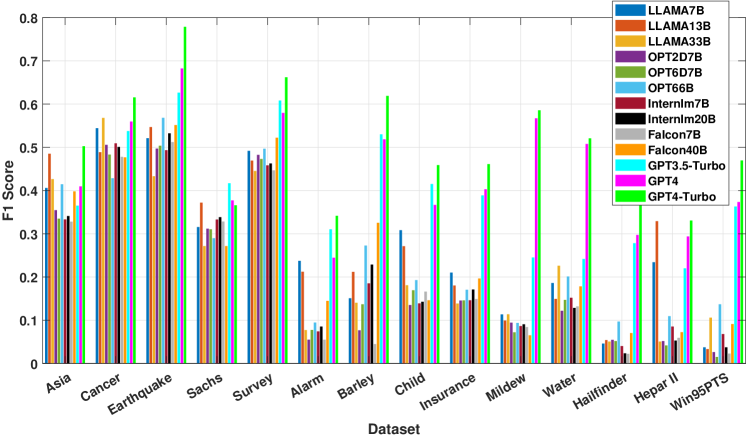
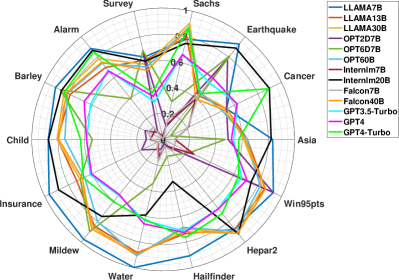
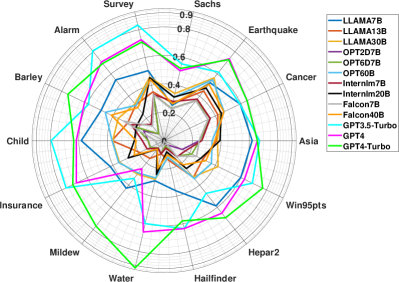
Regarding the evaluation tasks for indirect correlation, the experimental results are in Table II. It is observed that LLMs possess the ability to discern indirect correlation within small scale and a few medium scale causal datasets, and they exhibit almost no capability to discern indirect correlation within large-scale causal datasets. In Table II, for small-scale and certain medium-scale causal learning tasks, such as Asia, Cancer, Earthquake, Sachs, and Survey datasets, the average F1 scores for all LLMs are 0.3922, 0.5150, 0.5574, 0.3309, and 0.5075, respectively. As the number of nodes in the causal datasets increases, the performance of all LLMs declines precipitously. Specifically, for most medium scale datasets, all LLMs’ average F1 scores and accuracy are distributed within the range of 0.15 to 0.25. For large scale datasets, all LLMs are nearly incapable of correctly identifying indirect relationships, with their average F1 scores and accuracy falling within the 0.11 to 0.16 range. Therefore, current LLMs, particularly the open-source ones, struggle to effectively identify indirect correlation in medium and large scale causal datasets.
Focusing on specific LLMs, the evaluation results are presented in Fig. 4 . It can be observed that closed-source LLMs outperform other open-source models, achieving the highest F1 scores and accuracy across all causal datasets. In large-scale datasets, they exhibit capabilities far surpassing those of open-source models. As for open-source models, LLAMA series LLMs show superior performance on small and medium-scale causal datasets compared to others, but on large scale datasets, OPT series LLMs exhibit the best performance. This may because the inherently robust capabilities of LLAMA series, with the largest being LLAMA-33B, while the superior performance of OPT series, primarily OPT-66B, is likely due to its much larger parameter size compared to LLAMA series LLMs. Additionally, the performance differences between InternLM series and Falcon series LLMs are not substantial.
Overall, all LLMs are more proficient in recognizing direct correlations than indirect correlations. This may be because identifying indirect correlations needs to internally determine whether there is an inherent increase or decrease in the correlation between variables, which is challenging for LLMs. As for specific LLMs, closed-source LLMs exhibit the best performance, followed by LLAMA series LLMs. In closed-source LLMs, GPT4-Turbo, with its vast parameter scale, outperforms most tasks, while among the open-source LLMs, LLAMA-13B shows stable performance. In this task, LLMs tend to perform better relative to their parameter size, but their training times are also considerably longer.
III-D Results of identifying causal skeleton task
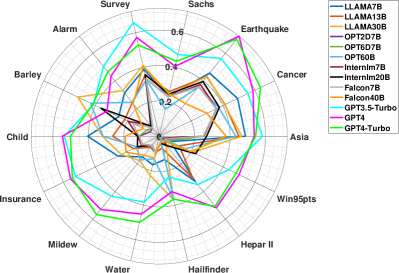
In this subsection, we discuss the performance of LLMs to identify causal skeletons, whose prompts are depicted in Appendix-III-B and the experimental results are presented in Fig. 5. From Fig. 5(a), most LLMs require improvement in recognizing causal skeletons, with most F1 scores between 0.3 and 0.5. Certain LLMs, such as InternLM series, exhibit commendable performance on this evaluation task, whereas others perform notably poorly. As for accuracy in Fig. 5(b), most LLMs maintain around 60%, with InternLM-7B and Falcon-7B continuing to exhibit subpar performance, while InternLM-20B and LLAMA-7B maintain their strong performance. This could be attributed to the possibility that InternLM-7B and Falcon-7B did not acquire robust causal reasoning capabilities during pre-training. Conversely, InternLM-20B, with its extensive parameterization, and LLAMA-7B, enhanced model performance, are better at identifying causal skeletons.
Within the evaluation to identify the causal skeleton, CausalBench needs to evaluate LLMs to deduce the corresponding outcomes under given specific conditions, whose primary objective is to test the causal reasoning abilities of LLMs. This task fundamentally evaluates the inferential capabilities of the LLMs, which is distinct from the evaluation task in identifying correlation and causality. Identifying correlation and causality tasks assesses the LLMs’ capacity to utilize prior knowledge. To this end, different LLMs may exhibit divergent performances in identifying causal skeleton tasks compared to correlation and causality tasks. For instance, InternLM-20B shows average performance in identifying correlation tasks but excels in identifying causal skeleton tasks. Although GPT4-Turbo leads in identifying correlation tasks across almost all LLMs, it shows only moderate performance in causal skeleton tasks. This phenomenon indicates that GPT4-Turbo has strong abilities to understand problems and identify solutions using prior knowledge but may possess average reasoning capabilities in specific task backgrounds.
III-E Results of identifying causality task
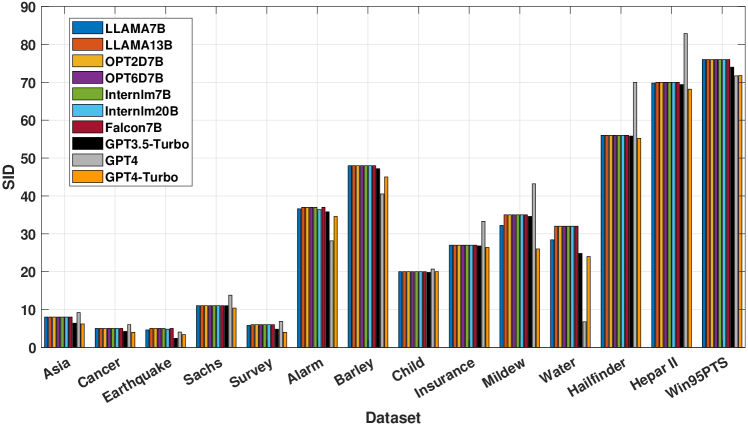
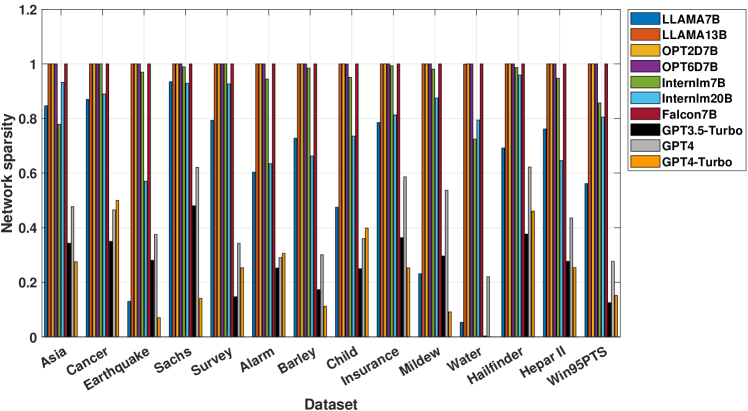
For the evaluation task of evaluating causal relationships, we have designed two methods for evaluation, whose prompts are provided in Appendix III-C. The first method is similar to the evaluation task for identifying correlation, which directly explores the causality between two variables via five different prompts. The first method focuses on determining whether a causal relationship exists between variables. The second method is akin to inferring specific causality after identifying the causal skeleton. Based on these two methods, we can comprehensively evaluate the ability of LLMs to understand causality. Additionally, in the identifying causality task, along with the F1 score and accuracy metrics, we incorporated three commonly used metrics in causal learning, SHD and SID, to measure the causal learning capability of LLMs, and network sparsity metric to measure the network characteristics of the produced causal graphs.
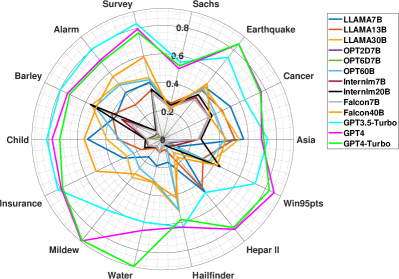
The experiment results for the first method are provided in Fig. 6. From Fig. 6(a), we can investigate that the majority of open-source LLMs exhibit a limited capacity to comprehend causal relationships, whose F1 scores are primarily within the range of 0.2 to 0.4. Exceptionally, LLAMA-7B outperforms by achieving an F1 score exceeding 0.5 on small scale datasets. In contrast, closed-source LLMs demonstrate a discernible proficiency in identifying causality, with F1 scores surpassing 0.6 on small datasets, and maintaining a bracket of 0.5 to 0.6 on medium scale datasets, approximately retaining a score of 0.5 on large scale datasets. Regarding accuracy in Fig. 6(b), open-source LLMs scarcely exceed a precision threshold of 60%, whereas closed-source LLMs surpass 80% on mostly causal datasets, except Asia, Sachs and Hailfinder datasets. Among all LLMs, GPT4-Turbo exhibits exceptional performance, whereas Falcon-40B ranks as the most proficient among all open-source LLMs.
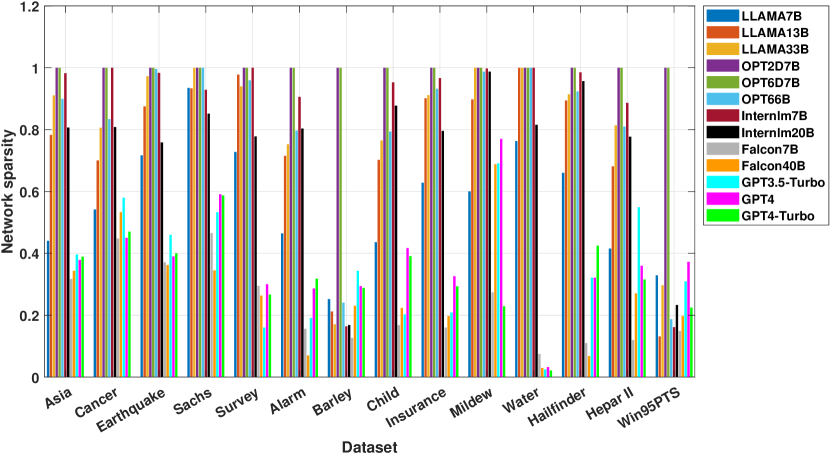
Then, we conduct experiments to assess the ability of LLMs to recognize causality under the second method, and the evaluation results are provided in Table III. From Table III, we can discern that across all causal datasets, LLMs are unable to effectively identify causal relationships, with their F1 scores barely surpassing 0.4 and accuracy generally not exceeding 50%. This is particularly evident in medium and large scale causal datasets, where F1 scores range between 0.1 and 0.2, and accuracy falls between 20% and 30%. In terms of SHD and SID, their performance is also significantly inferior to that of classical methods. Lastly, regarding network sparsity, LLMs exhibit a sparsity exceeding 50% across all datasets, except for Win95PTS and Barley, with values distributed between 0.60 and 0.70, which indicates the causal graphs generated by LLMs are not sparse.
| Dataset | F1 score | Accuracy | SHD | SID | Edge Sparsity |
|---|---|---|---|---|---|
| Asia | 0.3252 | 0.4192 | 33.95 | 7.436 | 0.6651 |
| Cancer | 0.3719 | 0.4725 | 12.88 | 4.819 | 0.7054 |
| Earthquake | 0.4246 | 0.5070 | 12.10 | 4.526 | 0.7142 |
| Sachs | 0.3101 | 0.3316 | 76.12 | 10.57 | 0.7892 |
| Survey | 0.3994 | 0.4811 | 17.88 | 5.338 | 0.6667 |
| Alarm | 0.2524 | 0.3581 | 778.0 | 33.57 | 0.5738 |
| Barley | 0.2496 | 0.3953 | 75.92 | 17.22 | 0.3454 |
| Child | 0.2176 | 0.3518 | 221.6 | 18.20 | 0.6099 |
| Insurance | 0.2400 | 0.3387 | 431.2 | 24.83 | 0.6400 |
| Mildew | 0.1506 | 0.2267 | 904.5 | 33.38 | 0.7806 |
| Water | 0.2057 | 0.2982 | 591.6 | 33.72 | 0.6214 |
| Hailfinder | 0.1332 | 0.2232 | 2144 | 51.81 | 0.6599 |
| Hepar II | 0.1764 | 0.3337 | 2845 | 64.13 | 0.6152 |
| Win95PTS | 0.2131 | 0.3977 | 1037 | 52.01 | 0.3532 |
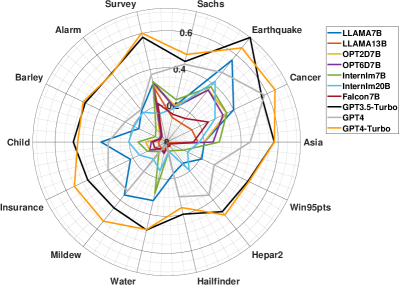
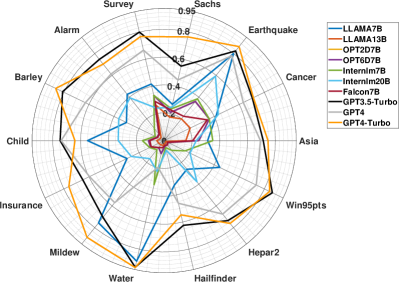
Next, we discuss the causality identification capabilities of LLMs and the experimental results are illustrated in Fig. 7, 8, 9 and 10. Specifically, from Fig. 7(a), open-source LLMs demonstrate commendable causal understanding abilities on small-scale datasets, with LLAMA series LLMs equaling or surpassing closed-source LLMs. This could be attributed to the simplicity of tasks within small-scale datasets, which open-source LLMs are adept at recognizing and understanding. However, on medium and large scale datasets, closed-source LLMs maintain impressive performance, achieving the best results across multiple datasets, notably Water and Mildew. Notably, LLAMA series also sustains robust performance in medium to large-scale datasets, with their F1 scores on Win95PTS and Hepar II even exceeding closed-source LLMs. Other open-source LLMs demonstrate a specific capability for causality in small and medium scale datasets as well. However, their performance on medium to large scale datasets is less satisfactory, particularly for LLMs with more minor parameter scales, such as OPT-6D7B and InternLM-7B. For closed-source LLMs, GPT4-Turbo exhibits the best performance in large scale causal datasets, GPT3.5-Turbo obtains the highest F1 score in medium scale datasets, and GPT4 has a certain edge in small scale datasets. The same conclusions apply to the accuracy metric in Fig. 7(b).
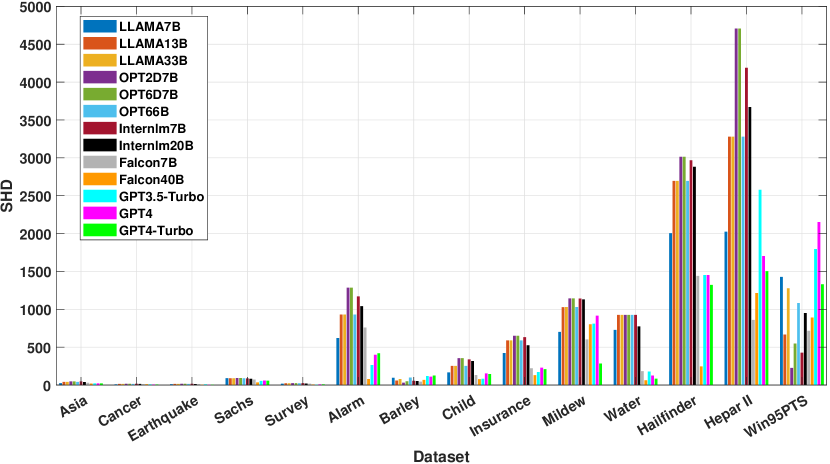
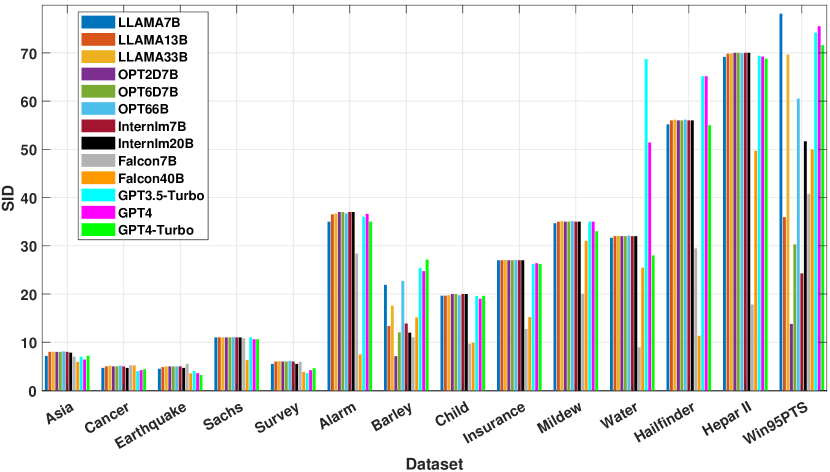
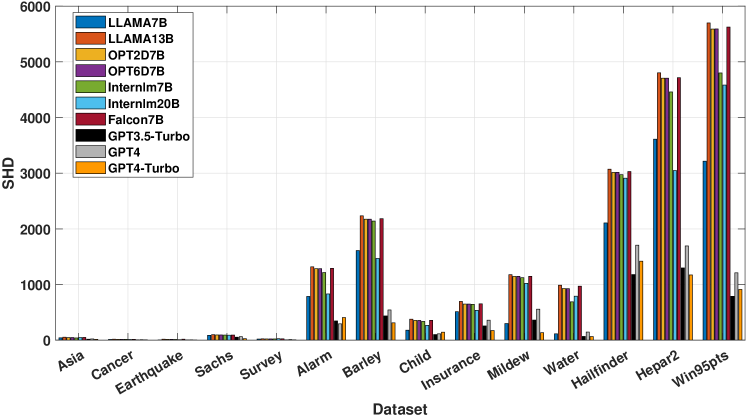
For SHD and SID, we visualized the performance in Fig. 8 and 9. These figures reveal that current LLMs are not yet adept at identifying causal relationships between variables despite achieving F1 scores and accuracy rates exceeding 0.5 and 60% on some datasets, respectively. Among all LLMs, closed-source LLMs consistently demonstrate superior performance, achieving lower SHD and SID values across most causal datasets compared to open-source LLMs. Moreover, among open-source LLMs, LLAMA series are second only to closed-source LLMs in their ability to understand causal relationships in small and medium scale datasets, while Falcon series excel in identifying causality within large scale datasets. Specifically, GPT4-Turbo exhibits the best performance among closed-source LLMs, and among open-source LLMs, LLAMA-7B, Falcon-7B, and Falcon-40B outperform other LLMs, closely following GPT-based LLMs. Regarding network sparsity in Fig. 10, LLMs with lower SHD and SID typically maintain sparser network structures. Closed-source LLMs have an overall network sparsity below 0.5, while Falcon series, which perform well in large scale causal datasets, do not exceed a sparsity level of 0.4. Other open-source models exhibit higher network sparsity.
In this paper, the second method utilizes the d-separation technique to derive six distinct descriptive features of causal relationships, which include two types of direct causality (i.e., parent and child) and four types of indirect causality: ancestral, descendent of a chain structure, a collider structure, and a confounder structure. To this end, we test the performance of different structures for LLMs. The experimental results are provided in Table IV. The differences in the performance of identifying chain, fork, and collider structures among LLMs are not significant. Current LLMs are better at recognizing chain structures and less adept at identifying collider structures.
| Structure | Open-source LLM | Closed-source LLM | All LLMs | |||
|---|---|---|---|---|---|---|
| F1 score | Accuracy | F1 score | Accuracy | F1 score | Accuracy | |
| Direct | 0.2769 | 0.3542 | 0.4608 | 0.4760 | 0.3174 | 0.3810 |
| 0.2242 | 0.2700 | 0.4439 | 0.4654 | 0.2725 | 0.3130 | |
| Chain | 0.2640 | 0.3441 | 0.5185 | 0.5729 | 0.3200 | 0.3944 |
| 0.1879 | 0.2071 | 0.4607 | 0.4758 | 0.2479 | 0.2662 | |
| Average of Chain | 0.2260 | 0.2756 | 0.4896 | 0.5244 | 0.2840 | 0.3303 |
| Confonder | 0.1628 | 0.1636 | 0.4410 | 0.4442 | 0.2240 | 0.2253 |
| Collider | 0.1632 | 0.1699 | 0.3662 | 0.3528 | 0.2079 | 0.2101 |
III-F Results of chain of thought task
In this subsection, we take the evaluation task for CoT. The CoT prompting involves presenting the model with a sequence of question-and-answer pairs that echo the questioning style posed to the model. These question prompts, along with comprehensive CoT findings, are documented in Appendix III-D. The evaluation results are provided in Table V, and it illustrates notable performance enhancements across all models on both datasets when utilizing CoT prompts. Meanwhile, we have discovered that nearly all LLMs with parameter sizes greater than 6 billion are capable of effectively completing CoT experiments. This demonstrates that LLMs exhibit strong reasoning capabilities in the field of causal discovery. Compared to their prior knowledge, LLMs are better at utilizing their reasoning abilities to identify causality.
| LLMs | Accuracy | Maximal inference |
|---|---|---|
| BERT-large | - | - |
| RoBERTa-large | - | - |
| DeBERTa-v3-large | - | - |
| DistilBERT-mnli | - | - |
| LLAMA-7B | 100% | 24 |
| LLAMA-13B | 100% | 24 |
| LLAMA-33B | 60% | 21 |
| OPT-1D3B | - | - |
| OPT-2D7B | - | - |
| OPT-6D7B | 96% | 24 |
| OPT-66B | 89% | 24 |
| InternLM-7B | 95% | 24 |
| InternLM-20B | 100% | 24 |
| Falcon-7B | 93% | 21 |
| Falcon-40B | 100% | 24 |
| GPT3.5-Turbo | 100% | 24 |
| GPT4 | 100% | 24 |
| GPT4-Turbo | 100% | 24 |
IV Evaluation Results of Different Prompt Formats
In previous evaluation works in causal learning, the input format has remained particularly focused on variable names, which does not fully utilize the prior knowledge and long-text comprehension capabilities of LLMs. In this section, we perform the evaluations for different prompt formats.
IV-A Variable name with background knowledge
In this subsection, we first determine the application field of each dataset. For instance, Cancer dataset corresponds to the medical domain, while Win95PTS dataset is related to the computer science domain. Subsequently, we collect background knowledge for each variable name within each dataset, primarily sourcing from Wikipedia and other encyclopedic websites. Then, this background knowledge is appended to each prompt. For the detailed prompts, please see Appendix IV-A.
Due to the expensive computational time in identifying causal skeleton task and the lengthy inference time for LLMs like OPT-66B, we focus primarily on testing the evaluation task to identify causality and the evaluation results are presented in Fig. 11. From it, existing LLMs still struggle to accurately identify causal relationships between variables, even though some datasets show F1 scores and accuracy exceeding 0.5 and 60%, respectively. Among all LLMs, closed-source LLMs continue to exhibit the best performance, achieving lower SHD and SID across the majority of causal datasets compared to other LLMs, as shown in Fig. 12 and 13. Moreover, among open-source LLMs, LLAMA series rank second to closed-source LLMs in terms of causality identification capabilities in small and medium scale datasets, whereas Falcon series demonstrate superior ability to recognize causal relationships in large-scale datasets. Specifically, GPT4-Turbo achieves the best performance among closed-source LLMs, and for open-source LLMs, LLAMA-7B and Falcon-7B perform better than other LLMs, trailing closely behind closed-source LLMs. From Fig. 14, we found that LLMs with lower SHD and SID typically maintain sparser network structures. Closed-source LLMs’ overall network sparsity remains below 0.5, while Falcon series LLMs, which show better performance in large scale causal datasets, also exhibit overall network sparsity that does not exceed 0.4.
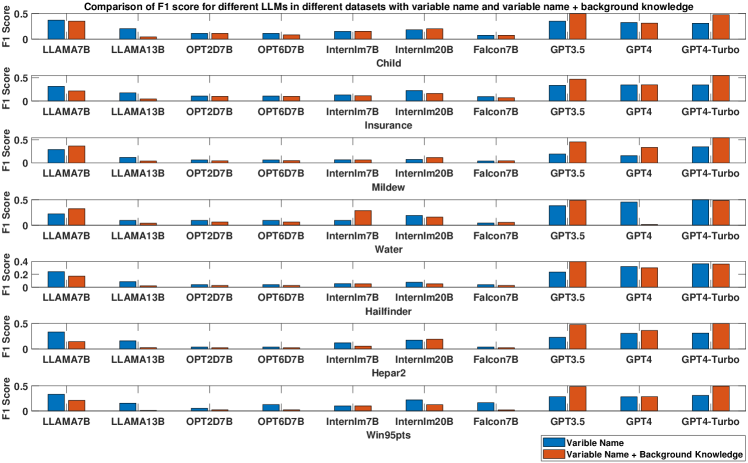
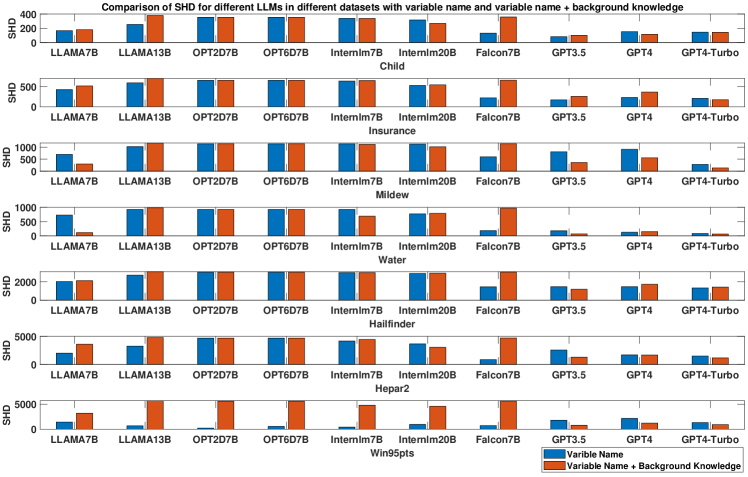
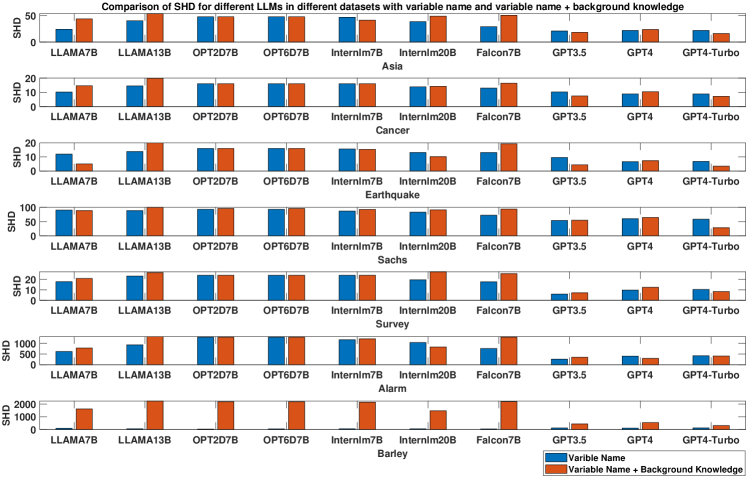
We also provide the experiment results in Table. VI. From it, all LLMs experienced a decrease in F1 score and accuracy, along with an increase in SHD and SID when inputs were augmented with background knowledge in addition to variable names. This counterintuitive and intriguing phenomenon suggests that the performance of LLMs actually deteriorates when inputs include variable names combined with background knowledge. Further, we extracted the F1 scores and SHD of all LLMs on each dataset, comparing inputs consisting solely of variable names to those enriched with background knowledge, which are depicted in Fig. 15, 16, 17, and 18. From Fig. 15 and 16, although most open-source LLMs saw enhancements in some datasets, such as on Earthquake and Water datasets, their F1 scores were generally lower when prompt format was combined with background knowledge in most other datasets. For closed-source LLMs, there was a significant improvement in F1 scores across all causal datasets, particularly in medium and large scale datasets.
Here, we analyze this interesting phenomenon of why open-source LLMs perform worse with inputs of variable names plus background knowledge despite theoretically having access to more background information that should aid in judgment and understanding of causality. In this paper, we provide two possible reasons:
-
•
While combining variable names with background knowledge introduces more contextual information, it also makes the input prompts exceedingly complex and lengthy, which might hinder the comprehension and reasoning abilities of open-source LLMs.
-
•
Due to the prohibitively long inference times with these complex prompts, this evaluation task did not include LLMs with large parameter scales like Falcon-40B, OPT-66B, or LLAMA-33B. To this end, we suspect that the parameter scale of the tested open-source LLMs limits their ability to understand prompts of variable names with background knowledge. Notably, for InternLM-20B, the tested largest parameter scale open-source LLM, its results show an improvement in F1 score across seven causal datasets when using enriched prompts. Closed-source LLMs are unaffected by inference time limitations due to API access and boasting parameter scales up to 180B. Thus, they demonstrate superior text comprehension and reasoning capability, which allows them to better understand and reason through datasets with variable names and background knowledge. This is supported by SHD metrics presented in Fig. 17 and 18.
IV-B Variable name with structured data
In this subsection, we discuss the performance of using variable names combined with structured data as input prompts. Similar to classical causal learning methods, we utilized structured data samples of 500 dimensions for each node. To conduct this experiment, we first attempted to input structured data directly into LLMs. Unfortunately, all open-source LLMs failed to understand the structured data. Additionally, closed-source LLMs could not process all structured data simultaneously due to token count limitations. To address this issue, we divided the 500-dimensional sample data for each node into five segments of 100-dimensional sample data. Specifically, we first informed the LLM: “There are a total of five parts matrices, together forming an input sample of the causality discovery network named Alarm”. The LLM would prompt us to enter the corresponding part number and sample data. After we input each part’s number and its sample data, the LLM would reassemble the split sample data according to the part numbers and sample data, thereby recognizing the structured data. By interacting with the LLM, we could input structured data into it. Although this method enabled GPT series LLMs to understand structured data, all open-source LLMs failed to realize it. Therefore, we only discuss the performance of GPT series LLMs with variable names and structured data, and the experimental results are shown in Table VII.
From Table VII, we can observe the performance of LLMs on small and medium scale causal datasets significantly exceeds that only variable names as input prompt, specifically in F1 score and SHD. Specifically, closed-source LLMs achieved an increase in F1 score by 50% to 100% on Asia, Cancer, and Earthquake datasets; on Sachs and Survey datasets, there was a performance increase of 20% to 40%. This may be attributed to the increased dimensions and the number of nodes. On medium and small scales, LLMs seem capable of handling structured data for causal tasks. On some larger scale datasets, the F1 score for variable names with structured data is less than, or even significantly less than, only variable names as input prompts. This phenomenon is intriguing because incorporating extra information enables LLMs to achieve enhanced reasoning capabilities [38, 39]. Upon analysis, we tend to attribute this phenomenon to two factors:
- •
-
•
As the number of nodes increases, the method of enabling LLMs to combine five submatrices into a complete dataset through interaction might fail. For example, with Alarm dataset, we only need to input data with dimensions of 37 100 in five iterations, but for Win95PTS dataset, we need to input structured data with dimensions of 76 100 five times, and LLMs may struggle to remember each complex data sample, given that a 37 100 search space is significantly smaller than 76 100.
Furthermore, we compare the performance of variable names with structured data to that of variable names with background knowledge as input format in Table VI. We find that on small and medium scale datasets, the performance of variable names with structured data is superior to that of variable names with background knowledge. On large datasets, neither background knowledge nor structured data significantly enhances the causal understanding capabilities of LLMs, especially in the case of structured data. Moreover, both prompt formats outperform solely variable names. Therefore, on small and medium scale datasets, adding either background knowledge or structured data to the input format can enhance the ability of LLMs to recognize and understand causal relationships. However, there is a gap between adding background knowledge and structured data and the performance of adding background knowledge always being inferior to that of adding structured data, which may be due to the following reasons:
-
•
Variable names in many datasets may not convey specific meanings, limiting the effectiveness of background knowledge. For example, some variable names in Water dataset, such as s2251 and s2615, are difficult to associate with precise background knowledge in Wikipedia or other encyclopedias, and LLMs cannot accurately utilize their rich prior knowledge in these cases.
-
•
Structured data directly provides numerical values, allowing LLMs to utilize their limited numerical processing capabilities more effectively than background knowledge.
| Metric | F1 score | Accuracy | SHD | SID | Sparsity | |||||
|---|---|---|---|---|---|---|---|---|---|---|
| Bayesian Network | Var. | Var. + B. K. | Var. | Var. + B. K. | Var. | Var. + B. K. | Var. | Var. + B. K. | Var. | Var. + B. K. |
| Asia | 0.3252 | 0.3034 | 0.4192 | 0.3908 | 33.95 | 39.40 | 7.436 | 7.778 | 0.6651 | 0.7652 |
| Cancer | 0.3719 | 0.3939 | 0.4725 | 0.4527 | 12.88 | 13.80 | 4.819 | 4.921 | 0.7054 | 0.8075 |
| Earthquake | 0.4246 | 0.4219 | 0.5070 | 0.5389 | 12.10 | 11.72 | 4.526 | 4.424 | 0.7142 | 0.6395 |
| Sachs | 0.3101 | 0.2658 | 0.3316 | 0.3324 | 76.12 | 80.54 | 10.57 | 11.22 | 0.7892 | 0.8094 |
| Survey | 0.3994 | 0.3526 | 0.4811 | 0.4439 | 17.88 | 20.06 | 5.338 | 5.748 | 0.6667 | 0.7463 |
| Barley | 0.2496 | 0.1814 | 0.3953 | 0.3233 | 75.92 | 1527.83 | 17.22 | 46.87 | 0.3454 | 0.6960 |
| Child | 0.2176 | 0.2317 | 0.3518 | 0.3545 | 221.57 | 259.27 | 18.20 | 20.05 | 0.6099 | 0.7168 |
| Insurance | 0.2400 | 0.2179 | 0.3387 | 0.3039 | 431.20 | 513.94 | 24.83 | 27.55 | 0.6399 | 0.7793 |
| Mildew | 0.1506 | 0.2067 | 0.2267 | 0.3397 | 904.55 | 811.98 | 33.38 | 34.60 | 0.7806 | 0.7011 |
| Water | 0.2057 | 0.1974 | 0.2982 | 0.3782 | 591.56 | 569.17 | 33.72 | 27.60 | 0.6214 | 0.5794 |
| Hailfinder | 0.1332 | 0.1435 | 0.2232 | 0.2216 | 2144.57 | 2442.81 | 51.81 | 57.30 | 0.6599 | 0.8097 |
| Hepar II | 0.1764 | 0.1852 | 0.3337 | 0.3037 | 2845.52 | 3421.87 | 64.13 | 71.03 | 0.6152 | 0.7320 |
| Win95PTS | 0.2131 | 0.1770 | 0.3977 | 0.3363 | 1037.62 | 3801.99 | 52.01 | 74.95 | 0.3532 | 0.6777 |
IV-C Variable name with background knowledge and structured data
Finally, we discuss the performance of using variable names with background knowledge and structured data as the prompt format. Specifically, we begin by combining variable names with structured data as input prompts and interacting with the LLM, enabling it to recognize structured data. We split the 500-dimensional sample data for each node of the causal discovery dataset into five 100-dimensional segments in dimensional order and inform the LLM, whose prompts are provided in Appendix IV-D. The LLM then prompts us to input the corresponding part number and sample data. After receiving each part’s number and structured data, the LLM reassembles the split sample data according to the part numbers and data, thereby recognizing the structured data. Then, we maintain the interaction and introduce variable names combined with background knowledge as inputs to pose questions to the LLM. Through these steps, we finish this experiment and the experimental result is shown in Table VII 222B. K. represents background knowledge, and S. D. is the structured data.. From it, we observe that using variable names with both background knowledge and structured data as prompt formats enhances the LLM’s capability to identify causality. Its performance is significantly better than the other three prompt formats. To this end, embedding both background knowledge and structured data onto variable names can promote the LLM’s ability to identify causality. Furthermore, we find that structured data slightly outperforms background knowledge in enhancing the performance of LLMs, and this LLM method is the best among all LLMs. Thus, we will compare it with the classical methods in Section V.
| Causal Network | LLMs | Var. | Var. + B. K. | Var. + S. D. | Var. + B. K. + S. D. | ||||
|---|---|---|---|---|---|---|---|---|---|
| F1 score | SHD | F1 score | SHD | F1 score | SHD | F1 score | SHD | ||
| Asia | GPT3.5-Turbo | 0.3754 | 21.00 | 0.5787 | 18.40 | 0.5148 | 24.20 | 0.5385 | 18.00 |
| GPT4 | 0.3913 | 20.37 | 0.4497 | 23.80 | 0.5280 | 27.20 | 0.6265 | 15.30 | |
| GPT4-Turbo | 0.3498 | 22.00 | 0.5794 | 18.20 | 0.5988 | 21.80 | 0.7804 | 8.00 | |
| Cancer | GPT3.5-Turbo | 0.4331 | 10.20 | 0.5673 | 7.40 | 0.5449 | 8.60 | 0.6250 | 6.00 |
| GPT4 | 0.3903 | 11.51 | 0.5834 | 7.30 | 0.6752 | 5.40 | 0.6845 | 5.30 | |
| GPT4-Turbo | 0.4788 | 8.80 | 0.6468 | 6.80 | 0.6712 | 6.40 | 0.7024 | 4.00 | |
| Earthquake | GPT3-Turbo | 0.3478 | 9.60 | 0.7202 | 4.40 | 0.7813 | 3.60 | 0.5921 | 7.00 |
| GPT4 | 0.4625 | 6.37 | 0.4789 | 7.37 | 0.7141 | 6.00 | 0.7855 | 3.50 | |
| GPT4-Turbo | 0.4473 | 6.80 | 0.6485 | 3.40 | 0.7319 | 5.60 | 0.9169 | 1.00 | |
| Sachs | GPT3.5-Turbo | 0.4465 | 54.00 | 0.4450 | 54.60 | - | - | - | - |
| GPT4 | 0.3706 | 58.17 | 0.4299 | 64.46 | 0.4763 | 52.36 | 0.4648 | 52.99 | |
| GPT4-Turbo | 0.3736 | 58.00 | 0.4836 | 28.50 | 0.4663 | 52.92 | 0.4543 | 53.58 | |
| Survey | GPT3.5-Turbo | 0.6586 | 6.00 | 0.5788 | 7.20 | - | - | - | - |
| GPT4 | 0.4458 | 9.60 | 0.3727 | 12.43 | 0.4126 | 10.16 | 0.5125 | 8.47 | |
| GPT4-Turbo | 0.3987 | 10.40 | 0.6024 | 6.50 | 0.5422 | 7.97 | 0.6538 | 6.08 | |
| Alarm | GPT3.5-Turbo | 0.5045 | 264.40 | 0.4740 | 347.00 | - | - | - | - |
| GPT4 | 0.4352 | 539.03 | 0.2222 | 295.64 | 0.4951 | 301.41 | 0.5126 | 232.10 | |
| GPT4-Turbo | 0.4654 | 419.20 | 0.4705 | 406.40 | 0.5126 | 232.10 | 0.5489 | 87.97 | |
| Barley | GPT3.5-Turbo | 0.3951 | 118.50 | 0.4862 | 437.20 | - | - | - | - |
| GPT4 | 0.3658 | 108.80 | 0.2482 | 543.35 | 0.4790 | 146.22 | 0.5792 | 179.33 | |
| GPT4-Turbo | 0.4153 | 125.16 | 0.4979 | 312.40 | 0.4765 | 145.41 | 0.5630 | 173.98 | |
| Child | GPT3.5-Turbo | 0.3529 | 82.00 | 0.5018 | 62.10 | - | - | - | - |
| GPT4 | 0.3252 | 124.47 | 0.3137 | 140.50 | 0.4895 | 79.50 | 0.5760 | 45.40 | |
| GPT4-Turbo | 0.3115 | 145.60 | 0.4782 | 83.60 | 0.4766 | 84.10 | 0.6029 | 42.10 | |
| Insurance | GPT3.5-Turbo | 0.3381 | 170.80 | 0.4709 | 256.00 | - | - | - | - |
| GPT4 | 0.3462 | 209.10 | 0.3497 | 207.60 | 0.3798 | 201.60 | 0.5592 | 174.20 | |
| GPT4-Turbo | 0.3469 | 208.80 | 0.5505 | 175.00 | 0.5849 | 167.40 | 0.6892 | 152.40 | |
| Mildew | GPT3.5-Turbo | 0.1917 | 589.60 | 0.4540 | 361.60 | - | - | - | - |
| GPT4 | 0.1564 | 627.70 | 0.3374 | 293.50 | 0.5165 | 163.70 | 0.5989 | 114.30 | |
| GPT4-Turbo | 0.3489 | 283.00 | 0.5452 | 136.40 | 0.5255 | 149.50 | 0.6159 | 102.90 | |
| Water | GPT3.5-Turbo | 0.3821 | 178.60 | 0.4855 | 68.00 | - | - | - | - |
| GPT4 | 0.4514 | 122.61 | 0.4648 | 117.54 | 0.4325 | 147.60 | 0.4889 | 67.10 | |
| GPT4-Turbo | 0.4994 | 63.80 | 0.4834 | 68.60 | 0.4119 | 159.80 | 0.4749 | 70.40 | |
| Hailfinder | GPT3.5-Turbo | 0.2366 | 2152.30 | 0.3985 | 1178.80 | - | - | - | - |
| GPT4 | 0.3214 | 1465.90 | 0.3025 | 1706.50 | 0.3059 | 1712.40 | 0.3148 | 1484.90 | |
| GPT4-Turbo | 0.3649 | 1321.60 | 0.3620 | 1420.60 | 0.2959 | 1865.20 | 0.3750 | 1224.50 | |
| Hepar II | GPT3.5-Turbo | 0.2308 | 2577.20 | 0.4797 | 1299.00 | - | - | - | - |
| GPT4 | 0.3081 | 1572.50 | 0.3660 | 1394.90 | 0.3755 | 1347.50 | 0.3594 | 1412.80 | |
| GPT4-Turbo | 0.3135 | 1502.60 | 0.5023 | 1172.20 | 0.4219 | 1275.40 | 0.4196 | 1286.40 | |
| Win95PTS | GPT3.5-Turbo | 0.2836 | 1795.40 | 0.4856 | 932.60 | - | - | - | - |
| GPT4 | 0.2811 | 1844.71 | 0.2835 | 1797.00 | 0.2495 | 2145.60 | 0.3252 | 1211.20 | |
| GPT4-Turbo | 0.3077 | 1329.40 | 0.4912 | 912.40 | 0.3250 | 994.07 | 0.4986 | 909.30 | |
V Evaluation Result Analysis
In this section, we analyze the factors affecting the evaluation tasks and the causality identification capabilities of LLMs. Specifically, we first examine the robustness of the evaluation tasks, exploring the impact of the prompt’s sentence templates and variable names. Then, we analyze the differences in identifying causality from a fine-grained perspective. Subsequently, we investigate the out-degree and in-degree of causal graphs generated by LLMs. Finally, we compare the performance of the best LLM method with classical causal learning methods.
V-A Robustness Analysis
In this subsection, we conduct an analysis of the robustness of LLMs. According to [42, 41], the performance of LLMs is significantly related to the variable names and sentence templates of prompts. Therefore, in this paper, the robustness specifically encompasses two aspects: variable refactorization and sentence paraphrase.
V-A1 Variable Refactorization
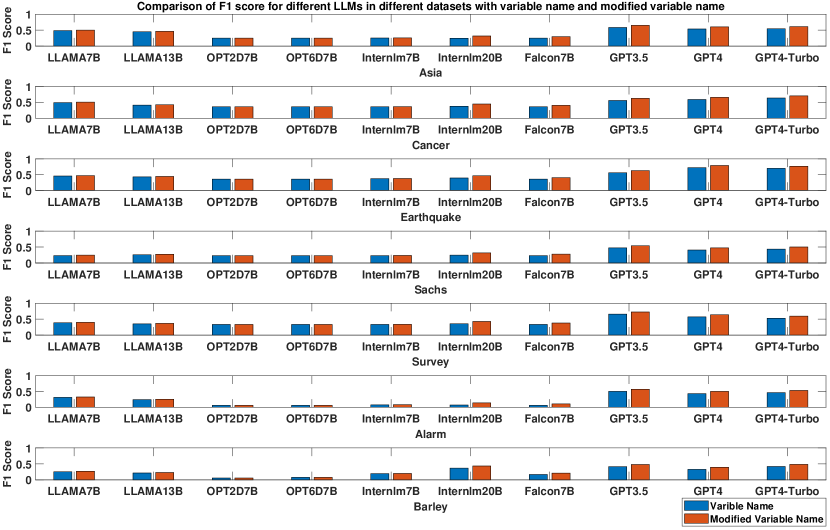
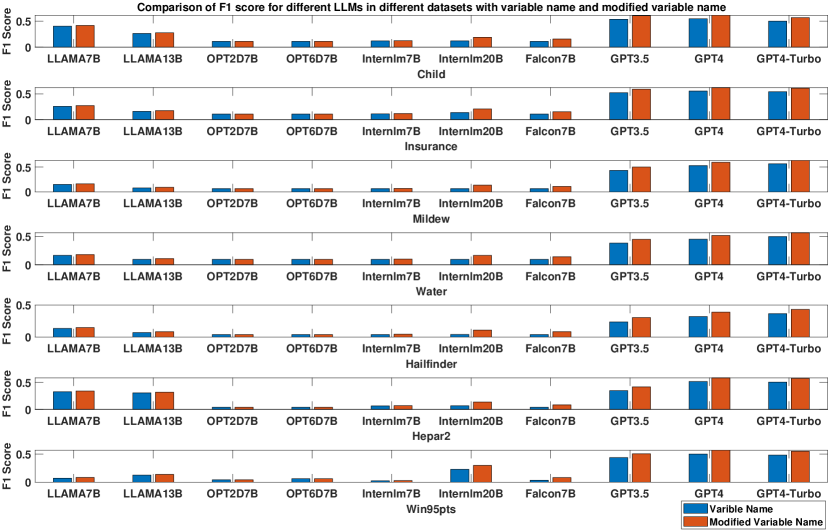
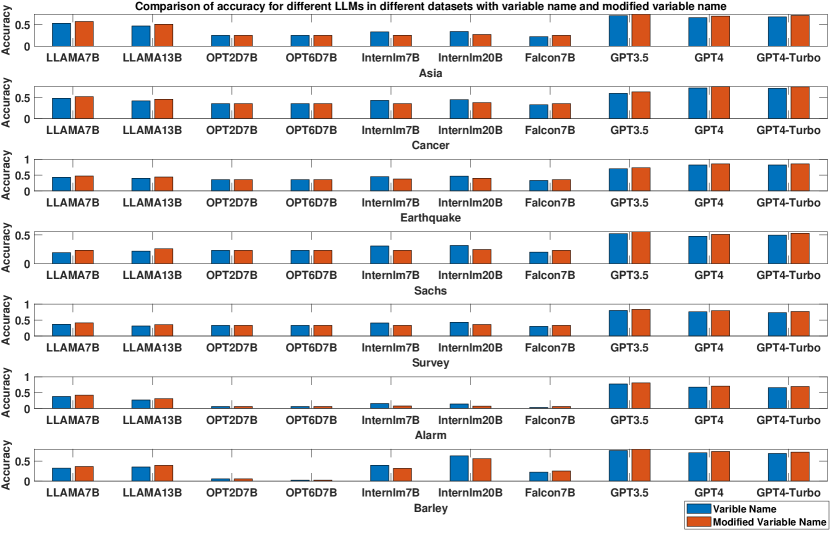
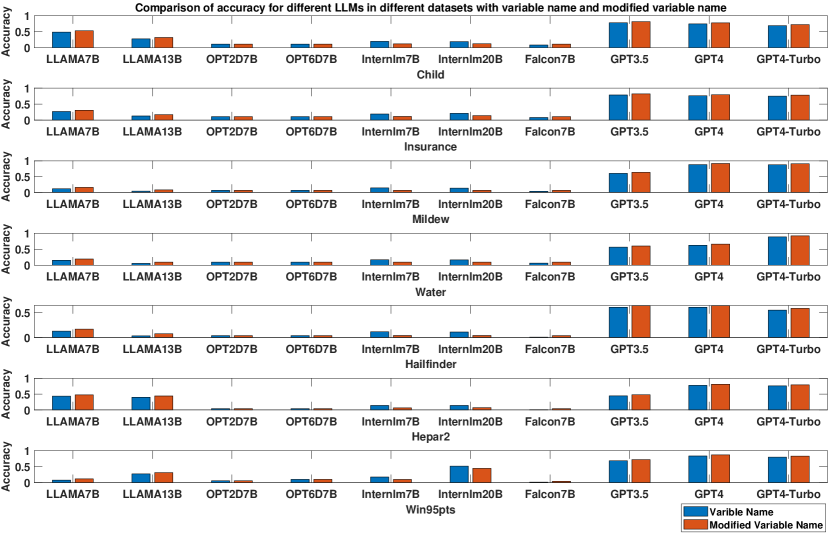
In the datasets, we encountered an intriguing phenomenon in Asia dataset, the original variable name is Asia, and the modified variable name is Visiting to Asia in Sectionsec:problem-C-(1). From this example, we understand that the ability of variable names to accurately reflect their meanings significantly affects the causal learning capability of LLMs. Incorrect representation of variable names could lead to results vastly different from expected or even completely contrary. Therefore, we conducted experiments to test the impact of different variable names on the assessment of identifying causal relationships by LLMs.
We first search Wikipedia and websites related to causal learning for the actual meanings of each variable name. This meaning is different from those experiments for variable names with background knowledge. Here, we are simply restoring the actual meanings referred to by the variable names, and the prompt format remains the variable names alone. The experimental results, as shown in Fig. 19, 20, 21 and 22, indicate that after modifying variable names, there is an improvement in the F1 score and accuracy across almost all LLMs. This suggests that more detailed variable names can enhance LLMs’ ability to recognize causality. However, we also noticed that on some datasets, such as Water and Mildew, the performance difference between more detailed variable names and the original ones is negligible. This interesting phenomenon indicates that while more detailed variable names provide more extensive background information, which is expected to improve performance, this is not always the case. To investigate the reasons, we analyzed Water and Mildew datasets and found a common characteristic: the variable names are difficult to expand in detail, such as s1254, s2548. The specific meanings of these variable names are not detailed on Wikipedia or in the literature introducing these datasets, making it impossible to provide more detailed information for variable names in Water and Mildew datasets, thus resulting in almost no enhancement for LLMs.
V-A2 Sentence Paraphrase
Prompts significantly affect LLMs’ performance in existing LLM research. Therefore, we conducted experiments on two evaluation tasks: to identify correlation and causality by different types of prompts. The experimental results are presented in Table VIII and IX. From Table VIII, across five types, the performance variation among all LLMs is minimal, with an average F1 score ranging between 0.28 and 0.30. Type 3 achieved the highest F1 score (i.e., 0.3089) and the highest accuracy (i.e., 0.3308), followed by Type 1 with an F1 score of 0.2907, while the F1 scores for the other prompts hovered around 0.28. Looking at specific LLMs, the performance difference across the five prompt types is also minimal for open-source LLMs. For closed-source LLMs, however, there is a more significant performance variation across the five prompts, with the highest F1 score for Type 3 reaching 0.49 and the lowest F1 score (i.e., 0.41) for Type 5. Overall, the capability of open-source LLMs to recognize correlations in every prompt type is significantly inferior to that of closed-source LLMs.
From Table IX, we observe significant performance variations across five prompt types in all LLMs, with Type 3 showing the best performance, achieving an F1 score of 0.2728 and a lower SHD, followed by Type 4. Type 2 and Type 5 have their F1 scores around 0.21, with the worst performance seen in Type 1. Open-source LLMs performed best with Type 3, whereas their F1 scores for other prompts ranged between 0.18 and 0.20. For closed-source LLMs, the best F1 score was also with Type 3, reaching 0.3845, followed by Type 4 with an F1 score of 0.34, and the performance of the other prompts was around 0.30. Comparing open-source LLMs to closed-source LLMs, the latter clearly demonstrated a superior ability to identify causal relationships between variables, significantly outperforming open-source LLMs. Across the five prompt types, Type 3 was more effective in helping LLMs recognize causal relationships between variables. Comparing Table VIII and IX, relative to correlation tasks, LLMs are more susceptible to the influence of prompts in causality tasks.
| Task to identify correlation | LLMs | F1 | Accuracy |
|---|---|---|---|
| Type 1: Are Var. A and Var. B related? | Open-Source LLMs | 0.2562 | 0.2646 |
| Closed-Source LLMs | 0.4338 | 0.4760 | |
| All LLMs | 0.2907 | 0.3057 | |
| Type 2: Are Var. A and Var. B correlated? | Open-Source LLMs | 0.2525 | 0.2599 |
| Closed-Source LLMs | 0.4169 | 0.4654 | |
| All LLMs | 0.2845 | 0.2999 | |
| Type 3: Is there a correlation between Var. A and Var. B? | Open-Source LLMs | 0.2647 | 0.2813 |
| Closed-Source LLMs | 0.4915 | 0.5729 | |
| All LLMs | 0.3089 | 0.3380 | |
| Type 4: Is there a relation between Var. A and Var. B? | Open-Source LLMs | 0.2535 | 0.2602 |
| Closed-Source LLMs | 0.4336 | 0.4758 | |
| All LLMs | 0.2885 | 0.3022 | |
| Type 5: Do Var. A and Var. B have a connection? | Open-Source LLMs | 0.2574 | 0.2673 |
| Closed-Source LLMs | 0.4140 | 0.4442 | |
| All LLMs | 0.2879 | 0.3017 |
| Task to identify causality | LLMs | F1 | Accuracy | SHD | SID | Net sparsity |
|---|---|---|---|---|---|---|
| Type 1: Are Var. A and Var. B causally related? | Open-Source LLMs | 0.1766 | 0.1835 | 998.14 | 26.00 | 0.9864 |
| Closed-Source LLMs | 0.2773 | 0.4789 | 832.96 | 29.48 | 0.5863 | |
| All LLMs | 0.1997 | 0.2512 | 960.26 | 26.80 | 0.8946 | |
| Type 2: Is there a causal connection between Var. A and Var. B? | Open-Source LLMs | 0.1894 | 0.1970 | 980.02 | 26.00 | 0.9691 |
| Closed-Source LLMs | 0.2916 | 0.5549 | 686.72 | 29.32 | 0.4777 | |
| All LLMs | 0.2128 | 0.2791 | 912.75 | 26.76 | 0.8564 | |
| Type 3: Does Var. A cause Var. B? | Open-Source LLMs | 0.2409 | 0.2906 | 852.82 | 25.74 | 0.8487 |
| Closed-Source LLMs | 0.3845 | 0.8342 | 178.52 | 26.28 | 0.1335 | |
| All LLMs | 0.2738 | 0.4152 | 698.17 | 25.86 | 0.6847 | |
| Type 4: Does Var. A influence Var. B? | Open-Source LLMs | 0.2052 | 0.2217 | 943.64 | 25.99 | 0.9413 |
| Closed-Source LLMs | 0.3462 | 0.5983 | 610.96 | 29.04 | 0.4668 | |
| All LLMs | 0.2375 | 0.3081 | 867.34 | 26.69 | 0.8325 | |
| Type 5: Is there causality between Var.A and Var. B? | Open-Source LLMs | 0.1889 | 0.1993 | 972.36 | 26.00 | 0.9664 |
| Closed-Source LLMs | 0.3118 | 0.5908 | 628.68 | 29.28 | 0.4335 | |
| All LLMs | 0.2171 | 0.2891 | 893.53 | 26.75 | 0.8442 |
V-B Fine-grained Analysis
In this paper, we analyzed the impact of data granularity on the performance of LLMs, which is shown in Table. X. We found that for data of both coarse and fine granularity, such as probability distributions, conditional independence relationships, and correlation, nearly all LLMs could understand data across these granularities. Note that this understanding does not refer to answering questions correctly but to correctly comprehending the question, understanding the input, and then engaging in causal reasoning. For example, BERT series LLMs and OPT1D3B are not featured in the evaluation section. The main reason for this is their inability to recognize and understand prompts, resulting in responses that are either gibberish or errors. For evaluation tasks involving structured data prompt format, not all LLMs could understand data of very fine granularity. From the table, it is evident that almost all open-source LLMs, if their parameter size is less than 100 billion, struggle to identify and understand data of very fine granularity through textual means. Additionally, for large scale parameters LLMs like GPT3.5-Turbo, their understanding of very fine granularity data only extends to the scale of dimensional table data. For GPT4-Turbo, it can accurately recognize very fine granularity data, understand table data and perform the splitting and combining of very fine granularity data. However, as the scale of very fine granularity data increases, the performance of GPT4-Turbo also decreases, but it still can understand dimensional very fine granularity data. When we extend the granularity to 1000 dimensions, GPT4-Turbo fails to comprehend. Thus, we conclude that existing LLMs possess sufficient capability to recognize and understand data of coarse and fine granularity, but for very fine granularity data, such as table data and matrix data, their ability to recognize and understand is quite weak.
| LLMs | Correlation | Causal skeleton | Causality | |||
|---|---|---|---|---|---|---|
| Var. | Var. + B. K. | Var. + S. D. | Var. + B. K. + S. D. | |||
| BERT-large | × | |||||
| RoBERTa-large | × | |||||
| DeBERTa-v3-large | × | |||||
| DistilBERT-mnli | × | |||||
| LLAMA7B | ||||||
| LLAMA13B | ||||||
| LLAMA30B | ||||||
| OPT1D6B | × | |||||
| OPT2D7B | × | |||||
| OPT6D7B | ||||||
| OPT60B | ||||||
| Internlm7B | ||||||
| Internlm20B | ||||||
| Falcon7B | ||||||
| Falcon40B | ||||||
| GPT3.5-Turbo | ||||||
| GPT4 | ||||||
| GPT4-Turbo | ||||||
V-C In- and out-degree Analysis
In this paper, we analyze significant metrics in causal learning: out-degree and in-degree. From Table XI, the DAGs generated by LLMs still cannot compete with those obtained through traditional causal learning methods. Across multiple datasets, LLMs exhibit out-degrees and in-degrees far exceeding those of traditional causal learning methods, often considered a sign of difficulty in causal learning. Specifically looking at LLMs, closed-source LLMs are closer to the out-degree and in-degree achieved by classical causal learning methods, yet they still struggle to match the performance of traditional methods (i.e., last column named Average degree).
| Dataset | Open-source LLMs | Closed-source LLMs | All LLMs | Average degree | |||
|---|---|---|---|---|---|---|---|
| Degree | Accuracy | Degree | Accuracy | Degree | Accuracy | ||
| Asia | 5.10 | 34.65 | 1.90 | 66.15 | 3.82 | 41.92 | 2.00 |
| Cancer | 3.27 | 42.55 | 1.14 | 62.93 | 2.42 | 47.25 | 1.60 |
| Earthquake | 3.61 | 45.11 | 0.28 | 69.33 | 2.28 | 50.70 | 1.60 |
| Sachs | 9.75 | 27.32 | 5.49 | 52.62 | 8.05 | 33.16 | 3.09 |
| Survey | 4.66 | 39.82 | 1.83 | 75.74 | 3.13 | 48.11 | 2.00 |
| Alarm | 28.02 | 24.47 | 7.99 | 73.62 | 20.01 | 35.81 | 2.49 |
| Child | 14.43 | 31.76 | 3.69 | 65.41 | 10.13 | 39.53 | 2.50 |
| Barley | 25.52 | 25.25 | 4.46 | 68.30 | 18.65 | 35.18 | 3.50 |
| Insurance | 23.03 | 22.39 | 3.90 | 72.16 | 15.38 | 33.87 | 3.85 |
| Mildew | 32.74 | 15.86 | 1.43 | 45.35 | 20.21 | 22.67 | 2.63 |
| Water | 29.75 | 17.01 | 4.94 | 72.51 | 19.83 | 29.82 | 4.12 |
| Hailfinder | 51.82 | 10.53 | 22.53 | 61.61 | 40.10 | 22.32 | 2.36 |
| Hepar II | 47.65 | 25.19 | 25.01 | 60.66 | 38.59 | 33.37 | 3.51 |
| Win95PTS | 23.62 | 30.83 | 15.30 | 69.55 | 21.12 | 39.77 | 2.95 |
V-D Comparison with Classical Methods
In this subsection, Table XII provides the performance comparison of the LLM series method with the best performance (GPT4-Turbo with the prompt format for variable names, background knowledge and structured data) with both classic (i.e., HC [43], MMHC [36] and PC [44]) methods and SOTA causal learning methods (i.e., MIGA [45], DAG-GNN [46], ENSAOBS [47]). It is observable that on small-scale datasets, the LLM-based method approximately achieves the performance of classical approaches but still lags behind the latest causal algorithms, such as MIGA and ENSAOBS. On medium-scale datasets, the performance of the LLM-based method falls short of classical methods and is significantly outperformed by the SOTA methods. In the context of large-scale datasets, the LLM-based method is substantially inferior to both classical and SOTA methods. To this end, we conclude that the current capabilities of LLM-based methods in identifying causal relationships have not yet reached the level of existing methods.
| Datasets | Best LLM method | Classical methods | SOTA methds | ||||
|---|---|---|---|---|---|---|---|
| GPT4-Turbo with B. K. and S. D. | HC | MMHC | PC | MIGA | DAG-GNN | ENSAOBS | |
| Asia | 8 | 10 | 4 | 8 | 2 | 8 | 1 |
| Cancer | 4 | 4 | 3 | 3 | 3 | 5 | 4 |
| Earthquake | 1 | 7 | 3 | 2 | 2 | 4 | 1 |
| Sachs | 54 | 12 | 14 | 10 | 4 | 17 | 13 |
| Survey | 10 | 4 | 3 | 1 | 1 | 4 | 4 |
| Alarm | 88 | 49 | 27 | 36 | 12 | 70 | 29 |
| Barley | 174 | 95 | 81 | 77 | 65 | 98 | 84 |
| Child | 42 | 20 | 15 | 29 | 11 | 23 | 12 |
| Insurance | 152 | 48 | 29 | 45 | 21 | 66 | 31 |
| Mildew | 103 | 59 | 35 | 34 | 29 | 75 | 51 |
| Water | 70 | 56 | 55 | 68 | 47 | 62 | 66 |
| Hailfinder | 1225 | 59 | 49 | 56 | 38 | 67 | 40 |
| Hepar II | 1286 | 101 | 92 | 117 | 79 | 123 | 92 |
| Win95PTS | 909 | 153 | 89 | 119 | 56 | 189 | 161 |
VI Conclusion and Discussion
In this section, we present our discussion based on the evaluation outcomes and subsequent analyses, followed by providing insights into future directions regarding methods to augment the ability of LLMs to discern causality.
VI-A Discussion
In examining the landscape of LLMs for causal learning, several key insights emerge. Firstly, while LLMs have shown promise, their efficacy in causal learning still lags behind human capabilities. A distinction is evident between closed-source LLMs and their open-source counterparts, with the former generally outperforming the latter. However, even the most advanced LLMs do not yet match the performance of classic and SOTA methods in causal learning. This discrepancy is most notable in their handling of small scale datasets, where LLMs come closest to traditional methods but still fall short when compared to SOTA methods. Their effectiveness diminishes further with medium and large scale datasets, trailing significantly behind classical and SOTA causal learning techniques. Furthermore, CausalBench highlights LLMs’ varying performance across different tasks, particularly noting that tasks requiring the differentiation between correlation and causality pose a more significant challenge than those identifying causal skeletons, suggesting LLMs leverage inference abilities beyond mere prior knowledge.
In causal networks, the performance of LLMs is not uniform, fluctuating with the depth and difficulty of tasks. Open-source LLMs struggle more with causality identification than their closed-source counterparts. As datasets grow in complexity, the accuracy and F1 scores of LLMs tend to decrease. Notably, the highest-performing LLM records accuracies of 65.28%, 74.70%, and 68.06% across small, medium, and large datasets. Its F1 scores, 0.7017 for small, 0.5825 for medium, and 0.4310 for large datasets reflect a decline in performance as dataset size increases. When analyzing causal structures like chain, confounder, and collider, LLMs show proficiency for chain structures but falter with colliders, as evidenced by their respective F1 scores. The performance also correlates with network sparsity, particularly concerning the in-degree and out-degree within DAGs, where LLM accuracy declines as these metrics exceed average dataset values, dipping below 50% when they are double the averages.
Background knowledge plays a pivotal role in the performance of LLMs in causality identification, although its utility is not universally positive. When variable names are straightforward and easily understood, background knowledge significantly enhances causal learning. However, it offers little to no benefit for variables with ambiguous names. Moreover, the impact of structured data is notable, with the latest closed-source LLMs capable of effectively utilizing such data, unlike their predecessors and open-source variants, which predominantly rely on textual information. The performance of LLMs in identifying causality is also influenced by sentence patterns and the semantics of variable names, highlighting the nuanced challenges LLMs face in causality identification.
VI-B Future
Finally, we propose future trends for LLMs in causal learning and offer perspectives on methods to enhance LLMs’ ability to identify causal relationships.
-
•
Enhancing the abilities of causality identification for LLMs on different causal tasks: We recommend developing pre-training tasks specifically targeted at causal learning, such as causality-based prediction or discrimination of correlation, to enhance model performance on complex datasets. Additionally, incorporating causal graphical information (i.e., DAGs) as auxiliary input can aid models in better understanding the latent connections and causal structures between variables.
-
•
Improving LLMs’ ability to recognize complex causal network structures: We recommend enhancing model training on identifying different causal structures (e.g., chains, confounders, and colliders) by simulating data generation processes that mimic these specific structures, thereby fostering deeper structural recognition capabilities. Introducing network sparsity as part of the training regimen can also prepare LLMs to handle causal networks of varying densities.
-
•
Strengthen LLMs’ utilization of background knowledge and structured data for causal learning-related tasks: We recommend modifying LLMs to integrate better background knowledge and process structured data, which could involve improving the representation of input data to enable LLMs to distinguish and leverage the semantic information of variable names and enhance understanding of different sentence patterns. Additionally, designing task-specific LLMs to recognize medium to large scale causal networks with unclear variable names and designing LLMs that can recognize the input as numerical data rather than text data to further enhance the causal learning capabilities of LLMs are essential research directions.
In the future, we are also concerned about a causal strength evaluation task, a quantitative analysis of each ranked variable in their cause or effect within the range of [0,1]. In this paper, we provide a primary attempt for causal strength, whose prompts are given in Appendix V. This experiment aims to pave the way for future research to more precisely examine how LLMs assess causal strength and quantify it, thereby assisting scholars in more thoroughly utilizing and recognizing causal relationships between variables.
References
- [1] R. Bommasani, D. A. Hudson, E. Adeli, R. Altman, S. Arora, S. von Arx, M. S. Bernstein, J. Bohg, A. Bosselut, E. Brunskill et al., “On the opportunities and risks of foundation models,” arXiv preprint arXiv:2108.07258, 2021.
- [2] J. Wei, Y. Tay, R. Bommasani, C. Raffel, B. Zoph, S. Borgeaud, D. Yogatama, M. Bosma, D. Zhou, D. Metzler et al., “Emergent abilities of large language models,” arXiv preprint arXiv:2206.07682, 2022.
- [3] H. Nori, N. King, S. M. McKinney, D. Carignan, and E. Horvitz, “Capabilities of gpt-4 on medical challenge problems,” arXiv preprint arXiv:2303.13375, 2023.
- [4] P. Lee, S. Bubeck, and J. Petro, “Benefits, limits, and risks of GPT-4 as an ai chatbot for medicine,” New England Journal of Medicine, vol. 388, no. 13, pp. 1233–1239, 2023.
- [5] X. Wu, S.-h. Wu, J. Wu, L. Feng, and K. C. Tan, “Evolutionary computation in the era of large language model: Survey and roadmap,” arXiv preprint arXiv:2401.10034, 2024.
- [6] P. Lee, C. Goldberg, and I. Kohane, The AI revolution in medicine: GPT-4 and beyond. Pearson, 2023.
- [7] E. Kıcıman, R. Ness, A. Sharma, and C. Tan, “Causal reasoning and large language models: Opening a new frontier for causality,” arXiv preprint arXiv:2305.00050, 2023.
- [8] W. X. Zhao, K. Zhou, J. Li, T. Tang, X. Wang, Y. Hou, Y. Min, B. Zhang, J. Zhang, Z. Dong et al., “A survey of large language models,” arXiv preprint arXiv:2303.18223, 2023.
- [9] S. Bubeck, V. Chandrasekaran, R. Eldan, J. Gehrke, E. Horvitz, E. Kamar, P. Lee, Y. T. Lee, Y. Li, S. Lundberg et al., “Sparks of artificial general intelligence: Early experiments with gpt-4,” arXiv preprint arXiv:2303.12712, 2023.
- [10] W. Zhong, R. Cui, Y. Guo, Y. Liang, S. Lu, Y. Wang, A. Saied, W. Chen, and N. Duan, “Agieval: A human-centric benchmark for evaluating foundation models,” arXiv preprint arXiv:2304.06364, 2023.
- [11] Z. LYU, Z. Jin, R. Mihalcea, M. Sachan, and B. Schölkopf, “Can large language models distinguish cause from effect?” in UAI 2022 Workshop on Causal Representation Learning, 2022.
- [12] S. Long, A. Piché, V. Zantedeschi, T. Schuster, and A. Drouin, “Causal discovery with language models as imperfect experts,” arXiv preprint arXiv:2307.02390, 2023.
- [13] S. Long, T. Schuster, A. Piché, S. Research et al., “Can large language models build causal graphs?” arXiv preprint arXiv:2303.05279, 2023.
- [14] N. Pawlowski, J. Vaughan, J. Jennings, and C. Zhang, “Answering causal questions with augmented LLMs,” 2023.
- [15] Z. Tang, R. Wang, W. Chen, K. Wang, Y. Liu, T. Chen, and L. Lin, “Towards causalgpt: A multi-agent approach for faithful knowledge reasoning via promoting causal consistency in LLMs,” arXiv preprint arXiv:2308.11914, 2023.
- [16] C. Zhang, S. Bauer, P. Bennett, J. Gao, W. Gong, A. Hilmkil, J. Jennings, C. Ma, T. Minka, N. Pawlowski et al., “Understanding causality with large language models: Feasibility and opportunities,” arXiv preprint arXiv:2304.05524, 2023.
- [17] M. Zečević, M. Willig, D. S. Dhami, and K. Kersting, “Causal parrots: Large language models may talk causality but are not causal,” Transactions on Machine Learning Research, 2023.
- [18] Z. Jin, J. Liu, Z. Lyu, S. Poff, M. Sachan, R. Mihalcea, M. Diab, and B. Schölkopf, “Can large language models infer causation from correlation?” arXiv preprint arXiv:2306.05836, 2023.
- [19] R. Tu, C. Ma, and C. Zhang, “Causal-discovery performance of chatgpt in the context of neuropathic pain diagnosis,” arXiv preprint arXiv:2301.13819, 2023.
- [20] Y. Zhang, Y. Zhang, Y. Gan, L. Yao, and C. Wang, “Causal graph discovery with retrieval-augmented generation based large language models,” arXiv preprint arXiv:2402.15301, 2024.
- [21] T. Jiralerspong, X. Chen, Y. More, V. Shah, and Y. Bengio, “Efficient causal graph discovery using large language models,” arXiv preprint arXiv:2402.01207, 2024.
- [22] A. Antonucci, G. Piqué, and M. Zaffalon, “Zero-shot causal graph extrapolation from text via LLMs,” arXiv preprint arXiv:2312.14670, 2023.
- [23] J. D. M.-W. C. Kenton and L. K. Toutanova, “Bert: Pre-training of deep bidirectional transformers for language understanding,” in Proceedings of NAACL-HLT, 2019, pp. 4171–4186.
- [24] H. Touvron, T. Lavril, G. Izacard, X. Martinet, M.-A. Lachaux, T. Lacroix, B. Rozière, N. Goyal, E. Hambro, F. Azhar et al., “Llama: Open and efficient foundation language models,” arXiv preprint arXiv:2302.13971, 2023.
- [25] S. Zhang, S. Roller, N. Goyal, M. Artetxe, M. Chen, S. Chen, C. Dewan, M. Diab, X. Li, X. V. Lin et al., “Opt: Open pre-trained transformer language models,” arXiv preprint arXiv:2205.01068, 2022.
- [26] E. Almazrouei, H. Alobeidli, A. Alshamsi, A. Cappelli, R. Cojocaru, M. Debbah, E. Goffinet, D. Heslow, J. Launay, Q. Malartic, B. Noune, B. Pannier, and G. Penedo, “Falcon-40B: an open large language model with state-of-the-art performance,” 2023.
- [27] I. Team, “Internlm: A multilingual language model with progressively enhanced capabilities,” 2023.
- [28] M. Scutari, “Learning bayesian networks with the bnlearn R package,” Journal of Statistical Software, vol. 35, no. 3, p. 1–22, 2010.
- [29] P. W. Holland, “Statistics and causal inference,” Journal of the American Statistical Association, vol. 81, no. 396, pp. 945–960, 1986.
- [30] S. L. Morgan and C. Winship, Counterfactuals and causal inference. Cambridge University Press, 2015.
- [31] J. Pearl, Causality. Cambridge University Press, 2009.
- [32] D. Colombo, M. H. Maathuis et al., “Order-independent constraint-based causal structure learning.” Journal of Machine Learning Research, vol. 15, no. 1, pp. 3741–3782, 2014.
- [33] J. Wei, X. Wang, D. Schuurmans, M. Bosma, b. ichter, F. Xia, E. Chi, Q. V. Le, and D. Zhou, “Chain-of-thought prompting elicits reasoning in large language models,” in Advances in Neural Information Processing Systems, vol. 35, 2022, pp. 24 824–24 837.
- [34] L. Fan, W. Hua, L. Li, H. Ling, Y. Zhang, and L. Hemphill, “Nphardeval: Dynamic benchmark on reasoning ability of large language models via complexity classes,” arXiv preprint arXiv:2312.14890, 2023.
- [35] L. Chen, T. Ban, X. Wang, D. Lyu, and H. Chen, “Mitigating prior errors in causal structure learning: Towards LLM driven prior knowledge,” arXiv preprint arXiv:2306.07032, 2023.
- [36] I. Tsamardinos, L. E. Brown, and C. F. Aliferis, “The max-min hill-climbing bayesian network structure learning algorithm,” Machine learning, vol. 65, pp. 31–78, 2006.
- [37] A. C. Constantinou, Y. Liu, K. Chobtham, Z. Guo, and N. K. Kitson, “Large-scale empirical validation of bayesian network structure learning algorithms with noisy data,” International Journal of Approximate Reasoning, vol. 131, pp. 151–188, 2021.
- [38] N. F. Rajani, B. McCann, C. Xiong, and R. Socher, “Explain yourself! leveraging language models for commonsense reasoning.” Association for Computational Linguistics, July 2019, pp. 4932–4942.
- [39] F. Petroni, T. Rocktäschel, S. Riedel, P. Lewis, A. Bakhtin, Y. Wu, and A. Miller, “Language models as knowledge bases?” in Proceedings of the 2019 Conference on Empirical Methods in Natural Language Processing and the 9th International Joint Conference on Natural Language Processing (EMNLP-IJCNLP), 2019, pp. 2463–2473.
- [40] J. Li, B. Hui, G. QU, J. Yang, B. Li, B. Li, B. Wang, B. Qin, R. Geng, N. Huo, X. Zhou, C. Ma, G. Li, K. Chang, F. Huang, R. Cheng, and Y. Li, “Can LLM already serve as a database interface? a BIg bench for large-scale database grounded text-to-SQLs,” in Thirty-seventh Conference on Neural Information Processing Systems, 2023.
- [41] Y. Chang, X. Wang, J. Wang, Y. Wu, L. Yang, K. Zhu, H. Chen, X. Yi, C. Wang, Y. Wang et al., “A survey on evaluation of large language models,” ACM Transactions on Intelligent Systems and Technology, 2023.
- [42] Z. Guo, R. Jin, C. Liu, Y. Huang, D. Shi, L. Yu, Y. Liu, J. Li, B. Xiong, D. Xiong et al., “Evaluating large language models: A comprehensive survey,” arXiv preprint arXiv:2310.19736, 2023.
- [43] W. L. Buntine, “Operations for learning with graphical models,” Journal of Artificial Intelligence Research, vol. 2, pp. 159–225, 1994.
- [44] P. Spirtes and C. Glymour, “An algorithm for fast recovery of sparse causal graphs,” Social science computer review, vol. 9, no. 1, pp. 62–72, 1991.
- [45] K. Yan, W. Fang, H. Lu, X. Zhang, J. Sun, and X. Wu, “Mutual information-guided ga for bayesian network structure learning,” IEEE Transactions on Knowledge and Data Engineering, vol. 35, no. 8, pp. 8282–8299, 2023.
- [46] Y. Yu, J. Chen, T. Gao, and M. Yu, “DAG-GNN: DAG structure learning with graph neural networks,” in International Conference on Machine Learning. PMLR, 2019, pp. 7154–7163.
- [47] H. Wang, Z. Wang, R. Zhong, X. Liu, and X. Gao, “The improved ordering-based search method incorporating with ensemble learning,” Cognitive Computation, pp. 1–25, 2024.