Using 3-Objective Evolutionary Algorithms for the Dynamic Chance Constrained Knapsack Problem
Abstract
Real-world optimization problems often involve stochastic and dynamic components. Evolutionary algorithms are particularly effective in these scenarios, as they can easily adapt to uncertain and changing environments but often uncertainty and dynamic changes are studied in isolation. In this paper, we explore the use of 3-objective evolutionary algorithms for the chance constrained knapsack problem with dynamic constraints. In our setting, the weights of the items are stochastic and the knapsack’s capacity changes over time. We introduce a 3-objective formulation that is able to deal with the stochastic and dynamic components at the same time and is independent of the confidence level required for the constraint. This new approach is then compared to the 2-objective formulation which is limited to a single confidence level. We evaluate the approach using two different multi-objective evolutionary algorithms (MOEAs), namely the global simple evolutionary multi-objective optimizer (GSEMO) and the multi-objective evolutionary algorithm based on decomposition (MOEA/D), across various benchmark scenarios. Our analysis highlights the advantages of the 3-objective formulation over the 2-objective formulation in addressing the dynamic chance constrained knapsack problem.
Keywords Fitness evaluation Combinatorial optimization Multi-objective optimization Constraint handling Dynamic optimization Chance constraints
1 Introduction
Evolutionary algorithms (EAs) have been widely applied to address a wide range of real-world combinatorial optimization problems, as these techniques proved themselves to be effective at providing robust solutions to complex problems with minimal design effort Cáceres and Stützle (2023). In recent years, these techniques have been used to solve complex real-world problems across various domains, including mining, power systems, healthcare, and communication systems, to enhance productivity and reduce operational costs Milana and Ashta (2021); Reid et al. (2021); Decerle et al. (2019); Geng and Xie (2019); Abe et al. (2020).
These problems often involve stochastic as well as dynamic components in practice. Many real-world problems involve uncertainty with the nature of data, measurement errors, etc., and ignoring these stochastic components may lead to sub-optimal solutions or the computed optimal solutions might appear infeasible in practice. Furthermore, the objective function, constraints, or decision variables of optimization problems can be dynamic since these components may change over time. Therefore, when optimizing, the challenge is to track the movements of optima induced by dynamic changes Jiang et al. (2022). EAs have been successfully applied to solve many stochastic and dynamic problems due to their ability to easily adapt to changing environments Rakshit et al. (2017); Neumann and Neumann (2020); Roostapour et al. (2022a); Assimi et al. (2020); Nguyen et al. (2012). The development of methods for incorporating chance constraints into optimization problems allowed to use EAs for solving chance constrained problems with any specified probability denoted as Li and Li (2015) of satisfying the constraints.
In recent years, there has been a notable shift towards employing multi-objective formulations within EAs to address stochastic and dynamic problems. This approach, leveraging the ability to optimize multiple conflicting objectives simultaneously, offers a more holistic and realistic framework for solving real-world problems. This multi-objective optimization leads to obtaining a set of non-dominated solutions instead of a single solution.
However, there are only a few studies targeting both stochastic and dynamic components with multi-objective approaches. The dynamic chance constrained knapsack problem (DCCKP) is investigated in Assimi et al. (2020) using evolutionary 2-objective optimization. But this approach is limited to single confidence level. It has been shown in Neumann and Witt (2023) that 3-objective Pareto optimization is beneficial to tackle chance constrained problems for any confidence level at once. In this work, we investigate the 3-objective EA approach to solve the DCCKP and its ability to cope with the stochastic and dynamic nature of this optimization problem together, independently of the confidence level imposed on the chance constraint.
1.1 Related Work
EAs have been successfully applied to chance constrained optimization problems in the literature Poojari and Varghese (2008); Liu et al. (2013); Xie et al. (2019, 2020, 2021); Neumann et al. (2021). Poojari and Varghese (2008) proposed a framework combining genetic algorithm and Monte Carlo simulation to solve chance-constraint programming (CCP) problems. The genetic algorithm is used to cope with the complicated landscape of CCP problems, while the simulation addresses the randomness in constraints. Xie et al. (2019) explored the integrating tail inequalities, such as Chebyshev’s and Chernoff, to address the chance constrained knapsack problem, where the weight of each item is uniformly distributed. They evaluated performance of EAs on different knapsack instances, covering a wide range of stochastic settings. The authors of Neumann and Witt (2022) conducted a runtime analysis of EAs on chance constrained optimization problems with independent and normally distributed stochastic components, using a 2-objective formulation. This research was further extended in Neumann and Witt (2023). They theoretically investigated a 3-objective formulation, considering the deterministic constraint as the third objective with MOEAs for solving the chance constraint optimization problems. The results indicate that the 3-objective setting is particularly advantageous for graphs of moderate size in various stochastic settings.
EAs also performed well on deterministic dynamic problems. Roostapour et al. (2022a) investigated both single and multi-objective baseline evolutionary algorithms in the context of the dynamic classical knapsack problem where the knapsack capacity varies over time. Their findings suggest that the multi-objective approach generally outperforms the single-objective algorithm, when the frequency of dynamic changes is not too high. Moreover, they stated that their simple multi-objective method yields better results than well-established evolutionary multi-objective algorithms like NSGA-II and SPEA2. Roostapour et al. (2022b) investigated the class of submodular functions with dynamically changing constraint bounds. It was shown that the simple multi-objective evolutionary approach, named POMC, effectively ensures the same worst-case approximation ratio in dynamic environments as that of classical greedy algorithms in static settings. Bossek et al. (2019) analyzed the performance of simple evolutionary algorithms theoretically for dynamic combinatorial optimization problems focusing the classical graph coloring problem. They introduced the dynamic setting by adding edges to the current graph. They showed that the re-optimization is much more efficient than optimizing from scratch for dynamic problems.
Even though there is growing interest in applying EAs to either dynamic or stochastic optimization problems, many real-world problems often involve stochastic elements Neumann et al. (2022); Pathiranage et al. (2024); Don et al. (2024); Yan et al. (2024); Ahouei et al. (2024) or both stochastic and dynamic elements Assimi et al. (2020); Perera and Neumann (2024). However, only few studies have focused on addressing both of them at the same time. In Assimi et al. (2020), a novel approach for solving the DCCKP was proposed. They introduced a 2-objective formulation to cater both uncertain and dynamic nature of the knapsack problem where the weight of each item is independent and uniformly distributed. The stochastic bound was used as the second objective. They estimated the probabilistic constraint using prominent tail inequalities Chebyshev’s inequality and the Chernoff bound. The study evaluated the effectiveness of both single- and multi-objective EAs, finding that the 2-objective optimization is particularly effective in managing dynamic chance constrained problems. But their method is limited to one confidence level at once, which implies that it is required to find trade offs with respect to each confidence level separately.
1.2 Our contribution
In this paper, we consider the dynamic chance constrained knapsack problem, characterized by items with stochastic weights that are independent and normally distributed, while the profits remain deterministic. Such weights distribution allows the exact reformulation of the constraint, eliminating the need for tail bounds or sampling-based methods to assess solution feasibility. It’s important to note, however, that this problem is still NP-hard and involves non-linear constraints. Additionally, in our dynamic setting, the knapsack capacity changes over time. We refer to this problem as the DCCKP in the rest of the paper.
We introduce a 3-objective formulation to solve this DCCKP and evaluate its ability to cope with the stochastic and dynamic nature. This 3-objective formulation trade-offs the expected value and variance of the solution’s weight, addressing different components of uncertainty along with the original objective function. Significantly, this reformulation provides optimal solutions for any linear combination of the expected value and standard deviation of stochastic items and addresses the original chance constrained problem for any confidence level . This method eliminates the need to predefine a confidence level when applying multi-objective evolutionary algorithms and, by introducing an additional objective, offers a novel strategy to find high-quality solutions across a range of values at once. Then we compare our approach with the 2-objective formulation motivated by the recent investigation in Assimi et al. (2020) which focused on the original objective function, incorporating the reformulated exact constraints for a specific confidence level on two multi-objective evolutionary algorithms, namely the GSEMO and the MOEA/D with different decomposition methods.
The rest of the paper is structured as follows. In Section 2, we introduce the DCCKP and the baseline evolutionary algorithms that we used to evaluate the performance of our approach. Then in Section 3 and 4, we present 2-objective and 3-objective formulations that we introduce for our investigation respectively. Then, we describe the experimental investigations in detail in Section 5. Finally, we conclude with some key remarks and insights in Section 6.
2 Preliminaries
In this section, we define the DCCKP and we discuss the algorithmic setup.
2.1 Problem Definition
In the classical knapsack problem, we have a set of items, each with its profit and weight , and a knapsack with a capacity constraint . A solution, denoted as , is a bit string of length , where each bit represents whether an item is included or not. The total weight of a solution is , and its profit is . The objective of this classical knapsack problem is to select a combination of items that maximizes the total profit while satisfying the weight bound constraint.
In this paper, we consider the optimization of a deterministic objective function under a chance constraint. The knapsack capacity dynamically changes during the optimization. The weight of each item, follows the normal distribution , with expected value and variance and is independent of each other. For a given solution , let be the objective function value defined by the total profit, be the weight of this solution (which is a random variable), be the expected weight, and be the variance of the weight.
The chance constrained knapsack problem is then formulated as
| Maximize | (1) | ||||
| Subject to | (2) |
The goal is to find a solution with the maximum profit such that the chance constraint, where the weight bound constraint should be satisfied with high probability . We assume that where and , focusing on solutions with high confidence.
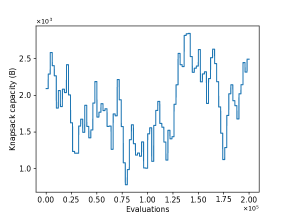
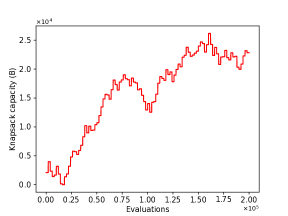
In the dynamic setting, the knapsack capacity changes over time every iterations. We assume that denotes the number of evaluations in between a knapsack capacity changes with magnitude according to the uniform distribution . The algorithm has generations to find the optimum of the current capacity and to prepare for the next change. Figure 1 illustrates how dynamic changes affects to the Knapsack capacity. With the changes under , the capacity reaches almost within changes (Figure 1(a)). While the maximum capacity increases up to under (Figure 1(b)). This implies that the algorithms have to consider various challenges that arise due to the dynamic nature of the problem.
2.2 Baseline Evolutionary Algorithms
A multi-objective optimization problem is defined as follows:
| (3) |
where is the variable space, has real-valued objective functions and is the objective space. In most of the time, objectives in Equation (3) contradicts each other, therefore we consider the Pareto optimality among each objective considering the best tradeoffs among all the objectives. Let and assume that we maximize all the objectives , , then a solution dominates a solution (denoted by ) iff for every . Furthermore, a solution strongly dominates (denoted by ) iff and for at least one index .
We employ multi-objective EAs to solve the DCCKP and this paper focuses on two specific algorithms, namely the GSEMO and the MOEA/D.
The GSEMO is the most basic evolutionary algorithm that addresses multi-objective optimization problems Giel (2003). Previously, it was proven to be effective in solving chance constrained multi-objective optimization problems in many studies Neumann and Witt (2023). Its population initially contains a solution that is generated randomly. In each iteration, a parent solution is chosen uniformly at random from . An offspring solution is then created by flipping each bit of with a probability of . The offspring is added to the population if it is not strongly dominated by any existing solutions in . Additionally, if is added, all solutions in that are dominated by are removed. This approach ensures that at the end of any iteration population will comprise a set of non-dominated solutions, each of which is equally efficient in terms of the given objective functions. For more details on the GSEMO please refer to Giel (2003).
Another algorithm we consider here is the MOEA/D Li and Zhang (2009); Zhang and Li (2007) which decomposes the multi-objective optimization problem into several single-objective sub-problems, which are then optimized simultaneously. The objective of each sub-problem is an aggregate of all objectives, and neighborhood relations among these sub-problems are defined based on the distances between their aggregation coefficient vectors. This algorithm utilizes various decomposition approaches, such as Weighted Sum (WS), Tchebycheff, and Penalty Boundary Intersection (PBI) Li and Zhang (2009); Zhang and Li (2007), to transform a multi-objective problem into scalar sub-problems. For more details on the MOEA/D please refer to Li and Zhang (2009); Zhang and Li (2007).
The WS approach involves maximizing a convex combination of the objectives and the optimal solution to the scalar optimization problem is given by:
where is a weight vector which satisfies the conditions for all and where is the number of objective functions. We generate such weight vectors using the Dirichlet distribution. In the Tchebycheff decomposition the scalar optimization problem is defined as:
where is the reference point such that is the best value of encountered so far by the algorithm. The PBI method minimizes the following scalar optimization sub-problem combining the distance to the reference point and a penalty term as mentioned below.
where and . Parameter is a pre-set penalty parameter.
3 Dynamic 2-objective Formulation
We motivate our 2-objective formulation by the recent investigation in Assimi et al. (2020). In that work, the authors considered the DCKP where the weights of each item are random and follow the uniform distribution and the capacity bound (denoted in that paper by ) changes over time. Their goal was to maximize the profit such that the probability that the weight of the solution is at least as high as the capacity is at most (that is, for some small , which is different from our formulation, where the constraint is for some close to one). To solve this problem, they introduced a 2-objective formulation where the stochastic bound is the second objective and defined as the smallest weight bound such that the probability that the weight is at least is at most . They used Chebyshev’s inequality and the Chernoff bounds to estimate an upper bound on the chance constraint .
We also adopt the standard Pareto optimization approach where weight and profit are the two objectives. Our goal is to select a subset of items that maximizes profit while satisfying the given chance constraint such that a solution satisfies the knapsack bound , with a probability at least some which is close to one.
We formulate the -objective approach to our problem as follows:
where our aim is to maximize (profit component) and minimize (weight component).
We assume that the weight of each item is independent and follow a normal distribution, therefore, the total weight also follows a normal distribution. Hence, we do not need to estimate the lower bound on using tail inequalities, but we can estimate it precisely via the -fractional point of the standard normal distribution, denoted by . According to Ishii et al. (1981), we can compute the chance constraint weight to be equivalent to
| (4) |
In the -objective approach, we consider one fixed time, as depends on . It is important to note that does not have a finite value when , due to the infinite tail of the normal distribution. Our analysis considers the range of values where .
In the dynamic setting, when varying the bound , we cater for changes in the constraint bound by computing solutions that are within an range of the bound . We keep only solutions that satisfy the condition , where determines how far away from bound can individuals which are stored in the population be. The algorithm prepares for the next dynamic changes by storing nearby solutions, even if they are infeasible (that is, with ) as they may become feasible after the next change.
For the 2-objective formulation we use the following fitness functions.
| (5) | |||||
| (6) |
where is the total profit of selected items, is the number of items, is the maximum possible value of calculated based on the maximum expected weight, and maximum variance, among all the items. The penalty term is calculated as indicating how far a solution is from the considered feasible range.
All solutions are re-evaluated corresponding to the new bound after each dynamic magnitude change. If all current stored solutions fall outside of the feasible range, namely , then the algorithm considers the previous best solution (the one with the maximum profit) as the initial solution and employs the repair mechanism (see Algorithm 1), which behaves similar to the EA, until a feasible solution is found or termination criteria is met. In the GSEMO, after finding a feasible solution we start the optimization process using this solution and in the MOEA/D algorithm, we update the previously selected solution from the population with this feasible solution.
The fitness function that we use in the repair mechanism is:
| (7) |
where is the maximum profit, is the constraint violation. The algorithm aims to maximize which has two terms, total profit and the penalty term which guarantees that a feasible solution always has a better value than an infeasible solution. If solution is feasible, then , otherwise we assign large penalty to the objective of the solution. For 2-objective formulation, the constraint violation, represents the deviation of the chance constraint weight from the knapsack bound.
4 Dynamic 3-objective Formulation
We introduce the 3-objective formulation of the DCCKP with normally distributed random variables. In the 2-objective formulation, we consider the Pareto optimization approach that compute the trade-offs with respect to the original objective functions and given chance constraint. In contrast to that, we consider different components determining the uncertainty of solutions, namely the expected value and variance of a solution. Therefore, this formulation employs a Pareto optimization approach, computing trade-offs with respect to the profit , expected weight , and variance of weight .
In the 3-objective approach we use the objective function given as where
| (8) | ||||
| (9) | ||||
| (10) |
In this formulation, we maximize the profit and minimize uncertainty components, and as two separate objectives in and instead of minimizing the chance constraint weight in the 2-objective formulation. This allows us to compute trade-offs that satisfy all confidence levels at once since and are independent of confidence level .
Solution is considered feasible if satisfies . Since is increasing in for all , this condition is equivalent to . This indicates that the solution is feasible for at least a subset of confidence levels. Otherwise, the solution is considered as infeasible, and we assign a large penalty, . This implies that each objective value of an infeasible solution is always worse than the corresponding value of a feasible solution.
After each magnitude change of knapsack bound, if there is no any feasible solution with respect to the new bound, then repair mechanism (Algorithm 1) is performed and penalty term in Equation (7) is obtained as which is the maximum weight bound violation with respect to considered range. This approach effectively eliminates the selection of infeasible solutions.
5 Experimental Investigations
In this section, we carry out the experimental investigations to see the effectiveness of the 3-objective formulation on the DCCKP on different benchmark settings and compare the performance with the 2-objective approach.
5.1 Experimental Setting
We use two distinct classes of knapsack weights and profits: uncorrelated (uncorr) and bounded strongly correlated (bsc) from the eli101 benchmarks for this study Polyakovskiy et al. (2014). For the uncorr class, weights and profits are randomly generated, while for the bsc class, weights are chosen uniformly at random, and the profits are set as the weight plus a fixed number. We test each type of problem for and number of items.
In our chance-constraint setting, the weights of the knapsack items are assumed to have a normal distribution with expected value and variance , . We choose small and large variance as an integer chosen independently and uniformly at random for each item either from , or from and denote these distributions by and respectively. For experiments, we consider hence and . These values represent the reliability of the final solution in ascending order.
We compare the GSEMO, and the MOEA/D with three different decomposition approaches, namely weighted sum (MOEA/Dws), Tchebycheff (MOEA/Dte), and PBI (MOEA/Dpbi) across various stochastic settings. To generate new offspring, standard bit flip mutation with mutation rate is used in both algorithms. Additionally, in the MOEA/D, we apply the uniform crossover with probability in the reproduction phase. In MOEA/D, the population size is set to for the 2-objective formulation and for the 3-objective formulation, as the number of trade-offs increases with the number of objectives. Note that the algorithm considered in Assimi et al. (2020) is similar to the algorithm that we used as 2-objective GSEMO in our comparison.
For each experimental run, we allocate a fitness evaluation budget of one million (M). In the 3-objective formulation, this budget allows us to obtain results for each setting for all values in a single run. However, in the 2-objective formulation, we divide the M budget across five runs for different values.
In dynamic settings, we change the knapsack bound every generations, with set to , , and for the 2-objective formulation, and , , and for the 3-objective formulation, representing large, medium, and small frequencies of change, respectively. In both formulations, the number of dynamic changes remains the same at , , and correspondingly. The magnitude of each dynamic change is randomly generated following , with set to and to demonstrate small and large magnitude changes to capacity. To effectively address dynamic changes, we provide an initial value of which specifies how far from that individuals can be. When dynamic changes arise from , is set to , corresponding to the maximum capacity change.
To evaluate the performance of our algorithms in dynamic environment, we measure the partial offline error Roostapour et al. (2018), which indicates the difference between the profit of best solution obtained by the algorithm and the profit of the optimal solution for the deterministic knapsack problem where the weight of each item is equal to the mean weight of our chance constrained problem. We employ dynamic programming to compute the optimal solution for the deterministic knapsack problem with the maximum profit , and we recompute for every change in the capacity of the knapsack. This method, while exact, can be computationally intensive for large instances but serves as a valuable benchmark for heuristic algorithms. We obtain , which is the best solution obtained by the algorithm in the last generation before the -th change. If is feasible then the offline error is calculated as . Otherwise, , where we add the minimum constraint violation to the maximum profit . Finally, we calculate the total partial offline error as .
Statistical comparisons are carried out by using the Kruskal-Wallis test with 95% confidence interval integrated with the Bonferroni post-hoc test to compare multiple solutions Corder and Foreman (2014). The tables representing the data obtained in our experiments together with the results of the statistical tests can be found in the Appendix. The stat shows the rank of each algorithm in the instances; If two algorithms can be compared with each other significantly, X (+) denotes that the algorithm X is outperforming the current algorithm. Likewise, X(-) implies the algorithm X is worse than the current algorithm significantly. X(*) is denoted that there is no statistical significant between two algorithms.
5.2 Experimental Results
Figures 2 and 3 summarize our findings. These figures present the mean value and the standard deviation of the partial offline error for 30 independent runs for different algorithms when the magnitude of dynamic change, , is set to and respectively. We use the same instance for all runs in the same setting, but the changes of the dynamic bound are independent in each run. The analysis considers the settings where the frequency of dynamic change, , is set to (first row), (second row), (third row), and the variance of each item, , is chosen from either (left column) or (right column). Each sub-figure illustrates the results for bsc (first row) and uncorr (second row) type instances with ,, and items on average partial offline error (y-axis) with respective to confidence level . The lower offline error is, the better the performance is, as it indicates that the algorithm achieved a result closer to the optimal value .
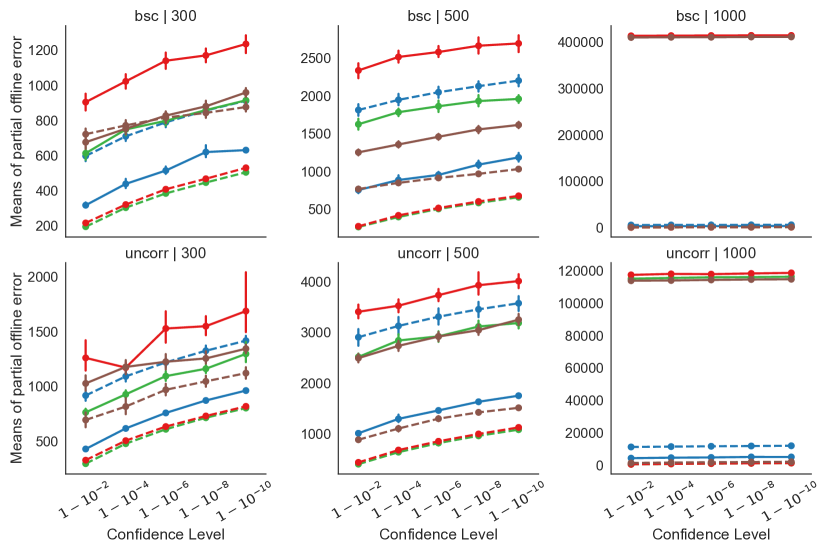
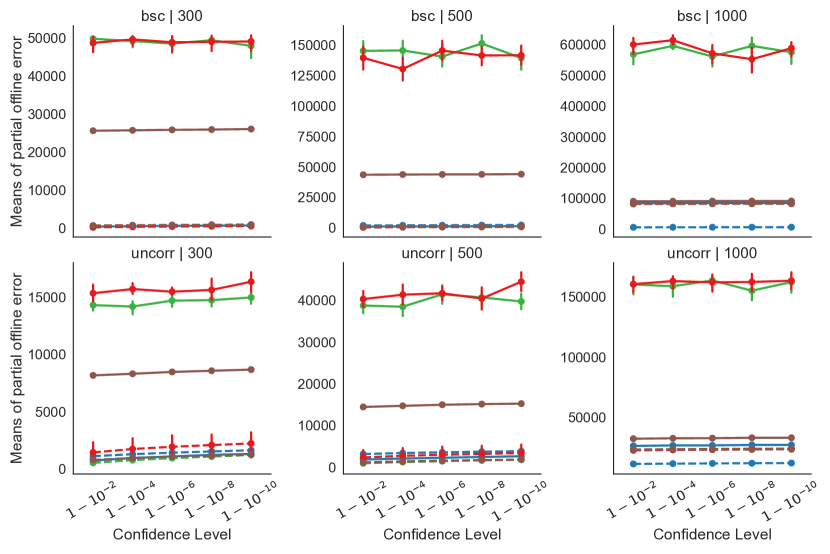
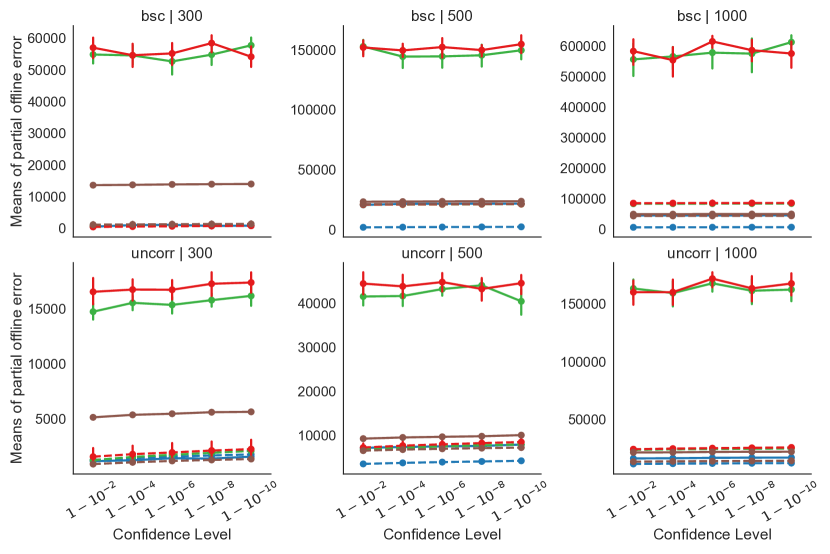

The results with a small magnitude of the dynamic constraint changes are shown in Figure 2. As shown in Figure 2(a), when the variance of each item aligns with setting and frequency of dynamic changes is small (i.e. ), the MOEA/Dte with a 3-objective formulation outperforms other algorithms for all the problems in both types. Figure 2(b) illustrates that the 3-objective approach performs better on all instances except the bsc instances, where the confidence level is looser with and stochastic setting . It is shown in Figure 2(c) that the 3-objective formulation with the MOEA/Dte has better results with and instances while the GSEMO is superior when we have items for both bsc and uncorr problems. Figure 2(d) presents that the 3-objective formulation demonstrates the best performance in all settings when and the variance is set according to . When the frequency of dynamic changes is high (i.e. ), the 3-objective formulation outperforms 2-objective formulation across both variance settings (Figures 2(e)) and (Figures 2(f)) for all problem instances.
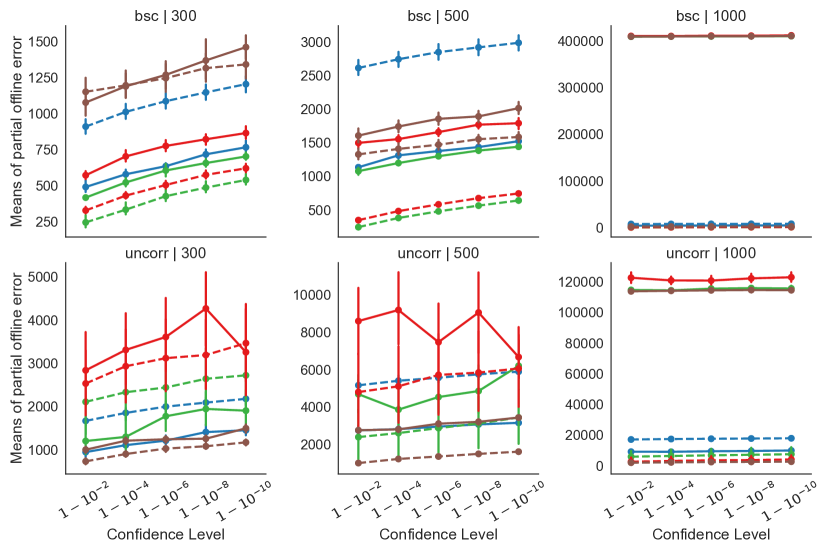
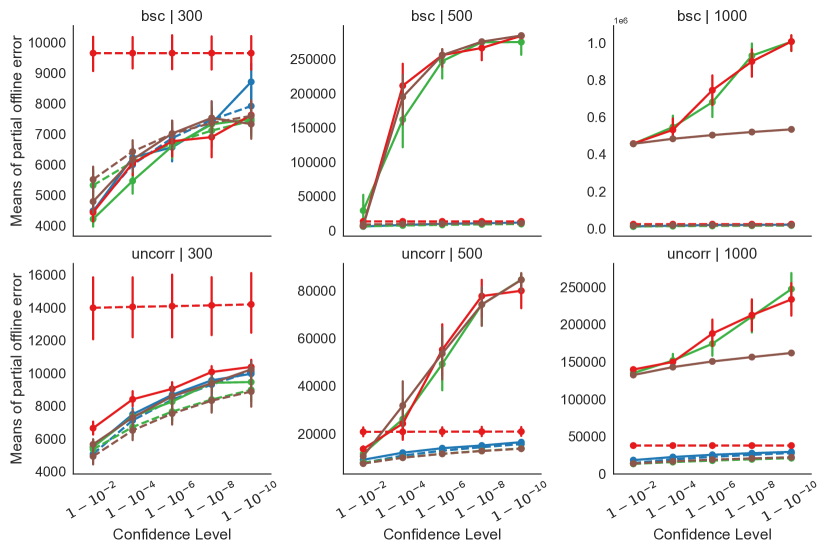
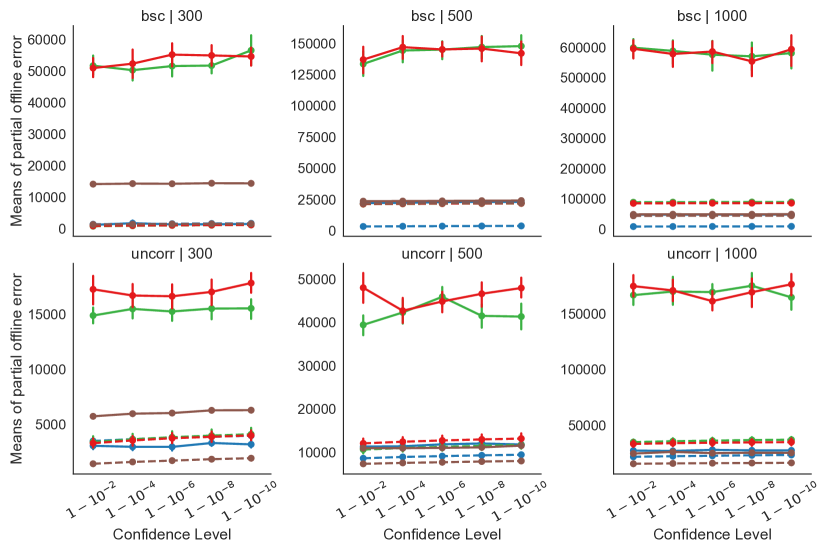
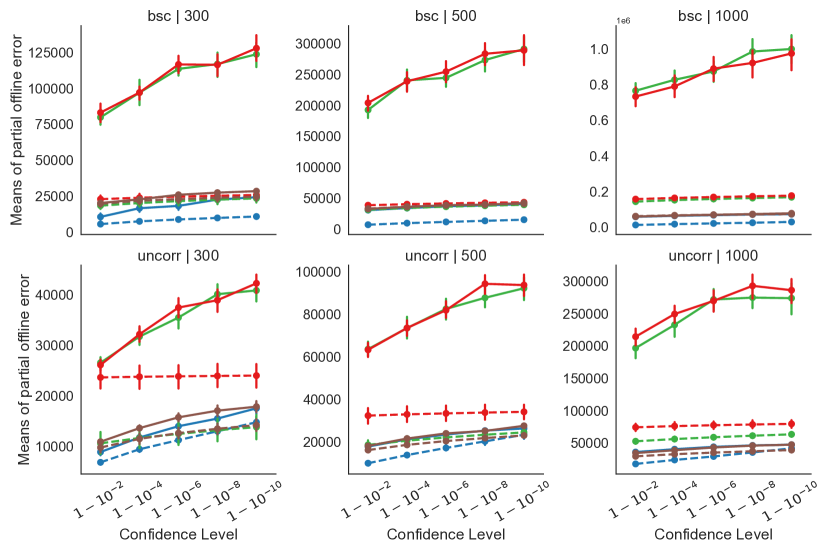
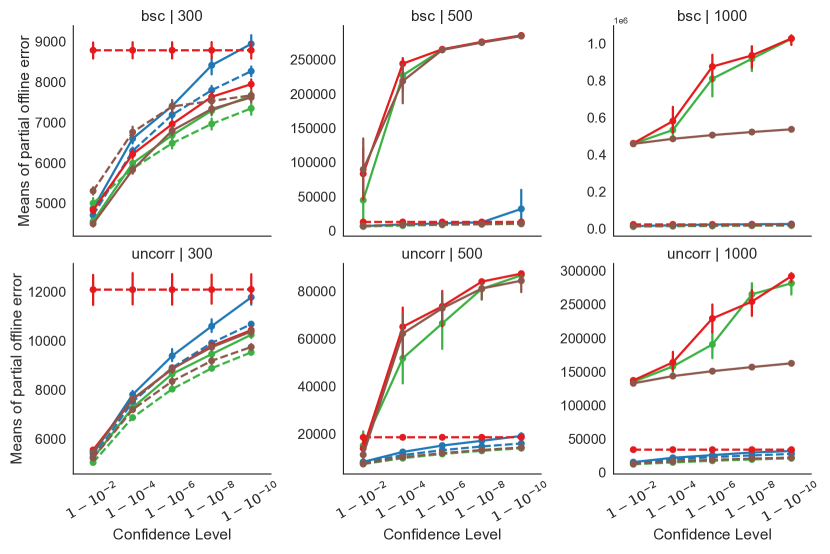
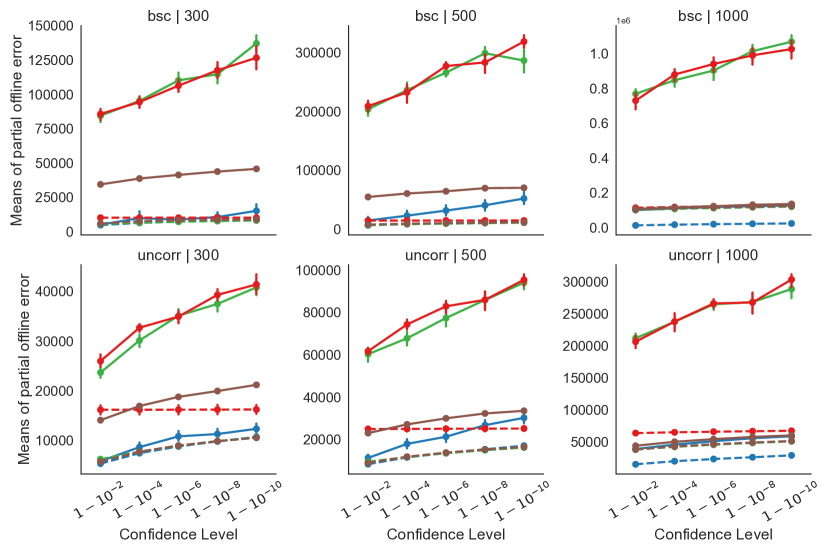
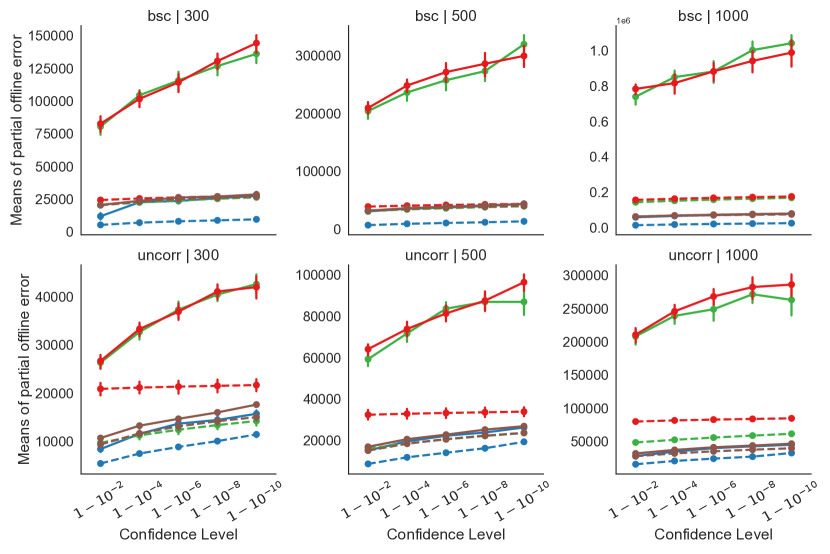
Figure 3 illustrates the mean value and the standard deviation of the offline error for different algorithms when the magnitude of the dynamic knapsack bound change follows . When the variance of each item is chosen according the the setting and with , for bsc and uncorr type problems with , , and items, the MOEA/Dte and the MOEA/Dws with the 3-objective formulation outperforms other algorithms respectively (Figure 3(a)). For under , the MOEA/Dpbi and the MOEA/Dws with a 3-objective formulations yields the lowest offline errors at all confidence levels for and bsc and uncorr instances respectively, while the GSEMO with a 3-objective formulation is superior for the instances of both types as illustrate in Figure 3(c). It is shown in Figure 3(e) that with frequent changes (i.e., ), the MOEA/Dte and the GSEMO, both with a 3-objective formulation, excel for 300 and 500, 1000 item bsc instances, respectively. The MOEA/Dws with a 3-objective formulation stands out for all the uncorr instances. When the variance of each item aligns with the setting , a 3-objective formulation surpasses other approaches in all benchmark instances and stochastic settings, except for the bsc 300 item instances when the number of dynamic changes are small and medium (i.e. = 10, 50) as shown in Figures 3(b), 3(d) and 3(f).
These results reflect that when the variance of each item increases, the profit of the best feasible solution decreases for the same confidence level as the uncertainty of the problem becoming large. Therefore, the average of partial offline error increases with the setting compared to . It is shown that when the chance constrained confidence level becomes tighter, the partial offline error increases. This makes sense as tighten constraint on allows the algorithms to compute solutions that are far from the bound . Therefore the best obtained profit is decreased which tends to increase the offline error. As the number of dynamic changes, denoted by , increases, we observe an increase in partial offline error. This trend occurs because more frequent dynamic changes provide less time for the algorithms to evolve and to find feasible solutions. MOEA/Dte and MOEA/Dpbi with a 2-objective formulation exhibit larger partial offline errors in most cases. The reason for this is these algorithms were not able to find feasible solutions before the occurrence of a dynamic change. Our results indicate that the proposed 3-objective formulation significantly outperforms the 2-objective formulation with more frequent dynamic changes with both stochastic settings. When the number of dynamic changes are small and medium, the 3-objective formulation has significant advantage except in some scenarios where the variance of each item is large and the number of items of the problem is small. Furthermore, the 3-objective formulation is highly effective when using this formulation to obtain a set of solutions that contains an optimal solution for any possible confidence level imposed on the constraint. Also, if we want to compute the optimal solution for a new confidence level within the interval, we do not need to compute again in the 3-objective model as we obtain a set of non-dominated solutions for any possible confidence level at once. Overall, we can state that the dynamic 3-objective formulation has promising results over 2-objective formulation to cater the dynamic and stochastic components effectively.
6 Conclusion
In this paper, we evaluated the performance of 3-objective evolutionary approaches for solving the dynamic chance constrained knapsack problem (DCCKP), characterized by normally distributed random variables and knapsack bound changes over time. This problem formulation has wide applicability in various real-world scenarios as we can compute a set of solutions that contains an optimal solution for any possible confidence level imposed on the constraint at once. We also conducted a comparative analysis with the 2-objective formulation which is limited to single confidence level . We evaluate these formulations on two MOEAs, namely the GSEMO and the three MOEA/D variants under small, medium and large frequency of knapsack bound change, small and large variances on items, different types and instances of problems. Our findings demonstrate that the 3-objective formulation significantly outperforms the 2-objective counterpart. Also, it is highly effective to compute an optimal solution for any possible confidence level imposed on the constraint at once. This result emphasizes the efficacy of the 3-objective approach in addressing complex, real-world optimization problems under dynamic and stochastic conditions.
Acknowledgements
This work has been supported by the Australian Research Council through grants DP190103894 and FT200100536.
References
- Cáceres and Stützle [2023] Leslie Pérez Cáceres and Thomas Stützle, editors. Evolutionary computation in combinatorial optimization, volume 13987 of Lecture Notes in Computer Science, 2023. Springer.
- Milana and Ashta [2021] Carlo Milana and Arvind Ashta. Artificial intelligence techniques in finance and financial markets: A survey of the literature. Strategic Change, 30:189–209, 05 2021.
- Reid et al. [2021] William Reid, Aneta Neumann, Simon Ratcliffe, and Frank Neumann. Advanced mine optimisation under uncertainty using evolution. In Genetic and Evolutionary Computation Conference, GECCO 2021, page 1605–1613. ACM, 2021. ISBN 9781450383516.
- Decerle et al. [2019] Jérémy Decerle, Olivier Grunder, Amir Hajjam El Hassani, and Oussama Barakat. A memetic algorithm for multi-objective optimization of the home health care problem. Swarm and Evolutionary Computation, 44:712–727, 2019. ISSN 2210-6502.
- Geng and Xie [2019] Xinbo Geng and Le Xie. Data-driven decision making in power systems with probabilistic guarantees: Theory and applications of chance-constrained optimization. Annual Reviews in Control, 47:341–363, 2019. ISSN 1367-5788.
- Abe et al. [2020] Yuma Abe, Masaki Ogura, Hiroyuki Tsuji, Amane Miura, and Shuichi Adachi. Resource and network management for satellite communications systems: a chance-constrained approach. IFAC-PapersOnLine, 53(2):3304–3309, 2020. ISSN 2405-8963.
- Jiang et al. [2022] Shouyong Jiang, Juan Zou, Shengxiang Yang, and Xin Yao. Evolutionary dynamic multi-objective optimisation: A survey. ACM Comput. Surv., 55(4), 2022.
- Rakshit et al. [2017] Pratyusha Rakshit, Amit Konar, and Swagatam Das. Noisy evolutionary optimization algorithms – a comprehensive survey. Swarm and Evolutionary Computation, 33:18–45, 2017. ISSN 2210-6502.
- Neumann and Neumann [2020] Aneta Neumann and Frank Neumann. Optimising monotone chance-constrained submodular functions using evolutionary multi-objective algorithms. In Parallel Problem Solving from Nature - PPSN XVI - 16th International Conference, PPSN 2020, Proceedings, Part I, volume 12269 of Lecture Notes in Computer Science, pages 404–417. Springer, 2020.
- Roostapour et al. [2022a] Vahid Roostapour, Aneta Neumann, and Frank Neumann. Single- and multi-objective evolutionary algorithms for the knapsack problem with dynamically changing constraints. Theoretical Computer Science, 924:129–147, 2022a. ISSN 0304-3975.
- Assimi et al. [2020] Hirad Assimi, Oscar Harper, Yue Xie, Aneta Neumann, and Frank Neumann. Evolutionary bi-objective optimization for the dynamic chance-constrained knapsack problem based on tail bound objectives. In European Conference on Artificial Intelligence, ECAI 2020, volume 325, pages 307–314. IOS Press, 2020.
- Nguyen et al. [2012] Trung Thanh Nguyen, Shengxiang Yang, and Juergen Branke. Evolutionary dynamic optimization: A survey of the state of the art. Swarm and Evolutionary Computation, 6:1–24, 2012. ISSN 2210-6502.
- Li and Li [2015] Zhuangzhi Li and Zukui Li. Chance constrained planning and scheduling under uncertainty using robust optimization approximation. IFAC-PapersOnLine, 48(8):1156–1161, 2015. ISSN 2405-8963.
- Neumann and Witt [2023] Frank Neumann and Carsten Witt. 3-objective pareto optimization for problems with chance constraints. In Genetic and Evolutionary Computation Conference, GECCO 2023, page 731–739. ACM, 2023. ISBN 9798400701191.
- Poojari and Varghese [2008] Chandra A. Poojari and Boby Varghese. Genetic algorithm based technique for solving chance constrained problems. European Journal of Operational Research, 185(3):1128–1154, 2008. ISSN 0377-2217.
- Liu et al. [2013] Bo Liu, Qingfu Zhang, Francisco V. Fernandez, and Georges G. E. Gielen. An efficient evolutionary algorithm for chance-constrained bi-objective stochastic optimization. IEEE Transactions on Evolutionary Computation, 17(6):786–796, 2013. ISSN 1089-778X.
- Xie et al. [2019] Yue Xie, Oscar Harper, Hirad Assimi, Aneta Neumann, and Frank Neumann. Evolutionary algorithms for the chance-constrained knapsack problem. In Genetic and Evolutionary Computation Conference, GECCO 2019, page 338–346. ACM, 2019. ISBN 9781450361118.
- Xie et al. [2020] Yue Xie, Aneta Neumann, and Frank Neumann. Specific single- and multi-objective evolutionary algorithms for the chance-constrained knapsack problem. In Genetic and Evolutionary Computation Conference, GECCO 2020, pages 271–279. ACM, 2020.
- Xie et al. [2021] Yue Xie, Aneta Neumann, Frank Neumann, and Andrew M. Sutton. Runtime analysis of RLS and the (1+1) EA for the chance-constrained knapsack problem with correlated uniform weights. In Genetic and Evolutionary Computation Conference, GECCO 2021, pages 1187–1194. ACM, 2021.
- Neumann et al. [2021] Aneta Neumann, Jakob Bossek, and Frank Neumann. Diversifying greedy sampling and evolutionary diversity optimisation for constrained monotone submodular functions. In Genetic and Evolutionary Computation Conference, GECCO 2021, pages 261–269. ACM, 2021.
- Neumann and Witt [2022] Frank Neumann and Carsten Witt. Runtime analysis of single- and multi-objective evolutionary algorithms for chance constrained optimization problems with normally distributed random variables. In International Joint Conference on Artificial Intelligence, IJCAI 2022, pages 4800–4806. ijcai.org, 2022.
- Roostapour et al. [2022b] Vahid Roostapour, Aneta Neumann, Frank Neumann, and Tobias Friedrich. Pareto optimization for subset selection with dynamic cost constraints. Artif. Intell., 302:103597, 2022b.
- Bossek et al. [2019] Jakob Bossek, Frank Neumann, Pan Peng, and Dirk Sudholt. Runtime analysis of randomized search heuristics for dynamic graph coloring. In Genetic and Evolutionary Computation Conference, GECCO 2019, page 1443–1451. ACM, 2019. ISBN 9781450361118.
- Neumann et al. [2022] Aneta Neumann, Yue Xie, and Frank Neumann. Evolutionary algorithms for limiting the effect of uncertainty for the knapsack problem with stochastic profits. In Parallel Problem Solving from Nature - PPSN XVII - 17th International Conference, PPSN 2022, Proceedings, Part I, volume 13398 of Lecture Notes in Computer Science, pages 294–307. Springer, 2022.
- Pathiranage et al. [2024] Ishara Hewa Pathiranage, Frank Neumann, Denis Antipov, and Aneta Neumann. Effective 2- and 3-objective moea/d approaches for the chance constrained knapsack problem. In Genetic and Evolutionary Computation Conference, GECCO 2024. ACM, 2024. To appear.
- Don et al. [2024] Thilina Pathirage Don, Aneta Neumann, and FrankNeumann. The chance constrained travelling thief problem: Problem formulations and algorithms. In Genetic and Evolutionary Computation Conference, GECCO 2024. ACM, 2024. To appear.
- Yan et al. [2024] Xiankun Yan, Aneta Neumann, and Frank Neumann. Sampling-based pareto optimization for chance-constrained monotone submodular problems. In Genetic and Evolutionary Computation Conference, GECCO 2024. ACM, 2024. To appear.
- Ahouei et al. [2024] Saba Sadeghi Ahouei, Jakob de Nobel, Aneta Neumann, Thomas Bäck, and Frank Neumann. Evolving reliable differentiating constraints for the chance-constrained maximum coverage problem. In Genetic and Evolutionary Computation Conference, GECCO 2024. ACM, 2024. To appear.
- Perera and Neumann [2024] Kokila Perera and Aneta Neumann. Multi-objective evolutionary algorithms with sliding window selection for the dynamic chance-constrained knapsack problem. In Genetic and Evolutionary Computation Conference, GECCO 2024. ACM, 2024. To appear.
- Giel [2003] Oliver Giel. Expected runtimes of a simple multi-objective evolutionary algorithm. In CEC 2003, pages 1918–1925. IEEE, 2003.
- Li and Zhang [2009] Hui Li and Qingfu Zhang. Multiobjective optimization problems with complicated pareto sets, moea/d and nsga-ii. IEEE Transactions on Evolutionary Computation, 13(2):284–302, 2009.
- Zhang and Li [2007] Qingfu Zhang and Hui Li. Moea/d: A multiobjective evolutionary algorithm based on decomposition. IEEE Transactions on Evolutionary Computation, 11(6):712–731, 2007.
- Ishii et al. [1981] Hiroaki Ishii, Shōgo Shiode, Toshio Nishida, and Yoshikazu Namasuya. Stochastic spanning tree problem. Discrete Applied Mathematics, 3(4):263–273, 1981. ISSN 0166-218X.
- Polyakovskiy et al. [2014] Sergey Polyakovskiy, Mohammad Reza Bonyadi, Markus Wagner, Zbigniew Michalewicz, and Frank Neumann. A comprehensive benchmark set and heuristics for the traveling thief problem. In Genetic and Evolutionary Computation Conference, GECCO 2014, pages 477–484. ACM, 2014.
- Roostapour et al. [2018] Vahid Roostapour, Aneta Neumann, and Frank Neumann. On the performance of baseline evolutionary algorithms on the dynamic knapsack problem. In PPSN 2018, pages 158–169. Springer International Publishing, 2018.
- Corder and Foreman [2014] Gregory W. Corder and Dale I. Foreman. Nonparametric statistics for non-statisticians: A step-by-step approach. John Wiley & Sons, 2014.
Appendix A Appendix
Corresponding to Figures 2 and 3 in the paper, we present more details on the experimental results in Tables 1 - 24. Each column in the tables describes below. is the instance type(bsc and uncorr) and the number of items of each instance(, and ). is the confidence level imposed on the constraint and we present the results for the confidence level, . stat column represents the measurement of the evaluations of the results we used, mean, standard deviation and the statistical comparison. Each column represent the algorithms we used namely, GSEMO, and MOEA/D with three different decomposition approaches, Tchebycheff (), PBI (), and weighted sum (). and represents the results 2-and 3-objective formulations for each algorithm respectively.
file-n bsc-300 1-1e-2 mean 316.24 597.35 612.67 193.60 904.55 215.11 675.87 721.64 sd 38.77 84.69 99.08 10.64 140.03 13.07 106.45 92.76 stat 2(-)3(-)4(+)5(-) 7(-)8(-) 1(+) 4(+)5(-)6(+) 1(+) 4(+)5(-)6(+) 1(-)2(-)3(-)5(-) 7(-)8(-) 1(+)2(+)3(+)4(+)6(+) 2(-)3(-) 5(-)7(-)8(-) 1(+) 4(+) 6(+) 1(+) 4(+) 6(+) 1-1e-4 mean 437.90 709.31 748.46 302.30 1023.02 319.86 752.58 771.72 sd 74.30 88.64 95.74 13.03 119.88 18.38 98.15 85.64 stat 2(-)3(-) 5(-) 7(-)8(-) 1(+) 4(+)5(-)6(+) 1(+) 4(+)5(-)6(+) 2(-)3(-)5(-) 7(-)8(-) 1(+)2(+)3(+)4(+)6(+)7(+)8(+) 2(-)3(-) 5(-)7(-)8(-) 1(+) 4(+)5(-)6(+) 1(+) 4(+)5(-)6(+) 1-1e-6 mean 514.02 789.27 797.84 383.67 1140.60 407.26 827.52 816.35 sd 57.20 89.88 81.29 14.62 135.89 15.60 70.72 91.62 stat 2(-)3(-)4(+)5(-) 7(-)8(-) 1(+) 4(+)5(-)6(+) 1(+) 4(+)5(-)6(+) 1(-)2(-)3(-)5(-) 7(-)8(-) 1(+)2(+)3(+)4(+)6(+)7(+)8(+) 2(-)3(-) 5(-)7(-)8(-) 1(+) 4(+)5(-)6(+) 1(+) 4(+)5(-)6(+) 1-1e-8 mean 619.58 856.68 858.95 445.63 1171.07 467.12 880.48 843.14 sd 96.20 85.78 83.39 11.07 113.33 13.10 85.34 85.53 stat 2(-)3(-)4(+)5(-) 7(-)8(-) 1(+) 4(+)5(-)6(+) 1(+) 4(+)5(-)6(+) 1(-)2(-)3(-)5(-) 7(-)8(-) 1(+)2(+)3(+)4(+)6(+)7(+)8(+) 2(-)3(-) 5(-)7(-)8(-) 1(+) 4(+)5(-)6(+) 1(+) 4(+)5(-)6(+) 1-1e-10 mean 630.63 912.03 914.71 504.02 1236.23 529.62 959.37 876.38 sd 29.95 85.13 96.35 14.01 141.13 14.56 74.11 74.06 stat 2(-)3(-)4(+)5(-) 7(-)8(-) 1(+) 4(+)5(-)6(+) 1(+) 4(+)5(-)6(+) 1(-)2(-)3(-)5(-) 7(-)8(-) 1(+)2(+)3(+)4(+)6(+) 8(+) 2(-)3(-) 5(-)7(-)8(-) 1(+) 4(+) 6(+) 1(+) 4(+)5(-)6(+) bsc-500 1-1e-2 mean 756.52 1815.52 1627.02 268.14 2338.86 276.82 1255.18 770.25 sd 125.49 215.76 203.05 15.24 269.94 14.13 114.27 83.22 stat 2(-)3(-)4(+)5(-) 1(+) 4(+) 6(+) 8(+) 1(+) 4(+) 6(+) 8(+) 1(-)2(-)3(-)5(-) 7(-)8(-) 1(+) 4(+)6(+)7(+)8(+) 2(-)3(-) 5(-)7(-)8(-) 4(+)5(-)6(+) 2(-)3(-)4(+)5(-)6(+) 1-1e-4 mean 889.43 1949.40 1786.41 400.57 2517.08 421.56 1359.32 851.44 sd 168.56 217.13 144.50 18.27 233.25 18.48 121.48 85.30 stat 2(-)3(-)4(+)5(-) 1(+) 4(+) 6(+) 8(+) 1(+) 4(+) 6(+) 8(+) 1(-)2(-)3(-)5(-) 7(-)8(-) 1(+) 4(+)6(+)7(+)8(+) 2(-)3(-) 5(-)7(-) 4(+)5(-)6(+) 2(-)3(-)4(+)5(-) 1-1e-6 mean 956.85 2050.73 1864.98 506.96 2582.50 518.80 1461.36 917.07 sd 117.21 208.47 222.58 16.08 209.16 20.16 110.22 73.14 stat 2(-)3(-)4(+)5(-)6(+) 1(+) 4(+) 6(+) 8(+) 1(+) 4(+) 6(+) 8(+) 1(-)2(-)3(-)5(-) 7(-)8(-) 1(+) 4(+)6(+)7(+)8(+) 1(-)2(-)3(-) 5(-)7(-) 4(+)5(-)6(+) 2(-)3(-)4(+)5(-) 1-1e-8 mean 1092.71 2130.76 1933.76 586.80 2665.68 605.22 1558.75 970.84 sd 138.64 205.56 209.61 17.24 294.75 19.24 135.76 75.44 stat 2(-)3(-)4(+)5(-)6(+) 1(+) 4(+) 6(+) 8(+) 1(+) 4(+) 6(+) 8(+) 1(-)2(-)3(-)5(-) 7(-)8(-) 1(+) 4(+)6(+)7(+)8(+) 1(-)2(-)3(-) 5(-)7(-) 4(+)5(-)6(+) 2(-)3(-)4(+)5(-) 1-1e-10 mean 1188.15 2204.61 1962.00 661.54 2695.86 679.69 1617.70 1034.40 sd 172.42 216.30 149.23 17.10 322.49 20.44 120.14 79.95 stat 2(-)3(-)4(+)5(-)6(+) 1(+) 4(+) 6(+)7(+)8(+) 1(+) 4(+) 6(+) 8(+) 1(-)2(-)3(-)5(-) 7(-)8(-) 1(+) 4(+)6(+)7(+)8(+) 1(-)2(-)3(-) 5(-)7(-) 2(-) 4(+)5(-)6(+) 2(-)3(-)4(+)5(-) bsc-1000 1-1e-2 mean 2986.45 5627.35 412012.38 563.90 413878.44 590.60 410323.70 1150.55 sd 405.00 495.52 518.94 50.08 745.68 52.33 530.32 98.63 stat 3(-)4(+)5(-)6(+)7(-) 3(-)4(+)5(-)6(+) 8(+) 1(+)2(+)4(+) 6(+) 8(+) 1(-)2(-)3(-)5(-) 7(-) 1(+)2(+) 4(+)6(+)7(+)8(+) 1(-)2(-)3(-) 5(-)7(-) 1(+) 4(+)5(-)6(+)8(+) 2(-)3(-) 5(-) 7(-) 1-1e-4 mean 3248.53 5783.02 412141.27 723.81 414279.52 761.21 410771.09 1283.68 sd 701.40 491.27 809.86 48.41 757.67 47.97 626.49 96.61 stat 3(-)4(+)5(-)6(+)7(-) 3(-)4(+)5(-)6(+) 8(+) 1(+)2(+)4(+) 6(+) 8(+) 1(-)2(-)3(-)5(-) 7(-) 1(+)2(+) 4(+)6(+)7(+)8(+) 1(-)2(-)3(-) 5(-)7(-) 1(+) 4(+)5(-)6(+)8(+) 2(-)3(-) 5(-) 7(-) 1-1e-6 mean 3193.61 5895.92 412388.88 840.05 414493.10 881.91 410851.82 1346.31 sd 435.14 486.40 740.79 49.12 783.45 46.36 508.34 85.48 stat 3(-)4(+)5(-)6(+)7(-) 3(-)4(+)5(-)6(+) 8(+) 1(+)2(+)4(+) 6(+) 8(+) 1(-)2(-)3(-)5(-) 7(-) 1(+)2(+) 4(+)6(+)7(+)8(+) 1(-)2(-)3(-) 5(-)7(-) 1(+) 4(+)5(-)6(+)8(+) 2(-)3(-) 5(-) 7(-) 1-1e-8 mean 3628.12 5993.48 412988.26 937.26 414765.43 977.44 411394.99 1411.22 sd 615.71 483.16 803.13 45.23 665.65 46.53 631.85 91.21 stat 3(-)4(+)5(-)6(+)7(-) 3(-)4(+)5(-)6(+) 8(+) 1(+)2(+)4(+) 6(+) 8(+) 1(-)2(-)3(-)5(-) 7(-) 1(+)2(+) 4(+)6(+)7(+)8(+) 1(-)2(-)3(-) 5(-)7(-) 1(+) 4(+)5(-)6(+)8(+) 2(-)3(-) 5(-) 7(-) 1-1e-10 mean 3521.71 6080.13 413078.37 1024.10 414684.21 1071.16 411552.02 1452.79 sd 535.94 476.58 807.08 44.96 902.39 54.41 677.18 81.03 stat 3(-)4(+)5(-)6(+)7(-) 3(-)4(+)5(-)6(+) 8(+) 1(+)2(+)4(+) 6(+) 8(+) 1(-)2(-)3(-)5(-) 7(-) 1(+)2(+) 4(+)6(+) 8(+) 1(-)2(-)3(-) 5(-)7(-) 1(+) 4(+) 6(+)8(+) 2(-)3(-) 5(-) 7(-)
file-n uncorr-300 1-1e-2 mean 431.00 919.12 765.05 297.27 1262.00 329.14 1029.29 696.00 sd 36.10 129.48 89.28 18.60 387.61 27.94 200.92 199.76 stat 2(-)3(-) 5(-) 7(-) 1(+) 4(+) 6(+) 1(+) 4(+)5(-)6(+) 2(-)3(-)5(-) 7(-)8(-) 1(+) 3(+)4(+)6(+) 8(+) 2(-)3(-) 5(-)7(-)8(-) 1(+) 4(+) 6(+)8(+) 4(+)5(-)6(+)7(-) 1-1e-4 mean 618.71 1093.34 929.44 479.52 1173.46 507.00 1179.65 818.30 sd 42.79 136.15 101.98 30.93 137.67 35.21 190.85 198.36 stat 2(-)3(-)4(+)5(-) 7(-) 1(+) 4(+) 6(+) 8(+) 1(+) 4(+)5(-)6(+) 1(-)2(-)3(-)5(-) 7(-)8(-) 1(+) 3(+)4(+)6(+) 8(+) 2(-)3(-) 5(-)7(-)8(-) 1(+) 4(+) 6(+)8(+) 2(-) 4(+)5(-)6(+)7(-) 1-1e-6 mean 760.00 1221.07 1095.83 611.10 1530.04 635.53 1226.92 971.26 sd 52.75 115.41 128.93 33.65 427.79 35.29 197.93 151.99 stat 2(-)3(-) 5(-) 7(-) 1(+) 4(+) 6(+) 1(+) 4(+)5(-)6(+) 2(-)3(-)5(-) 7(-)8(-) 1(+) 3(+)4(+)6(+) 8(+) 2(-)3(-) 5(-)7(-)8(-) 1(+) 4(+) 6(+) 4(+)5(-)6(+) 1-1e-8 mean 873.65 1327.14 1162.98 716.12 1551.15 731.97 1257.14 1048.10 sd 39.61 129.61 106.88 40.14 229.73 36.74 163.78 153.77 stat 2(-)3(-) 5(-) 7(-) 1(+) 4(+) 6(+) 8(+) 1(+) 4(+)5(-)6(+) 2(-)3(-)5(-) 7(-)8(-) 1(+) 3(+)4(+)6(+) 8(+) 2(-)3(-) 5(-)7(-)8(-) 1(+) 4(+) 6(+) 2(-) 4(+)5(-)6(+) 1-1e-10 mean 963.84 1419.20 1298.41 804.54 1689.03 820.02 1345.89 1123.01 sd 39.07 128.33 264.44 39.58 891.04 30.03 115.49 143.20 stat 2(-)3(-) 5(-) 7(-) 1(+) 4(+) 6(+) 8(+) 1(+) 4(+)5(-)6(+) 2(-)3(-)5(-) 7(-)8(-) 1(+) 3(+)4(+)6(+) 8(+) 2(-)3(-) 5(-)7(-)8(-) 1(+) 4(+) 6(+) 2(-) 4(+)5(-)6(+) uncorr-500 1-1e-2 mean 1017.58 2908.85 2520.13 409.51 3409.86 444.62 2497.05 890.43 sd 117.68 467.92 193.46 12.10 393.92 20.17 242.49 103.16 stat 2(-)3(-)4(+)5(-) 7(-) 1(+) 4(+) 6(+) 8(+) 1(+) 4(+)5(-)6(+) 8(+) 1(-)2(-)3(-)5(-) 7(-)8(-) 1(+) 3(+)4(+)6(+)7(+)8(+) 2(-)3(-) 5(-)7(-) 1(+) 4(+)5(-)6(+)8(+) 2(-)3(-)4(+)5(-) 7(-) 1-1e-4 mean 1301.26 3130.81 2844.16 645.98 3528.54 687.02 2738.99 1110.70 sd 207.30 483.89 355.01 12.79 364.95 23.77 280.79 152.21 stat 2(-)3(-)4(+)5(-) 7(-) 1(+) 4(+) 6(+) 8(+) 1(+) 4(+) 6(+) 8(+) 1(-)2(-)3(-)5(-) 7(-)8(-) 1(+) 4(+)6(+)7(+)8(+) 2(-)3(-) 5(-)7(-) 1(+) 4(+)5(-)6(+)8(+) 2(-)3(-)4(+)5(-) 7(-) 1-1e-6 mean 1467.31 3312.14 2925.18 824.92 3736.44 860.04 2921.90 1305.13 sd 88.43 461.95 287.31 14.87 358.40 23.81 253.16 137.54 stat 2(-)3(-)4(+)5(-)6(+)7(-) 1(+) 4(+) 6(+) 8(+) 1(+) 4(+)5(-)6(+) 8(+) 1(-)2(-)3(-)5(-) 7(-)8(-) 1(+) 3(+)4(+)6(+)7(+)8(+) 1(-)2(-)3(-) 5(-)7(-) 1(+) 4(+)5(-)6(+)8(+) 2(-)3(-)4(+)5(-) 7(-) 1-1e-8 mean 1637.87 3457.97 3119.10 967.84 3932.34 1004.05 3047.48 1429.27 sd 101.42 444.76 308.89 16.39 644.87 21.16 276.16 123.77 stat 2(-)3(-)4(+)5(-)6(+) 1(+) 4(+) 6(+) 8(+) 1(+) 4(+) 6(+) 8(+) 1(-)2(-)3(-)5(-) 7(-)8(-) 1(+) 4(+)6(+)7(+)8(+) 1(-)2(-)3(-) 5(-)7(-) 4(+)5(-)6(+)8(+) 2(-)3(-)4(+)5(-) 7(-) 1-1e-10 mean 1757.26 3577.38 3187.84 1088.74 4013.69 1132.67 3253.64 1518.76 sd 92.69 435.24 308.21 17.51 404.83 22.79 320.14 108.47 stat 2(-) 4(+)5(-)6(+)7(-) 1(+) 4(+) 6(+) 8(+) 4(+)5(-)6(+) 8(+) 1(-)2(-)3(-)5(-) 7(-)8(-) 1(+) 3(+)4(+)6(+) 8(+) 1(-)2(-)3(-) 5(-)7(-) 1(+) 4(+) 6(+)8(+) 2(-)3(-)4(+)5(-) 7(-) uncorr-1000 1-1e-2 mean 4367.27 11274.73 115227.81 544.19 117570.13 567.38 113976.02 1387.95 sd 534.29 1030.37 768.81 33.98 1093.98 29.32 543.33 203.14 stat 3(-)4(+)5(-)6(+)7(-) 3(-)4(+)5(-)6(+) 8(+) 1(+)2(+)4(+) 6(+) 8(+) 1(-)2(-)3(-)5(-) 7(-) 1(+)2(+) 4(+)6(+) 8(+) 1(-)2(-)3(-) 5(-)7(-) 1(+) 4(+) 6(+)8(+) 2(-)3(-) 5(-) 7(-) 1-1e-4 mean 4654.88 11500.95 115681.59 811.09 118176.55 834.48 114121.16 1648.06 sd 428.72 1020.79 849.62 37.45 890.57 32.06 602.02 177.80 stat 3(-)4(+)5(-)6(+)7(-) 3(-)4(+)5(-)6(+) 8(+) 1(+)2(+)4(+) 6(+) 8(+) 1(-)2(-)3(-)5(-) 7(-) 1(+)2(+) 4(+)6(+)7(+)8(+) 1(-)2(-)3(-) 5(-)7(-) 1(+) 4(+)5(-)6(+)8(+) 2(-)3(-) 5(-) 7(-) 1-1e-6 mean 4813.53 11703.68 116072.86 1007.34 118027.42 1029.49 114462.88 1844.50 sd 479.83 1018.55 746.71 37.10 986.81 30.95 529.31 158.24 stat 3(-)4(+)5(-)6(+)7(-) 3(-)4(+)5(-)6(+) 8(+) 1(+)2(+)4(+) 6(+) 8(+) 1(-)2(-)3(-)5(-) 7(-) 1(+)2(+) 4(+)6(+)7(+)8(+) 1(-)2(-)3(-) 5(-)7(-) 1(+) 4(+)5(-)6(+)8(+) 2(-)3(-) 5(-) 7(-) 1-1e-8 mean 5115.92 11860.72 116204.30 1170.30 118453.35 1193.39 114724.66 1993.44 sd 379.75 1005.40 665.01 32.47 796.31 28.94 541.78 158.91 stat 3(-)4(+)5(-)6(+)7(-) 3(-)4(+)5(-)6(+) 8(+) 1(+)2(+)4(+) 6(+) 8(+) 1(-)2(-)3(-)5(-) 7(-) 1(+)2(+) 4(+)6(+)7(+)8(+) 1(-)2(-)3(-) 5(-)7(-) 1(+) 4(+)5(-)6(+)8(+) 2(-)3(-) 5(-) 7(-) 1-1e-10 mean 5085.97 12016.70 116434.52 1315.48 118803.70 1336.52 114874.98 2127.80 sd 474.01 995.82 777.83 34.31 1124.06 31.05 661.96 163.35 stat 3(-)4(+)5(-)6(+)7(-) 3(-)4(+)5(-)6(+) 8(+) 1(+)2(+)4(+) 6(+) 8(+) 1(-)2(-)3(-)5(-) 7(-) 1(+)2(+) 4(+)6(+)7(+)8(+) 1(-)2(-)3(-) 5(-)7(-) 1(+) 4(+)5(-)6(+)8(+) 2(-)3(-) 5(-) 7(-)
file-n bsc-300 1-1e-2 mean 4873.54 4706.82 4555.65 5004.89 4830.48 8789.68 4495.56 5308.15 sd 312.79 176.18 195.10 386.77 235.74 567.13 205.74 245.06 stat 3(+) 6(-)7(+)8(-) 6(-) 8(-) 1(-) 4(-)5(-)6(-) 8(-) 3(+) 6(-)7(+) 3(+) 6(-)7(+)8(-) 1(+)2(+)3(+)4(+)5(+)7(+) 1(-) 4(-)5(-)6(-)8(-) 1(+)2(+)3(+) 5(+) 7(+) 1-1e-4 mean 6603.34 6297.61 5995.28 5859.96 6218.14 8789.68 5833.22 6763.95 sd 372.01 251.15 268.66 340.11 289.61 567.13 276.58 391.51 stat 3(+)4(+) 6(-)7(+) 4(+) 6(-)7(+) 1(-) 6(-) 8(-) 1(-)2(-) 6(-) 8(-) 6(-)7(+)8(-) 1(+)2(+)3(+)4(+)5(+)7(+) 1(-)2(-) 5(-)6(-)8(-) 3(+)4(+)5(+) 7(+) 1-1e-6 mean 7410.70 7192.88 6686.51 6487.92 6961.04 8789.68 6801.24 7399.12 sd 415.39 293.69 335.88 385.64 236.33 567.13 319.17 371.89 stat 3(+)4(+)5(+)6(-)7(+) 3(+)4(+) 6(-)7(+) 1(-)2(-) 6(-) 8(-) 1(-)2(-) 6(-) 8(-) 1(-) 6(-) 8(-) 1(+)2(+)3(+)4(+)5(+)7(+)8(+) 1(-)2(-) 6(-)8(-) 3(+)4(+)5(+)6(-)7(+) 1-1e-8 mean 8417.84 7800.49 7294.64 6967.00 7637.16 8789.68 7337.47 7534.65 sd 626.99 325.26 333.29 401.58 343.07 567.13 395.75 389.70 stat 3(+)4(+)5(+) 7(+)8(+) 3(+)4(+) 6(-)7(+) 1(-)2(-) 6(-) 1(-)2(-) 5(-)6(-) 8(-) 1(-) 4(+)6(-) 2(+)3(+)4(+)5(+)7(+)8(+) 1(-)2(-) 6(-) 1(-) 4(+) 6(-) 1-1e-10 mean 8947.62 8271.41 7664.27 7351.31 7949.92 8789.68 7623.39 7674.11 sd 583.21 351.73 399.96 429.33 309.59 567.13 358.85 341.76 stat 3(+)4(+)5(+) 7(+)8(+) 3(+)4(+) 7(+)8(+) 1(-)2(-) 6(-) 1(-)2(-) 5(-)6(-) 1(-) 4(+)6(-) 3(+)4(+)5(+)7(+)8(+) 1(-)2(-) 6(-) 1(-)2(-) 6(-) bsc-500 1-1e-2 mean 6731.78 6433.90 44707.22 6181.96 83277.14 12798.31 89619.71 7327.00 sd 510.52 211.48 86055.67 349.27 108570.93 852.74 111178.26 610.82 stat 5(-)6(-) 3(-) 5(-)6(-) 8(-) 2(+)4(+) 6(+) 3(-)5(-)6(-)7(-)8(-) 1(+)2(+) 4(+) 7(-) 1(+)2(+)3(-)4(+) 7(-)8(+) 4(+)5(+)6(+) 2(+) 4(+) 6(-) 1-1e-4 mean 9282.33 8713.80 227251.07 7615.21 244296.73 12798.31 218783.94 8622.88 sd 693.03 279.60 73934.00 297.52 44181.66 852.74 83951.52 350.56 stat 3(-)4(+)5(-) 7(-) 3(-)4(+)5(-)6(-)7(-) 1(+)2(+)4(+) 8(+) 1(-)2(-)3(-)5(-)6(-)7(-) 1(+)2(+) 4(+)6(+)7(+)8(+) 2(+) 4(+)5(-) 8(+) 1(+)2(+) 4(+)5(-) 8(+) 3(-) 5(-)6(-)7(-) 1-1e-6 mean 10758.66 10109.86 264745.31 8549.60 265350.93 12798.31 264359.27 9367.54 sd 841.76 314.86 446.52 233.28 410.08 852.74 293.72 365.36 stat 3(-)4(+)5(-) 7(-) 3(-)4(+)5(-) 7(-) 1(+)2(+)4(+) 6(+) 8(+) 1(-)2(-)3(-)5(-)6(-)7(-) 1(+)2(+) 4(+)6(+) 8(+) 3(-)4(+)5(-) 8(+) 1(+)2(+) 4(+) 8(+) 3(-) 5(-)6(-)7(-) 1-1e-8 mean 12376.35 11116.00 275642.49 9341.24 276169.95 12798.31 275145.56 9981.70 sd 1662.56 344.80 266.81 247.51 530.10 852.74 362.65 324.47 stat 3(-)4(+)5(-) 7(-)8(+) 3(-)4(+)5(-) 7(-) 1(+)2(+)4(+) 6(+) 8(+) 1(-)2(-)3(-)5(-)6(-)7(-) 1(+)2(+) 4(+)6(+) 8(+) 3(-)4(+)5(-) 8(+) 1(+)2(+) 4(+) 8(+) 1(-) 3(-) 5(-)6(-)7(-) 1-1e-10 mean 31987.09 11927.21 284992.96 9984.16 285634.13 12798.31 284632.02 10528.95 sd 70083.10 365.11 485.22 252.90 608.10 852.74 540.20 303.69 stat 3(-)4(+)5(-) 8(+) 3(-)4(+)5(-) 7(-) 1(+)2(+)4(+) 6(+) 8(+) 1(-)2(-)3(-)5(-)6(-)7(-) 1(+)2(+) 4(+)6(+) 8(+) 3(-)4(+)5(-)7(-)8(+) 2(+) 4(+) 6(+)8(+) 1(-) 3(-) 5(-)6(-)7(-) bsc-1000 1-1e-2 mean 13595.41 12773.13 458872.46 11095.20 460805.66 22740.74 457821.24 13909.94 sd 3270.42 508.68 1124.56 461.13 918.74 1157.58 883.66 595.32 stat 3(-) 5(-)6(-)7(-) 3(-) 5(-)6(-)7(-) 1(+)2(+)4(+) 6(+) 8(+) 3(-)5(-)6(-)7(-)8(-) 1(+)2(+) 4(+)6(+) 8(+) 1(+)2(+)3(-)4(+)5(-) 1(+)2(+) 4(+) 8(+) 3(-)4(+)5(-) 7(-) 1-1e-4 mean 18139.60 16860.64 532355.52 12943.76 580530.56 22740.74 485018.27 16602.29 sd 2720.30 532.38 141052.02 289.94 188216.60 1157.58 1055.03 628.97 stat 3(-)4(+)5(-) 7(-) 3(-)4(+)5(-) 7(-) 1(+)2(+)4(+) 6(+) 8(+) 1(-)2(-)3(-)5(-)6(-)7(-) 1(+)2(+) 4(+)6(+) 8(+) 3(-)4(+)5(-) 8(+) 1(+)2(+) 4(+) 8(+) 3(-) 5(-)6(-)7(-) 1-1e-6 mean 21830.95 19521.54 809523.08 14241.93 874978.23 22740.74 505075.27 17179.08 sd 3863.69 579.07 234924.46 182.73 205575.48 1157.58 953.16 454.62 stat 3(-)4(+)5(-) 7(-)8(+) 3(-)4(+)5(-) 7(-) 1(+)2(+)4(+) 6(+) 8(+) 1(-)2(-)3(-)5(-)6(-)7(-) 1(+)2(+) 4(+)6(+) 8(+) 3(-)4(+)5(-) 8(+) 1(+)2(+) 4(+) 8(+) 1(-) 3(-) 5(-)6(-)7(-) 1-1e-8 mean 23333.71 21523.01 917130.82 15675.87 935062.72 22740.74 521562.68 18016.43 sd 2512.42 600.73 200169.38 178.65 186762.68 1157.58 1019.38 428.19 stat 3(-)4(+)5(-) 8(+) 3(-)4(+)5(-) 7(-) 1(+)2(+)4(+) 6(+) 8(+) 1(-)2(-)3(-)5(-)6(-)7(-) 1(+)2(+) 4(+)6(+) 8(+) 3(-)4(+)5(-) 8(+) 2(+) 4(+) 8(+) 1(-) 3(-) 5(-)6(-)7(-) 1-1e-10 mean 24859.15 23222.95 1025299.60 16838.80 1026954.38 22740.74 536197.20 18887.38 sd 2717.65 644.56 92125.53 203.96 92305.47 1157.58 1156.74 423.54 stat 3(-)4(+)5(-) 8(+) 3(-)4(+)5(-) 7(-)8(+) 1(+)2(+)4(+) 6(+) 8(+) 1(-)2(-)3(-)5(-)6(-)7(-) 1(+)2(+) 4(+)6(+) 8(+) 3(-)4(+)5(-)7(-) 2(+) 4(+) 6(+)8(+) 1(-)2(-)3(-) 5(-) 7(-)
file-n uncorr-300 1-1e-2 mean 5378.31 5253.42 5218.89 5033.43 5544.74 12079.86 5464.15 5213.17 sd 229.76 81.18 183.15 234.74 237.74 1755.28 176.96 194.72 stat 4(+) 6(-) 5(-)6(-)7(-) 5(-)6(-)7(-) 1(-) 5(-)6(-)7(-) 2(+)3(+)4(+)6(-) 8(+) 1(+)2(+)3(+)4(+)5(+)7(+)8(+) 2(+)3(+)4(+) 6(-)8(+) 5(-)6(-)7(-) 1-1e-4 mean 7801.37 7506.02 7268.21 6866.66 7608.41 12079.86 7622.53 7189.44 sd 394.61 113.61 204.73 171.74 301.42 1755.28 285.96 269.46 stat 3(+)4(+) 6(-) 8(+) 4(+) 6(-) 8(+) 1(-) 5(-)6(-)7(-) 1(-)2(-) 5(-)6(-)7(-) 3(+)4(+)6(-) 8(+) 1(+)2(+)3(+)4(+)5(+)7(+)8(+) 3(+)4(+) 6(-)8(+) 1(-)2(-) 5(-)6(-)7(-) 1-1e-6 mean 9379.97 8898.54 8644.44 8025.61 8843.28 12079.86 8855.50 8345.77 sd 657.00 172.62 238.36 228.97 396.36 1755.28 280.68 368.13 stat 3(+)4(+) 8(+) 4(+) 6(-) 8(+) 1(-) 4(+) 6(-) 1(-)2(-)3(-)5(-)6(-)7(-) 4(+)6(-) 8(+) 2(+)3(+)4(+)5(+)7(+)8(+) 4(+) 6(-)8(+) 1(-)2(-) 5(-)6(-)7(-) 1-1e-8 mean 10589.84 9906.67 9451.58 8875.85 9785.23 12081.50 9734.49 9180.08 sd 748.90 224.94 376.58 276.12 395.11 1752.96 337.15 368.09 stat 3(+)4(+)5(+) 7(+)8(+) 3(+)4(+) 6(-) 8(+) 1(-)2(-)4(+) 6(-) 1(-)2(-)3(-)5(-)6(-)7(-) 1(-) 4(+)6(-) 8(+) 2(+)3(+)4(+)5(+)7(+)8(+) 1(-) 4(+) 6(-)8(+) 1(-)2(-) 5(-)6(-)7(-) 1-1e-10 mean 11765.71 10674.52 10241.54 9523.59 10428.13 12089.96 10371.74 9741.40 sd 932.62 260.89 358.74 298.68 499.96 1743.27 492.36 386.35 stat 3(+)4(+)5(+) 7(+)8(+) 4(+) 8(+) 1(-) 4(+) 6(-) 1(-)2(-)3(-)5(-)6(-)7(-) 1(-) 4(+)6(-) 8(+) 3(+)4(+)5(+)7(+)8(+) 1(-) 4(+) 6(-)8(+) 1(-)2(-) 5(-)6(-)7(-) uncorr-500 1-1e-2 mean 8349.73 7954.14 15185.31 7414.60 14005.50 18665.51 11342.53 7571.25 sd 561.76 231.91 17677.61 354.41 14732.37 1820.32 10625.10 255.07 stat 3(-)4(+)5(-)6(-) 8(+) 3(-) 5(-)6(-)7(-) 1(+)2(+)4(+) 6(-) 8(+) 1(-) 3(-)5(-)6(-)7(-) 1(+)2(+) 4(+) 8(+) 1(+)2(+)3(+)4(+) 7(+)8(+) 2(+) 4(+) 6(-)8(+) 1(-) 3(-) 5(-)6(-)7(-) 1-1e-4 mean 12520.41 11215.75 51805.46 9904.67 65054.11 18665.51 62203.95 10308.82 sd 1000.97 302.70 30367.06 258.89 22985.21 1820.32 25139.90 265.55 stat 4(+)5(-) 7(-)8(+) 3(-)4(+)5(-)6(-)7(-) 2(+)4(+) 8(+) 1(-)2(-)3(-)5(-)6(-)7(-) 1(+)2(+) 4(+) 8(+) 2(+) 4(+) 8(+) 1(+)2(+) 4(+) 8(+) 1(-) 3(-) 5(-)6(-)7(-) 1-1e-6 mean 15208.84 13270.43 66466.37 11658.66 73639.30 18665.51 72823.83 12026.63 sd 2090.12 348.64 26207.77 278.97 19818.03 1820.32 19854.60 317.45 stat 3(-)4(+)5(-) 7(-)8(+) 3(-)4(+)5(-)6(-)7(-) 1(+)2(+)4(+) 8(+) 1(-)2(-)3(-)5(-)6(-)7(-) 1(+)2(+) 4(+)6(+) 8(+) 2(+) 4(+)5(-) 8(+) 1(+)2(+) 4(+) 8(+) 1(-) 3(-) 5(-)6(-)7(-) 1-1e-8 mean 17191.00 14824.11 80958.92 12998.90 84007.09 18665.51 81108.61 13343.59 sd 2775.69 394.38 12220.29 315.47 706.35 1820.32 12244.05 316.55 stat 3(-)4(+)5(-) 7(-)8(+) 3(-) 5(-) 7(-) 1(+)2(+)4(+) 8(+) 1(-) 3(-)5(-)6(-)7(-) 1(+)2(+) 4(+)6(+) 8(+) 4(+)5(-)7(-)8(+) 1(+)2(+) 4(+) 6(+)8(+) 1(-) 3(-) 5(-)6(-)7(-) 1-1e-10 mean 19228.24 16075.16 86650.07 14053.46 87355.40 18665.51 84378.72 14416.09 sd 3037.88 427.22 408.77 376.04 737.92 1820.32 12865.46 342.38 stat 3(-)4(+)5(-) 7(-)8(+) 3(-)4(+)5(-) 7(-) 1(+)2(+)4(+) 6(+) 8(+) 1(-)2(-)3(-)5(-)6(-)7(-) 1(+)2(+) 4(+)6(+) 8(+) 3(-)4(+)5(-)7(-)8(+) 1(+)2(+) 4(+) 6(+)8(+) 1(-) 3(-) 5(-)6(-)7(-) uncorr-1000 1-1e-2 mean 15473.47 14554.12 134959.53 12278.71 137093.81 34018.86 132769.74 12968.01 sd 1223.56 521.10 1020.64 570.54 1124.20 3297.87 563.52 598.58 stat 3(-)4(+)5(-) 7(-)8(+) 3(-)4(+)5(-) 7(-) 1(+)2(+)4(+) 6(+) 8(+) 1(-)2(-)3(-)5(-)6(-)7(-) 1(+)2(+) 4(+)6(+)7(+)8(+) 3(-)4(+)5(-) 8(+) 1(+)2(+) 4(+)5(-) 8(+) 1(-) 3(-) 5(-)6(-)7(-) 1-1e-4 mean 21955.60 19500.36 157870.90 14992.80 163908.29 34018.86 143510.65 16486.59 sd 1905.79 526.14 36364.89 302.47 41015.01 3297.87 726.30 479.80 stat 3(-)4(+)5(-) 7(-)8(+) 3(-)4(+)5(-)6(-)7(-) 1(+)2(+)4(+) 6(+) 8(+) 1(-)2(-)3(-)5(-)6(-)7(-) 1(+)2(+) 4(+)6(+) 8(+) 2(+)3(-)4(+)5(-) 8(+) 1(+)2(+) 4(+) 8(+) 1(-) 3(-) 5(-)6(-)7(-) 1-1e-6 mean 25902.07 22866.60 190522.09 17460.43 229298.52 34018.86 150824.51 18893.61 sd 2040.19 619.32 57458.18 227.70 61599.16 3297.87 775.68 507.08 stat 3(-)4(+)5(-) 7(-)8(+) 3(-)4(+)5(-)6(-)7(-) 1(+)2(+)4(+) 6(+) 8(+) 1(-)2(-)3(-)5(-)6(-)7(-) 1(+)2(+) 4(+)6(+) 8(+) 2(+)3(-)4(+)5(-) 8(+) 1(+)2(+) 4(+) 8(+) 1(-) 3(-) 5(-)6(-)7(-) 1-1e-8 mean 29820.79 25478.05 265217.20 19426.59 254404.51 34018.86 156913.44 20754.03 sd 3225.46 639.68 47696.97 264.76 57081.67 3297.87 529.84 482.48 stat 3(-)4(+)5(-) 7(-)8(+) 3(-)4(+)5(-) 7(-) 1(+)2(+)4(+) 6(+) 8(+) 1(-)2(-)3(-)5(-)6(-)7(-) 1(+)2(+) 4(+)6(+) 8(+) 3(-)4(+)5(-) 8(+) 1(+)2(+) 4(+) 8(+) 1(-) 3(-) 5(-)6(-)7(-) 1-1e-10 mean 31936.35 27665.61 281695.86 21097.45 292226.80 34018.86 162514.16 22241.57 sd 3277.00 682.69 38819.32 264.20 23632.29 3297.87 860.32 352.25 stat 3(-)4(+)5(-) 8(+) 3(-)4(+)5(-) 7(-) 1(+)2(+)4(+) 6(+) 8(+) 1(-)2(-)3(-)5(-)6(-)7(-) 1(+)2(+) 4(+)6(+)7(+)8(+) 3(-)4(+)5(-) 8(+) 2(+) 4(+)5(-) 8(+) 1(-) 3(-) 5(-)6(-)7(-)
file-n bsc-300 1-1e-2 mean 471.56 669.23 49882.01 260.07 48775.29 333.68 25679.81 749.70 sd 138.52 95.08 178.39 9.65 6152.27 64.78 100.34 95.79 stat 3(-)4(+)5(-) 7(-) 3(-)4(+)5(-)6(+) 1(+)2(+)4(+) 6(+) 8(+) 1(-)2(-)3(-)5(-) 7(-)8(-) 1(+)2(+) 4(+)6(+)7(+)8(+) 2(-)3(-) 5(-)7(-)8(-) 1(+) 4(+)5(-)6(+) 3(-)4(+)5(-)6(+) 1-1e-4 mean 561.47 779.34 49279.87 373.66 49709.52 447.93 25793.21 826.53 sd 44.77 99.40 4445.57 12.51 4343.65 63.59 89.38 89.85 stat 3(-)4(+)5(-) 7(-) 3(-)4(+)5(-)6(+) 1(+)2(+)4(+) 6(+) 8(+) 1(-)2(-)3(-)5(-) 7(-)8(-) 1(+)2(+) 4(+)6(+)7(+)8(+) 2(-)3(-) 5(-)7(-)8(-) 1(+) 4(+)5(-)6(+) 3(-)4(+)5(-)6(+) 1-1e-6 mean 654.84 857.24 48592.85 461.56 48953.89 531.60 25915.66 879.88 sd 75.34 100.52 6167.05 12.95 6130.71 62.60 114.01 78.84 stat 3(-)4(+)5(-) 7(-) 3(-)4(+)5(-)6(+) 1(+)2(+)4(+) 6(+) 8(+) 1(-)2(-)3(-)5(-) 7(-)8(-) 1(+)2(+) 4(+)6(+)7(+)8(+) 2(-)3(-) 5(-)7(-)8(-) 1(+) 4(+)5(-)6(+) 3(-)4(+)5(-)6(+) 1-1e-8 mean 725.64 920.23 49496.17 531.12 49078.61 601.53 25992.48 934.54 sd 77.07 103.15 4392.15 14.20 6135.88 65.48 103.15 65.36 stat 3(-)4(+)5(-) 7(-) 3(-)4(+)5(-)6(+) 1(+)2(+)4(+) 6(+) 8(+) 1(-)2(-)3(-)5(-) 7(-)8(-) 1(+)2(+) 4(+)6(+)7(+)8(+) 2(-)3(-) 5(-)7(-)8(-) 1(+) 4(+)5(-)6(+) 3(-)4(+)5(-)6(+) 1-1e-10 mean 754.16 981.15 47999.39 594.37 49163.25 666.31 26124.05 977.18 sd 48.76 105.73 7400.77 16.42 6115.44 68.14 112.07 58.55 stat 3(-) 5(-) 7(-) 3(-)4(+)5(-)6(+) 1(+)2(+)4(+) 6(+) 8(+) 2(-)3(-)5(-) 7(-)8(-) 1(+)2(+) 4(+)6(+) 8(+) 2(-)3(-) 5(-)7(-)8(-) 1(+) 4(+) 6(+) 3(-)4(+)5(-)6(+) bsc-500 1-1e-2 mean 1095.32 1981.82 145346.74 445.14 139613.09 513.52 43638.94 927.68 sd 138.88 212.39 20481.68 27.76 26674.38 66.10 188.52 61.20 stat 3(-)4(+)5(-)6(+)7(-) 3(-)4(+)5(-)6(+) 1(+)2(+)4(+) 6(+) 8(+) 1(-)2(-)3(-)5(-) 7(-)8(-) 1(+)2(+) 4(+)6(+) 8(+) 1(-)2(-)3(-) 5(-)7(-) 1(+) 4(+) 6(+)8(+) 3(-)4(+)5(-) 7(-) 1-1e-4 mean 1216.47 2114.01 145699.58 593.22 130493.70 664.53 43823.52 1028.23 sd 163.50 208.60 20452.16 27.83 26701.29 70.21 181.99 56.04 stat 3(-)4(+)5(-)6(+)7(-) 3(-)4(+)5(-)6(+) 8(+) 1(+)2(+)4(+) 6(+) 8(+) 1(-)2(-)3(-)5(-) 7(-)8(-) 1(+)2(+) 4(+)6(+) 8(+) 1(-)2(-)3(-) 5(-)7(-) 1(+) 4(+) 6(+)8(+) 2(-)3(-)4(+)5(-) 7(-) 1-1e-6 mean 1282.55 2214.79 140624.80 702.71 145548.29 777.25 43903.10 1105.71 sd 127.50 205.89 24858.28 27.77 22992.63 73.11 255.48 49.94 stat 3(-)4(+)5(-)6(+)7(-) 3(-)4(+)5(-)6(+) 8(+) 1(+)2(+)4(+) 6(+) 8(+) 1(-)2(-)3(-)5(-) 7(-)8(-) 1(+)2(+) 4(+)6(+) 8(+) 1(-)2(-)3(-) 5(-)7(-) 1(+) 4(+) 6(+)8(+) 2(-)3(-)4(+)5(-) 7(-) 1-1e-8 mean 1355.92 2300.23 151405.32 796.03 141583.65 865.54 43952.32 1170.15 sd 135.31 208.75 19811.20 27.43 22585.20 69.02 198.14 46.64 stat 3(-)4(+)5(-)6(+)7(-) 3(-)4(+)5(-)6(+) 8(+) 1(+)2(+)4(+) 6(+) 8(+) 1(-)2(-)3(-)5(-) 7(-)8(-) 1(+)2(+) 4(+)6(+) 8(+) 1(-)2(-)3(-) 5(-)7(-) 1(+) 4(+) 6(+)8(+) 2(-)3(-)4(+)5(-) 7(-) 1-1e-10 mean 1477.37 2372.05 139441.00 875.63 141714.76 949.34 44138.90 1222.61 sd 121.08 206.88 26775.45 28.65 22461.97 70.57 212.92 42.37 stat 3(-)4(+)5(-)6(+)7(-) 3(-)4(+)5(-)6(+) 8(+) 1(+)2(+)4(+) 6(+) 8(+) 1(-)2(-)3(-)5(-) 7(-)8(-) 1(+)2(+) 4(+)6(+) 8(+) 1(-)2(-)3(-) 5(-)7(-) 1(+) 4(+) 6(+)8(+) 2(-)3(-)4(+)5(-) 7(-) bsc-1000 1-1e-2 mean 84054.07 5774.71 568829.29 82097.22 600727.03 82112.95 90638.03 82699.72 sd 399.09 606.39 83145.07 151.29 72485.84 123.72 524.51 150.89 stat 2(+)3(-)4(+)5(-)6(+) 1(-)3(-) 5(-) 7(-)8(-) 1(+)2(+)4(+) 6(+) 8(+) 1(-) 3(-)5(-) 7(-) 1(+)2(+) 4(+)6(+)7(+)8(+) 1(-) 3(-) 5(-)7(-) 2(+) 4(+)5(-)6(+)8(+) 2(+)3(-) 5(-) 7(-) 1-1e-4 mean 84444.28 5935.12 596623.46 82325.59 614985.49 82345.12 90703.33 82862.99 sd 543.99 605.11 30921.12 153.00 39955.42 125.75 553.76 143.13 stat 2(+)3(-)4(+)5(-)6(+) 1(-)3(-) 5(-) 7(-)8(-) 1(+)2(+)4(+) 6(+) 8(+) 1(-) 3(-)5(-) 7(-) 1(+)2(+) 4(+)6(+)7(+)8(+) 1(-) 3(-) 5(-)7(-) 2(+) 4(+)5(-)6(+)8(+) 2(+)3(-) 5(-) 7(-) 1-1e-6 mean 84705.31 6054.26 561871.72 82491.62 572099.17 82517.14 91150.65 82992.15 sd 680.55 607.16 90383.65 156.52 88426.20 126.94 499.34 142.16 stat 2(+)3(-)4(+)5(-)6(+) 1(-)3(-) 5(-) 7(-)8(-) 1(+)2(+)4(+) 6(+) 8(+) 1(-) 3(-)5(-) 7(-) 1(+)2(+) 4(+)6(+) 8(+) 1(-) 3(-) 5(-)7(-) 2(+) 4(+) 6(+)8(+) 2(+)3(-) 5(-) 7(-) 1-1e-8 mean 84730.48 6153.93 596545.79 82632.97 553147.35 82661.81 91319.45 83083.20 sd 570.78 604.16 80675.94 154.35 113845.87 124.92 549.43 140.38 stat 2(+)3(-)4(+)5(-)6(+) 1(-)3(-) 5(-) 7(-)8(-) 1(+)2(+)4(+) 6(+) 8(+) 1(-) 3(-)5(-) 7(-) 1(+)2(+) 4(+)6(+) 8(+) 1(-) 3(-) 5(-)7(-) 2(+) 4(+) 6(+)8(+) 2(+)3(-) 5(-) 7(-) 1-1e-10 mean 84893.97 6240.19 575850.62 82754.47 588979.02 82784.03 91389.10 83161.27 sd 502.41 601.47 96166.66 153.55 69585.16 125.23 446.02 144.87 stat 2(+)3(-)4(+)5(-)6(+) 1(-)3(-) 5(-) 7(-)8(-) 1(+)2(+)4(+) 6(+) 8(+) 1(-) 3(-)5(-) 7(-) 1(+)2(+) 4(+)6(+) 8(+) 1(-) 3(-) 5(-)7(-) 2(+) 4(+) 6(+)8(+) 2(+)3(-) 5(-) 7(-)
file-n uncorr-300 1-1e-2 mean 747.78 1131.17 14316.99 550.00 15358.32 1460.62 8184.91 804.09 sd 101.38 119.98 1231.78 466.73 2005.89 2318.35 189.47 126.23 stat 3(-) 5(-) 7(-) 3(-)4(+)5(-)6(-) 1(+)2(+)4(+) 6(+) 8(+) 2(-)3(-)5(-) 7(-) 1(+)2(+) 4(+)6(+) 8(+) 2(+)3(-) 5(-)7(-) 1(+) 4(+) 6(+)8(+) 3(-) 5(-) 7(-) 1-1e-4 mean 971.79 1305.80 14193.68 790.40 15720.24 1757.84 8324.45 973.24 sd 132.24 117.03 1610.42 596.56 1366.34 2443.66 122.71 121.14 stat 3(-) 5(-) 7(-) 3(-)4(+)5(-)6(-) 1(+)2(+)4(+) 6(+) 8(+) 2(-)3(-)5(-) 7(-) 1(+)2(+) 4(+)6(+)7(+)8(+) 2(+)3(-) 5(-)7(-) 1(+) 4(+)5(-)6(+)8(+) 3(-) 5(-) 7(-) 1-1e-6 mean 1107.01 1437.01 14710.15 962.70 15490.11 1950.77 8485.78 1092.89 sd 135.26 116.75 1335.60 644.88 916.24 2554.75 128.39 106.68 stat 3(-) 5(-) 7(-) 3(-)4(+)5(-)6(-) 1(+)2(+)4(+) 6(+) 8(+) 2(-)3(-)5(-) 7(-) 1(+)2(+) 4(+)6(+)7(+)8(+) 2(+)3(-) 5(-)7(-) 1(+) 4(+)5(-)6(+)8(+) 3(-) 5(-) 7(-) 1-1e-8 mean 1245.65 1546.01 14751.42 1097.70 15643.03 2101.12 8587.23 1181.93 sd 194.03 122.06 1294.48 700.02 2733.64 2540.95 155.86 106.02 stat 3(-) 5(-) 7(-) 3(-)4(+)5(-)6(-) 1(+)2(+)4(+) 6(+) 8(+) 2(-)3(-)5(-) 7(-) 1(+)2(+) 4(+)6(+) 8(+) 2(+)3(-) 5(-)7(-) 1(+) 4(+) 6(+)8(+) 3(-) 5(-) 7(-) 1-1e-10 mean 1331.50 1644.97 14985.41 1241.57 16358.38 2243.75 8688.91 1263.18 sd 162.47 114.85 1399.73 762.68 2501.77 2581.30 121.69 103.85 stat 3(-) 5(-) 7(-) 3(-)4(+)5(-)6(-) 1(+)2(+)4(+) 6(+) 8(+) 2(-)3(-)5(-) 7(-) 1(+)2(+) 4(+)6(+) 8(+) 2(+)3(-) 5(-)7(-) 1(+) 4(+) 6(+)8(+) 3(-) 5(-) 7(-) uncorr-500 1-1e-2 mean 1890.29 3190.42 38756.37 979.52 40303.12 2384.07 14469.33 1192.89 sd 151.59 435.26 5324.86 847.31 5335.81 4436.02 241.55 108.95 stat 3(-)4(+)5(-) 7(-) 3(-)4(+)5(-)6(+) 8(+) 1(+)2(+)4(+) 6(+) 8(+) 1(-)2(-)3(-)5(-) 7(-) 1(+)2(+) 4(+)6(+) 8(+) 2(-)3(-) 5(-)7(-) 1(+) 4(+) 6(+)8(+) 2(-)3(-) 5(-) 7(-) 1-1e-4 mean 2116.52 3434.21 38469.42 1270.33 41352.48 2771.11 14735.96 1432.37 sd 168.33 431.51 6335.02 1011.20 6844.43 4651.41 216.98 129.47 stat 3(-)4(+)5(-) 7(-) 3(-)4(+)5(-)6(+) 8(+) 1(+)2(+)4(+) 6(+) 8(+) 1(-)2(-)3(-)5(-) 7(-) 1(+)2(+) 4(+)6(+) 8(+) 2(-)3(-) 5(-)7(-) 1(+) 4(+) 6(+)8(+) 2(-)3(-) 5(-) 7(-) 1-1e-6 mean 2305.79 3607.34 41450.19 1482.21 41700.69 3021.76 14996.47 1604.24 sd 160.07 433.79 6361.82 1051.06 4921.69 4717.98 272.50 112.61 stat 3(-)4(+)5(-) 7(-) 3(-)4(+)5(-)6(+) 8(+) 1(+)2(+)4(+) 6(+) 8(+) 1(-)2(-)3(-)5(-) 7(-) 1(+)2(+) 4(+)6(+) 8(+) 2(-)3(-) 5(-)7(-) 1(+) 4(+) 6(+)8(+) 2(-)3(-) 5(-) 7(-) 1-1e-8 mean 2486.71 3756.79 40693.15 1685.62 40428.83 3226.35 15154.45 1744.00 sd 186.72 439.48 4952.91 1059.30 7685.54 4827.63 313.03 100.67 stat 3(-)4(+)5(-) 7(-) 3(-)4(+)5(-)6(+) 8(+) 1(+)2(+)4(+) 6(+) 8(+) 1(-)2(-)3(-)5(-) 7(-) 1(+)2(+) 4(+)6(+) 8(+) 2(-)3(-) 5(-)7(-) 1(+) 4(+) 6(+)8(+) 2(-)3(-) 5(-) 7(-) 1-1e-10 mean 2671.37 3880.02 39733.96 1836.20 44466.16 3424.78 15264.52 1854.06 sd 213.87 440.46 5465.97 1109.93 6536.96 4957.65 259.03 96.75 stat 3(-)4(+)5(-) 7(-) 3(-)4(+)5(-)6(+) 8(+) 1(+)2(+)4(+) 6(+) 8(+) 1(-)2(-)3(-)5(-) 7(-) 1(+)2(+) 4(+)6(+) 8(+) 2(-)3(-) 5(-)7(-) 1(+) 4(+) 6(+)8(+) 2(-)3(-) 5(-) 7(-) uncorr-10000 1-1e-2 mean 26496.97 11540.86 160393.91 22798.30 160657.35 22953.41 32474.37 23490.09 sd 419.74 1003.30 20565.40 140.73 18704.81 114.27 633.99 134.57 stat 2(+)3(-)4(+)5(-)6(+) 1(-)3(-) 5(-) 7(-)8(-) 1(+)2(+)4(+) 6(+) 8(+) 1(-) 3(-)5(-) 7(-) 1(+)2(+) 4(+)6(+) 8(+) 1(-) 3(-) 5(-)7(-) 2(+) 4(+) 6(+)8(+) 2(+)3(-) 5(-) 7(-) 1-1e-4 mean 26901.74 11786.37 158912.51 23109.19 163186.92 23265.28 32800.65 23751.13 sd 372.32 1008.26 23705.46 140.12 14485.00 110.14 633.60 158.81 stat 2(+)3(-)4(+)5(-)6(+) 1(-)3(-) 5(-) 7(-)8(-) 1(+)2(+)4(+) 6(+) 8(+) 1(-) 3(-)5(-) 7(-) 1(+)2(+) 4(+)6(+) 8(+) 1(-) 3(-) 5(-)7(-) 2(+) 4(+) 6(+)8(+) 2(+)3(-) 5(-) 7(-) 1-1e-6 mean 26932.93 11973.27 163716.94 23340.86 162137.66 23503.48 32904.41 23949.41 sd 399.36 1005.53 16707.97 140.87 22142.73 111.63 841.24 159.07 stat 2(+)3(-)4(+)5(-)6(+) 1(-)3(-) 5(-) 7(-)8(-) 1(+)2(+)4(+) 6(+) 8(+) 1(-) 3(-)5(-) 7(-) 1(+)2(+) 4(+)6(+) 8(+) 1(-) 3(-) 5(-)7(-) 2(+) 4(+) 6(+)8(+) 2(+)3(-) 5(-) 7(-) 1-1e-8 mean 27294.50 12133.79 155237.65 23530.48 162442.91 23689.80 33246.50 24112.30 sd 447.08 1008.84 20424.92 138.44 21483.66 109.28 746.24 171.01 stat 2(+)3(-)4(+)5(-)6(+) 1(-)3(-) 5(-) 7(-)8(-) 1(+)2(+)4(+) 6(+) 8(+) 1(-) 3(-)5(-) 7(-) 1(+)2(+) 4(+)6(+)7(+)8(+) 1(-) 3(-) 5(-)7(-) 2(+) 4(+)5(-)6(+)8(+) 2(+)3(-) 5(-) 7(-) 1-1e-10 mean 27330.96 12269.96 162390.09 23697.02 163530.45 23901.74 33248.23 24255.50 sd 301.40 990.13 21734.42 138.59 21367.66 263.59 747.42 164.55 stat 2(+)3(-)4(+)5(-)6(+) 1(-)3(-) 5(-)6(-)7(-)8(-) 1(+)2(+)4(+) 6(+) 8(+) 1(-) 3(-)5(-) 7(-) 1(+)2(+) 4(+)6(+) 8(+) 1(-)2(+)3(-) 5(-)7(-) 2(+) 4(+) 6(+)8(+) 2(+)3(-) 5(-) 7(-)
file-n bsc-300 1-1e-2 mean 5153.53 4847.37 84486.71 5727.18 85760.33 10213.13 34471.94 5981.36 sd 455.72 628.07 12153.53 648.17 11410.73 1268.16 473.22 861.48 stat 3(-) 5(-)6(-)7(-) 3(-) 5(-)6(-)7(-) 1(+)2(+)4(+) 6(+) 8(+) 3(-)5(-)6(-)7(-) 1(+)2(+) 4(+)6(+) 8(+) 1(+)2(+)3(-)4(+)5(-) 1(+)2(+) 4(+) 8(+) 3(-) 5(-) 7(-) 1-1e-4 mean 9910.64 6440.24 95311.36 6613.88 94437.52 10213.13 38738.81 7644.74 sd 12336.03 861.48 11744.14 611.99 12562.29 1268.16 690.46 963.62 stat 3(-) 5(-)6(-)7(-) 3(-) 5(-)6(-)7(-) 1(+)2(+)4(+) 6(+) 8(+) 3(-)5(-)6(-)7(-) 1(+)2(+) 4(+)6(+) 8(+) 1(+)2(+)3(-)4(+)5(-) 1(+)2(+) 4(+) 8(+) 3(-) 5(-) 7(-) 1-1e-6 mean 8855.94 7357.27 110228.29 7288.69 106365.04 10213.13 41374.30 8358.04 sd 5924.97 1007.80 17740.90 669.13 13791.75 1268.16 823.05 1165.30 stat 3(-) 5(-)6(-)7(-) 3(-) 5(-)6(-)7(-) 1(+)2(+)4(+) 6(+) 8(+) 3(-)5(-)6(-)7(-) 1(+)2(+) 4(+)6(+) 8(+) 1(+)2(+)3(-)4(+)5(-) 1(+)2(+) 4(+) 8(+) 3(-) 5(-) 7(-) 1-1e-8 mean 10696.33 8000.03 114695.23 7783.96 117567.22 10213.13 43808.33 8675.22 sd 8924.47 1101.05 17943.02 692.94 17252.15 1268.16 1238.83 1251.80 stat 3(-) 5(-) 7(-) 3(-) 5(-)6(-)7(-) 1(+)2(+)4(+) 6(+) 8(+) 3(-)5(-)6(-)7(-) 1(+)2(+) 4(+)6(+) 8(+) 2(+)3(-)4(+)5(-) 1(+)2(+) 4(+) 8(+) 3(-) 5(-) 7(-) 1-1e-10 mean 15204.33 8568.53 137191.85 8196.95 126687.47 10213.76 45759.48 8855.60 sd 13312.27 1115.29 17608.55 735.38 24080.39 1266.27 989.40 1226.44 stat 3(-) 5(-) 7(-) 3(-) 5(-) 7(-) 1(+)2(+)4(+) 6(+) 8(+) 3(-)5(-)6(-)7(-) 1(+)2(+) 4(+)6(+) 8(+) 3(-)4(+)5(-) 1(+)2(+) 4(+) 8(+) 3(-) 5(-) 7(-) bsc-500 1-1e-2 mean 15006.90 6842.49 203666.36 7379.95 208986.08 14916.38 54963.17 8151.41 sd 17920.10 362.40 31186.95 694.47 27688.03 1042.81 478.70 816.68 stat 3(-) 5(-)6(+)7(-) 3(-) 5(-)6(-)7(-) 1(+)2(+)4(+) 6(+) 8(+) 3(-)5(-)6(-)7(-) 1(+)2(+) 4(+)6(+) 8(+) 1(-)2(+)3(-)4(+)5(-) 1(+)2(+) 4(+) 8(+) 3(-) 5(-) 7(-) 1-1e-4 mean 23210.83 9167.24 236211.05 8754.51 232394.11 14944.38 60811.80 9657.73 sd 22827.57 484.52 37859.51 662.14 43725.81 1049.46 706.45 760.70 stat 3(-)4(+)5(-) 7(-) 3(-) 5(-)6(-)7(-) 1(+)2(+)4(+) 6(+) 8(+) 1(-) 3(-)5(-)6(-)7(-) 1(+)2(+) 4(+)6(+) 8(+) 2(+)3(-)4(+)5(-) 1(+)2(+) 4(+) 8(+) 3(-) 5(-) 7(-) 1-1e-6 mean 31901.86 10606.52 265906.68 9743.67 277062.14 14968.20 64586.97 10581.41 sd 25917.60 543.03 15811.47 642.46 15758.89 1070.08 860.63 768.44 stat 3(-)4(+)5(-) 7(-) 3(-) 5(-)6(-)7(-) 1(+)2(+)4(+) 6(+) 8(+) 1(-) 3(-)5(-)6(-)7(-) 1(+)2(+) 4(+)6(+) 8(+) 2(+)3(-)4(+)5(-) 8(+) 1(+)2(+) 4(+) 8(+) 3(-) 5(-)6(-)7(-) 1-1e-8 mean 40827.58 11662.64 298757.06 10595.19 283206.52 15018.40 69876.58 11296.89 sd 26881.99 582.37 34605.89 624.59 43994.54 1084.91 9568.22 745.47 stat 3(-)4(+)5(-) 8(+) 3(-) 5(-) 7(-) 1(+)2(+)4(+) 6(+) 8(+) 1(-) 3(-)5(-)6(-)7(-) 1(+)2(+) 4(+)6(+) 8(+) 3(-)4(+)5(-) 8(+) 2(+) 4(+) 8(+) 1(-) 3(-) 5(-)6(-)7(-) 1-1e-10 mean 52297.44 12701.86 286408.55 11328.71 318627.72 15068.26 70484.24 11884.06 sd 29680.02 597.69 56918.79 656.94 30939.89 1107.88 812.12 745.30 stat 2(+)3(-)4(+)5(-) 8(+) 1(-)3(-) 5(-) 7(-) 1(+)2(+)4(+) 6(+) 8(+) 1(-) 3(-)5(-)6(-)7(-) 1(+)2(+) 4(+)6(+)7(+)8(+) 3(-)4(+)5(-) 8(+) 2(+) 4(+)5(-) 8(+) 1(-) 3(-) 5(-)6(-)7(-) bsc-1000 1-1e-2 mean 101563.43 13420.38 769856.77 102029.76 730858.99 114495.24 108000.80 104627.14 sd 1462.78 562.52 86460.04 846.99 131385.47 933.59 894.85 713.08 stat 3(-) 5(-)6(-)7(-) 3(-) 5(-)6(-)7(-)8(-) 1(+)2(+)4(+) 7(+)8(+) 3(-)5(-)6(-)7(-) 1(+)2(+) 4(+) 7(+)8(+) 1(+)2(+) 4(+) 8(+) 1(+)2(+)3(-)4(+)5(-) 2(+)3(-) 5(-)6(-) 1-1e-4 mean 111236.99 17513.00 847944.38 108415.95 880850.74 119094.72 116782.72 112609.38 sd 2218.49 653.13 100792.57 650.10 102840.74 933.59 649.54 983.55 stat 2(+)3(-) 5(-)6(-) 1(-)3(-) 5(-)6(-)7(-)8(-) 1(+)2(+)4(+) 7(+)8(+) 3(-)5(-)6(-)7(-) 1(+)2(+) 4(+) 7(+)8(+) 1(+)2(+) 4(+) 8(+) 2(+)3(-)4(+)5(-) 2(+)3(-) 5(-)6(-) 1-1e-6 mean 118594.89 20279.99 904005.04 113176.77 941349.12 122511.71 123434.51 116634.37 sd 3536.27 690.83 150638.53 571.76 118227.17 933.92 1297.34 862.49 stat 2(+)3(-) 5(-) 1(-)3(-) 5(-)6(-)7(-)8(-) 1(+)2(+)4(+) 6(+) 8(+) 3(-)5(-)6(-)7(-) 1(+)2(+) 4(+)6(+)7(+)8(+) 2(+)3(-)4(+)5(-) 2(+) 4(+)5(-) 8(+) 2(+)3(-) 5(-) 7(-) 1-1e-8 mean 123779.27 22516.43 1015342.96 117401.97 991129.33 125349.45 131746.24 120258.98 sd 2564.91 739.98 117736.15 520.59 142800.94 934.62 18002.35 786.12 stat 2(+)3(-)4(+)5(-) 1(-)3(-) 5(-)6(-)7(-)8(-) 1(+)2(+)4(+) 6(+) 8(+) 1(-) 3(-)5(-)6(-)7(-) 1(+)2(+) 4(+)6(+) 8(+) 2(+)3(-)4(+)5(-) 2(+) 4(+) 8(+) 2(+)3(-) 5(-) 7(-) 1-1e-10 mean 127241.69 24539.42 1069405.94 121178.61 1027287.14 127861.51 136367.97 123702.16 sd 2192.65 824.68 124485.41 559.94 152340.11 960.14 18297.14 836.12 stat 2(+)3(-)4(+)5(-) 1(-)3(-) 5(-)6(-)7(-)8(-) 1(+)2(+)4(+) 6(+) 8(+) 1(-) 3(-)5(-)6(-)7(-) 1(+)2(+) 4(+)6(+) 8(+) 2(+)3(-)4(+)5(-) 2(+) 4(+) 8(+) 2(+)3(-) 5(-) 7(-)
file-n uncorr-300 1-1e-2 mean 5870.15 5389.01 23698.75 6281.42 25995.30 16210.31 14121.28 5800.91 sd 515.81 541.56 3254.97 956.70 3474.38 2722.10 428.56 537.48 stat 3(-) 5(-)6(-)7(-) 3(-) 5(-)6(-)7(-) 1(+)2(+)4(+) 7(+)8(+) 3(-)5(-)6(-)7(-) 1(+)2(+) 4(+)6(+)7(+)8(+) 1(+)2(+) 4(+)5(-) 8(+) 1(+)2(+)3(-)4(+)5(-) 8(+) 3(-) 5(-)6(-)7(-) 1-1e-4 mean 8698.97 7492.13 30150.37 7777.96 32716.05 16216.82 16963.81 7791.65 sd 2277.13 744.39 3668.25 846.74 2352.15 2707.83 507.44 740.86 stat 3(-) 5(-)6(-)7(-) 3(-) 5(-)6(-)7(-) 1(+)2(+)4(+) 8(+) 3(-)5(-)6(-)7(-) 1(+)2(+) 4(+)6(+)7(+)8(+) 1(+)2(+) 4(+)5(-) 8(+) 1(+)2(+) 4(+)5(-) 8(+) 3(-) 5(-)6(-)7(-) 1-1e-6 mean 10864.21 8831.58 35124.59 8960.20 34945.36 16226.27 18806.99 9016.01 sd 2929.95 895.64 3557.19 919.48 3795.24 2689.89 1075.81 879.64 stat 3(-) 5(-) 7(-) 3(-) 5(-)6(-)7(-) 1(+)2(+)4(+) 6(+) 8(+) 3(-)5(-)6(-)7(-) 1(+)2(+) 4(+)6(+)7(+)8(+) 2(+)3(-)4(+)5(-) 8(+) 1(+)2(+) 4(+)5(-) 8(+) 3(-) 5(-)6(-)7(-) 1-1e-8 mean 11334.98 9855.53 37502.72 9887.53 39315.61 16242.62 19980.39 9899.73 sd 2708.26 1004.28 4167.76 1031.76 3506.10 2662.30 1192.69 972.97 stat 3(-) 5(-) 7(-) 3(-) 5(-)6(-)7(-) 1(+)2(+)4(+) 6(+) 8(+) 3(-)5(-)6(-)7(-) 1(+)2(+) 4(+)6(+) 8(+) 2(+)3(-)4(+)5(-) 8(+) 1(+)2(+) 4(+) 8(+) 3(-) 5(-)6(-)7(-) 1-1e-10 mean 12382.50 10768.53 40818.83 10634.15 41417.98 16273.92 21223.41 10582.55 sd 2796.18 1079.91 4281.63 1124.62 5643.33 2619.85 800.18 1057.37 stat 3(-) 5(-) 7(-) 3(-) 5(-)6(-)7(-) 1(+)2(+)4(+) 6(+) 8(+) 3(-)5(-)6(-)7(-) 1(+)2(+) 4(+)6(+) 8(+) 2(+)3(-)4(+)5(-) 8(+) 1(+)2(+) 4(+) 8(+) 3(-) 5(-)6(-)7(-) uncorr-500 1-1e-2 mean 11321.16 8360.02 60320.60 9522.09 61722.28 24971.36 23029.07 8974.55 sd 4500.74 378.11 9434.03 1068.91 4430.03 3490.02 390.81 541.25 stat 2(+)3(-) 5(-)6(-)7(-) 1(-)3(-) 5(-)6(-)7(-) 1(+)2(+)4(+) 7(+)8(+) 3(-)5(-)6(-)7(-) 1(+)2(+) 4(+)6(+)7(+)8(+) 1(+)2(+) 4(+)5(-) 8(+) 1(+)2(+)3(-)4(+)5(-) 8(+) 3(-) 5(-)6(-)7(-) 1-1e-4 mean 17945.32 11560.74 67816.26 11737.90 74361.13 24998.48 27155.83 11879.51 sd 6473.66 489.05 8890.90 776.06 6790.92 3505.55 694.06 639.67 stat 2(+)3(-)4(+)5(-) 1(-)3(-) 5(-)6(-)7(-) 1(+)2(+)4(+) 6(+) 8(+) 1(-) 3(-)5(-)6(-)7(-) 1(+)2(+) 4(+)6(+)7(+)8(+) 2(+)3(-)4(+)5(-) 8(+) 2(+) 4(+)5(-) 8(+) 3(-) 5(-)6(-)7(-) 1-1e-6 mean 21315.59 13681.99 77405.29 13544.47 82937.00 25095.58 30018.14 13809.38 sd 7060.36 561.65 11402.41 744.80 8199.47 3457.20 1365.91 736.29 stat 2(+)3(-)4(+)5(-) 8(+) 1(-)3(-) 5(-)6(-)7(-) 1(+)2(+)4(+) 6(+) 8(+) 1(-) 3(-)5(-)6(-)7(-) 1(+)2(+) 4(+)6(+)7(+)8(+) 2(+)3(-)4(+)5(-) 8(+) 2(+) 4(+)5(-) 8(+) 1(-) 3(-) 5(-)6(-)7(-) 1-1e-8 mean 26794.46 15390.54 85920.55 14973.24 85982.93 25140.86 32318.44 15266.16 sd 6915.12 625.59 11409.24 810.73 13433.23 3466.97 938.97 822.37 stat 2(+)3(-)4(+)5(-) 8(+) 1(-)3(-) 5(-)6(-)7(-) 1(+)2(+)4(+) 6(+) 8(+) 1(-) 3(-)5(-)6(-)7(-) 1(+)2(+) 4(+)6(+) 8(+) 2(+)3(-)4(+)5(-) 8(+) 2(+) 4(+) 8(+) 1(-) 3(-) 5(-)6(-)7(-) 1-1e-10 mean 30245.85 17100.17 94100.80 16216.62 95441.01 25195.14 33576.55 16498.74 sd 6632.46 938.08 8289.50 909.31 7985.02 3420.52 1474.30 871.18 stat 2(+)3(-)4(+)5(-) 8(+) 1(-)3(-) 5(-) 7(-) 1(+)2(+)4(+) 6(+) 8(+) 1(-) 3(-)5(-)6(-)7(-) 1(+)2(+) 4(+)6(+)7(+)8(+) 3(-)4(+)5(-) 8(+) 2(+) 4(+)5(-) 8(+) 1(-) 3(-) 5(-)6(-)7(-) uncorr-1000 1-1e-2 mean 39105.39 15265.12 212253.16 38811.29 206734.53 64015.94 44198.15 38154.92 sd 818.32 722.78 23069.77 1168.29 26284.93 4981.31 645.95 917.55 stat 2(+)3(-) 5(-)6(-) 1(-)3(-)4(-)5(-)6(-)7(-) 1(+)2(+)4(+) 7(+)8(+) 2(+)3(-)5(-)6(-)7(-) 1(+)2(+) 4(+) 7(+)8(+) 1(+)2(+) 4(+) 8(+) 2(+)3(-)4(+)5(-) 8(+) 3(-) 5(-)6(-)7(-) 1-1e-4 mean 46003.17 20080.43 237880.03 42536.57 238216.93 65240.14 50399.46 43103.87 sd 1366.51 791.28 27276.12 764.02 41819.35 4981.31 925.78 752.74 stat 2(+)3(-) 5(-)6(-) 1(-)3(-) 5(-)6(-)7(-) 1(+)2(+)4(+) 7(+)8(+) 3(-)5(-)6(-)7(-) 1(+)2(+) 4(+) 7(+)8(+) 1(+)2(+) 4(+) 8(+) 2(+)3(-)4(+)5(-) 8(+) 3(-) 5(-)6(-)7(-) 1-1e-6 mean 51268.29 23489.95 265146.03 45818.52 266530.66 66150.18 54564.99 46568.25 sd 1950.26 824.33 22362.29 601.27 20418.67 4981.37 1094.63 732.87 stat 2(+)3(-) 5(-)6(-) 1(-)3(-) 5(-)6(-)7(-) 1(+)2(+)4(+) 7(+)8(+) 3(-)5(-)6(-)7(-) 1(+)2(+) 4(+) 7(+)8(+) 1(+)2(+) 4(+) 8(+) 2(+)3(-)4(+)5(-) 8(+) 3(-) 5(-)6(-)7(-) 1-1e-8 mean 55990.26 26273.55 268736.63 48664.10 268124.16 66927.37 57940.47 49290.57 sd 4116.36 916.00 47319.72 568.75 48236.21 4956.07 1473.47 764.82 stat 2(+)3(-)4(+)5(-) 1(-)3(-) 5(-)6(-)7(-) 1(+)2(+)4(+) 7(+)8(+) 1(-) 3(-)5(-)6(-)7(-) 1(+)2(+) 4(+) 7(+)8(+) 2(+) 4(+) 8(+) 2(+)3(-)4(+)5(-) 8(+) 3(-) 5(-)6(-)7(-) 1-1e-10 mean 58973.17 29216.50 289046.46 51166.43 303833.27 67613.39 60436.71 51622.41 sd 3569.83 1121.69 39111.85 626.34 28231.41 4984.52 1186.63 779.32 stat 2(+)3(-)4(+)5(-) 1(-)3(-) 5(-)6(-)7(-) 1(+)2(+)4(+) 7(+)8(+) 1(-) 3(-)5(-)6(-)7(-) 1(+)2(+) 4(+)6(+)7(+)8(+) 2(+) 4(+)5(-) 8(+) 2(+)3(-)4(+)5(-) 8(+) 3(-) 5(-)6(-)7(-)
file-n bsc-300 1-1e-2 mean 521.63 666.10 54841.80 713.58 56997.88 441.28 13622.97 1151.55 sd 82.13 74.62 8695.60 2200.49 8891.06 119.10 72.58 2194.43 stat 3(-) 5(-) 7(-)8(-) 3(-)4(-)5(-) 7(-) 1(+)2(+)4(+) 6(+) 8(+) 2(+)3(-)5(-) 7(-)8(-) 1(+)2(+) 4(+)6(+) 8(+) 3(-) 5(-)7(-)8(-) 1(+)2(+) 4(+) 6(+) 1(+) 3(-)4(+)5(-)6(+) 1-1e-4 mean 1018.74 776.10 54558.35 830.57 54613.57 557.82 13727.36 1234.96 sd 2213.73 81.57 8703.21 2204.23 10634.43 117.70 67.07 2198.27 stat 3(-) 5(-) 7(-) 3(-)4(-)5(-) 7(-) 1(+)2(+)4(+) 6(+) 8(+) 2(+)3(-)5(-) 7(-)8(-) 1(+)2(+) 4(+)6(+) 8(+) 3(-) 5(-)7(-)8(-) 1(+)2(+) 4(+) 6(+) 3(-)4(+)5(-)6(+) 1-1e-6 mean 1106.25 854.92 52671.63 918.70 55189.64 650.28 13857.55 1298.95 sd 2196.08 82.25 11156.41 2204.75 9352.00 121.14 94.77 2203.00 stat 3(-) 5(-) 7(-) 3(-)4(-)5(-) 7(-) 1(+)2(+)4(+) 6(+) 8(+) 2(+)3(-)5(-) 7(-)8(-) 1(+)2(+) 4(+)6(+) 8(+) 3(-) 5(-)7(-)8(-) 1(+)2(+) 4(+) 6(+) 3(-)4(+)5(-)6(+) 1-1e-8 mean 759.29 920.19 54806.65 989.10 58441.76 735.28 13933.96 1349.08 sd 103.03 87.24 8699.40 2208.14 7637.43 119.50 96.91 2202.31 stat 3(-) 5(-) 7(-) 3(-)4(-)5(-) 7(-) 1(+)2(+)4(+) 6(+) 8(+) 2(+)3(-)5(-) 7(-)8(-) 1(+)2(+) 4(+)6(+) 8(+) 3(-) 5(-)7(-)8(-) 1(+)2(+) 4(+) 6(+) 3(-)4(+)5(-)6(+) 1-1e-10 mean 840.68 978.17 57738.12 1054.85 54142.19 799.17 13987.87 1387.15 sd 81.22 91.22 7697.95 2208.74 9410.92 121.15 102.62 2203.90 stat 3(-) 5(-) 7(-) 3(-)4(-)5(-) 1(+)2(+)4(+) 6(+) 8(+) 2(+)3(-)5(-) 7(-)8(-) 1(+)2(+) 4(+)6(+) 8(+) 3(-) 5(-)7(-)8(-) 1(+) 4(+) 6(+) 3(-)4(+)5(-)6(+) bsc-500 1-1e-2 mean 20602.29 1884.56 152933.13 20741.07 152071.26 20853.77 23233.80 21184.13 sd 3667.82 157.96 17100.53 53.92 18108.94 113.50 201.81 62.78 stat 2(+)3(-)4(-)5(-) 1(-)3(-) 5(-)6(-)7(-)8(-) 1(+)2(+)4(+) 6(+) 8(+) 1(+) 3(-)5(-) 7(-)8(-) 1(+)2(+) 4(+)6(+) 8(+) 2(+)3(-) 5(-)7(-) 2(+) 4(+) 6(+) 2(+)3(-)4(+)5(-) 1-1e-4 mean 21461.75 2020.36 144447.99 20905.81 149615.63 21023.67 23384.24 21310.54 sd 210.67 154.96 24723.47 52.04 16229.44 117.84 235.48 64.07 stat 2(+)3(-)4(+)5(-) 1(-)3(-) 5(-)6(-)7(-)8(-) 1(+)2(+)4(+) 6(+) 8(+) 1(-) 3(-)5(-) 7(-)8(-) 1(+)2(+) 4(+)6(+) 8(+) 2(+)3(-) 5(-)7(-) 2(+) 4(+) 6(+) 2(+)3(-)4(+)5(-) 1-1e-6 mean 21564.49 2119.37 144614.62 21027.49 152391.10 21146.03 23560.89 21397.14 sd 172.76 156.27 23531.36 52.48 24264.25 120.83 208.67 63.66 stat 2(+)3(-)4(+)5(-)6(+) 1(-)3(-) 5(-)6(-)7(-)8(-) 1(+)2(+)4(+) 6(+) 8(+) 1(-) 3(-)5(-) 7(-)8(-) 1(+)2(+) 4(+)6(+) 8(+) 1(-)2(+)3(-) 5(-)7(-) 2(+) 4(+) 6(+)8(+) 2(+)3(-)4(+)5(-) 7(-) 1-1e-8 mean 21620.92 2203.19 145551.51 21130.18 149879.49 21246.14 23614.31 21474.49 sd 153.61 156.26 26772.50 51.89 13472.43 121.76 137.32 58.25 stat 2(+)3(-)4(+)5(-)6(+) 1(-)3(-) 5(-)6(-)7(-)8(-) 1(+)2(+)4(+) 6(+) 8(+) 1(-) 3(-)5(-) 7(-)8(-) 1(+)2(+) 4(+)6(+) 8(+) 1(-)2(+)3(-) 5(-)7(-) 2(+) 4(+) 6(+)8(+) 2(+)3(-)4(+)5(-) 7(-) 1-1e-10 mean 21680.72 2279.33 149709.88 21217.52 154823.17 21335.91 23682.62 21534.93 sd 126.94 155.43 21998.23 51.95 21560.90 119.66 154.95 65.34 stat 2(+)3(-)4(+)5(-) 1(-)3(-) 5(-)6(-)7(-)8(-) 1(+)2(+)4(+) 6(+) 8(+) 1(-) 3(-)5(-) 7(-)8(-) 1(+)2(+) 4(+)6(+) 8(+) 2(+)3(-) 5(-)7(-) 2(+) 4(+) 6(+)8(+) 2(+)3(-)4(+)5(-) 7(-) bsc-1000 1-1e-2 mean 44500.33 5883.96 555585.36 83040.09 582554.83 84911.06 48960.30 43087.86 sd 609.38 566.25 137431.06 162.72 106392.74 18806.84 620.17 136.64 stat 2(+)3(-)4(-)5(-)6(-) 1(-)3(-)4(-)5(-)6(-)7(-) 1(+)2(+)4(+) 7(+)8(+) 1(+)2(+)3(-)5(-) 8(+) 1(+)2(+) 4(+) 7(+)8(+) 1(+)2(+) 8(+) 2(+)3(-) 5(-) 3(-)4(-)5(-)6(-) 1-1e-4 mean 44666.34 6042.94 565314.72 83268.25 553247.75 85148.28 49039.70 43240.25 sd 315.08 564.44 90664.68 160.38 104810.33 18814.22 444.94 142.25 stat 3(-) 5(-)6(-) 3(-)4(-)5(-)6(-)7(-) 1(+)2(+)4(+) 7(+)8(+) 2(+)3(-)5(-) 8(+) 1(+)2(+) 4(+) 7(+)8(+) 1(+)2(+) 8(+) 2(+)3(-) 5(-) 3(-)4(-)5(-)6(-) 1-1e-6 mean 44746.10 6164.08 577670.33 83440.26 614415.27 85323.06 49290.52 43347.64 sd 406.26 563.62 113146.20 157.11 54519.58 18824.45 463.15 136.29 stat 3(-) 5(-)6(-) 3(-)4(-)5(-)6(-)7(-) 1(+)2(+)4(+) 7(+)8(+) 2(+)3(-)5(-) 8(+) 1(+)2(+) 4(+)6(+)7(+)8(+) 1(+)2(+) 5(-) 8(+) 2(+)3(-) 5(-) 3(-)4(-)5(-)6(-) 1-1e-8 mean 44839.71 6262.31 574488.69 83580.34 585685.33 85471.32 49400.04 43433.48 sd 326.86 567.37 129251.75 157.10 103232.01 18831.17 473.75 143.57 stat 3(-) 5(-)6(-) 3(-)4(-)5(-)6(-)7(-) 1(+)2(+) 7(+)8(+) 2(+) 5(-) 8(+) 1(+)2(+) 4(+) 7(+)8(+) 1(+)2(+) 8(+) 2(+)3(-) 5(-) 3(-)4(-)5(-)6(-) 1-1e-10 mean 45071.63 6347.47 612053.60 83720.53 574840.84 85598.07 49421.39 43504.43 sd 500.62 571.48 76370.00 186.68 116414.42 18834.86 368.91 141.54 stat 3(-)4(-)5(-)6(-) 3(-)4(-)5(-)6(-)7(-) 1(+)2(+)4(+) 7(+)8(+) 1(+)2(+)3(-)5(-) 8(+) 1(+)2(+) 4(+)6(+)7(+)8(+) 1(+)2(+) 5(-) 8(+) 2(+)3(-) 5(-) 3(-)4(-)5(-)6(-)
file-n uncorr-300 1-1e-2 mean 1194.96 1298.69 14731.77 1291.65 16530.64 1601.41 5165.77 931.75 sd 829.44 135.35 2074.54 1037.81 3298.54 1975.07 216.34 77.99 stat 3(-) 5(-) 7(-) 3(-) 5(-) 1(+)2(+)4(+) 6(+) 8(+) 3(-)5(-) 7(-) 1(+)2(+) 4(+)6(+) 8(+) 3(-) 5(-)7(-) 1(+) 4(+) 6(+)8(+) 3(-) 5(-) 7(-) 1-1e-4 mean 1277.26 1477.28 15532.48 1577.80 16734.71 1828.75 5390.36 1090.70 sd 588.56 134.15 1781.25 1092.25 2645.36 2031.92 244.02 83.84 stat 3(-) 5(-) 7(-) 3(-) 5(-) 1(+)2(+)4(+) 6(+) 8(+) 3(-)5(-) 7(-) 1(+)2(+) 4(+)6(+) 8(+) 3(-) 5(-)7(-) 1(+) 4(+) 6(+)8(+) 3(-) 5(-) 7(-) 1-1e-6 mean 1460.33 1605.80 15346.70 1772.48 16717.72 1984.96 5490.28 1217.68 sd 584.95 143.23 2173.31 1129.17 2395.74 2049.64 204.94 77.49 stat 3(-) 5(-) 7(-) 3(-) 5(-) 1(+)2(+)4(+) 6(+) 8(+) 3(-)5(-) 7(-) 1(+)2(+) 4(+)6(+) 8(+) 3(-) 5(-)7(-) 1(+) 4(+) 6(+)8(+) 3(-) 5(-) 7(-) 1-1e-8 mean 1427.58 1711.36 15775.90 1949.33 17257.75 2158.32 5628.67 1305.66 sd 223.53 138.93 1762.62 1186.63 2883.38 2113.50 236.32 88.32 stat 3(-) 5(-) 7(-) 3(-) 5(-) 1(+)2(+)4(+) 6(+) 8(+) 3(-)5(-) 7(-) 1(+)2(+) 4(+)6(+)7(+)8(+) 3(-) 5(-)7(-) 1(+) 4(+)5(-)6(+)8(+) 3(-) 5(-) 7(-) 1-1e-10 mean 1607.55 1809.69 16162.78 2122.78 17371.60 2286.78 5663.59 1388.84 sd 613.02 137.40 2684.22 1261.54 2603.24 2153.91 184.33 91.54 stat 3(-) 5(-) 7(-) 3(-) 5(-) 1(+)2(+)4(+) 6(+) 8(+) 3(-)5(-) 7(-) 1(+)2(+) 4(+)6(+) 8(+) 3(-) 5(-)7(-) 1(+) 4(+) 6(+)8(+) 3(-) 5(-) 7(-) uncorr-500 1-1e-2 mean 7158.97 3521.73 41545.14 6789.51 44477.64 7242.33 9266.07 6535.75 sd 238.96 315.67 5509.97 1247.81 7216.76 2288.29 222.00 136.89 stat 2(+)3(-) 5(-) 1(-)3(-)4(-)5(-)6(-)7(-)8(-) 1(+)2(+)4(+) 6(+) 8(+) 2(+)3(-)5(-) 7(-) 1(+)2(+) 4(+)6(+)7(+)8(+) 2(+)3(-) 5(-)7(-) 2(+) 4(+)5(-)6(+)8(+) 2(+)3(-) 5(-) 7(-) 1-1e-4 mean 7370.97 3757.82 41653.70 7162.79 43851.26 7668.08 9530.40 6778.09 sd 158.71 307.56 6299.88 1400.77 7467.88 2563.84 269.51 134.83 stat 2(+)3(-) 5(-) 1(-)3(-)4(-)5(-)6(-)7(-)8(-) 1(+)2(+)4(+) 6(+) 8(+) 2(+)3(-)5(-) 7(-) 1(+)2(+) 4(+)6(+)7(+)8(+) 2(+)3(-) 5(-)7(-) 2(+) 4(+)5(-)6(+)8(+) 2(+)3(-) 5(-) 7(-) 1-1e-6 mean 7513.79 3935.59 43234.20 7520.71 44821.51 7970.18 9679.31 6958.71 sd 969.82 307.48 4150.13 1682.05 6053.14 2727.14 211.82 121.41 stat 2(+)3(-) 5(-) 1(-)3(-)4(-)5(-)6(-)7(-)8(-) 1(+)2(+)4(+) 6(+) 8(+) 2(+)3(-)5(-) 7(-) 1(+)2(+) 4(+)6(+)7(+)8(+) 2(+)3(-) 5(-)7(-) 2(+) 4(+)5(-)6(+)8(+) 2(+)3(-) 5(-) 7(-) 1-1e-8 mean 7608.84 4081.46 44089.00 7758.92 43263.14 8249.74 9806.50 7103.00 sd 989.55 311.19 4001.81 1749.01 7643.91 2922.33 302.98 126.43 stat 2(+)3(-) 5(-) 1(-)3(-)4(-)5(-)6(-)7(-)8(-) 1(+)2(+)4(+) 6(+) 8(+) 2(+)3(-)5(-) 7(-) 1(+)2(+) 4(+)6(+)7(+)8(+) 2(+)3(-) 5(-)7(-) 2(+) 4(+)5(-)6(+)8(+) 2(+)3(-) 5(-) 7(-) 1-1e-10 mean 7910.97 4229.06 40460.21 7926.72 44574.94 8489.00 10059.20 7230.81 sd 204.13 310.87 7653.57 1797.03 5982.28 3025.87 354.88 116.58 stat 2(+)3(-) 5(-) 1(-)3(-)4(-)5(-)6(-)7(-)8(-) 1(+)2(+)4(+) 6(+) 8(+) 2(+)3(-)5(-) 7(-) 1(+)2(+) 4(+)6(+)7(+)8(+) 2(+)3(-) 5(-)7(-) 2(+) 4(+)5(-)6(+)8(+) 2(+)3(-) 5(-) 7(-) uncorr-1000 1-1e-2 mean 16264.40 11489.94 163340.69 23741.00 160156.98 24279.12 21452.36 13487.02 sd 426.53 890.95 24857.29 625.27 30330.66 1538.91 660.53 165.62 stat 2(+)3(-)4(-)5(-)6(-) 1(-)3(-)4(-)5(-)6(-)7(-) 1(+)2(+)4(+) 7(+)8(+) 1(+)2(+)3(-)5(-) 8(+) 1(+)2(+) 4(+) 7(+)8(+) 1(+)2(+) 8(+) 2(+)3(-) 5(-) 8(+) 3(-)4(-)5(-)6(-)7(-) 1-1e-4 mean 16437.15 11743.66 159378.86 24164.33 160160.61 24770.67 21538.49 13773.94 sd 413.28 893.40 31082.49 865.05 32378.37 1830.30 634.59 166.21 stat 2(+)3(-)4(-)5(-)6(-) 1(-)3(-)4(-)5(-)6(-)7(-) 1(+)2(+)4(+) 7(+)8(+) 1(+)2(+)3(-)5(-) 8(+) 1(+)2(+) 4(+) 7(+)8(+) 1(+)2(+) 8(+) 2(+)3(-) 5(-) 8(+) 3(-)4(-)5(-)6(-)7(-) 1-1e-6 mean 16777.10 11930.95 167848.43 24440.18 171880.60 25185.67 21894.64 13965.62 sd 348.96 896.89 18861.05 1002.20 18180.90 2228.35 771.82 179.59 stat 2(+)3(-)4(-)5(-)6(-) 1(-)3(-)4(-)5(-)6(-)7(-) 1(+)2(+)4(+) 7(+)8(+) 1(+)2(+)3(-)5(-) 8(+) 1(+)2(+) 4(+)6(+)7(+)8(+) 1(+)2(+) 5(-) 8(+) 2(+)3(-) 5(-) 8(+) 3(-)4(-)5(-)6(-)7(-) 1-1e-8 mean 16959.57 12093.07 161401.65 24644.74 163473.55 25449.78 22029.68 14121.68 sd 457.03 893.63 31008.81 1000.96 30881.05 2326.35 565.88 181.62 stat 2(+)3(-)4(-)5(-)6(-) 1(-)3(-)4(-)5(-)6(-)7(-) 1(+)2(+)4(+) 7(+)8(+) 1(+)2(+)3(-)5(-) 8(+) 1(+)2(+) 4(+) 7(+)8(+) 1(+)2(+) 8(+) 2(+)3(-) 5(-) 8(+) 3(-)4(-)5(-)6(-)7(-) 1-1e-10 mean 16996.49 12245.39 162405.50 24903.48 167640.49 25806.86 22068.33 14266.97 sd 396.62 899.78 26387.33 1220.43 26575.62 2717.08 574.47 203.30 stat 2(+)3(-)4(-)5(-)6(-) 1(-)3(-)4(-)5(-)6(-)7(-) 1(+)2(+)4(+) 7(+)8(+) 1(+)2(+)3(-)5(-) 8(+) 1(+)2(+) 4(+) 7(+)8(+) 1(+)2(+) 8(+) 2(+)3(-) 5(-) 8(+) 3(-)4(-)5(-)6(-)7(-)
file-n bsc-300 1-1e-2 mean 11912.63 5320.42 80504.45 20390.60 82676.45 24335.96 20592.37 20410.26 sd 7261.24 776.67 15969.60 1520.60 16926.96 3590.40 623.11 998.10 stat 3(-)4(-)5(-)6(-)7(-) 3(-)4(-)5(-)6(-)7(-)8(-) 1(+)2(+)4(+) 7(+)8(+) 1(+)2(+)3(-)5(-) 1(+)2(+) 4(+) 7(+)8(+) 1(+)2(+) 8(+) 1(+)2(+)3(-) 5(-) 2(+)3(-) 5(-)6(-) 1-1e-4 mean 22667.16 7043.80 104442.72 22483.41 101681.54 25495.62 23680.44 23156.07 sd 928.43 1058.50 11775.67 1555.20 18170.88 3869.03 981.19 1136.12 stat 2(+)3(-) 5(-)6(-) 1(-)3(-)4(-)5(-)6(-)7(-)8(-) 1(+)2(+)4(+) 7(+)8(+) 2(+)3(-)5(-)6(-) 1(+)2(+) 4(+)6(+)7(+)8(+) 1(+)2(+) 4(+)5(-) 8(+) 2(+)3(-) 5(-) 2(+)3(-) 5(-)6(-) 1-1e-6 mean 23605.03 8055.45 115712.42 24004.23 114307.77 26355.19 26216.33 24916.47 sd 5168.24 1236.11 21759.25 1562.12 19495.52 4083.77 3061.54 1349.91 stat 2(+)3(-) 5(-)6(-) 1(-)3(-)4(-)5(-)6(-)7(-)8(-) 1(+)2(+)4(+) 6(+)7(+)8(+) 2(+)3(-)5(-)6(-) 1(+)2(+) 4(+)6(+)7(+)8(+) 1(+)2(+)3(-)4(+)5(-) 2(+)3(-) 5(-) 2(+)3(-) 5(-) 1-1e-8 mean 25768.48 8781.30 126771.63 25282.63 130574.29 27068.65 26979.54 26080.73 sd 4500.39 1353.20 20329.07 1652.69 18401.75 4263.21 1204.40 1483.28 stat 2(+)3(-) 5(-) 1(-)3(-)4(-)5(-)6(-)7(-)8(-) 1(+)2(+)4(+) 6(+)7(+)8(+) 2(+)3(-)5(-)6(-) 1(+)2(+) 4(+)6(+)7(+)8(+) 2(+)3(-)4(+)5(-) 2(+)3(-) 5(-) 2(+)3(-) 5(-) 1-1e-10 mean 27397.06 9560.88 136104.78 26391.53 144355.18 27691.67 28618.13 26965.12 sd 7037.44 1355.47 19260.69 1768.24 19976.29 4420.50 4904.21 1485.80 stat 2(+)3(-) 5(-) 1(-)3(-)4(-)5(-)6(-)7(-)8(-) 1(+)2(+)4(+) 6(+)7(+)8(+) 2(+)3(-)5(-) 1(+)2(+) 4(+)6(+)7(+)8(+) 2(+)3(-) 5(-) 2(+)3(-) 5(-) 2(+)3(-) 5(-) bsc-500 1-1e-2 mean 30607.18 6807.39 204383.40 30987.23 209607.54 38863.60 31935.36 31739.99 sd 798.13 612.69 34599.69 1000.86 30129.45 1333.23 864.99 1050.03 stat 3(-) 5(-)6(-) 3(-)4(-)5(-)6(-)7(-)8(-) 1(+)2(+)4(+) 7(+)8(+) 2(+)3(-)5(-)6(-) 1(+)2(+) 4(+) 7(+)8(+) 1(+)2(+) 4(+) 8(+) 2(+)3(-) 5(-) 2(+)3(-) 5(-)6(-) 1-1e-4 mean 35127.33 9103.75 236470.55 33953.93 248419.60 40479.78 36079.63 35089.90 sd 5234.37 806.72 41047.31 1010.35 33608.97 1344.80 764.49 1161.89 stat 2(+)3(-) 5(-)6(-) 1(-)3(-) 5(-)6(-)7(-)8(-) 1(+)2(+)4(+) 7(+)8(+) 3(-)5(-)6(-)7(-) 1(+)2(+) 4(+) 7(+)8(+) 1(+)2(+) 4(+) 8(+) 2(+)3(-)4(+)5(-) 2(+)3(-) 5(-)6(-) 1-1e-6 mean 37217.29 10546.44 257649.78 36110.14 271731.51 41709.49 38707.25 37070.87 sd 1016.03 931.03 48717.80 1002.44 48140.17 1350.07 753.15 1126.32 stat 2(+)3(-) 5(-)6(-) 1(-)3(-) 5(-)6(-)7(-)8(-) 1(+)2(+)4(+) 7(+)8(+) 3(-)5(-)6(-)7(-) 1(+)2(+) 4(+) 7(+)8(+) 1(+)2(+) 4(+) 8(+) 2(+)3(-)4(+)5(-) 2(+)3(-) 5(-)6(-) 1-1e-8 mean 39875.06 11772.08 273411.97 37909.80 286166.40 42724.86 41051.40 38722.42 sd 1425.56 948.15 52115.32 984.84 57402.60 1351.65 976.11 1165.94 stat 2(+)3(-) 5(-) 1(-)3(-) 5(-)6(-)7(-)8(-) 1(+)2(+)4(+) 7(+)8(+) 3(-)5(-)6(-)7(-) 1(+)2(+) 4(+) 7(+)8(+) 2(+) 4(+) 8(+) 2(+)3(-)4(+)5(-) 2(+)3(-) 5(-)6(-) 1-1e-10 mean 43626.83 13338.08 319899.30 39522.83 299758.42 43605.49 43134.26 40150.03 sd 10753.77 1124.95 46216.21 1033.90 52258.11 1346.60 1398.31 1194.81 stat 2(+)3(-) 5(-) 1(-)3(-) 5(-)6(-)7(-) 1(+)2(+)4(+) 6(+)7(+)8(+) 3(-)5(-)6(-)7(-) 1(+)2(+) 4(+)6(+)7(+)8(+) 2(+)3(-)4(+)5(-) 8(+) 2(+)3(-)4(+)5(-) 8(+) 3(-) 5(-)6(-)7(-) bsc-1000 1-1e-2 mean 58347.68 13339.37 739755.66 143114.99 783671.48 156324.74 62113.50 62069.98 sd 1996.51 729.47 122368.53 18052.76 84787.47 18952.07 973.70 869.43 stat 3(-)4(-)5(-)6(-) 3(-)4(-)5(-)6(-)7(-)8(-) 1(+)2(+)4(+) 7(+)8(+) 1(+)2(+)3(-)5(-) 1(+)2(+) 4(+) 7(+)8(+) 1(+)2(+) 7(+)8(+) 2(+)3(-) 5(-)6(-) 2(+)3(-) 5(-)6(-) 1-1e-4 mean 65673.31 17470.46 850395.92 151497.97 816625.39 163027.04 68454.76 67768.54 sd 2070.12 899.62 120351.34 18889.76 156103.52 19873.29 1381.99 1254.67 stat 3(-)4(-)5(-)6(-) 3(-)4(-)5(-)6(-)7(-)8(-) 1(+)2(+)4(+) 7(+)8(+) 1(+)2(+)3(-)5(-) 1(+)2(+) 4(+) 7(+)8(+) 1(+)2(+) 7(+)8(+) 2(+)3(-) 5(-)6(-) 2(+)3(-) 5(-)6(-) 1-1e-6 mean 70607.79 20308.07 882121.23 157862.03 882928.60 167998.14 72602.95 70216.05 sd 2580.45 1061.85 173762.87 19537.91 152345.91 20593.41 1470.00 1096.67 stat 3(-)4(-)5(-)6(-) 3(-)4(-)5(-)6(-)7(-) 1(+)2(+)4(+) 7(+)8(+) 1(+)2(+)3(-)5(-) 8(+) 1(+)2(+) 4(+) 7(+)8(+) 1(+)2(+) 7(+)8(+) 2(+)3(-) 5(-)6(-) 3(-)4(-)5(-)6(-) 1-1e-8 mean 74839.53 22521.14 1002934.07 163295.67 942122.12 172133.99 76183.83 72450.71 sd 3224.47 1097.74 142077.13 20080.12 165374.02 21192.42 1072.25 981.83 stat 2(+)3(-)4(-)5(-)6(-) 1(-)3(-)4(-)5(-)6(-)7(-) 1(+)2(+)4(+) 7(+)8(+) 1(+)2(+)3(-)5(-) 8(+) 1(+)2(+) 4(+) 7(+)8(+) 1(+)2(+) 7(+)8(+) 2(+)3(-) 5(-)6(-) 3(-)4(-)5(-)6(-) 1-1e-10 mean 77998.01 25030.79 1042070.09 168197.77 988866.17 175736.44 79318.65 74685.61 sd 2973.83 1133.61 141453.23 20587.24 216529.47 21714.53 1260.04 985.53 stat 2(+)3(-) 5(-)6(-) 1(-)3(-)4(-)5(-)6(-)7(-) 1(+)2(+)4(+) 7(+)8(+) 2(+)3(-)5(-) 8(+) 1(+)2(+) 4(+) 7(+)8(+) 1(+)2(+) 7(+)8(+) 2(+)3(-) 5(-)6(-) 3(-)4(-)5(-)6(-)
file-n uncorr-300 1-1e-2 mean 8430.68 5447.73 26352.35 9738.50 26693.53 20910.20 10724.70 9392.54 sd 1879.33 609.50 3791.44 2630.33 3780.11 3714.26 532.37 1657.24 stat 3(-) 5(-)6(-) 3(-)4(-)5(-)6(-)7(-)8(-) 1(+)2(+)4(+) 7(+)8(+) 2(+)3(-)5(-)6(-) 1(+)2(+) 4(+) 7(+)8(+) 1(+)2(+) 4(+) 8(+) 2(+)3(-) 5(-) 2(+)3(-) 5(-)6(-) 1-1e-4 mean 11594.38 7507.36 32700.50 11276.97 33314.83 21177.84 13277.92 11680.45 sd 2160.03 855.84 4382.14 2520.67 4232.50 3715.91 877.94 1785.90 stat 2(+)3(-) 5(-)6(-) 1(-)3(-) 5(-)6(-)7(-)8(-) 1(+)2(+)4(+) 7(+)8(+) 3(-)5(-)6(-) 1(+)2(+) 4(+) 7(+)8(+) 1(+)2(+) 4(+) 8(+) 2(+)3(-) 5(-) 2(+)3(-) 5(-)6(-) 1-1e-6 mean 13699.35 8882.47 37322.08 12441.76 36915.22 21374.58 14707.06 13131.26 sd 1584.08 1042.54 4850.31 2531.35 4732.58 3716.61 1020.94 1915.63 stat 2(+)3(-) 5(-)6(-) 1(-)3(-) 5(-)6(-)7(-)8(-) 1(+)2(+)4(+) 7(+)8(+) 3(-)5(-)6(-) 1(+)2(+) 4(+) 7(+)8(+) 1(+)2(+) 4(+) 8(+) 2(+)3(-) 5(-) 2(+)3(-) 5(-)6(-) 1-1e-8 mean 14467.42 10089.71 40455.53 13408.98 41089.30 21540.32 16028.14 14224.17 sd 2933.16 1213.25 4048.45 2618.05 4584.70 3721.07 1054.08 2041.47 stat 2(+)3(-) 5(-)6(-) 1(-)3(-) 5(-)6(-)7(-)8(-) 1(+)2(+)4(+) 7(+)8(+) 3(-)5(-)6(-) 1(+)2(+) 4(+) 7(+)8(+) 1(+)2(+) 4(+) 8(+) 2(+)3(-) 5(-) 2(+)3(-) 5(-)6(-) 1-1e-10 mean 15745.73 11468.15 42631.34 14247.93 41994.85 21698.47 17654.46 15049.76 sd 2052.79 1532.98 5593.95 2768.88 6659.00 3716.67 1030.52 2092.79 stat 2(+)3(-) 5(-)6(-) 1(-)3(-) 5(-)6(-)7(-) 1(+)2(+)4(+) 7(+)8(+) 3(-)5(-)6(-)7(-) 1(+)2(+) 4(+) 7(+)8(+) 1(+)2(+) 4(+) 8(+) 2(+)3(-)4(+)5(-) 3(-) 5(-)6(-) uncorr-500 1-1e-2 mean 15200.82 8718.59 59293.85 16117.73 64131.65 32458.23 16992.07 15145.70 sd 627.02 759.98 9137.25 1785.04 7187.88 6667.34 485.41 886.53 stat 2(+)3(-) 5(-)6(-) 1(-)3(-)4(-)5(-)6(-)7(-)8(-) 1(+)2(+)4(+) 7(+)8(+) 2(+)3(-)5(-)6(-) 1(+)2(+) 4(+) 7(+)8(+) 1(+)2(+) 4(+) 8(+) 2(+)3(-) 5(-) 2(+)3(-) 5(-)6(-) 1-1e-4 mean 19595.74 11884.72 71721.00 18647.50 73844.42 32930.57 20654.24 18460.76 sd 1160.74 971.24 10962.23 1489.45 10397.29 6601.57 847.11 1023.62 stat 2(+)3(-) 5(-)6(-) 1(-)3(-)4(-)5(-)6(-)7(-) 1(+)2(+)4(+) 7(+)8(+) 2(+)3(-)5(-)6(-) 1(+)2(+) 4(+) 7(+)8(+) 1(+)2(+) 4(+) 8(+) 2(+)3(-) 5(-) 3(-) 5(-)6(-) 1-1e-6 mean 22329.46 14106.53 83681.66 20589.44 81378.37 33316.16 22841.87 20675.71 sd 1342.68 1044.38 9620.62 1397.11 10744.54 6550.00 1152.86 1138.23 stat 2(+)3(-) 5(-) 1(-)3(-) 5(-)6(-)7(-) 1(+)2(+)4(+) 7(+)8(+) 3(-)5(-)6(-) 1(+)2(+) 4(+) 7(+)8(+) 2(+) 4(+) 8(+) 2(+)3(-) 5(-) 3(-) 5(-)6(-) 1-1e-8 mean 23877.06 16287.35 86952.04 22228.40 87544.78 33645.76 25271.27 22354.98 sd 1489.19 1135.45 13073.16 1444.31 13630.14 6484.79 1627.80 1258.86 stat 2(+)3(-) 5(-) 1(-)3(-) 5(-)6(-)7(-) 1(+)2(+)4(+) 7(+)8(+) 3(-)5(-)6(-)7(-) 1(+)2(+) 4(+)6(+)7(+)8(+) 2(+) 4(+)5(-) 8(+) 2(+)3(-)4(+)5(-) 8(+) 3(-) 5(-)6(-)7(-) 1-1e-10 mean 26313.35 19372.67 86963.33 23629.56 96443.46 33952.10 26929.73 23718.98 sd 2557.25 2061.76 16815.46 1571.22 11355.34 6394.53 1523.69 1356.51 stat 2(+)3(-) 5(-) 1(-)3(-) 5(-)6(-)7(-) 1(+)2(+)4(+) 7(+)8(+) 3(-)5(-)6(-)7(-) 1(+)2(+) 4(+)6(+)7(+)8(+) 2(+) 4(+)5(-) 8(+) 2(+)3(-)4(+)5(-) 8(+) 3(-) 5(-)6(-)7(-) uncorr-1000 1-1e-2 mean 28327.16 15911.74 208327.04 48706.52 210807.57 80182.21 32194.00 27952.09 sd 973.13 851.10 34102.65 4740.58 31837.57 8280.81 713.05 1199.06 stat 3(-)4(-)5(-)6(-) 3(-)4(-)5(-)6(-)7(-) 1(+)2(+)4(+) 7(+)8(+) 1(+)2(+)3(-)5(-) 8(+) 1(+)2(+) 4(+) 7(+)8(+) 1(+)2(+) 7(+)8(+) 2(+)3(-) 5(-)6(-) 3(-)4(-)5(-)6(-) 1-1e-4 mean 34891.39 20883.36 239157.51 52685.26 245977.23 81877.48 37500.21 32228.10 sd 2109.45 1053.73 31993.49 4972.43 28518.83 8439.60 918.67 1075.70 stat 2(+)3(-)4(-)5(-)6(-) 1(-)3(-)4(-)5(-)6(-)7(-) 1(+)2(+)4(+) 7(+)8(+) 1(+)2(+)3(-)5(-) 8(+) 1(+)2(+) 4(+) 7(+)8(+) 1(+)2(+) 7(+)8(+) 2(+)3(-) 5(-)6(-) 3(-)4(-)5(-)6(-) 1-1e-6 mean 40171.24 24386.63 249132.31 56048.46 268364.12 83093.83 41412.43 35352.71 sd 2710.95 1120.92 44785.92 5202.62 35847.07 8624.64 1116.24 1001.84 stat 2(+)3(-) 5(-)6(-) 1(-)3(-)4(-)5(-)6(-)7(-) 1(+)2(+)4(+) 7(+)8(+) 2(+)3(-)5(-) 8(+) 1(+)2(+) 4(+) 7(+)8(+) 1(+)2(+) 7(+)8(+) 2(+)3(-) 5(-)6(-) 3(-)4(-)5(-)6(-) 1-1e-8 mean 42902.77 27379.38 271664.28 59040.62 282522.88 84104.06 44046.93 37829.37 sd 2712.62 1339.78 37056.24 5373.70 45894.32 8780.72 1139.54 1068.49 stat 2(+)3(-) 5(-)6(-) 1(-)3(-)4(-)5(-)6(-)7(-) 1(+)2(+)4(+) 7(+)8(+) 2(+)3(-)5(-) 8(+) 1(+)2(+) 4(+) 7(+)8(+) 1(+)2(+) 7(+)8(+) 2(+)3(-) 5(-)6(-) 3(-)4(-)5(-)6(-) 1-1e-10 mean 45250.91 32865.15 263226.27 61739.61 286250.19 85004.61 46838.09 39908.56 sd 3054.56 3116.12 65656.03 5503.58 46509.39 8927.15 1338.03 1123.10 stat 2(+)3(-) 5(-)6(-) 1(-)3(-)4(-)5(-)6(-)7(-) 1(+)2(+)4(+) 7(+)8(+) 2(+)3(-)5(-) 8(+) 1(+)2(+) 4(+) 7(+)8(+) 1(+)2(+) 7(+)8(+) 2(+)3(-) 5(-)6(-) 3(-)4(-)5(-)6(-)
file-n bsc-300 1-1e-2 mean 491.83 910.47 418.46 246.37 573.13 329.25 1077.41 1151.65 sd 125.04 143.31 40.53 128.00 79.11 64.80 243.76 294.18 stat 2(-) 4(+) 7(-)8(-) 1(+)3(+)4(+) 6(+) 2(-) 7(-)8(-) 1(-)2(-) 5(-) 7(-)8(-) 4(+)6(+)7(-)8(-) 2(-) 5(-)7(-)8(-) 1(+) 3(+)4(+)5(+)6(+) 1(+) 3(+)4(+)5(+)6(+) 1-1e-4 mean 580.00 1012.48 523.24 334.67 703.74 431.92 1189.61 1196.12 sd 84.78 148.91 82.33 120.99 114.06 65.80 245.92 275.28 stat 2(-) 4(+) 7(-)8(-) 1(+)3(+)4(+) 6(+) 2(-)4(+) 7(-)8(-) 1(-)2(-)3(-)5(-) 7(-)8(-) 4(+)6(+)7(-)8(-) 2(-) 5(-)7(-)8(-) 1(+) 3(+)4(+)5(+)6(+) 1(+) 3(+)4(+)5(+)6(+) 1-1e-6 mean 635.94 1086.58 606.31 428.25 776.40 505.59 1268.93 1246.55 sd 60.41 152.20 128.42 121.25 108.75 72.25 275.68 271.83 stat 2(-) 4(+) 7(-)8(-) 1(+)3(+)4(+) 6(+) 2(-)4(+) 7(-)8(-) 1(-)2(-)3(-)5(-) 7(-)8(-) 4(+)6(+)7(-)8(-) 2(-) 5(-)7(-)8(-) 1(+) 3(+)4(+)5(+)6(+) 1(+) 3(+)4(+)5(+)6(+) 1-1e-8 mean 718.22 1147.53 657.66 487.52 822.48 575.81 1369.00 1315.58 sd 84.62 157.55 76.00 114.34 108.79 80.99 380.81 284.75 stat 2(-) 4(+) 7(-)8(-) 1(+)3(+)4(+) 6(+) 2(-) 7(-)8(-) 1(-)2(-) 5(-) 7(-)8(-) 4(+)6(+)7(-)8(-) 2(-) 5(-)7(-)8(-) 1(+) 3(+)4(+)5(+)6(+) 1(+) 3(+)4(+)5(+)6(+) 1-1e-10 mean 766.89 1204.57 703.38 540.27 865.54 621.33 1461.02 1341.31 sd 119.37 161.66 72.61 109.16 123.42 80.68 242.86 292.94 stat 2(-) 4(+) 7(-)8(-) 1(+)3(+)4(+) 6(+) 2(-) 7(-)8(-) 1(-)2(-) 5(-) 7(-)8(-) 4(+)6(+)7(-)8(-) 2(-) 5(-)7(-)8(-) 1(+) 3(+)4(+)5(+)6(+) 1(+) 3(+)4(+)5(+)6(+) bsc-500 1-1e-2 mean 1136.62 2616.29 1078.96 245.07 1499.93 348.85 1608.20 1328.48 sd 91.30 321.25 143.03 11.52 259.98 39.88 297.02 250.91 stat 2(-) 4(+)5(-)6(+)7(-) 1(+)3(+)4(+)5(+)6(+) 8(+) 2(-)4(+)5(-) 7(-) 1(-)2(-)3(-)5(-) 7(-)8(-) 1(+)2(-)3(+)4(+)6(+) 1(-)2(-) 5(-)7(-)8(-) 1(+) 3(+)4(+) 6(+) 2(-) 4(+) 6(+) 1-1e-4 mean 1314.33 2746.50 1199.68 381.52 1556.25 483.48 1743.70 1410.42 sd 144.86 319.18 99.39 15.31 174.55 37.48 255.72 236.23 stat 2(-) 4(+) 6(+)7(-) 1(+)3(+)4(+)5(+)6(+) 8(+) 2(-)4(+)5(-) 7(-) 1(-)2(-)3(-)5(-) 7(-)8(-) 2(-)3(+)4(+)6(+) 1(-)2(-) 5(-)7(-)8(-) 1(+) 3(+)4(+) 6(+) 2(-) 4(+) 6(+) 1-1e-6 mean 1378.51 2852.30 1301.67 480.20 1660.77 583.79 1858.29 1472.92 sd 83.31 329.60 94.04 17.05 159.12 38.79 248.95 207.50 stat 2(-) 4(+) 6(+)7(-) 1(+)3(+)4(+)5(+)6(+) 8(+) 2(-)4(+)5(-) 7(-) 1(-)2(-)3(-)5(-) 7(-)8(-) 2(-)3(+)4(+)6(+) 1(-)2(-) 5(-)7(-)8(-) 1(+) 3(+)4(+) 6(+) 2(-) 4(+) 6(+) 1-1e-8 mean 1437.39 2922.95 1385.42 565.16 1771.05 676.43 1894.45 1555.17 sd 102.00 332.88 98.77 24.62 156.18 44.47 245.89 198.54 stat 2(-) 4(+)5(-)6(+)7(-) 1(+)3(+)4(+)5(+)6(+) 8(+) 2(-)4(+)5(-) 7(-) 1(-)2(-)3(-)5(-) 7(-)8(-) 1(+)2(-)3(+)4(+)6(+) 1(-)2(-) 5(-)7(-)8(-) 1(+) 3(+)4(+) 6(+) 2(-) 4(+) 6(+) 1-1e-10 mean 1525.06 2991.27 1442.49 642.17 1792.81 745.94 2017.01 1587.46 sd 108.49 333.12 89.00 21.54 237.58 43.17 253.12 208.47 stat 2(-) 4(+) 6(+)7(-) 1(+)3(+)4(+)5(+)6(+) 8(+) 2(-)4(+)5(-) 7(-) 1(-)2(-)3(-)5(-) 7(-)8(-) 2(-)3(+)4(+)6(+) 1(-)2(-) 5(-)7(-)8(-) 1(+) 3(+)4(+) 6(+)8(+) 2(-) 4(+) 6(+)7(-) bsc-1000 1-1e-2 mean 4009.04 7524.82 409884.63 347.73 411313.48 512.71 410140.41 1964.49 sd 257.09 434.49 640.94 17.54 568.63 39.13 662.48 221.72 stat 3(-)4(+)5(-)6(+)7(-) 4(+)5(-)6(+) 8(+) 1(+) 4(+) 6(+) 8(+) 1(-)2(-)3(-)5(-) 7(-)8(-) 1(+)2(+) 4(+)6(+) 8(+) 1(-)2(-)3(-) 5(-)7(-) 1(+) 4(+) 6(+)8(+) 2(-)3(-)4(+)5(-) 7(-) 1-1e-4 mean 4213.16 7686.58 410326.38 518.57 411185.46 686.09 410223.26 2087.05 sd 301.36 425.95 652.66 16.88 641.79 32.89 562.19 250.04 stat 3(-)4(+)5(-)6(+)7(-) 4(+)5(-)6(+) 8(+) 1(+) 4(+) 6(+) 8(+) 1(-)2(-)3(-)5(-) 7(-)8(-) 1(+)2(+) 4(+)6(+) 8(+) 1(-)2(-)3(-) 5(-)7(-) 1(+) 4(+) 6(+)8(+) 2(-)3(-)4(+)5(-) 7(-) 1-1e-6 mean 4333.94 7802.77 410446.46 645.08 411990.02 828.99 410847.30 2190.85 sd 242.59 431.65 617.26 24.81 704.69 36.65 663.89 297.34 stat 3(-)4(+)5(-)6(+)7(-) 4(+)5(-)6(+) 8(+) 1(+) 4(+) 6(+) 8(+) 1(-)2(-)3(-)5(-) 7(-)8(-) 1(+)2(+) 4(+)6(+) 8(+) 1(-)2(-)3(-) 5(-)7(-) 1(+) 4(+) 6(+)8(+) 2(-)3(-)4(+)5(-) 7(-) 1-1e-8 mean 4521.77 7906.71 410924.61 740.95 411925.95 922.64 410684.76 2238.43 sd 228.32 425.55 718.88 24.68 582.96 36.59 631.86 269.94 stat 3(-)4(+)5(-)6(+)7(-) 4(+)5(-)6(+) 8(+) 1(+) 4(+) 6(+) 8(+) 1(-)2(-)3(-)5(-) 7(-)8(-) 1(+)2(+) 4(+)6(+) 8(+) 1(-)2(-)3(-) 5(-)7(-) 1(+) 4(+) 6(+)8(+) 2(-)3(-)4(+)5(-) 7(-) 1-1e-10 mean 4503.78 7998.83 411025.05 837.02 412663.00 1023.83 411375.42 2261.18 sd 197.33 421.08 704.55 34.14 573.61 45.68 685.51 273.10 stat 3(-)4(+)5(-)6(+)7(-) 4(+)5(-)6(+) 8(+) 1(+) 4(+) 6(+) 8(+) 1(-)2(-)3(-)5(-) 7(-)8(-) 1(+)2(+) 4(+)6(+) 8(+) 1(-)2(-)3(-) 5(-)7(-) 1(+) 4(+) 6(+)8(+) 2(-)3(-)4(+)5(-) 7(-)
file-n uncorr-300 1-1e-2 mean 945.98 1668.00 1202.33 2109.33 2838.76 2533.63 1000.74 731.26 sd 391.72 319.49 993.38 2035.29 2614.97 2211.14 212.12 205.92 stat 2(-) 5(-) 1(+)3(+) 8(+) 2(-) 5(-) 1(+) 3(+) 8(+) 8(+) 2(-) 5(-)6(-) 1-1e-4 mean 1106.87 1853.26 1297.71 2332.48 3311.04 2933.58 1209.59 901.43 sd 226.28 310.82 1074.81 1982.36 2476.86 2396.38 232.74 196.62 stat 2(-) 5(-) 1(+)3(+) 8(+) 2(-) 5(-)6(-) 8(+) 1(+) 3(+) 8(+) 3(+) 8(+) 2(-) 4(-)5(-)6(-) 1-1e-6 mean 1210.91 1998.15 1775.94 2441.66 3610.81 3120.38 1242.63 1027.47 sd 307.16 332.54 1055.07 1964.21 2470.23 2414.79 217.35 201.80 stat 2(-) 5(-) 1(+) 8(+) 5(-) 8(+) 1(+) 3(+) 7(+)8(+) 8(+) 5(-) 2(-) 4(-)5(-)6(-) 1-1e-8 mean 1408.83 2091.52 1944.60 2642.58 4268.79 3192.95 1255.89 1080.82 sd 468.51 350.61 1082.86 2025.49 2447.70 2389.87 219.09 184.74 stat 2(-) 5(-) 1(+) 7(+)8(+) 5(-) 8(+) 5(-) 8(+) 1(+) 3(+)4(+) 7(+)8(+) 8(+) 2(-) 5(-) 2(-)3(-)4(-)5(-)6(-) 1-1e-10 mean 1451.24 2178.61 1905.01 2723.05 3258.22 3467.56 1496.30 1170.85 sd 341.05 360.79 1188.95 2010.12 2916.43 2478.18 267.63 196.55 stat 2(-) 1(+) 8(+) 8(+) 8(+) 8(+) 2(-) 4(-)5(-)6(-) uncorr-500 1-1e-2 mean 2758.66 5166.72 4692.54 2402.30 8593.98 4805.68 2767.95 1015.97 sd 748.26 791.02 2889.73 3779.15 5019.47 5694.30 367.39 212.98 stat 2(-) 5(-) 1(+) 4(+) 6(+)7(+)8(+) 4(+) 8(+) 2(-)3(-)5(-) 1(+) 4(+)6(+)7(+)8(+) 2(-) 5(-) 8(+) 2(-) 5(-) 8(+) 2(-)3(-) 5(-)6(-)7(-) 1-1e-4 mean 2827.53 5409.25 3867.45 2617.35 9185.15 5112.43 2813.72 1235.65 sd 656.22 792.25 2701.52 3739.70 5382.95 5815.69 434.49 204.94 stat 2(-) 5(-) 8(+) 1(+)3(+)4(+) 6(+)7(+)8(+) 2(-)4(+)5(-) 8(+) 2(-)3(-)5(-) 1(+) 3(+)4(+)6(+)7(+)8(+) 2(-) 5(-) 8(+) 2(-) 5(-) 8(+) 1(-)2(-)3(-) 5(-)6(-)7(-) 1-1e-6 mean 2961.62 5570.92 4540.11 2882.82 7470.14 5720.15 3116.11 1367.98 sd 414.82 794.65 2876.55 3916.57 5437.50 6125.23 411.77 202.66 stat 2(-) 5(-) 1(+) 4(+) 6(-)7(+)8(+) 4(+) 8(+) 2(-)3(-)5(-) 7(-) 1(+) 4(+)6(+)7(+)8(+) 2(+) 5(-) 8(+) 2(-) 4(+)5(-) 8(+) 2(-)3(-) 5(-)6(-)7(-) 1-1e-8 mean 3080.27 5753.94 4860.14 3130.72 9049.10 5844.85 3217.81 1506.13 sd 449.83 810.22 3767.45 3972.26 5894.32 6092.49 419.64 176.74 stat 2(-) 5(-) 8(+) 1(+) 4(+) 6(-)7(+)8(+) 4(+) 8(+) 2(-)3(-)5(-) 1(+) 4(+)6(+)7(+)8(+) 2(+) 5(-) 8(+) 2(-) 5(-) 8(+) 1(-)2(-)3(-) 5(-)6(-)7(-) 1-1e-10 mean 3163.57 5894.11 6206.53 3446.45 6673.91 6063.07 3445.78 1623.68 sd 424.09 813.07 3819.76 4276.45 3314.57 6128.37 326.79 180.50 stat 2(-) 5(-) 1(+) 4(+) 6(-)7(+)8(+) 4(+) 8(+) 2(-)3(-)5(-) 7(+) 1(+) 4(+)6(+) 8(+) 2(+) 5(-) 8(+) 2(-) 4(-) 8(+) 2(-)3(-) 5(-)6(-)7(-) uncorr-1000 1-1e-2 mean 9231.61 17188.70 114727.63 5979.00 122685.66 2702.03 113844.45 2062.52 sd 814.30 1205.16 2726.11 11017.83 9754.42 6339.35 762.22 402.12 stat 3(-)4(+)5(-) 7(-) 3(-)4(+)5(-)6(+) 8(+) 1(+)2(+)4(+) 6(+) 8(+) 1(-)2(-)3(-)5(-) 7(-) 1(+)2(+) 4(+)6(+) 8(+) 2(-)3(-) 5(-)7(-) 1(+) 4(+) 6(+)8(+) 2(-)3(-) 5(-) 7(-) 1-1e-4 mean 9177.81 17494.18 114477.99 6441.18 120969.26 3198.13 114193.45 2271.68 sd 696.44 1248.44 2071.98 11468.79 7347.59 6612.12 753.81 392.54 stat 3(-)4(+)5(-) 7(-) 4(+)5(-)6(+) 8(+) 1(+) 4(+) 6(+) 8(+) 1(-)2(-)3(-)5(-) 7(-) 1(+)2(+) 4(+)6(+) 8(+) 2(-)3(-) 5(-)7(-) 1(+) 4(+) 6(+)8(+) 2(-)3(-) 5(-) 7(-) 1-1e-6 mean 9512.49 17677.62 115591.71 6866.92 120856.28 3626.18 114489.89 2480.83 sd 678.98 1243.11 3541.35 11818.24 8138.08 6873.84 750.55 396.00 stat 3(-) 5(-) 7(-) 4(+)5(-)6(+) 8(+) 1(+) 4(+) 6(+) 8(+) 2(-)3(-)5(-) 7(-) 1(+)2(+) 4(+)6(+) 8(+) 2(-)3(-) 5(-)7(-) 1(+) 4(+) 6(+)8(+) 2(-)3(-) 5(-) 7(-) 1-1e-8 mean 9706.03 17829.34 115931.06 7230.38 122293.62 3782.15 114679.54 2607.18 sd 572.33 1251.87 3840.53 12232.98 7641.11 6848.63 709.58 378.08 stat 3(-) 5(-) 7(-) 4(+)5(-)6(+) 8(+) 1(+) 4(+) 6(+) 8(+) 2(-)3(-)5(-) 7(-) 1(+)2(+) 4(+)6(+) 8(+) 2(-)3(-) 5(-)7(-) 1(+) 4(+) 6(+)8(+) 2(-)3(-) 5(-) 7(-) 1-1e-10 mean 10022.48 17977.43 115709.63 7577.08 123010.60 4162.16 114574.99 2723.95 sd 678.10 1246.81 3937.13 12740.00 9210.85 7316.46 544.81 413.48 stat 3(-) 5(-) 7(-) 3(-)4(+)5(-)6(+) 8(+) 1(+)2(+)4(+) 6(+) 8(+) 2(-)3(-)5(-) 7(-) 1(+)2(+) 4(+)6(+) 8(+) 2(-)3(-) 5(-)7(-) 1(+) 4(+) 6(+)8(+) 2(-)3(-) 5(-) 7(-)
file-n bsc-300 1-1e-2 mean 4466.61 4487.73 4215.97 5322.54 4437.00 9655.01 4791.60 5514.44 sd 1014.97 957.71 664.10 1355.19 808.15 1545.97 950.87 1139.87 stat 6(-) 6(-) 8(-) 4(-) 6(-) 8(-) 3(+) 6(-) 6(-) 8(-) 1(+)2(+)3(+)4(+)5(+)7(+)8(+) 6(-) 2(+)3(+) 5(+)6(-) 1-1e-4 mean 6237.01 5995.76 5466.07 6093.17 6045.73 9655.01 6168.59 6428.00 sd 1174.91 1306.86 1123.67 1351.26 1030.07 1545.97 1154.45 1114.76 stat 6(-) 6(-) 6(-) 6(-) 6(-) 1(+)2(+)3(+)4(+)5(+)7(+)8(+) 6(-) 6(-) 1-1e-6 mean 6568.43 6870.48 6603.36 6702.88 6767.34 9655.01 7020.35 7009.09 sd 1321.75 1510.54 956.41 1439.76 1366.31 1545.97 1157.25 1304.29 stat 6(-) 6(-) 6(-) 6(-) 6(-) 1(+)2(+)3(+)4(+)5(+)7(+)8(+) 6(-) 6(-) 1-1e-8 mean 7351.90 7468.60 7321.93 7116.48 6902.42 9655.37 7532.36 7368.75 sd 1646.48 1650.94 1291.68 1495.14 1769.66 1544.93 1603.59 1417.00 stat 6(-) 6(-) 6(-) 6(-) 6(-) 1(+)2(+)3(+)4(+)5(+)7(+)8(+) 6(-) 6(-) 1-1e-10 mean 8713.97 7920.64 7493.40 7437.18 7627.66 9655.37 7329.94 7597.92 sd 1763.39 1755.45 1398.84 1527.07 1305.16 1544.93 1312.36 1467.78 stat 3(+)4(+) 7(+) 6(-) 1(-) 6(-) 1(-) 6(-) 6(-) 2(+)3(+)4(+)5(+)7(+)8(+) 1(-) 6(-) 6(-) bsc-500 1-1e-2 mean 6258.58 6487.52 29410.93 6445.08 7068.58 13652.65 7378.02 9185.46 sd 541.65 682.63 69142.95 1071.36 910.96 1954.11 927.97 1212.00 stat 6(-)7(-)8(-) 6(-) 8(-) 6(+) 8(+) 6(-) 8(-) 6(-) 8(-) 1(+)2(+)3(-)4(+)5(+)7(+) 1(+) 6(-)8(-) 1(+)2(+)3(-)4(+)5(+) 7(+) 1-1e-4 mean 8434.01 8799.85 162062.40 7710.78 211458.48 13652.65 195151.06 9806.77 sd 849.23 926.09 118492.91 1088.12 91709.21 1954.11 104079.24 1280.34 stat 3(-) 5(-)6(-)7(-) 3(-) 5(-)6(-)7(-) 1(+)2(+)4(+) 3(-)5(-)6(-)7(-)8(-) 1(+)2(+) 4(+) 8(+) 1(+)2(+) 4(+) 1(+)2(+) 4(+) 8(+) 4(+)5(-) 7(-) 1-1e-6 mean 10034.10 10191.07 247320.81 8537.01 256059.10 13652.65 256037.47 10162.90 sd 1080.52 1074.92 64226.62 1064.92 46205.48 1954.11 46259.89 1174.69 stat 3(-) 5(-)6(-)7(-) 3(-) 5(-)6(-)7(-) 1(+)2(+)4(+) 8(+) 3(-)5(-)6(-)7(-) 1(+)2(+) 4(+)6(+) 8(+) 1(+)2(+) 4(+)5(-)7(-)8(+) 1(+)2(+) 4(+) 6(+)8(+) 3(-) 5(-)6(-)7(-) 1-1e-8 mean 10927.87 11204.23 274851.72 9239.53 266437.83 13652.65 275650.63 10639.81 sd 1217.65 1188.92 917.99 1055.33 48244.34 1954.11 1149.82 1072.08 stat 3(-) 5(-) 7(-) 3(-) 5(-) 7(-) 1(+)2(+)4(+) 6(+) 8(+) 3(-)5(-)6(-)7(-) 1(+)2(+) 4(+)6(+) 8(+) 3(-)4(+)5(-)7(-)8(+) 1(+)2(+) 4(+) 6(+)8(+) 3(-) 5(-)6(-)7(-) 1-1e-10 mean 11950.95 12003.59 275051.04 9829.33 284102.52 13652.65 284582.83 11084.77 sd 1443.95 1261.07 49842.22 1076.38 1331.46 1954.11 1279.98 1057.26 stat 3(-)4(+)5(-) 7(-) 3(-)4(+)5(-) 7(-) 1(+)2(+)4(+) 6(+) 8(+) 1(-)2(-)3(-)5(-)6(-)7(-) 1(+)2(+) 4(+)6(+) 8(+) 3(-)4(+)5(-)7(-) 1(+)2(+) 4(+) 6(+)8(+) 3(-) 5(-) 7(-) bsc-1000 1-1e-2 mean 12323.59 12944.95 457044.61 11627.73 458107.66 24177.53 457180.88 15832.24 sd 1197.12 731.89 920.08 1197.09 1222.39 1845.16 815.05 1258.74 stat 3(-) 5(-)6(-)7(-)8(-) 3(-) 5(-)6(-)7(-) 1(+)2(+)4(+) 8(+) 3(-)5(-)6(-)7(-)8(-) 1(+)2(+) 4(+)6(+) 8(+) 1(+)2(+) 4(+)5(-) 1(+)2(+) 4(+) 8(+) 1(+) 3(-)4(+)5(-) 7(-) 1-1e-4 mean 15900.84 17076.69 546863.41 13552.39 531966.76 24177.53 484123.91 18014.17 sd 947.64 890.09 159738.67 1125.30 141005.27 1845.16 960.39 1291.59 stat 3(-) 5(-)6(-)7(-) 3(-)4(+)5(-)6(-)7(-) 1(+)2(+)4(+) 6(+) 8(+) 2(-)3(-)5(-)6(-)7(-)8(-) 1(+)2(+) 4(+)6(+) 8(+) 1(+)2(+)3(-)4(+)5(-) 1(+)2(+) 4(+) 8(+) 3(-)4(+)5(-) 7(-) 1-1e-6 mean 19761.79 19693.32 681220.86 14762.05 745678.16 24177.53 503969.56 18430.06 sd 3936.09 980.90 234484.48 1060.60 243061.17 1845.16 1049.68 1148.26 stat 3(-)4(+)5(-)6(-)7(-) 3(-)4(+)5(-) 7(-) 1(+)2(+)4(+) 6(+) 8(+) 1(-)2(-)3(-)5(-)6(-)7(-) 1(+)2(+) 4(+)6(+) 8(+) 1(+) 3(-)4(+)5(-) 8(+) 1(+)2(+) 4(+) 8(+) 3(-) 5(-)6(-)7(-) 1-1e-8 mean 20351.80 21677.05 931938.36 15937.20 900419.46 24177.53 520513.80 18708.22 sd 1443.84 1066.02 185963.55 942.21 211645.94 1845.16 1100.98 1033.42 stat 3(-)4(+)5(-) 7(-) 3(-)4(+)5(-) 7(-) 1(+)2(+)4(+) 6(+) 8(+) 1(-)2(-)3(-)5(-)6(-)7(-) 1(+)2(+) 4(+)6(+) 8(+) 3(-)4(+)5(-) 8(+) 1(+)2(+) 4(+) 8(+) 3(-) 5(-)6(-)7(-) 1-1e-10 mean 21353.85 23334.52 1007137.12 17028.60 1008027.72 24177.53 534799.69 19310.30 sd 1525.10 1101.85 127886.03 912.83 127488.98 1845.16 1019.27 931.51 stat 3(-)4(+)5(-) 7(-) 3(-)4(+)5(-) 8(+) 1(+)2(+)4(+) 6(+) 8(+) 1(-)2(-)3(-)5(-)6(-)7(-) 1(+)2(+) 4(+)6(+) 8(+) 3(-)4(+)5(-) 8(+) 1(+) 4(+) 8(+) 2(-)3(-) 5(-)6(-)7(-)
file-n uncorr-300 1-1e-2 mean 5473.62 5066.08 5494.36 5347.63 6643.20 13997.21 5654.57 4922.01 sd 937.40 875.68 576.05 1647.00 1130.91 5332.64 993.99 1289.74 stat 6(-) 5(-)6(-) 5(-)6(-) 5(-)6(-) 2(+)3(+)4(+) 8(+) 1(+)2(+)3(+)4(+) 7(+)8(+) 6(-) 5(-)6(-) 1-1e-4 mean 7491.01 7120.50 7356.04 6713.08 8406.00 14055.01 7294.12 6506.89 sd 1188.59 1299.54 854.95 1663.94 1307.81 5261.54 1390.90 1631.22 stat 6(-) 6(-) 6(-) 5(-)6(-) 4(+) 8(+) 1(+)2(+)3(+)4(+) 7(+)8(+) 6(-) 5(-)6(-) 1-1e-6 mean 8680.88 8381.90 8268.34 7654.64 9046.34 14099.12 8587.99 7534.74 sd 1704.01 1577.91 947.50 1776.82 1164.35 5207.77 1819.33 1906.94 stat 6(-) 6(-) 5(-)6(-) 4(+) 8(+) 2(+)3(+)4(+) 7(+)8(+) 6(-) 5(-)6(-) 1-1e-8 mean 9566.14 9306.38 9414.87 8392.13 10075.13 14147.05 9387.72 8325.86 sd 1647.52 1799.70 1138.86 1902.41 1038.71 5152.41 1471.13 2084.89 stat 6(-) 6(-) 5(-)6(-) 4(+) 8(+) 2(+)3(+)4(+) 7(+)8(+) 6(-) 5(-)6(-) 1-1e-10 mean 9965.64 10092.54 9460.92 8980.52 10385.57 14206.27 10234.25 8879.69 sd 2105.41 1986.29 1587.86 2029.00 1354.05 5092.47 1651.68 2302.55 stat 6(-) 6(-) 3(+)4(+) 8(+) 6(-) uncorr-500 1-1e-2 mean 9140.18 7811.70 11672.26 7908.55 13653.73 20841.60 10637.80 7537.59 sd 768.14 932.52 2375.92 1503.34 3232.94 5459.20 1085.90 956.23 stat 3(-) 5(-)6(-) 8(+) 3(-) 5(-)6(-)7(-) 1(+)2(+)4(+) 6(-) 8(+) 3(-)5(-)6(-)7(-) 1(+)2(+) 4(+) 8(+) 1(+)2(+)3(+)4(+) 7(+)8(+) 2(+) 4(+) 6(-)8(+) 1(-) 3(-) 5(-)6(-)7(-) 1-1e-4 mean 12103.88 10908.73 26160.68 10073.40 24302.11 20883.34 31845.72 10001.83 sd 1356.79 1340.84 24939.13 1423.48 21564.81 5395.37 28257.29 1165.87 stat 3(-) 5(-)6(-)7(-)8(+) 3(-) 5(-)6(-)7(-) 1(+)2(+)4(+) 8(+) 3(-)5(-)6(-)7(-) 1(+)2(+) 4(+) 8(+) 1(+)2(+) 4(+) 8(+) 1(+)2(+) 4(+) 8(+) 1(-) 3(-) 5(-)6(-)7(-) 1-1e-6 mean 13993.36 12945.27 49280.22 11659.83 55260.99 20914.15 53660.69 11641.35 sd 1020.13 1681.22 32542.25 1545.33 31736.78 5348.29 31764.74 1371.05 stat 3(-)4(+)5(-)6(-)7(-)8(+) 3(-) 5(-)6(-)7(-) 1(+)2(+)4(+) 8(+) 1(-) 3(-)5(-)6(-)7(-) 1(+)2(+) 4(+) 8(+) 1(+)2(+) 4(+) 8(+) 1(+)2(+) 4(+) 8(+) 1(-) 3(-) 5(-)6(-)7(-) 1-1e-8 mean 15134.30 14414.00 74206.19 12888.82 77754.99 20936.20 74189.27 12799.91 sd 1776.03 1840.11 22961.81 1692.62 20682.50 5314.18 24211.26 1463.69 stat 3(-) 5(-) 7(-) 3(-) 5(-) 7(-) 1(+)2(+)4(+) 8(+) 3(-)5(-)6(-)7(-) 1(+)2(+) 4(+)6(+) 8(+) 4(+)5(-) 8(+) 1(+)2(+) 4(+) 8(+) 3(-) 5(-)6(-)7(-) 1-1e-10 mean 16526.53 15701.69 84638.48 13883.37 79976.63 20954.53 84523.51 13781.29 sd 1343.02 1984.94 12860.26 1825.79 20898.31 5286.71 12750.30 1644.19 stat 3(-) 5(-) 7(-) 3(-) 5(-) 7(-) 1(+)2(+)4(+) 6(+) 8(+) 3(-)5(-)6(-)7(-) 1(+)2(+) 4(+)6(+) 8(+) 3(-)4(+)5(-)7(-)8(+) 1(+)2(+) 4(+) 6(+)8(+) 3(-) 5(-)6(-)7(-) uncorr-1000 1-1e-2 mean 18428.95 14585.24 135025.31 13342.87 139748.74 37929.35 132401.15 13821.51 sd 721.04 1141.72 3722.82 2003.26 5455.78 6173.11 896.62 1195.58 stat 3(-)4(+)5(-) 7(-)8(+) 3(-) 5(-)6(-)7(-) 1(+)2(+)4(+) 6(+) 8(+) 1(-) 3(-)5(-)6(-)7(-) 1(+)2(+) 4(+)6(+) 8(+) 2(+)3(-)4(+)5(-) 8(+) 1(+)2(+) 4(+) 8(+) 1(-) 3(-) 5(-)6(-)7(-) 1-1e-4 mean 22595.66 19514.85 151750.38 15798.00 149861.47 37929.35 142991.61 16827.28 sd 530.81 1290.56 21563.70 1536.92 3956.81 6173.11 883.03 1035.45 stat 3(-)4(+)5(-) 7(-)8(+) 3(-) 5(-)6(-)7(-) 1(+)2(+)4(+) 6(+) 8(+) 1(-) 3(-)5(-)6(-)7(-) 1(+)2(+) 4(+)6(+) 8(+) 2(+)3(-)4(+)5(-) 8(+) 1(+)2(+) 4(+) 8(+) 1(-) 3(-) 5(-)6(-)7(-) 1-1e-6 mean 25599.63 22768.84 174253.08 17791.35 187922.49 37929.35 150550.96 19078.26 sd 866.82 1399.38 46066.03 1313.42 50948.69 6173.11 1048.64 943.73 stat 3(-)4(+)5(-) 7(-)8(+) 3(-) 5(-)6(-)7(-) 1(+)2(+)4(+) 6(+) 8(+) 1(-) 3(-)5(-)6(-)7(-) 1(+)2(+) 4(+)6(+) 8(+) 2(+)3(-)4(+)5(-) 8(+) 1(+)2(+) 4(+) 8(+) 1(-) 3(-) 5(-)6(-)7(-) 1-1e-8 mean 27759.28 25454.64 210744.26 19503.03 212614.95 37929.35 156412.70 20727.27 sd 1074.52 1374.17 62150.85 1156.10 62249.27 6173.11 867.27 949.33 stat 3(-)4(+)5(-) 7(-)8(+) 3(-)4(+)5(-) 7(-) 1(+)2(+)4(+) 6(+) 8(+) 1(-)2(-)3(-)5(-)6(-)7(-) 1(+)2(+) 4(+)6(+) 8(+) 3(-)4(+)5(-) 8(+) 1(+)2(+) 4(+) 8(+) 1(-) 3(-) 5(-)6(-)7(-) 1-1e-10 mean 29510.27 28017.07 247510.31 21025.58 233641.91 37929.35 161886.32 22295.11 sd 1186.86 2018.23 62452.63 1167.42 64391.62 6173.11 1027.52 1056.64 stat 3(-)4(+)5(-) 7(-)8(+) 3(-)4(+)5(-) 7(-) 1(+)2(+)4(+) 6(+) 8(+) 1(-)2(-)3(-)5(-)6(-)7(-) 1(+)2(+) 4(+)6(+) 8(+) 3(-)4(+)5(-) 8(+) 1(+)2(+) 4(+) 8(+) 1(-) 3(-) 5(-)6(-)7(-)
file-n bsc-300 1-1e-2 mean 915.70 1218.96 47504.92 739.76 50173.84 707.87 26064.57 1332.74 sd 298.29 163.74 7397.13 513.76 344.26 313.88 247.48 338.84 stat 3(-) 5(-) 7(-) 3(-) 5(-) 7(-) 1(+)2(+)4(+) 6(+) 8(+) 3(-)5(-) 7(-)8(-) 1(+)2(+) 4(+)6(+) 8(+) 3(-) 5(-)7(-)8(-) 1(+)2(+) 4(+) 6(+)8(+) 3(-)4(+)5(-)6(+)7(-) 1-1e-4 mean 952.15 1327.12 48567.32 856.27 49513.23 814.84 26174.84 1414.52 sd 199.79 177.48 6142.37 501.83 4408.48 318.92 218.50 356.32 stat 3(-) 5(-) 7(-) 3(-) 5(-) 7(-) 1(+)2(+)4(+) 6(+) 8(+) 3(-)5(-) 7(-)8(-) 1(+)2(+) 4(+)6(+) 8(+) 3(-) 5(-)7(-)8(-) 1(+)2(+) 4(+) 6(+)8(+) 3(-)4(+)5(-)6(+)7(-) 1-1e-6 mean 1050.12 1402.09 49357.20 946.47 47276.35 896.53 26265.33 1471.14 sd 241.60 186.60 4434.79 493.73 8367.21 334.50 300.94 360.74 stat 3(-) 5(-) 7(-) 3(-) 5(-) 7(-) 1(+)2(+)4(+) 6(+) 8(+) 3(-)5(-) 7(-) 1(+)2(+) 4(+)6(+) 8(+) 3(-) 5(-)7(-)8(-) 1(+)2(+) 4(+) 6(+)8(+) 3(-) 5(-)6(+)7(-) 1-1e-8 mean 1097.25 1473.32 49426.26 1018.28 48838.29 961.31 26311.53 1521.50 sd 238.33 195.07 4405.08 490.24 6205.42 337.95 283.39 367.14 stat 3(-) 5(-) 7(-) 3(-) 5(-) 7(-) 1(+)2(+)4(+) 6(+) 8(+) 3(-)5(-) 7(-) 1(+)2(+) 4(+)6(+) 8(+) 3(-) 5(-)7(-)8(-) 1(+)2(+) 4(+) 6(+)8(+) 3(-) 5(-)6(+)7(-) 1-1e-10 mean 1076.30 1532.27 50398.51 1077.78 49825.39 1019.91 26403.25 1559.32 sd 145.99 201.30 291.59 477.95 4438.00 335.10 278.53 373.60 stat 3(-) 5(-) 7(-) 3(-) 5(-)6(+)7(-) 1(+)2(+)4(+) 6(+) 8(+) 3(-)5(-) 7(-) 1(+)2(+) 4(+)6(+) 8(+) 2(-)3(-) 5(-)7(-)8(-) 1(+)2(+) 4(+) 6(+)8(+) 3(-) 5(-)6(+)7(-) bsc-500 1-1e-2 mean 1892.39 2970.28 136028.18 1298.60 132642.88 844.49 43975.55 1512.52 sd 511.70 406.81 18172.66 994.55 23609.86 403.22 284.36 248.23 stat 3(-) 5(-) 7(-) 3(-)4(+)5(-)6(+) 8(+) 1(+)2(+)4(+) 6(+) 8(+) 2(-)3(-)5(-) 7(-) 1(+)2(+) 4(+)6(+) 8(+) 2(-)3(-) 5(-)7(-) 1(+) 4(+) 6(+)8(+) 2(-)3(-) 5(-) 7(-) 1-1e-4 mean 1863.40 3118.05 135010.80 1456.46 133108.61 988.92 44048.34 1614.09 sd 416.01 424.39 20208.49 980.58 25613.91 401.61 306.52 261.96 stat 3(-) 5(-) 7(-) 3(-)4(+)5(-)6(+) 8(+) 1(+)2(+)4(+) 6(+) 8(+) 2(-)3(-)5(-) 7(-) 1(+)2(+) 4(+)6(+) 8(+) 2(-)3(-) 5(-)7(-) 1(+) 4(+) 6(+)8(+) 2(-)3(-) 5(-) 7(-) 1-1e-6 mean 1986.99 3213.67 140461.52 1573.35 138489.34 1093.44 44263.57 1702.94 sd 400.78 435.87 24880.75 957.27 21438.15 391.49 318.24 260.75 stat 3(-) 5(-) 7(-) 3(-)4(+)5(-)6(+) 8(+) 1(+)2(+)4(+) 6(+) 8(+) 2(-)3(-)5(-) 7(-) 1(+)2(+) 4(+)6(+) 8(+) 2(-)3(-) 5(-)7(-) 1(+) 4(+) 6(+)8(+) 2(-)3(-) 5(-) 7(-) 1-1e-8 mean 2209.35 3290.65 136562.01 1664.21 129403.14 1191.52 44312.98 1780.95 sd 429.75 441.21 20888.14 947.20 28003.31 401.60 289.15 264.81 stat 3(-) 5(-) 7(-) 3(-)4(+)5(-)6(+) 8(+) 1(+)2(+)4(+) 6(+) 8(+) 2(-)3(-)5(-) 7(-) 1(+)2(+) 4(+)6(+) 8(+) 2(-)3(-) 5(-)7(-) 1(+) 4(+) 6(+)8(+) 2(-)3(-) 5(-) 7(-) 1-1e-10 mean 2109.18 3351.01 130054.06 1739.52 140156.32 1265.18 44590.49 1849.19 sd 338.44 448.10 26584.88 950.46 24442.78 397.22 273.22 278.42 stat 3(-) 5(-) 7(-) 3(-)4(+)5(-)6(+) 8(+) 1(+)2(+)4(+) 6(+) 8(+) 2(-)3(-)5(-) 7(-) 1(+)2(+) 4(+)6(+) 8(+) 2(-)3(-) 5(-)7(-) 1(+) 4(+) 6(+)8(+) 2(-)3(-) 5(-) 7(-) bsc-1000 1-1e-2 mean 85808.00 8135.24 578428.18 82685.59 576024.86 82257.58 90572.24 83374.29 sd 839.44 899.68 70904.79 1718.51 57071.38 220.19 424.32 296.15 stat 2(+)3(-)4(+)5(-)6(+) 1(-)3(-) 5(-) 7(-)8(-) 1(+)2(+)4(+) 6(+) 8(+) 1(-) 3(-)5(-) 7(-) 1(+)2(+) 4(+)6(+) 8(+) 1(-) 3(-) 5(-)7(-) 2(+) 4(+) 6(+)8(+) 2(+)3(-) 5(-) 7(-) 1-1e-4 mean 85561.24 8296.23 572711.13 82937.13 576830.38 82500.26 90815.87 83554.46 sd 766.96 907.14 80217.99 1740.03 44367.77 229.51 428.05 287.52 stat 2(+)3(-)4(+)5(-)6(+) 1(-)3(-) 5(-) 7(-)8(-) 1(+)2(+)4(+) 6(+) 8(+) 1(-) 3(-)5(-) 7(-) 1(+)2(+) 4(+)6(+) 8(+) 1(-) 3(-) 5(-)7(-) 2(+) 4(+) 6(+)8(+) 2(+)3(-) 5(-) 7(-) 1-1e-6 mean 85965.34 8419.50 589168.21 83157.02 555833.32 82670.12 90804.20 83689.01 sd 1022.60 905.20 82644.35 1745.40 105133.06 232.10 545.36 295.45 stat 2(+)3(-)4(+)5(-)6(+) 1(-)3(-) 5(-) 7(-)8(-) 1(+)2(+)4(+) 6(+) 8(+) 1(-) 3(-)5(-) 7(-) 1(+)2(+) 4(+)6(+) 8(+) 1(-) 3(-) 5(-)7(-) 2(+) 4(+) 6(+)8(+) 2(+)3(-) 5(-) 7(-) 1-1e-8 mean 85763.58 8521.27 552739.32 83295.63 566644.29 82808.40 91106.89 83795.89 sd 539.48 915.48 104042.17 1736.42 87007.87 237.65 471.31 288.79 stat 2(+)3(-)4(+)5(-)6(+) 1(-)3(-) 5(-) 7(-)8(-) 1(+)2(+)4(+) 6(+) 8(+) 1(-) 3(-)5(-) 7(-) 1(+)2(+) 4(+)6(+) 8(+) 1(-) 3(-) 5(-)7(-) 2(+) 4(+) 6(+)8(+) 2(+)3(-) 5(-) 7(-) 1-1e-10 mean 85921.67 8618.02 560368.66 83417.82 597928.84 82930.37 91183.68 83898.06 sd 360.73 921.00 92614.05 1730.56 60969.52 241.00 538.45 284.94 stat 2(+)3(-)4(+)5(-)6(+) 1(-)3(-) 5(-) 7(-)8(-) 1(+)2(+)4(+) 6(+) 8(+) 1(-) 3(-)5(-) 7(-) 1(+)2(+) 4(+)6(+) 8(+) 1(-) 3(-) 5(-)7(-) 2(+) 4(+) 6(+)8(+) 2(+)3(-) 5(-) 7(-)
file-n uncorr-300 1-1e-2 mean 1793.71 2792.87 14366.97 2801.39 15547.12 3081.34 8537.96 1078.84 sd 632.59 423.82 3106.87 1833.90 3418.36 1994.75 227.04 171.37 stat 3(-) 5(-) 7(-) 3(-) 5(-) 7(-)8(+) 1(+)2(+)4(+) 6(+) 8(+) 3(-)5(-) 7(-) 1(+)2(+) 4(+)6(+) 8(+) 3(-) 5(-)7(-)8(+) 1(+)2(+) 4(+) 6(+)8(+) 2(-)3(-) 5(-)6(-)7(-) 1-1e-4 mean 2052.79 2947.92 13997.83 3095.06 15838.95 3302.84 8787.47 1234.72 sd 705.46 427.45 2934.27 1923.73 3449.72 2019.49 252.18 192.41 stat 3(-) 5(-) 7(-) 3(-) 5(-) 7(-)8(+) 1(+)2(+)4(+) 6(+) 8(+) 3(-)5(-) 7(-) 1(+)2(+) 4(+)6(+) 8(+) 3(-) 5(-)7(-)8(+) 1(+)2(+) 4(+) 6(+)8(+) 2(-)3(-) 5(-)6(-)7(-) 1-1e-6 mean 2183.29 3092.47 14586.83 3277.64 16578.09 3469.86 8823.81 1341.67 sd 615.31 434.77 2293.12 1962.28 3524.56 2015.20 224.29 189.92 stat 3(-) 5(-) 7(-) 3(-) 5(-) 7(-)8(+) 1(+)2(+)4(+) 6(+) 8(+) 3(-)5(-) 7(-)8(+) 1(+)2(+) 4(+)6(+) 8(+) 3(-) 5(-)7(-)8(+) 1(+)2(+) 4(+) 6(+)8(+) 2(-)3(-)4(-)5(-)6(-)7(-) 1-1e-8 mean 2395.41 3203.51 13855.50 3439.24 16580.15 3599.16 8967.61 1445.09 sd 669.02 436.97 3063.33 2008.85 2649.59 2014.53 296.95 185.98 stat 3(-) 5(-) 7(-) 3(-) 5(-) 7(-)8(+) 1(+)2(+)4(+) 6(+) 8(+) 3(-)5(-) 7(-)8(+) 1(+)2(+) 4(+)6(+) 8(+) 3(-) 5(-)7(-)8(+) 1(+)2(+) 4(+) 6(+)8(+) 2(-)3(-)4(-)5(-)6(-)7(-) 1-1e-10 mean 2440.55 3278.73 14317.93 3555.29 17261.95 3700.01 9103.76 1519.49 sd 692.16 444.08 2987.58 2020.67 2714.72 2010.34 251.73 173.86 stat 3(-) 5(-) 7(-) 3(-) 5(-) 7(-)8(+) 1(+)2(+)4(+) 6(+) 8(+) 3(-)5(-) 7(-)8(+) 1(+)2(+) 4(+)6(+) 8(+) 3(-) 5(-)7(-)8(+) 1(+)2(+) 4(+) 6(+)8(+) 2(-)3(-)4(-)5(-)6(-)7(-) uncorr-500 1-1e-2 mean 4333.76 7177.54 40166.94 5478.59 40245.13 6938.56 15316.40 1765.90 sd 1233.81 913.93 4889.92 3043.64 5473.15 4793.23 476.50 331.17 stat 3(-) 5(-) 7(-) 3(-) 5(-) 7(-)8(+) 1(+)2(+)4(+) 6(+) 8(+) 3(-)5(-) 7(-) 1(+)2(+) 4(+)6(+) 8(+) 3(-) 5(-)7(-)8(+) 1(+)2(+) 4(+) 6(+)8(+) 2(-)3(-) 5(-)6(-)7(-) 1-1e-4 mean 5309.32 7467.78 39903.11 5855.18 43864.20 7420.64 15556.01 1989.63 sd 1371.39 1014.97 5632.12 3097.96 5877.33 4819.16 474.13 304.56 stat 3(-) 5(-) 7(-) 3(-) 5(-) 7(-)8(+) 1(+)2(+)4(+) 6(+) 8(+) 3(-)5(-) 7(-) 1(+)2(+) 4(+)6(+) 8(+) 3(-) 5(-)7(-)8(+) 1(+)2(+) 4(+) 6(+)8(+) 2(-)3(-) 5(-)6(-)7(-) 1-1e-6 mean 4862.06 7644.72 40176.41 6195.71 43924.50 7730.77 15761.27 2139.19 sd 1151.78 1036.21 4305.02 3104.75 5369.08 4794.10 650.34 289.26 stat 3(-) 5(-) 7(-) 3(-) 5(-) 7(-)8(+) 1(+)2(+)4(+) 6(+) 8(+) 3(-)5(-) 7(-)8(+) 1(+)2(+) 4(+)6(+) 8(+) 3(-) 5(-)7(-)8(+) 1(+)2(+) 4(+) 6(+)8(+) 2(-)3(-)4(-)5(-)6(-)7(-) 1-1e-8 mean 5695.06 7802.34 41702.57 6493.00 44858.08 7934.40 16018.12 2276.43 sd 1516.83 1042.58 5192.58 3161.31 4931.64 4784.64 476.45 271.85 stat 3(-) 5(-) 7(-) 3(-) 5(-) 7(-)8(+) 1(+)2(+)4(+) 6(+) 8(+) 3(-)5(-) 7(-)8(+) 1(+)2(+) 4(+)6(+) 8(+) 3(-) 5(-)7(-)8(+) 1(+)2(+) 4(+) 6(+)8(+) 2(-)3(-)4(-)5(-)6(-)7(-) 1-1e-10 mean 5122.39 7971.67 39640.05 6687.25 45321.95 8120.80 16019.68 2395.87 sd 1188.90 1053.50 5991.16 3202.38 5976.00 4788.97 529.92 272.88 stat 3(-) 5(-) 7(-) 3(-) 5(-) 7(-)8(+) 1(+)2(+)4(+) 6(+) 8(+) 3(-)5(-) 7(-)8(+) 1(+)2(+) 4(+)6(+) 8(+) 3(-) 5(-)7(-)8(+) 1(+)2(+) 4(+) 6(+)8(+) 2(-)3(-)4(-)5(-)6(-)7(-) uncorr-1000 1-1e-2 mean 34889.08 19448.86 170293.59 28360.03 169205.97 33900.41 34240.48 24580.13 sd 3368.49 2856.90 19327.65 7318.85 17409.35 12181.93 1888.96 826.49 stat 2(+)3(-) 5(-) 8(+) 1(-)3(-)4(-)5(-)6(-)7(-)8(-) 1(+)2(+)4(+) 6(+)7(+)8(+) 2(+)3(-)5(-) 1(+)2(+) 4(+)6(+)7(+)8(+) 2(+)3(-) 5(-) 2(+)3(-) 5(-) 8(+) 1(-)2(+)3(-) 5(-) 7(-) 1-1e-4 mean 35278.23 19823.72 169244.44 28837.32 163332.70 34334.78 34332.12 24911.28 sd 3957.69 2855.24 21863.14 7486.24 23265.57 12202.23 2427.28 937.18 stat 2(+)3(-) 5(-) 8(+) 1(-)3(-)4(-)5(-)6(-)7(-)8(-) 1(+)2(+)4(+) 6(+)7(+)8(+) 2(+)3(-)5(-) 1(+)2(+) 4(+)6(+)7(+)8(+) 2(+)3(-) 5(-) 2(+)3(-) 5(-) 8(+) 1(-)2(+)3(-) 5(-) 7(-) 1-1e-6 mean 34536.37 20171.34 168163.16 29194.85 174461.21 34742.96 34703.69 25160.43 sd 2804.75 2949.68 17949.59 7701.12 26234.43 12221.89 1996.12 984.05 stat 2(+)3(-) 5(-) 1(-)3(-)4(-)5(-)6(-)7(-)8(-) 1(+)2(+)4(+) 6(+)7(+)8(+) 2(+)3(-)5(-) 1(+)2(+) 4(+)6(+)7(+)8(+) 2(+)3(-) 5(-) 2(+)3(-) 5(-) 8(+) 2(+)3(-) 5(-) 7(-) 1-1e-8 mean 34817.95 20482.89 168885.60 29470.44 158848.17 34948.78 34648.62 25310.82 sd 3280.64 3007.35 22589.29 7765.24 30606.89 12218.67 2274.82 980.72 stat 2(+)3(-) 5(-) 8(+) 1(-)3(-)4(-)5(-)6(-)7(-) 1(+)2(+)4(+) 6(+)7(+)8(+) 2(+)3(-)5(-) 1(+)2(+) 4(+)6(+)7(+)8(+) 2(+)3(-) 5(-) 2(+)3(-) 5(-) 8(+) 1(-) 3(-) 5(-) 7(-) 1-1e-10 mean 35368.31 20689.95 170029.36 29808.83 164424.93 35422.19 34737.79 25465.29 sd 3431.41 3076.52 20809.46 7911.83 22149.53 12401.05 1731.78 1000.07 stat 2(+)3(-) 5(-) 8(+) 1(-)3(-)4(-)5(-)6(-)7(-) 1(+)2(+)4(+) 6(+)7(+)8(+) 2(+)3(-)5(-) 1(+)2(+) 4(+)6(+)7(+)8(+) 2(+)3(-) 5(-) 2(+)3(-) 5(-) 8(+) 1(-) 3(-) 5(-) 7(-)
file-n bsc-300 1-1e-2 mean 4592.89 4914.08 76483.86 6718.80 75946.58 10617.98 34271.25 7464.36 sd 1323.39 1773.00 14242.59 3236.50 13866.86 3418.00 1744.87 3340.07 stat 3(-) 5(-)6(-)7(-) 3(-) 5(-)6(-)7(-) 1(+)2(+)4(+) 6(+) 8(+) 3(-)5(-) 7(-) 1(+)2(+) 4(+)6(+) 8(+) 1(+)2(+)3(-) 5(-) 1(+)2(+) 4(+) 8(+) 3(-) 5(-) 7(-) 1-1e-4 mean 6428.00 6553.27 97643.48 7635.49 100364.57 10624.02 38213.63 8169.49 sd 2278.24 2407.54 11581.29 3501.58 13482.52 3412.78 2440.59 3539.14 stat 3(-) 5(-) 7(-) 3(-) 5(-) 7(-) 1(+)2(+)4(+) 6(+) 8(+) 3(-)5(-) 7(-) 1(+)2(+) 4(+)6(+) 8(+) 3(-) 5(-)7(-) 1(+)2(+) 4(+) 6(+)8(+) 3(-) 5(-) 7(-) 1-1e-6 mean 7650.44 7555.25 108432.36 8169.17 105854.14 10628.02 41899.42 8594.59 sd 2740.87 2813.03 15003.37 3621.23 15568.12 3409.01 2975.40 3533.70 stat 3(-) 5(-) 7(-) 3(-) 5(-) 7(-) 1(+)2(+)4(+) 6(+) 8(+) 3(-)5(-) 7(-) 1(+)2(+) 4(+)6(+) 8(+) 3(-) 5(-)7(-) 1(+)2(+) 4(+) 6(+)8(+) 3(-) 5(-) 7(-) 1-1e-8 mean 8331.79 8371.25 111378.24 8646.50 115279.56 10631.20 44008.74 8957.32 sd 3403.70 3200.07 15934.99 3791.30 19418.61 3406.01 3405.99 3605.92 stat 3(-) 5(-) 7(-) 3(-) 5(-) 7(-) 1(+)2(+)4(+) 6(+) 8(+) 3(-)5(-) 7(-) 1(+)2(+) 4(+)6(+) 8(+) 3(-) 5(-)7(-) 1(+)2(+) 4(+) 6(+)8(+) 3(-) 5(-) 7(-) 1-1e-10 mean 8174.14 9139.65 123081.68 9040.25 122919.72 10635.19 46526.31 9262.35 sd 2877.04 3714.01 20705.38 4000.37 21796.90 3401.96 3871.42 3657.28 stat 3(-) 5(-) 7(-) 3(-) 5(-) 7(-) 1(+)2(+)4(+) 6(+) 8(+) 3(-)5(-) 7(-) 1(+)2(+) 4(+)6(+) 8(+) 3(-) 5(-)7(-) 1(+)2(+) 4(+) 6(+)8(+) 3(-) 5(-) 7(-) bsc-500 1-1e-2 mean 7109.59 7041.69 190173.08 7851.69 201039.42 16658.60 55257.72 9202.24 sd 1320.85 1679.45 23633.35 3000.34 20453.55 5448.98 1477.31 2180.30 stat 3(-) 5(-)6(-)7(-) 3(-) 5(-)6(-)7(-) 1(+)2(+)4(+) 6(+) 8(+) 3(-)5(-)6(-)7(-) 1(+)2(+) 4(+)6(+) 8(+) 1(+)2(+)3(-)4(+)5(-) 1(+)2(+) 4(+) 8(+) 3(-) 5(-) 7(-) 1-1e-4 mean 12859.92 9536.66 226704.04 9145.54 234425.24 16684.73 60248.51 10661.46 sd 12916.59 2147.92 34657.48 3260.21 30466.02 5423.36 2090.70 2510.77 stat 3(-) 5(-) 7(-) 3(-) 5(-) 7(-) 1(+)2(+)4(+) 6(+) 8(+) 3(-)5(-)6(-)7(-) 1(+)2(+) 4(+)6(+) 8(+) 3(-)4(+)5(-) 1(+)2(+) 4(+) 8(+) 3(-) 5(-) 7(-) 1-1e-6 mean 22226.44 11291.63 253916.63 9989.11 257216.42 16757.22 64417.82 11391.29 sd 22391.50 2415.32 30987.71 3418.80 46213.97 5421.70 2105.99 2466.58 stat 3(-) 5(-) 7(-) 3(-) 5(-) 7(-) 1(+)2(+)4(+) 6(+) 8(+) 3(-)5(-) 7(-) 1(+)2(+) 4(+)6(+) 8(+) 3(-) 5(-) 1(+)2(+) 4(+) 8(+) 3(-) 5(-) 7(-) 1-1e-8 mean 30206.56 12871.75 287745.57 10707.09 281820.56 16812.16 67243.24 11997.58 sd 26685.91 2807.91 30823.20 3547.65 38780.96 5402.62 2994.87 2473.31 stat 3(-) 5(-) 7(-) 3(-) 5(-) 7(-) 1(+)2(+)4(+) 6(+) 8(+) 3(-)5(-) 7(-) 1(+)2(+) 4(+)6(+) 8(+) 3(-) 5(-)7(-) 1(+)2(+) 4(+) 6(+)8(+) 3(-) 5(-) 7(-) 1-1e-10 mean 31329.44 14492.42 293305.83 11309.06 294500.79 16858.00 70136.82 12495.15 sd 27263.99 3113.94 37289.25 3675.52 41606.52 5376.27 2809.35 2462.12 stat 3(-) 5(-) 7(-) 3(-) 5(-) 7(-) 1(+)2(+)4(+) 6(+) 8(+) 3(-)5(-) 7(-) 1(+)2(+) 4(+)6(+) 8(+) 3(-) 5(-)7(-) 1(+)2(+) 4(+) 6(+)8(+) 3(-) 5(-) 7(-) bsc-1000 1-1e-2 mean 101047.46 13330.65 761399.98 101665.95 731818.44 115711.31 106938.17 105441.13 sd 744.81 1413.45 108327.24 2773.94 110632.30 5001.39 1393.93 2116.59 stat 3(-) 5(-)6(-)7(-) 3(-) 5(-)6(-)7(-)8(-) 1(+)2(+)4(+) 7(+)8(+) 3(-)5(-)6(-)7(-) 1(+)2(+) 4(+) 7(+)8(+) 1(+)2(+) 4(+) 8(+) 1(+)2(+)3(-)4(+)5(-) 2(+)3(-) 5(-)6(-) 1-1e-4 mean 109275.93 17480.53 793411.21 108254.78 797893.76 120310.79 114885.52 112617.11 sd 1080.43 1744.47 128781.04 2823.07 160429.04 5001.39 1461.46 2716.70 stat 3(-) 5(-)6(-)7(-) 3(-) 5(-)6(-)7(-)8(-) 1(+)2(+)4(+) 7(+)8(+) 3(-)5(-)6(-)7(-) 1(+)2(+) 4(+) 7(+)8(+) 1(+)2(+) 4(+) 1(+)2(+)3(-)4(+)5(-) 2(+)3(-) 5(-) 1-1e-6 mean 114722.99 20789.33 875195.67 112967.85 937818.12 123727.96 121211.33 116942.72 sd 1430.42 1895.98 145122.02 2799.99 89358.98 5001.14 1889.57 2721.66 stat 3(-) 5(-)6(-)7(-) 3(-) 5(-)6(-)7(-)8(-) 1(+)2(+)4(+) 7(+)8(+) 3(-)5(-)6(-)7(-) 1(+)2(+) 4(+)6(+)7(+)8(+) 1(+)2(+) 4(+)5(-) 1(+)2(+)3(-)4(+)5(-) 2(+)3(-) 5(-) 1-1e-8 mean 119306.94 23941.84 956047.20 116911.84 965114.75 126568.04 127054.29 120388.41 sd 1897.08 2539.35 116359.91 2827.96 123742.14 5004.87 1800.93 2594.39 stat 2(+)3(-) 5(-) 7(-) 1(-)3(-) 5(-)6(-)7(-)8(-) 1(+)2(+)4(+) 6(+) 8(+) 3(-)5(-)6(-)7(-) 1(+)2(+) 4(+)6(+) 8(+) 2(+)3(-)4(+)5(-) 1(+)2(+) 4(+) 8(+) 2(+)3(-) 5(-) 7(-) 1-1e-10 mean 123444.02 27621.05 1027137.34 120376.14 1007812.84 129075.59 130931.65 123520.78 sd 2007.02 3050.64 150411.27 2858.42 133290.92 5032.44 2780.91 2522.81 stat 2(+)3(-) 5(-) 7(-) 1(-)3(-) 5(-)6(-)7(-)8(-) 1(+)2(+)4(+) 6(+)7(+)8(+) 3(-)5(-)6(-)7(-) 1(+)2(+) 4(+)6(+) 8(+) 2(+)3(-)4(+)5(-) 1(+)2(+)3(-)4(+) 8(+) 2(+)3(-) 5(-) 7(-)
file-n uncorr-300 1-1e-2 mean 6394.49 5723.50 23774.28 7808.11 25178.10 16816.53 14269.16 6315.80 sd 1197.92 1283.46 2663.05 4009.47 3407.78 7300.67 1002.17 2073.14 stat 3(-) 5(-)6(-)7(-) 3(-) 5(-)6(-)7(-) 1(+)2(+)4(+) 8(+) 3(-)5(-)6(-)7(-) 1(+)2(+) 4(+) 7(+)8(+) 1(+)2(+) 4(+) 8(+) 1(+)2(+) 4(+)5(-) 8(+) 3(-) 5(-)6(-)7(-) 1-1e-4 mean 7963.93 7820.36 28731.17 8904.89 29493.40 16929.70 16958.28 7777.07 sd 1908.03 1825.56 5432.41 3916.69 4675.16 7207.89 1686.93 2227.17 stat 3(-) 5(-)6(-)7(-) 3(-) 5(-)6(-)7(-) 1(+)2(+)4(+) 6(+) 8(+) 3(-)5(-)6(-)7(-) 1(+)2(+) 4(+)6(+)7(+)8(+) 1(+)2(+)3(-)4(+)5(-) 8(+) 1(+)2(+) 4(+)5(-) 8(+) 3(-) 5(-)6(-)7(-) 1-1e-6 mean 10099.39 9264.14 33370.86 9690.95 33715.79 17013.54 19339.53 8839.52 sd 2302.98 2247.84 4942.03 3924.11 5271.48 7143.22 2167.84 2415.52 stat 3(-) 5(-) 7(-) 3(-) 5(-)6(-)7(-) 1(+)2(+)4(+) 6(+) 8(+) 3(-)5(-)6(-)7(-) 1(+)2(+) 4(+)6(+) 8(+) 2(+)3(-)4(+)5(-) 8(+) 1(+)2(+) 4(+) 8(+) 3(-) 5(-)6(-)7(-) 1-1e-8 mean 10954.66 10517.81 36037.82 10328.23 36798.75 17083.71 20073.93 9600.01 sd 2314.26 2795.83 4201.54 3991.74 5878.55 7091.60 2315.86 2616.60 stat 3(-) 5(-) 7(-) 3(-) 5(-) 7(-) 1(+)2(+)4(+) 6(+) 8(+) 3(-)5(-)6(-)7(-) 1(+)2(+) 4(+)6(+) 8(+) 3(-)4(+)5(-) 8(+) 1(+)2(+) 4(+) 8(+) 3(-) 5(-)6(-)7(-) 1-1e-10 mean 12089.29 11603.06 39374.90 10867.92 39226.89 17148.29 20858.91 10221.50 sd 3315.95 3287.02 5344.80 4080.16 5084.32 7045.55 3159.50 2740.40 stat 3(-) 5(-) 7(-) 3(-) 5(-) 7(-) 1(+)2(+)4(+) 6(+)7(+)8(+) 3(-)5(-) 7(-) 1(+)2(+) 4(+)6(+)7(+)8(+) 3(-) 5(-) 8(+) 1(+)2(+)3(-)4(+)5(-) 8(+) 3(-) 5(-)6(-)7(-) uncorr-500 1-1e-2 mean 11723.44 8653.93 60257.77 10012.60 61628.08 27845.05 23262.03 9942.17 sd 2565.62 1259.09 10065.10 4066.52 7941.62 10167.35 1364.19 3064.03 stat 3(-) 5(-)6(-)7(-) 3(-) 5(-)6(-)7(-) 1(+)2(+)4(+) 6(+)7(+)8(+) 3(-)5(-)6(-)7(-) 1(+)2(+) 4(+)6(+)7(+)8(+) 1(+)2(+)3(-)4(+)5(-) 8(+) 1(+)2(+)3(-)4(+)5(-) 8(+) 3(-) 5(-)6(-)7(-) 1-1e-4 mean 15389.55 11799.70 70394.77 11711.68 70997.88 27998.93 27740.98 12093.21 sd 3810.03 1837.91 8754.89 3911.08 10435.88 10035.09 1942.61 3323.25 stat 3(-) 5(-) 3(-) 5(-)6(-)7(-) 1(+)2(+)4(+) 6(+)7(+)8(+) 3(-)5(-)6(-)7(-) 1(+)2(+) 4(+)6(+)7(+)8(+) 2(+)3(-)4(+)5(-) 8(+) 2(+)3(-)4(+)5(-) 8(+) 3(-) 5(-)6(-)7(-) 1-1e-6 mean 19608.25 14272.50 77682.08 13027.19 79330.94 28137.44 29625.26 13659.91 sd 7523.57 2498.46 11758.15 3978.99 7474.45 9921.76 2634.66 3606.20 stat 3(-) 5(-) 3(-) 5(-)6(-)7(-) 1(+)2(+)4(+) 6(+)7(+)8(+) 3(-)5(-)6(-)7(-) 1(+)2(+) 4(+)6(+)7(+)8(+) 2(+)3(-)4(+)5(-) 8(+) 2(+)3(-)4(+)5(-) 8(+) 3(-) 5(-)6(-)7(-) 1-1e-8 mean 22127.23 16573.18 89072.65 14089.19 84797.13 28230.71 31138.35 14863.57 sd 7067.25 3801.19 12627.59 4085.52 13067.92 9831.25 3173.87 3913.23 stat 3(-) 5(-) 3(-) 5(-)6(-)7(-) 1(+)2(+)4(+) 6(+)7(+)8(+) 3(-)5(-)6(-)7(-) 1(+)2(+) 4(+)6(+)7(+)8(+) 2(+)3(-)4(+)5(-) 8(+) 2(+)3(-)4(+)5(-) 8(+) 3(-) 5(-)6(-)7(-) 1-1e-10 mean 22603.87 18573.17 87460.94 15020.88 88101.11 28339.28 32319.19 15918.19 sd 7914.29 4730.49 11454.39 4182.78 12228.71 9762.32 2935.88 4172.90 stat 3(-) 5(-) 3(-) 5(-) 7(-) 1(+)2(+)4(+) 6(+)7(+)8(+) 3(-)5(-)6(-)7(-) 1(+)2(+) 4(+)6(+)7(+)8(+) 3(-)4(+)5(-) 8(+) 2(+)3(-)4(+)5(-) 8(+) 3(-) 5(-)6(-)7(-) uncorr-1000 1-1e-2 mean 45293.37 16214.85 206909.35 42053.49 214719.40 69255.72 44957.54 38791.22 sd 2300.90 1385.16 31906.81 6094.73 26377.23 11537.54 1667.29 3773.39 stat 2(+)3(-) 5(-) 1(-)3(-)4(-)5(-)6(-)7(-) 1(+)2(+)4(+) 7(+)8(+) 2(+)3(-)5(-)6(-) 1(+)2(+) 4(+) 7(+)8(+) 2(+) 4(+) 8(+) 2(+)3(-) 5(-) 3(-) 5(-)6(-) 1-1e-4 mean 50237.33 21671.15 242359.54 45324.70 232982.26 70556.51 51251.37 42910.63 sd 2502.78 2026.30 31263.00 5445.51 34287.89 11387.93 2219.98 3712.39 stat 2(+)3(-) 5(-) 1(-)3(-)4(-)5(-)6(-)7(-) 1(+)2(+)4(+) 7(+)8(+) 2(+)3(-)5(-)6(-) 1(+)2(+) 4(+) 7(+)8(+) 2(+) 4(+) 8(+) 2(+)3(-) 5(-) 8(+) 3(-) 5(-)6(-)7(-) 1-1e-6 mean 53270.98 26237.76 261319.27 47907.56 266912.93 71542.92 54673.39 45903.45 sd 2268.05 3469.61 34067.55 5134.77 39015.71 11309.17 2146.56 3809.12 stat 2(+)3(-) 5(-) 1(-)3(-)4(-)5(-)6(-)7(-) 1(+)2(+)4(+) 7(+)8(+) 2(+)3(-)5(-)6(-) 1(+)2(+) 4(+) 7(+)8(+) 2(+) 4(+) 8(+) 2(+)3(-) 5(-) 8(+) 3(-) 5(-)6(-)7(-) 1-1e-8 mean 56463.59 31251.38 275558.09 50113.19 280882.56 72357.43 57970.75 48326.49 sd 2557.19 5918.62 47868.94 4977.79 42449.69 11224.79 2779.10 3966.83 stat 2(+)3(-) 5(-) 1(-)3(-) 5(-)6(-)7(-) 1(+)2(+)4(+) 7(+)8(+) 3(-)5(-)6(-) 1(+)2(+) 4(+) 7(+)8(+) 2(+) 4(+) 8(+) 2(+)3(-) 5(-) 8(+) 3(-) 5(-)6(-)7(-) 1-1e-10 mean 59045.22 35895.30 285749.73 52096.25 308486.90 73140.96 59800.02 50462.30 sd 1822.89 7809.09 35103.86 4985.05 42587.41 11152.21 3059.74 4201.79 stat 2(+)3(-) 5(-) 8(+) 1(-)3(-) 5(-)6(-)7(-) 1(+)2(+)4(+) 7(+)8(+) 3(-)5(-)6(-)7(-) 1(+)2(+) 4(+)6(+)7(+)8(+) 2(+) 4(+)5(-) 8(+) 2(+)3(-)4(+)5(-) 8(+) 1(-) 3(-) 5(-)6(-)7(-)
file-n bsc-300 1-1e-2 mean 1185.44 1390.49 51656.91 767.31 50901.65 879.58 14113.42 1322.12 sd 291.86 207.48 9183.86 412.48 8969.17 332.18 213.10 336.51 stat 3(-) 5(-) 7(-) 3(-)4(+)5(-)6(+)7(-) 1(+)2(+)4(+) 6(+) 8(+) 2(-)3(-)5(-) 7(-)8(-) 1(+)2(+) 4(+)6(+) 8(+) 2(-)3(-) 5(-)7(-) 1(+)2(+) 4(+) 6(+)8(+) 3(-)4(+)5(-) 7(-) 1-1e-4 mean 1728.74 1494.68 50233.25 905.95 52292.39 992.86 14280.62 1405.06 sd 2161.81 221.09 8857.26 414.82 12797.10 338.82 190.92 345.52 stat 3(-) 5(-) 7(-) 3(-)4(+)5(-)6(+)7(-) 1(+)2(+)4(+) 6(+) 8(+) 2(-)3(-)5(-) 7(-) 1(+)2(+) 4(+)6(+) 8(+) 2(-)3(-) 5(-)7(-) 1(+)2(+) 4(+) 6(+)8(+) 3(-) 5(-) 7(-) 1-1e-6 mean 1346.13 1564.44 51529.59 1024.45 55160.16 1064.41 14226.61 1460.34 sd 294.63 237.81 8973.56 406.80 10755.61 344.46 264.68 360.50 stat 3(-) 5(-) 7(-) 3(-)4(+)5(-)6(+)7(-) 1(+)2(+)4(+) 6(+) 8(+) 2(-)3(-)5(-) 7(-) 1(+)2(+) 4(+)6(+) 8(+) 2(-)3(-) 5(-)7(-) 1(+)2(+) 4(+) 6(+)8(+) 3(-) 5(-) 7(-) 1-1e-8 mean 1388.95 1626.37 51692.28 1097.49 54903.41 1129.74 14402.66 1503.03 sd 290.05 255.31 7141.76 394.74 9622.08 349.81 285.49 367.86 stat 3(-) 5(-) 7(-) 3(-)4(+)5(-)6(+)7(-) 1(+)2(+)4(+) 6(+) 8(+) 2(-)3(-)5(-) 7(-) 1(+)2(+) 4(+)6(+) 8(+) 2(-)3(-) 5(-)7(-) 1(+)2(+) 4(+) 6(+)8(+) 3(-) 5(-) 7(-) 1-1e-10 mean 1482.42 1683.09 56510.33 1165.23 54571.10 1187.58 14355.33 1535.80 sd 285.23 261.46 12516.71 387.05 7921.24 357.25 338.32 375.22 stat 3(-) 5(-) 7(-) 3(-)4(+)5(-)6(+)7(-) 1(+)2(+)4(+) 6(+) 8(+) 2(-)3(-)5(-) 7(-) 1(+)2(+) 4(+)6(+) 8(+) 2(-)3(-) 5(-)7(-) 1(+)2(+) 4(+) 6(+)8(+) 3(-) 5(-) 7(-) bsc-500 1-1e-2 mean 22081.30 3404.13 133557.34 21312.88 137036.78 21414.87 23663.60 21733.65 sd 3615.69 427.03 28597.75 779.86 30209.83 599.86 225.04 274.90 stat 2(+)3(-)4(+)5(-) 1(-)3(-) 5(-)6(-)7(-)8(-) 1(+)2(+)4(+) 6(+) 8(+) 1(-) 3(-)5(-) 7(-) 1(+)2(+) 4(+)6(+) 8(+) 2(+)3(-) 5(-)7(-) 2(+) 4(+) 6(+)8(+) 2(+)3(-) 5(-) 7(-) 1-1e-4 mean 22308.44 3552.64 144323.40 21514.71 147015.24 21595.11 23743.37 21861.61 sd 3872.37 445.32 25440.30 794.35 27286.69 606.57 245.50 291.47 stat 2(+)3(-)4(+)5(-) 1(-)3(-) 5(-)6(-)7(-)8(-) 1(+)2(+)4(+) 6(+) 8(+) 1(-) 3(-)5(-) 7(-) 1(+)2(+) 4(+)6(+) 8(+) 2(+)3(-) 5(-)7(-) 2(+) 4(+) 6(+)8(+) 2(+)3(-) 5(-) 7(-) 1-1e-6 mean 22854.31 3664.79 145039.88 21653.46 145182.72 21722.95 23867.33 21966.01 sd 728.15 453.56 21007.77 791.52 16846.10 616.10 226.27 310.28 stat 2(+)3(-)4(+)5(-) 1(-)3(-) 5(-)6(-)7(-)8(-) 1(+)2(+)4(+) 6(+) 8(+) 1(-) 3(-)5(-) 7(-) 1(+)2(+) 4(+)6(+) 8(+) 2(+)3(-) 5(-)7(-) 2(+) 4(+) 6(+)8(+) 2(+)3(-) 5(-) 7(-) 1-1e-8 mean 23110.04 3753.58 147100.42 21764.32 145882.60 21833.34 24051.23 22041.82 sd 699.28 466.23 24618.68 783.22 27968.61 621.50 274.45 312.75 stat 2(+)3(-)4(+)5(-) 1(-)3(-) 5(-)6(-)7(-)8(-) 1(+)2(+)4(+) 6(+) 8(+) 1(-) 3(-)5(-) 7(-) 1(+)2(+) 4(+)6(+) 8(+) 2(+)3(-) 5(-)7(-) 2(+) 4(+) 6(+)8(+) 2(+)3(-) 5(-) 7(-) 1-1e-10 mean 22981.58 3835.42 147830.66 21861.76 142084.10 21918.67 24144.65 22103.63 sd 732.56 471.82 25454.81 783.92 26307.55 617.74 265.59 315.35 stat 2(+)3(-)4(+)5(-) 1(-)3(-) 5(-)6(-)7(-)8(-) 1(+)2(+)4(+) 6(+) 8(+) 1(-) 3(-)5(-) 7(-) 1(+)2(+) 4(+)6(+) 8(+) 2(+)3(-) 5(-)7(-) 2(+) 4(+) 6(+)8(+) 2(+)3(-) 5(-) 7(-) bsc-1000 1-1e-2 mean 47474.30 8421.20 599480.74 88801.18 595917.79 85160.22 48666.93 43917.49 sd 1057.54 910.30 82194.45 12530.09 78715.03 16435.94 386.67 265.87 stat 2(+)3(-) 5(-) 1(-)3(-)4(-)5(-)6(-)7(-) 1(+)2(+)4(+) 6(+)7(+)8(+) 2(+)3(-)5(-) 8(+) 1(+)2(+) 4(+)6(+)7(+)8(+) 2(+)3(-) 5(-) 8(+) 2(+)3(-) 5(-) 3(-)4(-)5(-)6(-) 1-1e-4 mean 47389.42 8615.00 588764.68 89120.54 578722.77 85408.46 49182.58 44079.23 sd 1122.19 895.45 97147.26 12554.78 116745.19 16458.14 484.16 278.66 stat 3(-)4(-)5(-)6(-) 3(-)4(-)5(-)6(-)7(-) 1(+)2(+) 6(+)7(+)8(+) 1(+)2(+) 5(-) 8(+) 1(+)2(+) 4(+)6(+)7(+)8(+) 1(+)2(+)3(-) 5(-) 8(+) 2(+)3(-) 5(-) 3(-)4(-)5(-)6(-) 1-1e-6 mean 48246.27 8777.85 576245.66 89321.45 586657.08 85595.08 49056.57 44195.59 sd 1482.24 874.20 127798.61 12551.70 86379.27 16454.32 382.56 288.40 stat 2(+)3(-)4(-)5(-) 1(-)3(-)4(-)5(-)6(-)7(-) 1(+)2(+) 6(+)7(+)8(+) 1(+)2(+) 8(+) 1(+)2(+) 6(+)7(+)8(+) 2(+)3(-) 5(-) 8(+) 2(+)3(-) 5(-) 3(-)4(-)5(-)6(-) 1-1e-8 mean 47545.86 8919.35 570853.65 89518.61 554283.64 85753.60 49033.25 44297.60 sd 1371.30 854.29 126065.24 12551.08 118204.65 16445.81 438.55 289.42 stat 2(+)3(-) 5(-) 1(-)3(-)4(-)5(-)6(-)7(-) 1(+)2(+)4(+) 6(+)7(+)8(+) 2(+)3(-)5(-) 8(+) 1(+)2(+) 4(+)6(+)7(+)8(+) 2(+)3(-) 5(-) 8(+) 2(+)3(-) 5(-) 3(-)4(-)5(-)6(-) 1-1e-10 mean 47930.42 9035.80 581546.68 89694.00 594155.50 85895.22 49338.27 44371.00 sd 1304.04 839.42 109438.27 12539.20 125611.44 16432.49 380.78 292.35 stat 2(+)3(-)4(-)5(-) 1(-)3(-)4(-)5(-)6(-)7(-) 1(+)2(+) 6(+)7(+)8(+) 1(+)2(+) 5(-) 8(+) 1(+)2(+) 4(+)6(+)7(+)8(+) 2(+)3(-) 5(-) 8(+) 2(+)3(-) 5(-) 3(-)4(-)5(-)6(-)
file-n uncorr-300 1-1e-2 mean 3043.37 3478.33 14905.19 3381.87 17292.78 3280.83 5726.79 1405.32 sd 892.65 447.33 2066.73 1515.03 3602.47 1220.65 408.31 180.95 stat 3(-) 5(-) 7(-)8(+) 3(-) 5(-) 7(-)8(+) 1(+)2(+)4(+) 6(+) 8(+) 3(-)5(-) 7(-)8(+) 1(+)2(+) 4(+)6(+) 8(+) 3(-) 5(-)7(-)8(+) 1(+)2(+) 4(+) 6(+)8(+) 1(-)2(-)3(-)4(-)5(-)6(-)7(-) 1-1e-4 mean 2947.26 3646.04 15508.34 3632.17 16727.11 3528.85 5967.07 1572.59 sd 880.20 459.09 2541.57 1556.81 3005.51 1275.73 285.48 185.19 stat 3(-) 5(-) 7(-) 3(-) 5(-) 7(-)8(+) 1(+)2(+)4(+) 6(+) 8(+) 3(-)5(-) 7(-)8(+) 1(+)2(+) 4(+)6(+) 8(+) 3(-) 5(-)7(-)8(+) 1(+)2(+) 4(+) 6(+)8(+) 2(-)3(-)4(-)5(-)6(-)7(-) 1-1e-6 mean 2943.40 3775.41 15273.83 3824.55 16658.80 3731.14 6023.06 1692.26 sd 925.72 480.81 2646.67 1584.22 3197.45 1333.61 347.29 189.35 stat 3(-) 5(-) 7(-) 3(-) 5(-) 7(-)8(+) 1(+)2(+)4(+) 6(+) 8(+) 3(-)5(-) 7(-)8(+) 1(+)2(+) 4(+)6(+) 8(+) 3(-) 5(-)7(-)8(+) 1(+)2(+) 4(+) 6(+)8(+) 2(-)3(-)4(-)5(-)6(-)7(-) 1-1e-8 mean 3296.45 3869.75 15535.80 3971.29 17056.76 3861.15 6270.99 1822.55 sd 818.51 480.40 2768.69 1617.96 3267.83 1306.34 524.24 185.93 stat 3(-) 5(-) 7(-) 3(-) 5(-) 7(-)8(+) 1(+)2(+)4(+) 6(+) 8(+) 3(-)5(-) 7(-)8(+) 1(+)2(+) 4(+)6(+) 8(+) 3(-) 5(-)7(-)8(+) 1(+)2(+) 4(+) 6(+)8(+) 2(-)3(-)4(-)5(-)6(-)7(-) 1-1e-10 mean 3170.50 3961.30 15558.20 4094.57 17864.79 3985.60 6284.76 1910.96 sd 858.93 480.59 2589.62 1602.98 2615.56 1310.35 338.29 178.72 stat 3(-) 5(-) 7(-) 3(-) 5(-) 7(-)8(+) 1(+)2(+)4(+) 6(+) 8(+) 3(-)5(-) 7(-)8(+) 1(+)2(+) 4(+)6(+)7(+)8(+) 3(-) 5(-)7(-)8(+) 1(+)2(+) 4(+)5(-)6(+)8(+) 2(-)3(-)4(-)5(-)6(-)7(-) uncorr-500 1-1e-2 mean 11329.82 8628.63 39452.98 10646.53 48039.41 12073.87 10962.30 7347.67 sd 2394.48 981.38 6568.63 2505.18 9260.13 2959.38 1195.86 415.33 stat 2(+)3(-) 5(-) 8(+) 1(-)3(-) 5(-)6(-)7(-) 1(+)2(+)4(+) 6(+)7(+)8(+) 3(-)5(-) 8(+) 1(+)2(+) 4(+)6(+)7(+)8(+) 2(+)3(-) 5(-) 8(+) 2(+)3(-) 5(-) 8(+) 1(-) 3(-)4(-)5(-)6(-)7(-) 1-1e-4 mean 11399.49 8936.43 42323.77 10994.20 42723.45 12452.70 10958.94 7562.61 sd 1861.07 988.57 8080.06 2487.85 8323.45 3049.88 1027.15 404.57 stat 2(+)3(-) 5(-) 8(+) 1(-)3(-) 5(-)6(-) 1(+)2(+)4(+) 6(+)7(+)8(+) 3(-)5(-) 8(+) 1(+)2(+) 4(+)6(+)7(+)8(+) 2(+)3(-) 5(-) 8(+) 3(-) 5(-) 8(+) 1(-) 3(-)4(-)5(-)6(-)7(-) 1-1e-6 mean 11850.96 9129.06 45935.34 11273.51 44866.66 12746.78 11039.28 7714.19 sd 1863.85 1026.87 6824.25 2550.54 6870.15 3007.57 882.52 406.71 stat 2(+)3(-) 5(-) 8(+) 1(-)3(-) 5(-)6(-) 1(+)2(+)4(+) 6(+)7(+)8(+) 3(-)5(-) 8(+) 1(+)2(+) 4(+)6(+)7(+)8(+) 2(+)3(-) 5(-) 8(+) 3(-) 5(-) 8(+) 1(-) 3(-)4(-)5(-)6(-)7(-) 1-1e-8 mean 12051.29 9308.11 41537.98 11491.63 46642.36 12990.12 11156.42 7879.27 sd 1657.47 1082.74 8487.27 2561.48 7906.21 3125.89 784.34 394.37 stat 2(+)3(-) 5(-) 8(+) 1(-)3(-) 5(-)6(-) 1(+)2(+)4(+) 6(+)7(+)8(+) 3(-)5(-) 8(+) 1(+)2(+) 4(+)6(+)7(+)8(+) 2(+)3(-) 5(-) 8(+) 3(-) 5(-) 8(+) 1(-) 3(-)4(-)5(-)6(-)7(-) 1-1e-10 mean 11813.38 9450.60 41369.61 11733.82 47973.20 13177.39 11551.23 8003.59 sd 1837.93 1099.76 8597.03 2600.64 6381.49 3140.58 1056.13 402.31 stat 3(-) 5(-) 8(+) 3(-) 5(-)6(-) 1(+)2(+)4(+) 6(+)7(+)8(+) 3(-)5(-) 8(+) 1(+)2(+) 4(+)6(+)7(+)8(+) 2(+)3(-) 5(-) 8(+) 3(-) 5(-) 8(+) 1(-) 3(-)4(-)5(-)6(-)7(-) uncorr-1000 1-1e-2 mean 27368.18 21798.06 166714.12 34958.46 174785.76 33339.53 24695.70 15550.00 sd 4255.12 2534.07 26502.29 6878.09 26874.10 8468.70 2472.18 1776.56 stat 3(-) 5(-) 8(+) 3(-)4(-)5(-)6(-) 1(+)2(+)4(+) 6(+)7(+)8(+) 2(+)3(-)5(-) 7(+)8(+) 1(+)2(+) 4(+)6(+)7(+)8(+) 2(+)3(-) 5(-) 8(+) 3(-)4(-)5(-) 8(+) 1(-) 3(-)4(-)5(-)6(-)7(-) 1-1e-4 mean 27030.38 22322.32 169936.81 35765.28 170918.08 34012.01 26179.89 15848.24 sd 4138.28 2551.35 34849.09 7156.55 27232.04 8606.41 3826.99 1831.30 stat 3(-) 5(-) 8(+) 3(-)4(-)5(-)6(-) 1(+)2(+)4(+) 6(+)7(+)8(+) 2(+)3(-)5(-) 8(+) 1(+)2(+) 4(+)6(+)7(+)8(+) 2(+)3(-) 5(-) 8(+) 3(-) 5(-) 8(+) 1(-) 3(-)4(-)5(-)6(-)7(-) 1-1e-6 mean 28002.60 22701.24 169444.75 36246.69 161320.83 34383.82 25071.47 16068.00 sd 4248.58 2553.50 20148.10 7285.33 23388.08 8685.28 2827.29 1809.09 stat 3(-) 5(-) 8(+) 3(-)4(-)5(-)6(-) 1(+)2(+)4(+) 6(+)7(+)8(+) 2(+)3(-)5(-) 7(+)8(+) 1(+)2(+) 4(+)6(+)7(+)8(+) 2(+)3(-) 5(-) 8(+) 3(-)4(-)5(-) 8(+) 1(-) 3(-)4(-)5(-)6(-)7(-) 1-1e-8 mean 27540.27 23143.77 175134.21 36810.24 169374.39 34698.72 25405.64 16219.73 sd 4604.51 2668.91 33476.62 7542.42 36246.80 8733.63 3253.52 1832.53 stat 3(-) 5(-) 8(+) 3(-)4(-)5(-)6(-) 1(+)2(+)4(+) 6(+)7(+)8(+) 2(+)3(-)5(-) 7(+)8(+) 1(+)2(+) 4(+)6(+)7(+)8(+) 2(+)3(-) 5(-) 8(+) 3(-)4(-)5(-) 8(+) 1(-) 3(-)4(-)5(-)6(-)7(-) 1-1e-10 mean 27503.30 23440.07 164694.53 37085.03 176451.42 34936.05 25324.98 16372.02 sd 4161.65 2672.74 31865.32 7536.52 28181.36 8715.85 3075.52 1886.57 stat 3(-) 5(-) 8(+) 3(-)4(-)5(-)6(-) 1(+)2(+)4(+) 6(+)7(+)8(+) 2(+)3(-)5(-) 7(+)8(+) 1(+)2(+) 4(+)6(+)7(+)8(+) 2(+)3(-) 5(-) 8(+) 3(-)4(-)5(-) 8(+) 1(-) 3(-)4(-)5(-)6(-)7(-)
file-n bsc-300 1-1e-2 mean 10551.75 5535.05 79887.59 18374.61 83174.40 22884.14 20209.53 19680.15 sd 6879.48 1941.12 16150.97 6904.29 17665.42 7663.39 1676.78 6299.73 stat 3(-) 5(-)6(-)7(-)8(-) 3(-)4(-)5(-)6(-)7(-)8(-) 1(+)2(+)4(+) 6(+)7(+)8(+) 2(+)3(-)5(-) 1(+)2(+) 4(+)6(+)7(+)8(+) 1(+)2(+)3(-) 5(-) 1(+)2(+)3(-) 5(-) 1(+)2(+)3(-) 5(-) 1-1e-4 mean 16587.88 7437.16 97081.33 20192.04 97158.75 23887.48 22757.89 21771.35 sd 7614.45 2614.53 24875.67 7410.44 12864.74 8058.01 3087.86 6946.09 stat 3(-) 5(-) 3(-)4(-)5(-)6(-)7(-)8(-) 1(+)2(+)4(+) 6(+)7(+)8(+) 2(+)3(-)5(-) 1(+)2(+) 4(+)6(+)7(+)8(+) 2(+)3(-) 5(-) 2(+)3(-) 5(-) 2(+)3(-) 5(-) 1-1e-6 mean 18194.38 8749.40 113629.25 21538.26 116739.71 24632.91 25925.16 22888.46 sd 8209.77 3139.33 13248.22 7905.34 17799.96 8358.05 3041.14 7212.42 stat 3(-) 5(-) 3(-)4(-)5(-)6(-)7(-)8(-) 1(+)2(+)4(+) 6(+)7(+)8(+) 2(+)3(-)5(-) 1(+)2(+) 4(+)6(+)7(+)8(+) 2(+)3(-) 5(-) 2(+)3(-) 5(-) 2(+)3(-) 5(-) 1-1e-8 mean 22603.22 9812.80 116999.39 22541.74 116492.38 25251.39 27434.43 23815.59 sd 7826.67 3563.71 25377.62 8201.48 20707.32 8611.17 3604.12 7464.17 stat 2(+)3(-) 5(-) 1(-)3(-)4(-)5(-)6(-)7(-)8(-) 1(+)2(+)4(+) 6(+)7(+)8(+) 2(+)3(-)5(-) 1(+)2(+) 4(+)6(+)7(+)8(+) 2(+)3(-) 5(-) 2(+)3(-) 5(-) 2(+)3(-) 5(-) 1-1e-10 mean 24236.27 10800.48 123824.58 23445.54 128018.61 25792.45 28471.96 24607.08 sd 7632.35 4101.31 24433.68 8493.42 25965.42 8833.85 3587.96 7694.27 stat 2(+)3(-) 5(-) 1(-)3(-)4(-)5(-)6(-)7(-)8(-) 1(+)2(+)4(+) 6(+)7(+)8(+) 2(+)3(-)5(-) 1(+)2(+) 4(+)6(+)7(+)8(+) 2(+)3(-) 5(-) 2(+)3(-) 5(-) 2(+)3(-) 5(-) bsc-500 1-1e-2 mean 30614.05 6989.36 192751.23 31260.66 204239.10 38558.03 32663.98 32942.57 sd 1407.63 1522.10 35212.96 3510.79 35399.37 6248.63 1881.79 3500.02 stat 2(+)3(-) 5(-)6(-) 1(-)3(-)4(-)5(-)6(-)7(-)8(-) 1(+)2(+)4(+) 6(+)7(+)8(+) 2(+)3(-)5(-)6(-) 1(+)2(+) 4(+)6(+)7(+)8(+) 1(+)2(+)3(-)4(+)5(-) 2(+)3(-) 5(-) 2(+)3(-) 5(-) 1-1e-4 mean 33998.81 9581.45 240691.12 34143.14 239196.55 40196.36 35872.42 36360.52 sd 2774.96 1966.98 48894.79 3847.76 46651.74 6212.19 3208.26 4431.29 stat 2(+)3(-) 5(-) 1(-)3(-)4(-)5(-)6(-)7(-)8(-) 1(+)2(+)4(+) 6(+)7(+)8(+) 2(+)3(-)5(-) 1(+)2(+) 4(+)6(+)7(+)8(+) 2(+)3(-) 5(-) 2(+)3(-) 5(-) 2(+)3(-) 5(-) 1-1e-6 mean 36826.73 11513.63 244734.20 36160.32 254781.31 41425.90 38594.80 38229.85 sd 3021.71 2343.05 40163.64 4080.20 51823.25 6179.43 3987.88 4631.10 stat 2(+)3(-) 5(-) 1(-)3(-)4(-)5(-)6(-)7(-)8(-) 1(+)2(+)4(+) 6(+)7(+)8(+) 2(+)3(-)5(-) 1(+)2(+) 4(+)6(+)7(+)8(+) 2(+)3(-) 5(-) 2(+)3(-) 5(-) 2(+)3(-) 5(-) 1-1e-8 mean 38169.00 13292.77 273535.32 37805.74 283684.68 42450.00 39446.15 39720.05 sd 6551.72 2904.05 49687.82 4288.25 51540.41 6171.53 3594.85 4714.90 stat 2(+)3(-) 5(-) 1(-)3(-)4(-)5(-)6(-)7(-)8(-) 1(+)2(+)4(+) 6(+)7(+)8(+) 2(+)3(-)5(-) 1(+)2(+) 4(+)6(+)7(+)8(+) 2(+)3(-) 5(-) 2(+)3(-) 5(-) 2(+)3(-) 5(-) 1-1e-10 mean 40483.52 15124.37 291440.16 39228.57 289249.74 43356.55 42096.86 41001.29 sd 3536.17 3490.11 56981.92 4464.79 68406.64 6163.46 3809.06 4751.14 stat 2(+)3(-) 5(-) 1(-)3(-)4(-)5(-)6(-)7(-)8(-) 1(+)2(+)4(+) 6(+)7(+)8(+) 2(+)3(-)5(-) 1(+)2(+) 4(+)6(+)7(+)8(+) 2(+)3(-) 5(-) 2(+)3(-) 5(-) 2(+)3(-) 5(-) bsc-1000 1-1e-2 mean 58588.87 13111.39 766371.36 143904.26 733748.84 158012.66 59962.57 62038.08 sd 831.69 1873.74 121947.89 14029.76 158908.92 14249.67 1724.61 3730.66 stat 3(-)4(-)5(-)6(-) 3(-)4(-)5(-)6(-) 8(-) 1(+)2(+)4(+) 7(+)8(+) 1(+)2(+)3(-)5(-) 1(+)2(+) 4(+) 7(+)8(+) 1(+)2(+) 7(+)8(+) 3(-) 5(-)6(-) 2(+)3(-) 5(-)6(-) 1-1e-4 mean 64132.52 17696.93 827735.24 152545.03 790722.81 164696.34 65842.44 67110.02 sd 1082.80 2371.96 133595.08 14638.93 180957.30 14874.70 2533.98 4638.86 stat 3(-)4(-)5(-)6(-) 3(-)4(-)5(-)6(-) 8(-) 1(+)2(+)4(+) 7(+)8(+) 1(+)2(+)3(-)5(-) 8(+) 1(+)2(+) 4(+) 7(+)8(+) 1(+)2(+) 7(+)8(+) 3(-) 5(-)6(-) 2(+)3(-)4(-)5(-)6(-) 1-1e-6 mean 67804.71 21695.05 874847.89 158859.57 890473.88 169663.16 70111.56 70001.71 sd 1294.41 3174.41 154940.75 15119.47 184294.93 15342.23 2095.42 4797.31 stat 3(-)4(-)5(-)6(-) 3(-)4(-)5(-)6(-)7(-)8(-) 1(+)2(+)4(+) 7(+)8(+) 1(+)2(+)3(-)5(-) 8(+) 1(+)2(+) 4(+) 7(+)8(+) 1(+)2(+) 7(+)8(+) 2(+)3(-) 5(-)6(-) 2(+)3(-)4(-)5(-)6(-) 1-1e-8 mean 71517.38 25497.57 986560.61 164079.92 922592.85 173795.86 74080.33 72171.22 sd 3006.38 4142.25 203606.67 15562.46 202198.06 15742.82 2589.30 4791.75 stat 3(-)4(-)5(-)6(-) 3(-)4(-)5(-)6(-)7(-) 1(+)2(+)4(+) 7(+)8(+) 1(+)2(+)3(-)5(-) 8(+) 1(+)2(+) 4(+) 7(+)8(+) 1(+)2(+) 7(+)8(+) 2(+)3(-) 5(-)6(-) 3(-)4(-)5(-)6(-) 1-1e-10 mean 73430.10 29904.83 1000734.31 168713.43 975828.01 177406.82 78512.55 74045.95 sd 2864.54 4982.59 191083.51 15975.87 228991.67 16104.19 9889.86 4779.04 stat 3(-)4(-)5(-)6(-) 3(-)4(-)5(-)6(-)7(-) 1(+)2(+)4(+) 7(+)8(+) 1(+)2(+)3(-)5(-) 8(+) 1(+)2(+) 4(+) 7(+)8(+) 1(+)2(+) 7(+)8(+) 2(+)3(-) 5(-)6(-) 3(-)4(-)5(-)6(-)
file-n uncorr-300 1-1e-2 mean 8872.50 6830.50 26528.83 10586.87 26103.66 23631.82 10907.40 9757.16 sd 1870.02 1159.22 3309.30 6440.41 3288.55 6526.91 1204.51 2634.72 stat 3(-) 5(-)6(-) 3(-) 5(-)6(-)7(-) 1(+)2(+)4(+) 7(+)8(+) 3(-)5(-)6(-) 1(+)2(+) 4(+) 7(+)8(+) 1(+)2(+) 4(+) 7(+)8(+) 2(+)3(-) 5(-)6(-) 3(-) 5(-)6(-) 1-1e-4 mean 11744.26 9421.40 31709.75 11652.08 32162.31 23758.60 13598.55 11477.77 sd 2383.75 1544.52 4891.38 6338.20 4422.97 6488.55 1569.06 2896.42 stat 3(-) 5(-)6(-) 3(-) 5(-)6(-)7(-) 1(+)2(+)4(+) 7(+)8(+) 3(-)5(-)6(-) 1(+)2(+) 4(+) 7(+)8(+) 1(+)2(+) 4(+) 8(+) 2(+)3(-) 5(-) 3(-) 5(-)6(-) 1-1e-6 mean 13976.84 11227.50 35470.58 12460.09 37447.75 23846.04 15731.67 12614.16 sd 2743.43 1944.60 5490.07 6440.94 5537.36 6466.50 2309.51 3069.37 stat 3(-) 5(-)6(-) 3(-) 5(-)6(-)7(-) 1(+)2(+)4(+) 7(+)8(+) 3(-)5(-)6(-) 1(+)2(+) 4(+)6(+)7(+)8(+) 1(+)2(+) 4(+)5(-) 8(+) 2(+)3(-) 5(-) 3(-) 5(-)6(-) 1-1e-8 mean 15490.14 12984.27 40095.51 13190.75 38905.60 23923.98 17056.44 13473.92 sd 3108.15 2445.79 5502.90 6717.55 6325.87 6446.70 2927.57 3189.30 stat 3(-) 5(-)6(-) 3(-) 5(-)6(-) 1(+)2(+)4(+) 6(+)7(+)8(+) 3(-)5(-)6(-) 1(+)2(+) 4(+)6(+)7(+)8(+) 1(+)2(+)3(-)4(+)5(-) 8(+) 3(-) 5(-) 3(-) 5(-)6(-) 1-1e-10 mean 17517.74 14764.41 40836.94 13800.36 42245.95 23990.91 17842.66 14200.54 sd 3156.25 3236.75 6118.56 6926.40 5242.76 6430.85 3282.18 3296.23 stat 3(-) 5(-) 3(-) 5(-)6(-) 1(+)2(+)4(+) 6(+)7(+)8(+) 3(-)5(-)6(-) 1(+)2(+) 4(+)6(+)7(+)8(+) 2(+)3(-)4(+)5(-) 8(+) 3(-) 5(-) 3(-) 5(-)6(-) uncorr-500 1-1e-2 mean 17756.98 9906.10 63654.88 18560.31 63346.44 32344.24 18055.03 16107.51 sd 1742.48 1671.40 9173.61 6107.06 9434.04 10673.85 1553.67 2458.74 stat 2(+)3(-) 5(-)6(-) 1(-)3(-)4(-)5(-)6(-)7(-)8(-) 1(+)2(+)4(+) 7(+)8(+) 2(+)3(-)5(-)6(-) 1(+)2(+) 4(+) 7(+)8(+) 1(+)2(+) 4(+) 7(+)8(+) 2(+)3(-) 5(-)6(-) 2(+)3(-) 5(-)6(-) 1-1e-4 mean 21155.91 13747.50 73576.34 20540.95 73638.15 32936.76 21539.17 18556.71 sd 1677.48 2451.68 14869.90 5812.02 10317.61 10591.17 2251.49 2603.76 stat 2(+)3(-) 5(-) 1(-)3(-)4(-)5(-)6(-)7(-) 1(+)2(+)4(+) 6(+)7(+)8(+) 2(+)3(-)5(-)6(-) 1(+)2(+) 4(+)6(+)7(+)8(+) 2(+)3(-)4(+)5(-) 8(+) 2(+)3(-) 5(-) 3(-) 5(-)6(-) 1-1e-6 mean 23415.78 17111.19 82615.09 22067.83 82015.66 33387.05 23950.16 20353.98 sd 2599.83 3474.94 14723.22 5831.29 10875.61 10537.13 2360.94 2814.67 stat 2(+)3(-) 5(-) 1(-)3(-) 5(-)6(-)7(-) 1(+)2(+)4(+) 6(+)7(+)8(+) 3(-)5(-)6(-) 1(+)2(+) 4(+)6(+)7(+)8(+) 2(+)3(-)4(+)5(-) 8(+) 2(+)3(-) 5(-) 3(-) 5(-)6(-) 1-1e-8 mean 25266.18 20212.92 87856.87 23329.76 94451.31 33777.60 25117.36 21772.70 sd 2934.70 4671.43 13566.19 5932.30 12936.43 10479.76 2844.97 3000.92 stat 3(-) 5(-) 3(-) 5(-)6(-) 1(+)2(+)4(+) 6(+)7(+)8(+) 3(-)5(-)6(-) 1(+)2(+) 4(+)6(+)7(+)8(+) 2(+)3(-)4(+)5(-) 8(+) 3(-) 5(-) 3(-) 5(-)6(-) 1-1e-10 mean 26294.49 23329.86 92368.31 24435.12 93861.56 34122.25 27535.68 22998.53 sd 3738.10 5884.52 14966.42 6092.53 14282.76 10433.91 2961.51 3174.70 stat 3(-) 5(-) 3(-) 5(-)6(-) 1(+)2(+)4(+) 6(+)7(+)8(+) 3(-)5(-)6(-) 1(+)2(+) 4(+)6(+)7(+)8(+) 2(+)3(-)4(+)5(-) 8(+) 3(-) 5(-) 3(-) 5(-)6(-) uncorr-1000 1-1e-2 mean 36316.82 17988.27 196932.13 52961.99 214528.03 74542.77 34781.61 29743.93 sd 2923.58 2508.67 42541.12 10758.17 38091.54 16960.06 1747.91 4879.39 stat 2(+)3(-) 5(-)6(-) 1(-)3(-)4(-)5(-)6(-)7(-) 1(+)2(+)4(+) 7(+)8(+) 2(+)3(-)5(-) 8(+) 1(+)2(+) 4(+) 7(+)8(+) 1(+)2(+) 7(+)8(+) 2(+)3(-) 5(-)6(-) 3(-)4(-)5(-)6(-) 1-1e-4 mean 40726.99 24134.90 232799.27 56396.96 249472.10 76412.21 39144.97 33004.77 sd 2598.10 3254.86 49823.19 10336.31 36915.03 16901.49 2464.03 4881.68 stat 2(+)3(-) 5(-)6(-) 1(-)3(-)4(-)5(-)6(-)7(-) 1(+)2(+)4(+) 7(+)8(+) 2(+)3(-)5(-) 8(+) 1(+)2(+) 4(+) 7(+)8(+) 1(+)2(+) 7(+)8(+) 2(+)3(-) 5(-)6(-) 3(-)4(-)5(-)6(-) 1-1e-6 mean 44330.24 29515.73 271873.83 59173.66 269818.15 77764.39 43353.65 35466.77 sd 3518.99 4347.52 47134.42 10222.68 46412.49 16854.30 2450.27 5054.55 stat 2(+)3(-) 5(-)6(-) 1(-)3(-)4(-)5(-)6(-)7(-) 1(+)2(+)4(+) 7(+)8(+) 2(+)3(-)5(-) 8(+) 1(+)2(+) 4(+) 7(+)8(+) 1(+)2(+) 7(+)8(+) 2(+)3(-) 5(-)6(-) 3(-)4(-)5(-)6(-) 1-1e-8 mean 46564.35 35749.83 274877.63 61568.57 293041.01 78889.20 46231.48 37555.56 sd 4346.17 6037.51 46081.72 10238.99 54548.94 16824.61 2301.81 5271.56 stat 2(+)3(-) 5(-)6(-) 1(-)3(-)4(-)5(-)6(-) 1(+)2(+)4(+) 7(+)8(+) 2(+)3(-)5(-) 8(+) 1(+)2(+) 4(+)6(+)7(+)8(+) 1(+)2(+) 5(-)7(+)8(+) 3(-) 5(-)6(-) 3(-)4(-)5(-)6(-) 1-1e-10 mean 47707.47 42082.93 273997.43 63693.52 286294.84 79864.87 47696.19 39366.57 sd 4145.12 7995.13 68421.61 10326.01 53502.11 16825.43 3429.66 5586.25 stat 3(-) 5(-)6(-) 3(-)4(-)5(-)6(-) 1(+)2(+)4(+) 7(+)8(+) 2(+)3(-)5(-) 8(+) 1(+)2(+) 4(+) 7(+)8(+) 1(+)2(+) 7(+)8(+) 3(-) 5(-)6(-) 3(-)4(-)5(-)6(-)