Shape transition and coexistence in Te isotopes studied with the quadrupole collective Hamiltonian based on a relativistic energy density functional
Abstract
Evolution and coexistence of shape and the related collective states of even-even Te isotopes are investigated within the quadrupole collective model that is based on the nuclear density functional theory. By means of the constrained self-consistent mean-field calculations performed within the relativistic Hartree-Bogoliubov method with a choice of an energy density functional and a pairing force, parameters of the triaxial quadrupole collective Hamiltonian are completely determines. The collective model produces for the near mid-shell nuclei, e.g., 116Te and 118Te, low-energy and low-spin excited states, including the state, that can be interpreted as the intruder states associated with the strongly deformed prolate minimum in the potential energy surface, along with the ground state that is attributed to the normal state based on a weakly oblate deformed global minimum. The collective model calculation suggests the lowering of the energy level toward neutron mid-shell, as observed experimentally. The sensitivity of the mean-field and spectroscopic results to the choice of the pairing strength is also analyzed, and it is shown that by increasing the pairing strength description of the low-lying states of the near mid-shell nuclei is improved.
I Introduction
The atomic nucleus is a composite system of neutrons and protons, where a subtle interplay between single-particle and collective motions plays an crucial role. Remarkable features of the nucleus are the fact that it organizes itself into a variety of shapes, and that the related collective excitations such as the anharmonic vibrations of the nuclear surface and rotational motions emerge [1]. The dominant nuclear deformation is of quadrupole type, which is characterized by the axial deformation , i.e., degree of elongation along the symmetry axis of an ellipsoid, and the nonaxial or triaxial deformation , representing the deviation from the axial symmetry. The known quadrupole nuclear shapes include the prolate (), oblate (), and the one that is referred to as a soft shape having the value other than and .
The nuclear structure undergoes a transition from a nearly spherical vibrational to deformed rotational states when it is seen as a function of the neutron , or proton number. Such a nuclear structural evolution often takes place quite rapidly at a particular nucleon number, and is considered a quantum phase transition [2], which is observable from striking differences of the measured intrinsic and spectroscopic properties between neighboring nuclei. In addition, several different nuclear shapes can coexist especially for those nuclei near the magic numbers, and a few excited levels appear that are close in energy to the ground state [3, 4, 5, 6]. The phenomenon of shape coexistence was found experimentally in light mass region, i.e., 16O [7], and later has been identified in heavy nuclei as well, representative example being the spherical-oblate-prolate triple shape coexistence in 186Pb [8], hence it is nowadays recognized as a universal feature of the nuclei, that occurs in a wide spectrum of the chart of nuclides (see Ref. [6] for a recent review).
The occurrence of the shape coexistence could be interpreted in a simple mean-field model, which provides several local minima that are found rather close in energy to the ground state minimum. The observed low-energy excited states can be then associated with these mean-field minima [9, 10, 4, 8, 11, 5]. An alternative interpretation is given by the spherical shell model that particularly for those nuclei that are near shell closure multi-particle-multi-hole excitations are likely to occur, and they enhance correlations between valence neutrons and protons, which can be strong enough to substantially lower the nonyrast states to be in the vicinity of the ground state [12, 13, 3, 4, 14, 5].
The shape phase transition and shape coexistence often take place simultaneously, which makes the understanding of the relevant nuclear structure from a microscopic point of view challenging. In cadmium isotopes, for instance, which are close to the proton shell closure , the low-energy part of the spectrum resembles that of the anharmonic vibrator based on the multi-phonon picture. Later experiments, however, revealed additional low-spin levels appearing to those of the multi-phonon multiplets, which could not be accounted for without introducing the contributions of the shape coexistence and intruder states coming from the next major oscillator shell. It is then expected that the shape coexistence may also play a role in tellurium (Te) isotopes with , as they are also close to the magic number and the cross-shell excitations of the intruder orbitals are supposed to be relevant in low-lying states. Experimental evidence for a shape coexistence in the Te isotopes in the middle of the major shell is not as solid as in the case of the Cd isotopes. The experimental study of Ref. [15] has suggested presence of intruder states in the 116-128Te. Lifetime measurements have been performed for revealing detailed level structure of 118Te [16]. More recent experiment at the Cologne FN Tandem accelerator has found several new low-energy levels in 116Te [17]. The latter two experimental studies point to the possible occurrence of the shape coexistence in the mid-shell Te isotopes, whereas the theoretical interpretation used in those references was based on a simple IBM calculation that does not take into account contributions from intruder configuration. Another measurements have recently been made investigating the energy and transition in 116Te and 118Te, together with the systematic of these quantities along the entire Te isotopic chain in the neutron major shell, in comparison to the calculations within the large-scale shell model [18].
Theoretical calculations concerning the shape coexistence, low-energy excitation spectra and electromagnetic transition rates for the Te isotopes away from the neutron major shell closure toward the mid-shell region with have been carried out from various approaches, e.g., the nuclear shell model [19, 20, 21, 18], the mean-field [22, 23] and beyond-mean-field [24, 25, 26, 27] models, the interacting boson model (IBM) [28, 15, 29, 30, 16, 31, 17], and an effective field theory [32]. The self-consistent mean-field method employing nonrelativistic (e.g., Skyrme [33, 34, 35] and Gogny [36, 37]) and relativistic [38, 39] energy density functionals (EDFs) is, in particular, a reliable tool for describing the bulk intrinsic properties of finite nuclei, nuclear matter properties, and collective excitations. To compute energies and wave functions of the excited states, the EDF framework needs to be extended to include dynamical correlations that are beyond the mean-field approximations, which are associated with the broken symmetries and with the quantum fluctuations around the mean-field minimum. It is then necessary to project mean-field solutions onto states with good symmetry quantum numbers and perform configuration mixing [40]. The beyond-mean-field treatment is made by means of the generator coordinate method (GCM) [40, 34, 37]. The GCM approach is, however, often computationally demanding for heavy nuclei and when quadrupole triaxial or other higher-order deformation degrees of freedom is involved. More computationally feasible EDF-based approaches to nuclear collective excitations are provided by solving the five-dimensional, quadrupole collective Hamiltonian (QCH) [41, 26, 39], and by mapping the mean-field potential energy surface (PES) onto the IBM Hamiltonian [42, 43, 44].
In the present article, we report a theoretical analysis of the evolution of low-energy collective states along the chain of the Te isotopes, paying a special attention to the possibility of shape coexistence around the mid-shell . For the theoretical tool, we adopt the QCH, with the parameters completely determined by the constrained SCMF calculation employing a relativistic EDF. One of the present authors has studied nuclear structure phenomena by using the same approach in recent articles of Refs.[45] and [46]. In the former study, a shape phase transition and critical-point symmetry in the Kr isotopes below were investigated, while in the latter the shape coexistence and intruder states in the Cd isotopes were analyzed. The QCH calculation in Ref. [46] has reproduced the observed low-energy quadrupole phonon states of 108-116Cd nuclei reasonably well, and suggested a low-lying band and a -vibrational band that are associated with a deformed local minimum in the corresponding PES. It is our aim to identify the relevance of the shape coexistence and its microscopic mechanism in the Te isotopes through discussing the nature of the excited states.
II Theoretical framework
The first step of our theoretical analysis is to perform, for each Te nucleus, a set of the constrained SCMF calculations within the framework of the relativistic Hartree-Bogoliubov (RHB) method [38, 39, 47, 48]. For the particle-hole channel, we employ the density-dependent point-coupling (DD-PC1) interaction [49], while for the particle-particle channel the separable pairing force of finite range that was developed in Ref. [50] is considered. The constraints imposed in the SCMF calculations are on the expectation values of the mass quadrupole operators
| (1) |
which are related to the axially symmetric deformation and triaxiality [1], through the relations
| (2) | ||||
| (3) |
with fm. The SCMF calculations are carried out in a harmonic oscillator basis, with the number of oscillator shells equal to 14. Common strengths of the proton and neutron pairings are used throughout, that is, MeV fm3, which have been determined in Ref. [50] so that the systematic behavior of the pairing gaps obtained from the Gogny-D1S [51] SCMF calculation is reproduced. In addition, we also perform the RHB calculations employing a different value of the pairing strength, MeV fm3, which corresponds to the increase by 5 % of the aforementioned, default pairing strength, i.e., . The sensitivity of the mean-field results on the pairing properties in the case of the separable pairing force has been systematically analyzed in Ref. [52], according to which the increase of the pairing strength by 5 % is a reasonable for medium-heavy and heavy nuclei.
Quadrupole collective states are obtained by solving the QCH, or the collective Schrödinger equation. The parameters of the QCH are completely determined by using the results of the RHB calculations: the quadrupole triaxial () PES, and the single-particle solutions. More detailed accounts of the QCH are found, e.g., in Refs. [41, 39]. The QCH, denoted as , is given as
| (4) |
with the vibrational kinetic energy:
| (5) |
rotational kinetic energy:
| (6) |
and collective potential . Note that the operator in Eq. (6) denotes the components of the angular momentum in the body-fixed frame of a nucleus. The mass parameters , , and in Eq. (II), and the moments of inertia in (6), are functions of the and deformations, and are related to each other by the quantity . Two additional quantities in Eq. (II), i.e., , and , determine the volume element in the collective space. The moments of inertia are computed using the Inglis-Belyaev (IB) formula [53, 54], and the mass parameters are calculated in the cranking approximation. A well-known fact is that the IB formula considerably underestimates the empirical moments of inertia, and it is often increased by % in order to account for the discrepancy. Here we do not introduce such an adjustment. The collective potential (4) is obtained by subtracting the zero-point energy corrections from the total RHB deformation energy.
The corresponding eigenvalue problem is solved using an expansion of eigenfunctions in terms of a complete set of basis functions that depend on the deformation variables and , and the three Euler angles . The diagonalization of the QCH with the ingredients specified by the RHB calculation yields the excitation energies and collective wave functions for each value of the total angular momentum and parity, that are used to calculate various physical observables. A virtue of using the QCH based on SCMF single-(quasi)particle solutions is the fact that the electromagnetic transition properties, such as the electric quadrupole () and monopole () transition rates, and spectroscopic quadrupole moments, are calculated in the full configuration space, hence there is no need for effective charges. Using the bare value of the proton charge in the electric transition operators, the transition probabilities between eigenvectors of the QCH can be directly compared with spectroscopic data.


III Mean-field results
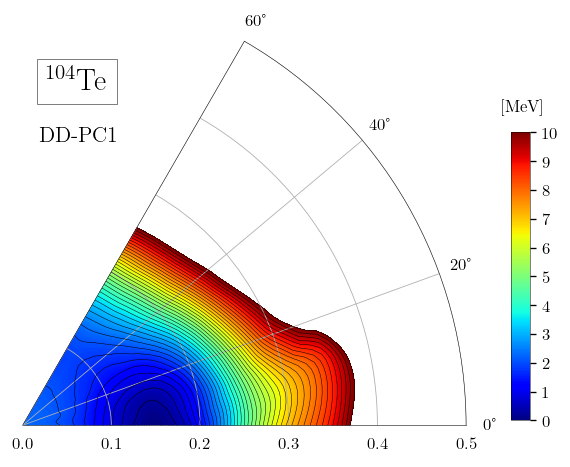
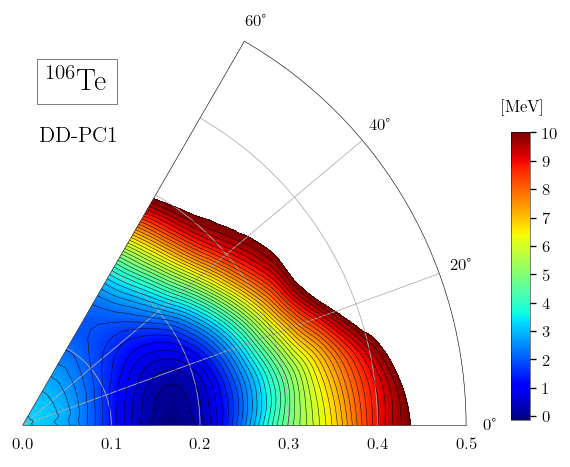
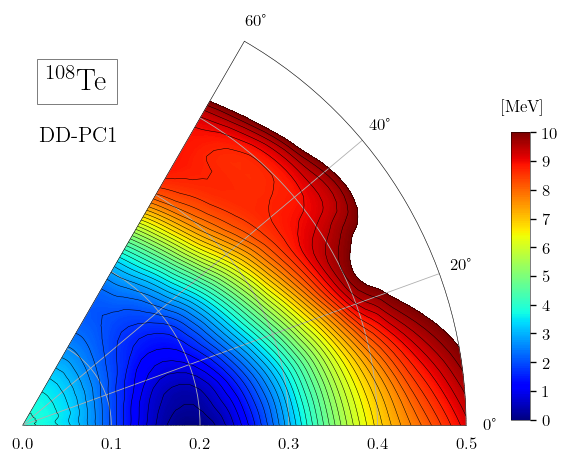
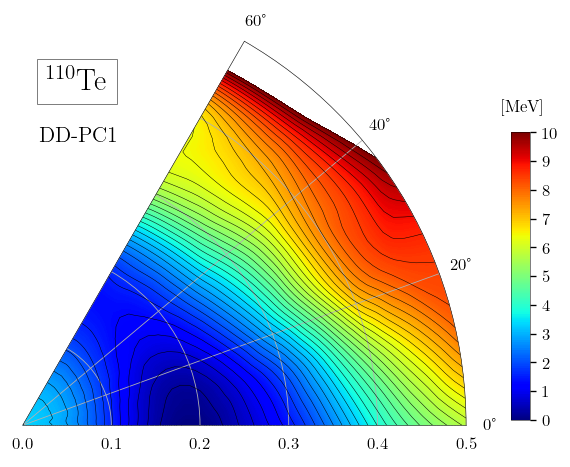
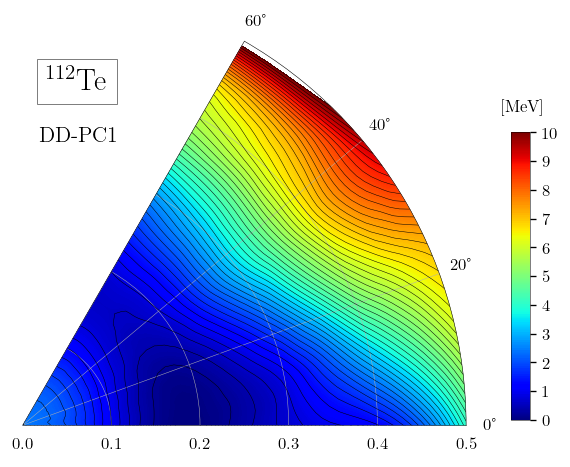
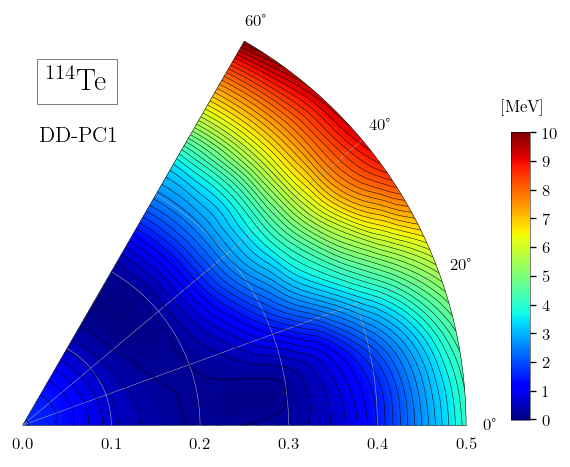
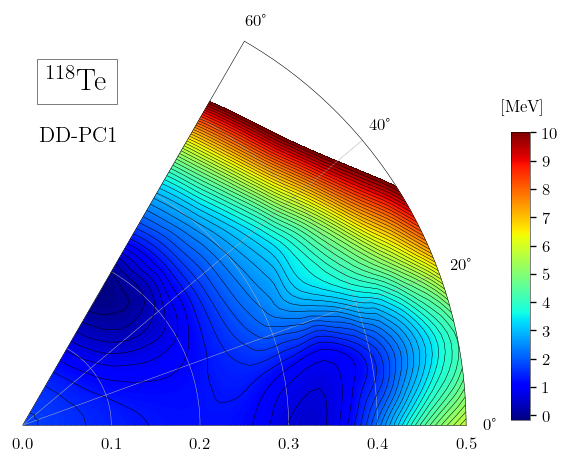
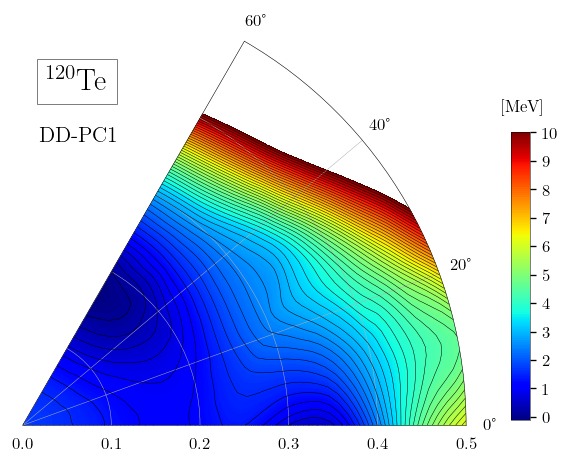
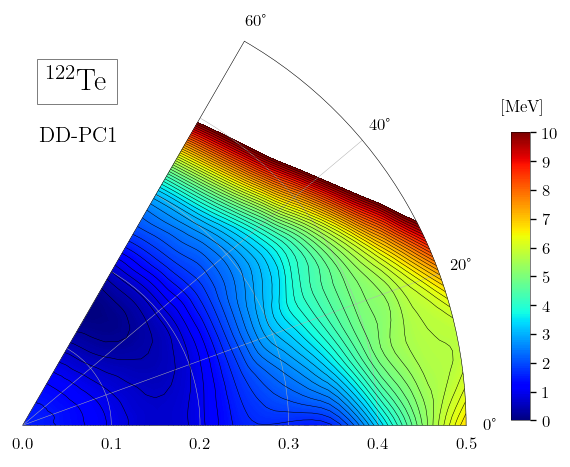
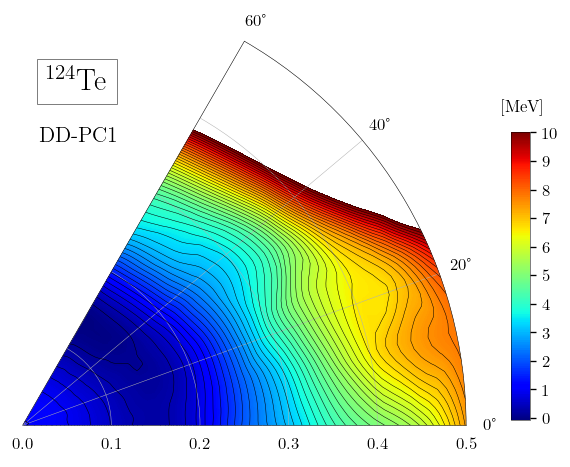
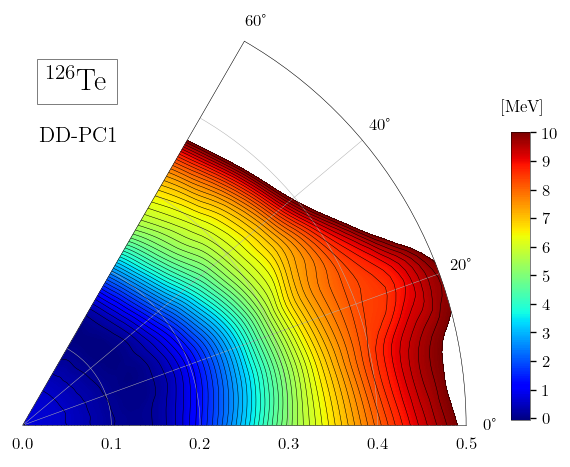
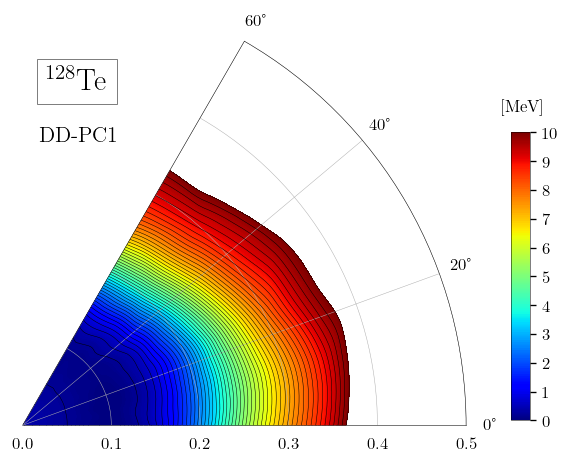
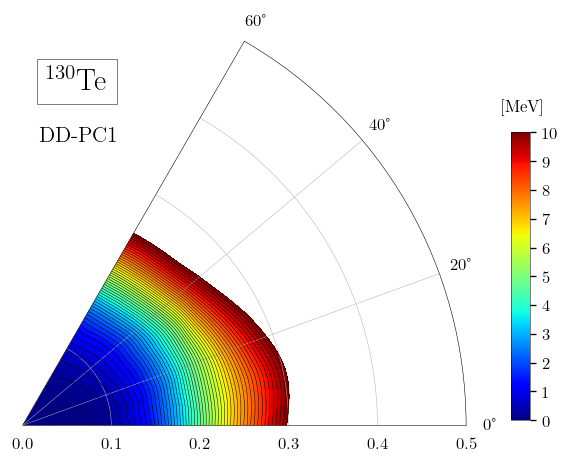
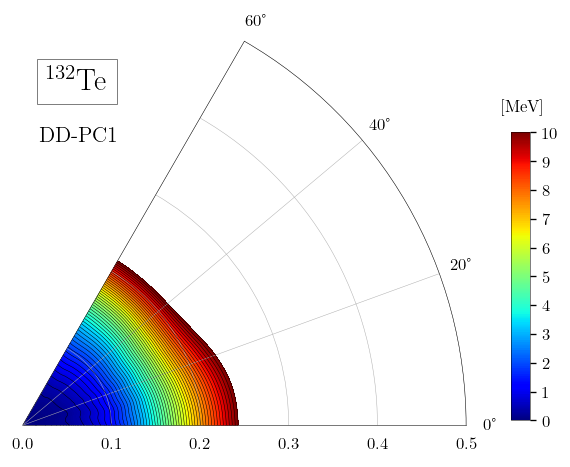
Figure 1 shows the quadrupole triaxial PESs for the studied even-even 104-132Te isotopes calculated by the constrained SCMF method within the RHB model that is based on the DD-PC1 EDF and separable pairing described in the previous section. For lighter Te isotopes 104-110Te with the neutron numbers , the potential has the absolute minimum on the prolate axis around . For those Te nuclei heavier than 110Te, the PES becomes considerably softer in deformation, indicating the strong shape mixing with respect to the nonaxial quadrupole deformation. The 114Te nucleus is suggested to have an almost completely soft energy surface with a shallow oblate global minimum at . In addition to the global minimum on the oblate side, a nearly prolate, triaxial local minimum becomes visible in the 116,118,120Te nuclei. This points to the onset of the oblate-prolate shape coexistence toward the middle of the neutron major shell, i.e., . From 122Te and the heavier Te nuclei, however, the local minimum on the prolate side diminishes, and only a weakly oblate deformed ground state is suggested. Approaching 130Te, the minimum shifts to the spherical configuration, , reflecting the neutron shell closure .
The non-relativistic Gogny Hartree-Fock-Bogoliubov calculation using the D1S force [27, 26] predicts a similar systematic behavior of the intrinsic shape along the Te isotopic chain. A major difference between the present and the Gogny-HFB calculations is that the latter gives the global mean-field minimum on the prolate side for 116,118,120Te, and both the prolate global minimum and an oblate local minimum for these nuclei are quite close in energy. The present calculation, however, predicts an oblate global minimum, along with the prolate local minimum, as mentioned above. The SCMF calculations have been reported in Ref. [22], which also adopted the RHB model but with the density-dependent meson-exchange (DD-ME2) EDF [55], in addition to the DD-PC1 EDF. In that reference, mainly the systematic of the deformations and other intrinsic properties of the Te isotopic chain were studied, and the () PESs obtained there for the Te nuclei are very similar to those in the present calculation.
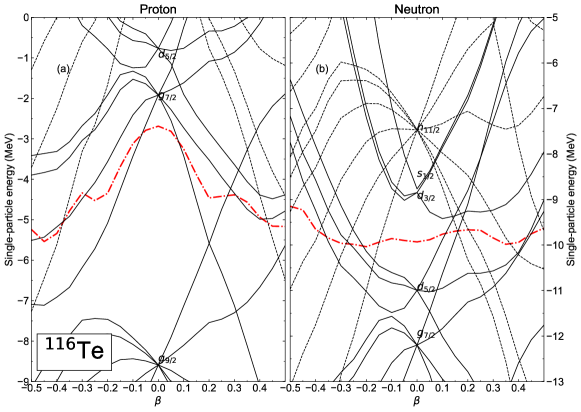
In addition to the topology of the mean-field PES, the onset of deformation, especially that of shape coexistence can be inferred from the behaviors of the single-particle spectra as functions of deformation, or Nilsson-like plots, which are obtained from the same constrained RHB calculation. When there appears a gap in the regions in which the density of the single-particle levels near the Fermi energies is low, then this gap implies stability in nuclear structure at those nucleon numbers that are different from the spherical magic numbers. This situation is actually observed in Fig. 2, depicting the variation of the proton and neutron single-particle energies near the Fermi energies as functions of the axial quadrupole deformation for the 116Te nucleus, for which the oblate-prolate shape coexistence is most notable at the mean-field level among the considered Te isotopes (cf. Fig. 2). In the proton single-particle spectra [Fig. 2(a)], a large gap between the and orbitals at represents the major shell closure. There is a region on the oblate () side, in which level density near the proton Fermi energy is low. This can be related to the oblate ground state in the corresponding PES. Concerning the neutron counterpart [Fig. 2(b)], a large gap is found between the levels coming from the and single-particle orbitals, which is mainly extended to the oblate region . Additional low level-density region is observed on the prolate side corresponding to the deformation , which is created by the states originating from the , , , and spherical single-particle states. The appearance of the gap in the neutron single-particle plot around the region near the Fermi energy then implies that the prolate local minimum may occur as a consequence of the lowering of the intruding orbitals from the spherical orbital. A similar, but much less pronounced gap on the prolate side is also visible in the proton single-particle spectra, which is formed by the lowering of the levels coming from the orbital.
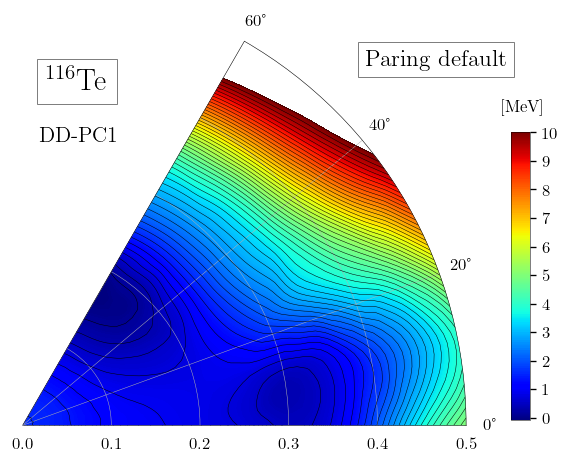
To see the sensitivity of the SCMF results on the choice of the pairing strength, we compare in Fig. 3 the PESs computed for 116Te by using the default value of the pairing strength MeV fm3 (left), and the modified strength MeV fm3 (right), corresponding to the increase by 5 % of the former, in the RHB SCMF calculations. For both nuclei, an impact of increasing the pairing strength in the RHB SCMF calculation is such that the PES becomes softer both in and deformations, and the prolate local minimum appears to be less pronounced in the calculation with the increased pairing strength. The increase of the pairing strength seems to have similar effects on the PESs for other Te nuclei.


IV Spectroscopic results
IV.1 Energy spectra
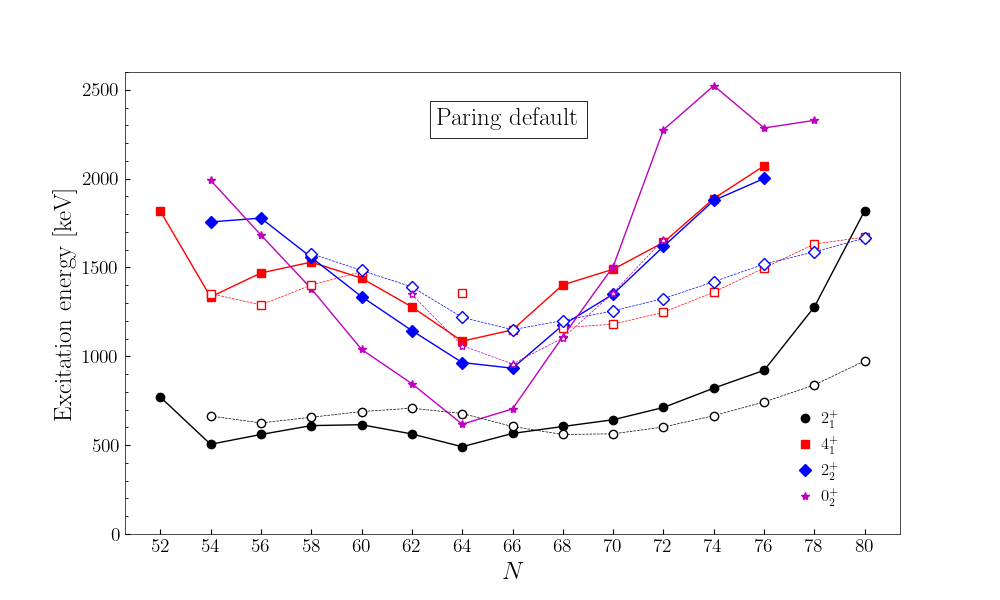
We compare in Fig. 4 the calculated low-energy levels below 2.5 MeV using the RHB+QCH method, and the corresponding experimental data taken from the NNDC database [56]. For the RHB calculation, the default value of the pairing strength is used. A global systematic that is commonly observed from both the predicted and experimental low-lying energy spectra is that the first excited state, , remains nearly constant along the isotopic chain, except for those nuclei that are near the neutron major shell . This feature illustrates that the nuclear structure transitions rather modestly in the Te isotopes, and this trend is also observed in the Cd isotopes. Another notable systematic of the energy levels is the lowering of the and some other non-yrast states toward the middle of the neutron major shell, that is, around 116Te or 118Te, in both the theoretical and experimental spectra. The appearance of the low-lying state is often considered a signature of shape coexistence.
Overall, the RHB+QCH calculation gives the excitation energies for the low-spin states that are lower than the experimental data near the mid-shell Te nuclei. As one approaches the neutron major shell , the description of the low-lying levels becomes worth, reflecting the fact that collective model description of nearly spherical nuclei is generally less reliable, for in these nuclei single-particle motions start to play a dominant role. It is particularly worth mentioning that the calculated and yrast levels for those nuclei near are lower than the experimental values. This is probably the consequence of the fact that the RHB calculation overestimates the quadrupole deformation, giving rise to a rather rotational-like QCH energy spectrum. In addition, the excitation energies are underestimated in the present calculation for 116Te and 118Te, which are so low as to be only slightly above the levels. As shown below, the state is here attributed to the prolate secondary minimum in the PES, and the fact that the energy level of this state is underestimated reflects that the RHB calculation might have given too pronounced shape coexistence or mixing.
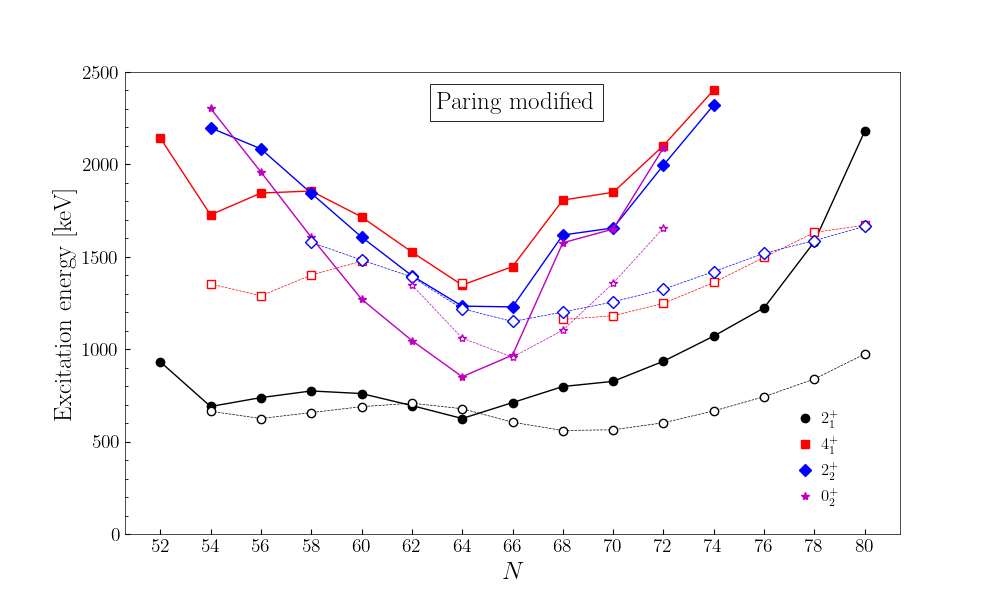
It is mainly due to this disagreement that we perform another set of the RHB+QCH calculation by using the increased pairing strength, i.e., , and study its impacts on energy spectra. The increase of the pairing strength in the mean-field calculation generally has an effect of giving rise to a less pronounced deformation, and the resulting PES is softer than in the case of a weaker pairing interaction. In Fig. 5, the results of the RHB+QCH calculation with the increased pairing strength are shown in comparison to experiment. In general, by increasing the pairing strength the whole energy spectrum is stretched in energy for all the Te nuclei, while it does not alter qualitatively the overall level structure. For the near mid-shell nuclei, 116Te and 118Te in particular, both the and energy levels are pushed up, and agree with the observed ones to a better extent than in the calculation with the default pairing strength. By closely comparing with the experimental spectrum, e.g., for 116Te, the predicted level is still low with respect to the one, and is rather closer to the level. This is qualitatively the same as in the case of the default pairing. For those nuclei heavier than 118Te, the calculated yrast levels for the and states become even higher than with the default pairing strength, and the agreement with the observed spectra is rather worsened.
IV.2 Collective wave functions
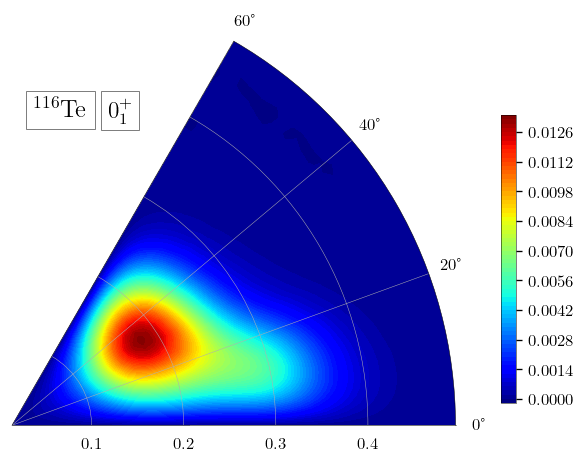
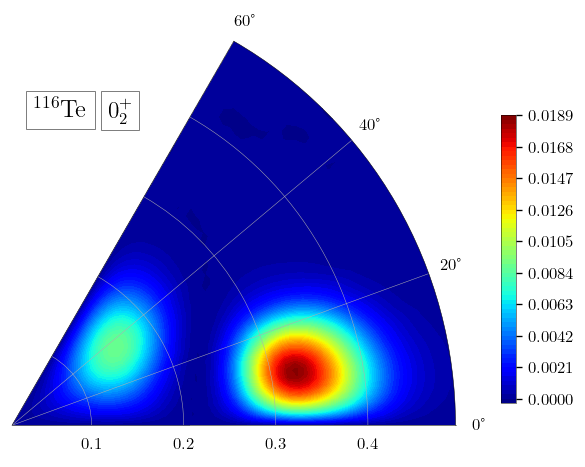
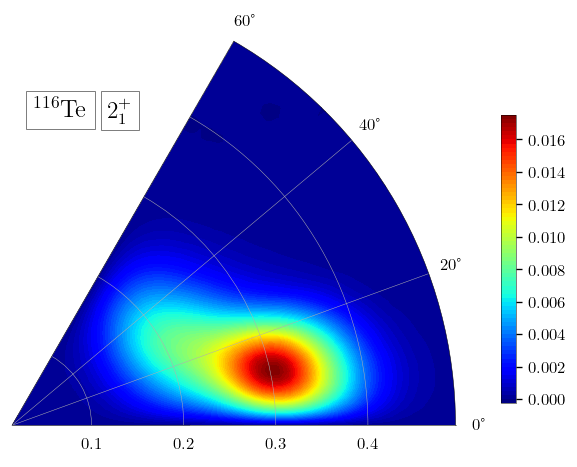
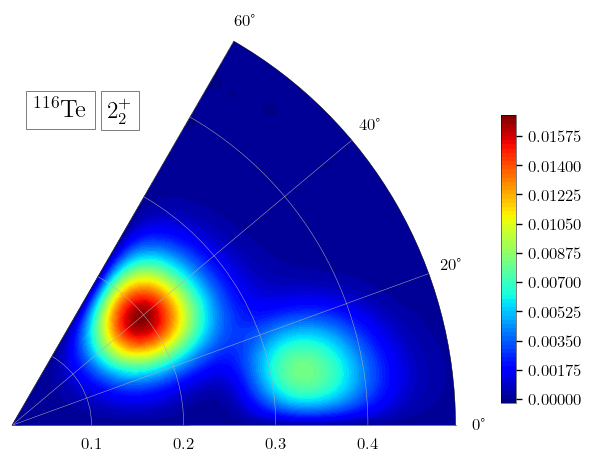
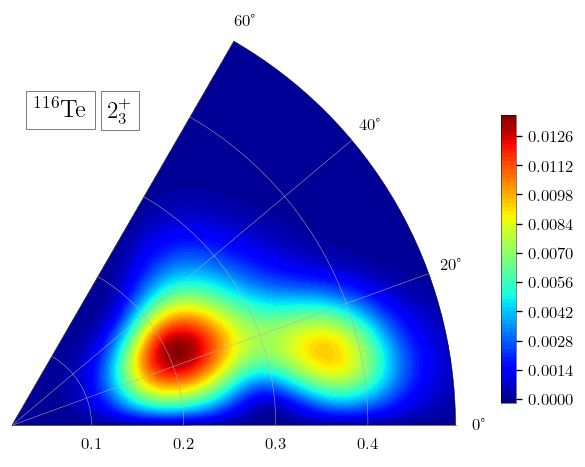
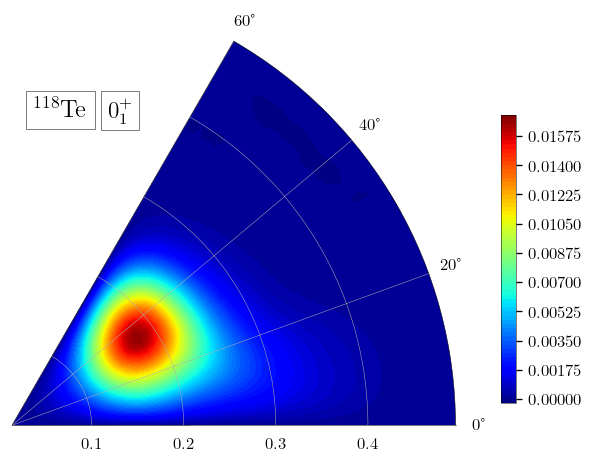
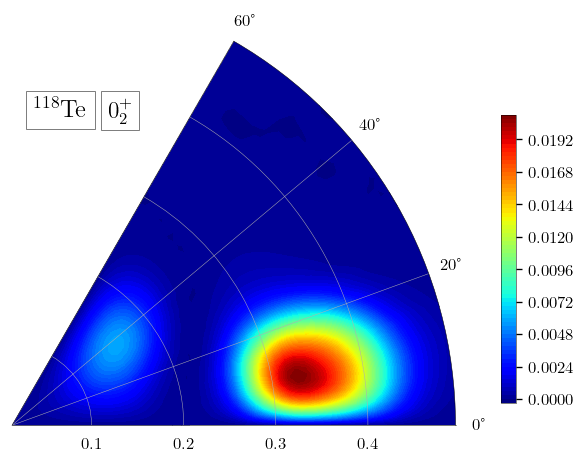
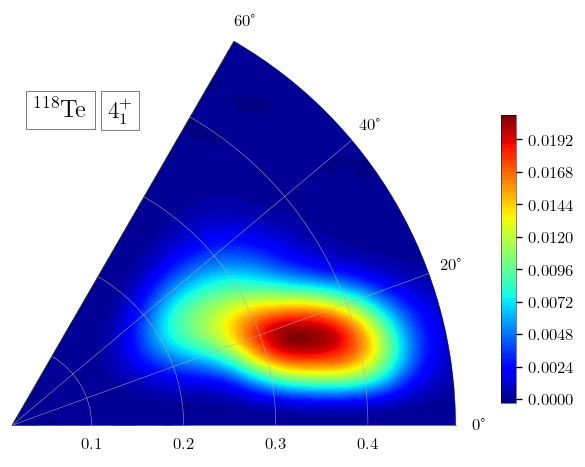
The nature of each calculated low-lying state can be inferred from the collective wave function obtained as the eigenvector of the QCH at each deformation. Figures 6 and 7 show, respectively, distributions of the calculated collective wave functions for the , , and states for the 116Te and 118Te. Here only the results with the default pairing strength in the RHB calculation are shown, as they are qualitatively similar to those plotted in these figures. For both Te nuclei, the wave function for the ground state is peaked at , which is associated with the the oblate absolute minimum on the PES (see Fig. 1). The wave function for the 116Te is, however, more extended toward the prolate side within the range , than that of 118Te, and this implies strong shape mixing in the former nucleus. The wave functions for both nuclei exhibit a distinct peak near the prolate axis, that is, and , which appears to be associated with the local minimum near the prolate axis in the PES. The fact that the distinct peaks appear, one on the oblate side in the wave function, and the other on the prolate side with larger axial deformation in the one, is in accordance with the coexistence of the closely lying oblate and prolate minima obtained in the RHB calculation. From their collective wave functions, one could see that the ground state can be here attributed to a near oblate triaxial deformation with being , while the state is constructed based on the configurations representing a near triaxial prolate deformation with larger () value.
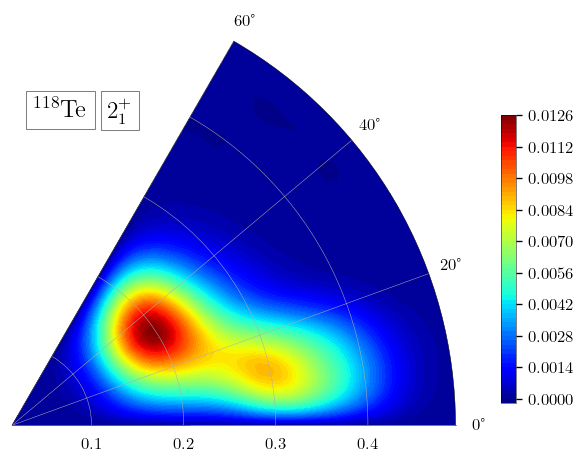
As one can see in Figs. 6 and 7, the nature of the collective wave function for the 116Te nucleus is rather different from that of the 118Te one: for the former the peak is observed near the prolate axis with , while for the latter a major peak is seen rather on the oblate side, , and a minor peak is also obtained near the prolate axis, . The state of 116Te, as well as the one is, therefore, coming from the near prolate configurations that are supposed to originate from the intruder states. As for 118Te, due the similarity between the and wave functions in that both have a major peak in the triaxial oblate region, these states are mostly composed of the weakly oblate deformed states, associated with the global oblate minimum in the corresponding PESs.
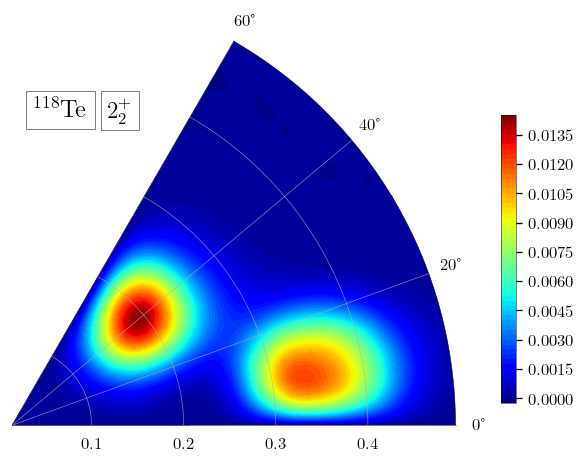
There are two peaks visible in the distributions of the state for both Te nuclei, the major one in the triaxial oblate region and the other near the prolate axis, which is less pronounced than the former. In addition, the minor peak on the prolate side in the wave function distribution for 118Te is more significant than that of the 116Te, meaning that the state of 118Te contains large fractions of both triaxial oblate and prolate components to a greater extent than in the 116Te counterpart.
The collective wave functions for both 116Te and 118Te exhibit a major peak in the triaxial region with , and a minor one near the prolate axis. These structures seem to be more or less similar to those found in the wave function distributions, which also exhibit two peaks on the oblate and prolate sides. The similarities in the behaviors of the and collective wave functions indicate that there are substantial degree of configuration mixing between these low-spin states.
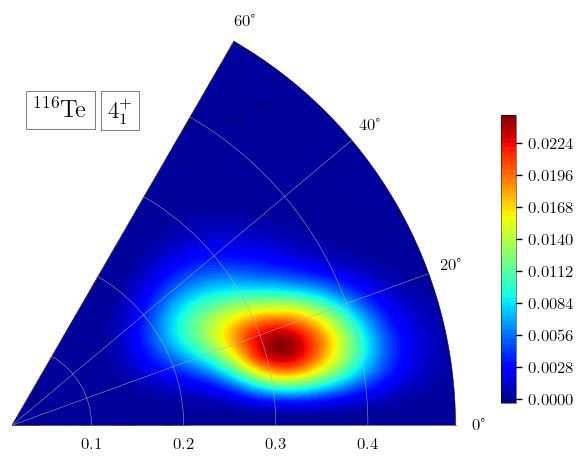
For both 116Te and 118Te, the distribution of the calculated collective wave function essentially has a single peak at () (), and this suggests that the state is mainly composed of the near prolate, triaxial configuration corresponding to the prolate local minimum on the mean-field PES. For the 116Te nucleus, density distributions for the , , and wave functions have a distinct peak on the prolate side, and this implies that these three states are, to a large extent, accounted for by the prolate deformed configurations.
IV.3 Electric quadrupole and quadrupole properties
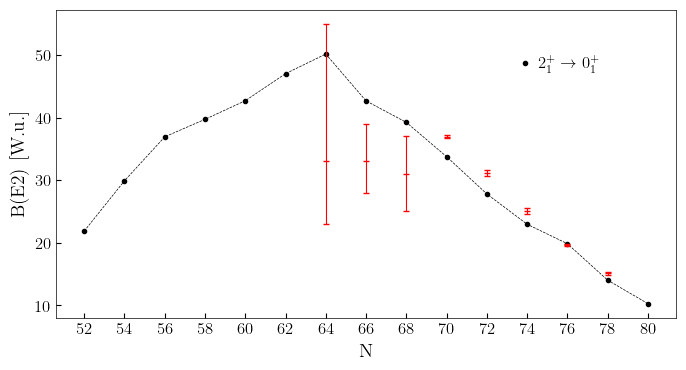
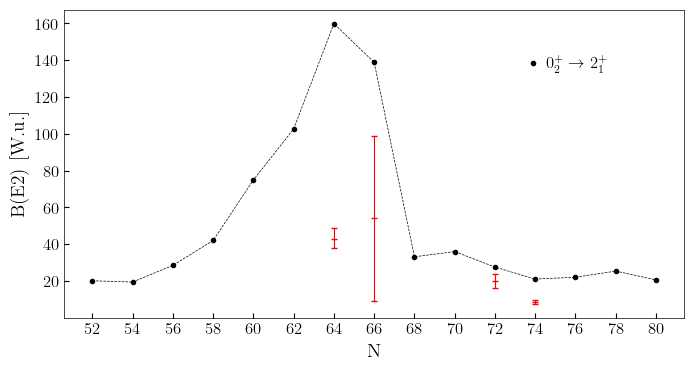
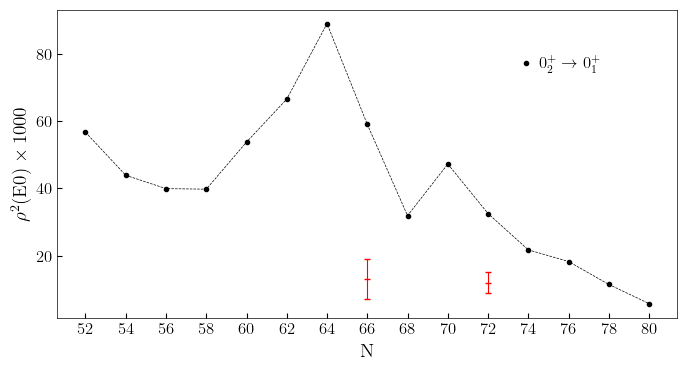
Figure 8 exhibits the calculated , , and values in Weisskopf units (W.u.), and value for the 104-132Te isotopes as functions of the neutron number . Experimental data for the transition rates are available for 116Te [17], 118Te [16], 120Te and heavier Te nuclei [56]. The predicted , and values both monotonously increase toward the middle of the neutron major shell, or 66, reflecting the growing quadrupole collectivity in the open shell nuclei. The RHB+QCH calculation seems to overestimate the observed values for these transitions. Concerning 116Te, however, the present calculation provides the value of 50 W.u., which is within the error bar of the measured one [17], W.u., The value for the same nucleus is here calculated to be 117 W.u., while the recent measurement suggested the lower and upper limits of this transition rate to be 20 W.u. and 170 W.u., respectively. The phenomenological IBM-1 calculation assuming the single U(5) configuration, which was also reported in Ref. [17], provided the and values that are nearly half the ones obtained in the present calculation.
The transition rate is considered an indicator of the shape mixing and coexistence. As seen from Fig. 8, the calculated values of this quantity near the mid-shell nuclei with are generally large, which are almost in the same order of magnitude as the transition rates. This systematic corroborates the facts that the two minima appears and substantial degree of softness along the triaxial deformation is present in the mean-field PESs, and is further in accordance with the result that the energy levels for these nuclei are calculated to be especially low. The RHB+QCH calculation suggests the highest transition of 166 W.u., at 116Te among the Te isotopes considered. The corresponding experimental value available in [17] is W.u., which is much lower than the calculated value by a factor of 3 to 4. This again illustrates that the present RHB+QCH calculation rather overestimates the degree of shape mixing for the near mid-shell Te nuclei, and this feature is shown to be the same if the increased pairing strength is employed in the RHB calculation.
The transition between the and states is another signature of the shape mixing and evolution of collectivity. The predicted values, shown in Fig. 8, exhibit a monotonous increase toward the mid-shell, with the maximal value being found at . This appears to be a similar systematic behavior as a function of to the values. Experimental information about the transitions is scarce for Te isotopes, as indeed the available data are and for 118Te, and 124Te, respectively [57]. The present calculation significantly overestimates these values. The calculated values for lighter Te near the neutron major shell are, however, also large, even though the quadrupole collectivity is expected to be much less significant for near magic nuclei than in the open-shell nuclei.


IV.4 Level scheme for 116Te and 118Te
We show in Figs. 9 and 10 the predicted low-energy level schemes for 116Te and 118Te. The calculated results are compared with the experimental data available from Refs. [17] and [16] for 116Te and 118Te, respectively. Within the RHB+QCH calculations in both cases of the default and increased pairing strength, remarkably low-energy level is obtained, which is supposed to be the bandhead of the possible band connected by dominant in-band transitions. In Fig. 9, the level in both calculations is depicted as the first excited state from the state, and the as the bandhead of the second excited band, which are arranged so that the energy spectrum looks similar to the empirical one [17]. It is, however, not obvious to firmly determine whether the and states are classified into the or band, since the the calculated and states contain equal amounts of the and components, i.e., 47 % and 53 % (53 % and 47 %) of the () wave function is accounted for by the and components, respectively. There seems to be also considerable degrees of configuration (shape) mixing between the and states, based on the fact that these states exhibit strong transitions to the state, with the corresponding rates being 40 (35) W.u. and 23 (31) W.u., respectively, when the default (increased) pairing strength is used. Recall also that the density distributions of the and wave functions in the plane both exhibit a major peak with small deformation in triaxial region, and a minor peak with larger near the prolate axis. The predicted energy level agrees with the the observed one in the calculation with the pairing strength of , whereas the level is predicted to be higher than the observed one, reflecting the level repulsion effects. The level is reproduced rather well by the RHB+QCH calculation, irrespective of whether the default or increased pairing strength is considered. Note that the experimental level at 1637 keV is assigned to be the state in the NNDC database [56], but in the new measurement of Ref. [17] it has been identified the state. The experimental level scheme shown on the right-hand side of Fig. 9 follows the latter assignment.
Similar observations could apply to the comparison of the theoretical and observed level schemes for 118Te, which are shown in Fig. 10. As compared to 116Te, the overall band structure for 118Te predicted in the present model calculation resembles that of the experimental one [16] reasonably well, even without any modification to the pairing strength.
Table 1 summarizes the calculated transition rates and electric quadrupole moments of low-energy states in 116Te and 118Te. The experimental data are taken from Ref. [17] for 116Te, and Ref. [16] for 118Te. The RHB+QCH calculation provides substantially strong rate especially for 116Te, which amounts to approximately by a factor of three larger than than the corresponding data. For the other transitions of the non-yrast states, the collective generally gives large rates, whereas the experimental information is rather limited for 116Te as only the lower limits are known. More experimental values are available for 118Te. In comparison to 116Te, it appears that the RHB+QCH describes rather well the observed transitions.
Experimental information about the moments is not available for both nuclei, but the predicted values with the default (increased) pairing force, () b and () b for 116Te and 118Te, respectively, are similar to the observed ones, both in magnitude and sign, for the heavier Te isotopes [58].
| Expt. | Theo. | |||
| 116Te | 50 | 51 | ||
| 160 | 155 | |||
| 55 | 66 | |||
| and | 117 | 117 | ||
| 1.5 | 1.6 | |||
| 69 | 72 | |||
| 24 | 33 | |||
| 23 | 31 | |||
| 5.5 | 4.8 | |||
| 36 | 36 | |||
| 166 | 172 | |||
| 0.016 | 0.06 | |||
| 65 | 87 | |||
| 3.3 | 0.51 | |||
| 118Te | 43 | 45 | ||
| 94 | 96 | |||
| 178 | 177 | |||
| 1.2 | 0.58 | |||
| 72 | 80 | |||
| 139 | 131 | |||
| 7.9 | 6.2 | |||
| 63 | 70 | |||
| 27 | 40 | |||
| 22 | 33 | |||
| 13 | 10 | |||
| 28 | 29 | |||
| 3.6 | 3.1 | |||
| 52 | 85 | |||
V Summary
Evolution and coexistence of the shape and the corresponding collective excitations in the even-even 104-132Te isotopes have been investigated within the quadrupole collective Hamiltonian that is based on the relativistic EDF. The starting point is the constrained SCMF calculations within the RHB method employing the functional DD-PC1 and the separable pairing force of finite range. By using as a microscopic input the SCMF solutions, parameters of the QCH, i.e., deformation-dependent mass parameters, moments of inertia, and collective potential, have been completely determined. The QCH has provided excitation spectra, electric quadrupole, and monopole transition strengths.
The resultant quadrupole triaxial PESs for the near mid-shell nuclei, 114-120Te, exhibit two minima: a weakly deformed oblate ground state, and a prolate local minimum near the prolate axis and with a stronger deformation. The systematic behaviors of the calculated low-lying excitation energies exhibits a parabolic dependence of the energy level on the neutron number, while the level remains almost constant in open shell nuclei. The lowering of the energy level with respect to yrast states indicates the possible shape coexistence, and this feature is, overall, consistent with the observed energy-level systematic.
The present RHB+QCH calculation, however, has yielded the levels for the mid-shell Te nuclei, that are significantly lower than the experimental ones, thus overestimating the effect of shape coexistence or mixing. The calculated and values also point to the development of the collectivity toward the mid-shell, which signals the shape coexistence and mixing. As in the case of the Cd isotopes [46], the and values for the mid-shell Te nuclei have been calculated to be too larger, as compared with the available data. This discrepancy also indicates that the RHB model gives a too pronounced deformation and shape coexistence, and these features are more or less related to the nature of the adopted EDF. We have also studied sensitivity of the results on the strength of the pairing interaction in the RHB calculation. The increase of the pairing strength by 5 % has been shown to have impacts that the PES becomes softer in triaxial deformation, and that the corresponding energy spectrum becomes more stretched, being in a better agreement with experiment for the mid-shell Te isotopes than in the case of the default pairing strength.
References
- Bohr and Mottelson [1975] A. Bohr and B. R. Mottelson, Nuclear Structure, Vol. II (Benjamin, New York, USA, 1975).
- Cejnar et al. [2010] P. Cejnar, J. Jolie, and R. F. Casten, Rev. Mod. Phys. 82, 2155 (2010).
- Heyde et al. [1992] K. Heyde, C. De Coster, J. Jolie, and J. L. Wood, Phys. Rev. C 46, 541 (1992).
- Wood et al. [1992] J. L. Wood, K. Heyde, W. Nazarewicz, M. Huyse, and P. van Duppen, Phys. Rep. 215, 101 (1992).
- Heyde and Wood [2011] K. Heyde and J. L. Wood, Rev. Mod. Phys. 83, 1467 (2011).
- Garrett et al. [2022] P. E. Garrett, M. Zielińska, and E. Clément, Prog. Part. Nucl. Phys. 124, 103931 (2022).
- Morinaga [1956] H. Morinaga, Phys. Rev. 101, 254 (1956).
- Andreyev et al. [2000] A. N. Andreyev, M. Huyse, P. Van Duppen, L. Weissman, D. Ackermann, J. Gerl, F. P. Hessberger, S. Hofmann, A. Kleinböhl, G. Münzenberg, S. Reshitko, C. Schlegel, H. Schaffner, P. Cagarda, M. Matos, S. Saro, A. Keenan, C. Moore, C. D. O’Leary, R. D. Page, M. Taylor, H. Kettunen, M. Leino, A. Lavrentiev, R. Wyss, and K. Heyde, Nature (London) 405, 430 (2000).
- Bengtsson et al. [1987] R. Bengtsson, T. Bengtsson, J. Dudek, G. Leander, W. Nazarewicz, and J. ye Zhang, Phys. Lett. B 183, 1 (1987).
- Bengtsson and Nazarewicz [1989] R. Bengtsson and W. Nazarewicz, Z. Phys. A 334, 269 (1989).
- Ćwiok et al. [2005] S. Ćwiok, P. H. Heenen, and W. Nazarewicz, Nature 433, 705 (2005).
- Federman and Pittel [1977] P. Federman and S. Pittel, Phys. Lett. B 69, 385 (1977).
- Heyde et al. [1985] K. Heyde, P. Van Isacker, R. F. Casten, and J. L. Wood, Phys. Lett. B 155, 303 (1985).
- Heyde et al. [1995] K. Heyde, J. Jolie, H. Lehmann, C. De Coster, and J. Wood, Nucl. Phys. A 586, 1 (1995).
- Rikovska et al. [1989] J. Rikovska, N. Stone, P. Walker, and W. Walters, Nuclear Physics A 505, 145 (1989).
- Mihai et al. [2011] C. Mihai, A. A. Pasternak, S. Pascu, D. Filipescu, M. Ivaşcu, D. Bucurescu, G. C ăta Danil, I. C ăta Danil, D. Deleanu, D. G. Ghiţă, T. Glodariu, N. Mărginean, R. Mărginean, A. Negret, T. Sava, L. Stroe, G. Suliman, and N. V. Zamfir, Phys. Rev. C 83, 054310 (2011).
- von Spee et al. [2024] F. von Spee, M. Beckers, A. Blazhev, A. Dewald, F. Dunkel, A. Esmaylzadeh, C. Fransen, G. Hackenberg, J. Jolie, L. Knafla, C.-D. Lakenbrink, M. Schiffer, N. Warr, and M. Weinert, Phys. Rev. C 109, 024325 (2024).
- Li et al. [2024] C. B. Li, Y. Zheng, T. X. Li, X. G. Wu, H. Y. Wu, M. Zheng, Z. H. Zhao, Y. Q. Li, R. Hong, Z. Y. He, J. Z. Li, J. L. Wang, C. Y. Guo, Z. X. Zhou, L. Ni, G. S. Li, X. H. Zhou, B. Guo, S. Y. Wang, M. L. Liu, Y. H. Zhang, C. Y. He, F. L. Liu, S. Wang, and L. H. Zhu, Phys. Rev. C 109, 034310 (2024).
- Qi [2016] C. Qi, Phys. Rev. C 94, 034310 (2016).
- Kaneko et al. [2021] K. Kaneko, N. Shimizu, T. Mizusaki, and Y. Sun, Phys. Rev. C 103, L021301 (2021).
- Sharma et al. [2022] S. Sharma, R. Devi, and S. K. Khosa, Int. J. Mod. Phys. E 31, 2250053 (2022), https://doi.org/10.1142/S0218301322500537 .
- Sharma et al. [2019] S. Sharma, R. Devi, and S. Khosa, Nuclear Physics A 988, 9 (2019).
- Bonatsos et al. [2022] D. Bonatsos, K. E. Karakatsanis, A. Martinou, T. J. Mertzimekis, and N. Minkov, Phys. Rev. C 106, 044323 (2022).
- Próchniak et al. [1999] L. Próchniak, K. Zaja̧c, K. Pomorski, S. Rohoziński, and J. Srebrny, Nucl. Phys. A 648, 181 (1999).
- Libert et al. [2007] J. Libert, B. Roussière, and J. Sauvage, Nuclear Physics A 786, 47 (2007).
- Delaroche et al. [2010] J. P. Delaroche, M. Girod, J. Libert, H. Goutte, S. Hilaire, S. Péru, N. Pillet, and G. F. Bertsch, Phys. Rev. C 81, 014303 (2010).
- [27] http://www-phynu.cea.fr/science_en_ligne/carte_potentiels_microscopiques/carte_potentiel_nucleaire_eng.htm.
- Sambataro [1982] M. Sambataro, Nuclear Physics A 380, 365 (1982).
- Lehmann et al. [1997] H. Lehmann, J. Jolie, C. De Coster, B. Decroix, K. Heyde, and J. L. Wood, Nucl. Phys. A 621, 767 (1997).
- Pascu et al. [2010] S. Pascu, N. V. Zamfir, G. C ăta Danil, and N. Mărginean, Phys. Rev. C 81, 054321 (2010).
- Gupta [2023] J. B. Gupta, Phys. Rev. C 107, 034315 (2023).
- Coello Pérez and Papenbrock [2015] E. A. Coello Pérez and T. Papenbrock, Phys. Rev. C 92, 064309 (2015).
- Skyrme [1958] T. H. R. Skyrme, Nucl. Phys. 9, 615 (1958).
- Bender et al. [2003] M. Bender, P.-H. Heenen, and P.-G. Reinhard, Rev. Mod. Phys. 75, 121 (2003).
- Schunck [2019] N. Schunck, ed., Energy Density Functional Methods for Atomic Nuclei (IOP Publishing, 2019).
- J. Decharge and M. Girod and D. Gogny [1975] J. Decharge and M. Girod and D. Gogny, Phys. Lett. B 55, 361 (1975).
- Robledo et al. [2019] L. M. Robledo, T. R. Rodríguez, and R. R. Rodríguez-Guzmán, J. Phys. G: Nucl. Part. Phys. 46, 013001 (2019).
- Vretenar et al. [2005] D. Vretenar, A. V. Afanasjev, G. A. Lalazissis, and P. Ring, Phys. Rep. 409, 101 (2005).
- Nikšić et al. [2011] T. Nikšić, D. Vretenar, and P. Ring, Prog. Part. Nucl. Phys. 66, 519 (2011).
- Ring and Schuck [1980] P. Ring and P. Schuck, The Nuclear Many-Body Problem (Springer-Verlag, Berlin, 1980).
- Nikšić et al. [2009] T. Nikšić, Z. P. Li, D. Vretenar, L. Próchniak, J. Meng, and P. Ring, Phys. Rev. C 79, 034303 (2009).
- Nomura et al. [2008] K. Nomura, N. Shimizu, and T. Otsuka, Phys. Rev. Lett. 101, 142501 (2008).
- Nomura et al. [2010] K. Nomura, N. Shimizu, and T. Otsuka, Phys. Rev. C 81, 044307 (2010).
- Nomura et al. [2011] K. Nomura, T. Otsuka, N. Shimizu, and L. Guo, Phys. Rev. C 83, 041302 (2011).
- Karakatsanis and Nomura [2022] K. E. Karakatsanis and K. Nomura, Phys. Rev. C 105, 064310 (2022).
- Nomura and Karakatsanis [2022] K. Nomura and K. E. Karakatsanis, Phys. Rev. C 106, 064317 (2022).
- Nikšić et al. [2014] T. Nikšić, N. Paar, D. Vretenar, and P. Ring, Comput. Phys. Commun. 185, 1808 (2014).
- Bjelčić et al. [2021] A. Bjelčić, T. Nikšić, and Z. Drmač, DIRHBspeedup, https://github.com/abjelcic/DIRHBspeedup.git (2021).
- Nikšić et al. [2008] T. Nikšić, D. Vretenar, and P. Ring, Phys. Rev. C 78, 034318 (2008).
- Tian et al. [2009] Y. Tian, Z. Y. Ma, and P. Ring, Phys. Lett. B 676, 44 (2009).
- Berger et al. [1984] J. F. Berger, M. Girod, and D. Gogny, Nucl. Phys. A 428, 23 (1984).
- Teeti and Afanasjev [2021] S. Teeti and A. V. Afanasjev, Phys. Rev. C 103, 034310 (2021).
- Inglis [1956] D. R. Inglis, Phys. Rev. 103, 1786 (1956).
- Beliaev [1961] S. Beliaev, Nucl. Phys. 24, 322 (1961).
- Lalazissis et al. [2005] G. A. Lalazissis, T. Nikšić, D. Vretenar, and P. Ring, Phys. Rev. C 71, 024312 (2005).
- [56] Brookhaven National Nuclear Data Center, http://www.nndc.bnl.gov.
- Kibédi and Spear [2005] T. Kibédi and R. Spear, At. Data and Nucl. Data Tables 89, 77 (2005).
- Stone [2005] N. Stone, At. Data Nucl. Data Tables 90, 75 (2005).