\pkgfastcpd: Fast Change Point Detection in \proglangR
Xingchi Li and Xianyang Zhang
\Plaintitlefastcpd: Fast Change Point Detection in R
\ShorttitleFast Change Point Detection in \proglangR
\Abstract
Change point analysis is concerned with detecting and locating structure
breaks in the underlying model of a sequence of observations ordered by time,
space or other variables. A widely adopted approach for change point analysis
is to minimize an objective function with a penalty term on the number of
change points. This framework includes several well-established procedures,
such as the penalized log-likelihood using the (modified) Bayesian information
criterion (BIC) or the minimum description length (MDL). The resulting
optimization problem can be solved in polynomial time by dynamic programming
or its improved version, such as the Pruned Exact Linear Time (PELT) algorithm
(killick2012optimal). However, existing computational methods often
suffer from two primary limitations: (1) methods based on direct
implementation of dynamic programming or PELT are often time-consuming for
long data sequences due to repeated computation of the cost value over
different segments of the data sequence; (2) state-of-the-art \proglangR
packages do not provide enough flexibility for users to handle different
change point settings and models. In this work, we present the \pkgfastcpd
package, aiming to provide an efficient and versatile framework for change
point detection in several commonly encountered settings. The core of our
algorithm is built upon PELT and the sequential gradient descent method
recently proposed by zhang2023sequential. We illustrate the usage of
the \pkgfastcpd package through several examples, including mean/variance
changes in a (multivariate) Gaussian sequence, parameter changes in
regression models, structural breaks in ARMA/GARCH/VAR models,
and changes in user-specified models.
\KeywordsChange point analysis, Gradient descent, Quasi-Newton’s method,
Regression models, Segmentation, Time series models
\PlainkeywordsChange point analysis, Gradient descent, Quasi-Newton’s method,
Regression models, Segmentation, Time series models
\Address
Xingchi Li
Department of Statistics
Texas A&M University
College Station, Texas, USA
E-mail:
URL: https://xingchi.li/
Xianyang Zhang
Department of Statistics
Texas A&M University
College Station, Texas, USA
E-mail:
URL: https://zhangxiany-tamu.github.io/
1 Introduction
Change point analysis is a classical but still very active research field. It aims to detect and locate structural breaks in the underlying model of a sequence of observations ordered by time, space, or other variables. This field originated in the 1950s for industrial quality control and has since become a critical tool across various fields such as signal processing, climate science, economics, finance, medicine, and bioinformatics. The widespread applicability of change point analysis is also evident from the adoption of different terminologies, such as switch point problems (stephens1994bayesian; lindelov2020mcp), broken-line relationships (muggeo2008segmented), and anomaly detection (shipmon2017time), when researchers approach change point problems from various perspectives. For readers who wish to gain more insights into the state-of-the-art developments and recent innovations in change point detection problems, they may refer to comprehensive book-length treatments and reviews, such as brodsky1993nonparametric; csorgo1997limit; tartakovsky2014sequential; aue2013structural; niu2016multiple; aminikhanghahi2017survey; truong2020selective; liu2022high.
Change point detection methods can be broadly classified into two categories: online methods and offline methods. Online methods aim to detect changes as soon as they have occurred in a real-time setting and are often used for event or anomaly detection. On the other hand, offline methods are used to retrospectively detect changes when all samples are received and are sometimes referred to as signal segmentation. Here, we focus on the offline change point detection methods, which often involve three major elements:
-
•
a cost function or a test statistic for quantifying the homogeneity of a segment;
-
•
a penalty/constraint on controlling the number of change points;
-
•
a search method for determining the optimal change point number and their locations.
Each of the above elements affects the overall performance of a change point detection method (truong2020selective). A widely adopted approach translates the offline change point detection (or signal segmentation) problem into a model selection problem by solving a penalized optimization with a penalty term on the number of change points. This framework includes several well-established procedures, such as the penalized log-likelihood using the (modified) Bayesian information criterion (BIC) or the minimum description length (MDL). Dynamic programming (auger1989algorithms; jackson2005algorithm) offers exact solutions to the penalized optimization problem when the penalty term is linear in the number of change points. However, dynamic programming is often computationally intensive. Pruning strategies like PELT (killick2012optimal; rigaill2010pruned) have been introduced to alleviate the computational burden. Yet, they still face significant computational costs, especially when (i) the data sequence is long and (ii) obtaining the cost value involves solving a non-trivial optimization problem. In the worst-case scenario, the computational cost of dynamic programming coupled with pruning strategies remains in the same order as that without pruning, where denotes the length of the data sequence and represents the time complexity for calculating the cost function value based on data points. Recently, zhang2023sequential proposed a sequential updating method by integrating gradient descent and quasi-Newton’s method with dynamic programming. The core idea is to update the cost value using the information from previous steps, eliminating the need to re-optimize the objective function over each data segment. This approach boosts computational efficiency by reducing the time complexity to , where is the time complexity for performing a one-step update described in Section 2 and denotes the size of the set of candidate change point locations after pruning at the th step.
Existing \proglangR packages for change point analysis can be categorized based on their detection algorithms, as discussed in bai2021multiple. One line of approaches involves finding the posterior probabilities of change point locations, which can be achieved using packages such as \pkgbcp (erdman2008bcp; barry1993bayesian), \pkgmcp (lindelov2020mcp) and \pkgRbeast (zhao2019detecting). Another line of approaches involves optimizing penalized cost functions and packages such as \pkgchangepoint (killick2014changepoint), \pkgCptNonPar (mcgonigle2023nonparametric), \pkgfpop (maidstone2017optimal), \pkggfpop (runge2023gfpop), \pkgstrucchange (zeileis2002strucchange) and \pkgVARDetect (bai2021multiple), fall under this category. Finally, some packages use multiscale analysis to subsample and aggregate results, including \pkgbreakfast (Fryzlewicz2018tguh), \pkgInspectChangepoint (wang2018high) \pkgnot (baranowski2019narrowest), \pkgstepR (stepr) and \pkgwbs (Fryzlewicz2014wbs). Table 2 provides a detailed comparison of selected offline change point analysis packages, including their functionalities, speed, and accuracy.
| \proglangR package | basic characteristics | regression models | time series models | speed | accuracy | ||||||
| mean | variance | \codelm | \codeglm | lasso | ar | arma | garch | var | |||
| \pkgfastcpd | ✓ | ✓ | ✓ | ✓ | ✓ | ✓ | ✓ | ✓ | ✓ | ||
| \pkgCptNonPar | ✓ | ✓ | ✓ | ✓ | |||||||
| \pkgstrucchange | ✓ | ✓ | ✓ | ||||||||
| \pkgVARDetect | ✓ | ||||||||||
| \pkgRbeast | ✓ | ✓ | |||||||||
| \pkgecp | ✓ | ✓ | |||||||||
| \pkggfpop | 1 | 1 | |||||||||
| \pkgmcp | 1 | 1 | ✓ | ||||||||
| \pkgnot | 1 | 1 | |||||||||
| \pkgchangepoint | 1 | 1 | |||||||||
| \pkgbcp | ✓ | ||||||||||
| \pkgInspectChangepoint | ✓ | ||||||||||
| \pkgjointseg | ✓ | ||||||||||
| \pkgbreakfast | 1 | ||||||||||
| \pkgwbs | 1 | ||||||||||
| \pkgmosum | 1 | ||||||||||
| \pkgfpop | 1 | ||||||||||
| \pkgstepR | 1 | ||||||||||
| \pkgsegmented | ✓ | ||||||||||
Although the packages mentioned above excel in certain aspects, a package that is both computationally efficient and capable of dealing with a wide range of settings is still lacking. In this work, we develop the \proglangR package \pkgfastcpd (fast change point detection) as a general framework for efficient change point detection.
The \pkgfastcpd package offers a suite of built-in models for change point detection under different settings, including (i) mean and/or variance changes for multivariate data; (ii) changes in the parameters of linear models, generalized linear models (including logistic regression and Poisson regression), and penalized linear regression; (iii) changes in time series models, including ARMA (Autoregressive Moving Average), GARCH (Generalized Autoregressive Conditional Heteroskedasticity), and VAR (Vector Autoregressive) models. The \pkgfastcpd package allows custom cost functions, significantly enhancing its adaptability to different real-world scenarios. Key features of the package include the sequential updating method for reduced time complexity, a general framework applicable to diverse data types/models, and a user-friendly interface.
In Section 2, we formulate the change point detection problem as a model selection problem by optimizing a penalized objective function. We present dynamic programming for solving the optimization problem and two modifications: (i) the pruning strategy and (ii) the sequential gradient descent to improve its computational efficiency. We discuss different choices for the penalty terms, including the Bayesian information criterion (BIC), the modified BIC, and the minimum description length (MDL). Section 3 describes the main function \codefastcpd() in the package. We illustrate the use of our package in mean/variance change models in Section 4. In subsequent sections, we detail the application of our package to various statistical models. These include linear regression (Section 5) and generalized linear regression (Section 6). Sections 7.1-LABEL:sec:vector_autoregressive_model illustrate the usage of the package for several time series models, including AR, ARMA, GARCH, and VAR models. In Section LABEL:sec:custom_cost_function, we demonstrate the usage of the package with a user-specified cost function. We analyze several real data sets in Section LABEL:sec:_real_data_analysis. Section LABEL:sec:advanced_usages explores several advanced usage scenarios, which include interpolating the vanilla PELT with the sequential updating algorithm, adaptive epoch numbers, and line search for sequential quasi-Newton’s method. Finally, the \pkgfastcpd package is available for download from CRAN at https://cran.r-project.org/package=fastcpd. A cheat sheet and comprehensive documentation can be found at https://fastcpd.xingchi.li.
2 Algorithm
Consider a sequence of observations ordered in time. We aim to partition the sequence into homogeneous segments such that observations within each piece share the same (probabilistic) behavior. One way to tackle the change point detection problem is to translate it into a model selection problem. We denote by the segment of data points observed from time to time with . Let be a cost function for measuring the homogeneity of the segment . Often, the value of the cost function can be computed by solving the following minimization problem
| (1) |
where is the individual loss function parameterized by that belongs to a compact parameter space . A particular choice of is the negative log-likelihood of . When contains a set of predictors and a response , we can choose , where is a loss function and is an unknown regression function parameterized by for predicting the response.
Suppose there are change points dividing the data sequence into segments. The cost value for the whole data sequence is defined as
where the minimization is over all possible change point locations with . To estimate the number of change points, we consider the following optimization problem
where is a penalty term on the number of change points.
Dynamic programming. When , the above penalized optimization problem can be solved through dynamic programming (killick2012optimal; jackson2005algorithm). To describe the procedure, let us consider the data sequence up to time , i.e., . Denote by the minimum value of the penalized cost for segmenting . We derive a recursion for by conditioning on the last change point location,
| (2) |
where in the first equation and in the third equation. The segmentations can be recovered by taking the argument , which minimizes (2), i.e.,
| (3) |
which gives the optimal location of the last change point in segmenting . Let be the estimated change point locations associated with . The procedure is repeated until all the change point locations are identified. Our final estimates of the change point locations for the whole data sequence are given by .
Pruning. A popular way to improve the efficiency of dynamic programming is by pruning the candidate set to find the last change point in each iteration. Suppose for any , there exists a constant such that
| (4) |
killick2012optimal showed that for some if
| (5) |
then at any future time point , can never be the optimal location of the most recent change point prior to . To appreciate this, we note that (4) and (5) together imply that
which suggests that is a sub-optimal choice as compared to in segmenting . Motivated by this observation, one can define a sequence of sets recursively as
| (6) |
Then can be computed as
| (7) |
and the minimizer in (3) belongs to . The constant used in the pruning step can be selected as if the cost function is defined as in (1). More generally, consider
where is a function of that can vary with respect to the segment. An example for is given in Section 5.2 for sparse regression. Suppose
for all . Then we have
This pruning technique forms the basis of the Pruned Exact Linear Time (PELT) algorithm. Under suitable conditions that allow the expected number of change points to increase linearly with , killick2012optimal proved that the expected computational cost for PELT is bounded by for some constant . In the worst case, where no pruning occurs, the computational cost of PELT is the same as vanilla dynamic programming.
Sequential gradient descent. For large-scale data, the computational cost of PELT can still be prohibitive due to the burden of repeatedly solving the optimization problem (7). For many statistical models, the time complexity for obtaining is linear in the number of observations . Therefore, in the worst-case scenario, the overall time complexity can be as high as . To alleviate the problem, zhang2023sequential recently proposed a fast algorithm by sequentially updating the cost function using a gradient-type method to reduce the computational cost while maintaining a similar estimation accuracy. Instead of repeatedly solving the optimization problem to obtain the cost value for each data segment, zhang2023sequential’s approach updates the cost value using the parameter estimates from the previous intervals.
For completeness, we derive the sequential gradient descent (SeGD) algorithm here based on a heuristic argument. For , suppose we have calculated an approximate minimizer for
We want to find the cost value for the next data segment ,
| (8) |
where and Assume that is twice differentiable in for any given . As is the minimizer of (8), it satisfies the first order condition (FOC) Taking a Taylor expansion around in the FOC, we obtain
where as is an approximate minimizer of , and we drop the term . Rearranging the terms, we get
| (9) |
As the RHS of (9) does not necessarily fall into the parameter space , we suggest a projection step. Specifically, let denote the projection of any onto . The above observation motivates us to consider the following update
| (10) |
where is a preconditioning matrix that serves as a surrogate for the second-order information . When the second-order information is available, we suggest updating the preconditioning matrix through the iteration
Alternatively, using the idea of Fisher scoring, one can also update the preconditioning matrix through
where with being a subvector of such as the covariates in the regression setting. Finally, we approximate by and the cost value by
In the above derivation, a single pass of each data point is performed during the update of the cost value, leading to low data utilization and inaccurate approximation when the length of the data segment is short. It is natural to pass the data multiple times to increase the data utilization and the approximation accuracy at the cost of higher time complexity. Algorithm 1 summarizes the details of the algorithm with multiple passes/epochs. Specifically, we will use each data point times in updating the parameter estimates for a particular segment. Here, the superscript denotes the corresponding value in the -th epoch at time step , and the superscript represents the corresponding value after the -th pass. We can also allow an adaptive number of multiple passes for data segments with different lengths; see Section LABEL:subsec:advanced_usage_adaptive_number_of_epochs for the details.
2.1 Penalty term
In this section, we discuss a few well-adopted choices of penalty functions in the literature. To be clear, we will focus on the case where with being the negative log-likelihood function of . Recall that we aim to solve the following penalized optimization problem
where we simultaneously optimize over the number of change points , the locations of the change points , and the parameters within each segment. With change points that divide the data sequence into segments, the total number of parameters is equal to , where counts the number of parameters from the segments. The traditional BIC criterion sets or equivalently (to up an additive constant term)
| (11) |
zhang2007modified derived a modified BIC criterion (mBIC) for selecting the number of change points in a Gaussian location model with piece-wise constant mean values. In a similar spirit, we can extend the mBIC to general likelihood models.
Definition 1 (Modified BIC)
Given the number of change points and the change point locations , the mBIC is defined as
| (12) |
In Appendix LABEL:sec:mbic_for_mean_change_with_fixed_variance, we provide a heuristic derivation for the mBIC and show that it coincides with the mBIC proposed in zhang2007modified for the Gaussian location model considered therein.
Remark 1
Suppose the dimension of the parameter in the th segment is , which is allowed to vary over segments. In this case, the mBIC can be defined in the same way with the term being replaced by .
Another commonly used criterion for selecting the number of change points is the so-called minimum description length (MDL), which selects the best model with the shortest description of the data, see, e.g., davis2006structural. In the current context, the MDL can be defined in the following way.
Definition 2 (MDL)
Given the number of change points and the change point locations , the MDL is defined as
Suppose and are bounded (i.e., they do not grow with ). Ignoring the smaller order terms, the MDL is approximately equal to
Dynamic programming and its variants introduced in the previous section can still be used to solve the optimization problems associated with mBIC and MDL. More precisely, we define the adjusted cost functions and the penalty coefficients as
| mBIC: | |||||
| MDL: |
for the data segment , where . To implement dynamic programming, one only has to replace the original cost function and the penalty coefficient with either and (for mBIC) or and (for MDL). Suppose satisfies (4). In the case of mBIC, setting , we have
where we have used the fact that . Thus, we consider the following update:
where .
Tabel 2 summarizes the three penalty criteria with the cost function being a negative log-likelihood function, where the “cost adjustment” is defined as and for mBIC and MDL, respectively. Note that , leading to a negative adjustment term in both mBIC and MDL. All three criteria are implemented in the \pkgfastcpd package.
| Penalty | Cost Adjustment | Pruning Adjustment | |
| BIC | 0 | 0 | |
| mBIC | |||
| MDL |
3 Main function
fastcpd provides a versatile framework applicable to a broad spectrum of data types and modeling scenarios. Specifically, it offers the built-in functionality to perform change point analysis in several scenarios, including detecting changes in the (multivariate) mean and/or variance, linear regression, penalized linear regression, logistic regression, Poisson regression, ARIMA, GARCH, and VAR models. Each model has their corresponding function, as illustrated in the following sections. Table 3 summarizes all the families users can use.
| Model | Family | Description |
| Mean change Variance change Mean and variance change | \codemean \codevariance \codemv/meanvariance | \codeformula = . - 1 |
| These families are applicable to multivariate data. | ||
| Linear regression Logistic regression Poisson regression LASSO | \codelm \codebinomial \codepoisson \codelasso | \codeformula = y . - 1 |
| These families require a labeled data set where the first column corresponds to the response variable, and the rest are covariates. \code"binomial" family accepts while \code"poisson" family requires . | ||
| AR() ARMA(, ) ARIMA(, , ) GARCH(, ) VAR() | \codear \codearma \codearima \codegarch \codevar | \codeformula = . - 1 |
| These families are for time series data. The format of the input data can be a vector or a matrix for AR, ARIMA and GARCH families and a matrix (with columns corresponding to different time series) for the VAR family. | ||
| Custom model | \codecustom | \code cost must be specified to use a custom cost function. \codecost_gradient and \codecost_hessian are required to implement SeGD. |
fastcpd() is the main function of the \pkgfastcpd package. The parameter list and explanations for each of the parameters are given below.
fastcpd(formula = y . - 1, data, beta = "MBIC", cost_adjustment = "MBIC", family = NULL, cost = NULL, cost_gradient = NULL, cost_hessian = NULL, line_search = c(1), lower = rep(-Inf, p), upper = rep(Inf, p), pruning_coef = 0, segment_count = 10, trim = 0.02, momentum_coef = 0, multiple_epochs = function(x) 0, epsilon = 1e-10, order = c(0, 0, 0), p = ncol(data) - 1, cp_only = FALSE, vanilla_percentage = 0, warm_start = FALSE, …)
Not all the parameters can co-exist, and some parameters are used for a specific family, which will be discussed in detail in the corresponding sections below. Descriptions of a selective list of crucial parameters are provided here with their suggested default values.
-
•
\code
formula: A formula object specifying the model to be fitted. The (optional) response variable should be on the LHS of the formula, while the covariates should be on the RHS. The naming of variables used in the formula should be consistent with the column names in the data frame provided in \codedata. The intercept term should be removed from the formula. The response variable is not needed for mean/variance change models and time series models. By default, an intercept column will be added to the data, similar to the \codelm function in \proglangR. Thus, it is suggested that users should remove the intercept term by appending \code- 1 to the formula. Note that the \codefastcpd.family() functions do not require a formula input.
-
•
\code
data: A data frame of dimension containing the data to be segmented (where each row denotes a data point for ) is required in the main function, while a matrix or a vector input is also accepted in the \codefastcpd.family() functions.
-
•
\code
beta: Penalty criterion for the number of change points. This parameter takes a string value of \code"BIC", \code"MBIC", \code"MDL" or a numeric value. If a numeric value is provided, the value will be used as in Algorithm 1. By default, the mBIC criterion is used, where . This parameter usage should be paired with \codecost_adjustment described below. Discussions about the penalty criterion can be found in Section 2.1.
-
•
\code
cost_adjustment: Cost adjustment criterion. It can be \code"BIC", \code"MBIC", \code"MDL" or \codeNULL. By default, the cost adjustment criterion is set to be \code"MBIC". The \code"MBIC" and \code"MDL" criteria modify the cost function by adding a negative adjustment term to the cost function. \code"BIC" or \codeNULL does not modify the cost function. Details can in found in Section 2.1.
-
•
\code
family: Family class of the change point model. It can be \code"mean" for mean change, \code"variance" for variance change, \code"meanvariance" or \code"mv", for mean and/or variance change, \code"lm" for linear regression, \code"binomial" for logistic regression, \code"poisson" for Poisson regression, \code"lasso" for penalized linear regression, \code"ar" for AR() models, \code"ma" for MA() models, \code"arma" for ARMA(, ) models, \code"arima" for ARIMA(, , ) models, \code"garch" for GARCH(, ) models, \code"var" for VAR() models and \code"custom" for user-specified custom models. Omitting this parameter is the same as specifying the parameter to be \code"custom" or \codeNULL, in which case, users must specify the custom cost function.
-
•
\code
cost: Cost function to be used. \codecost, \codecost_gradient, and \codecost_hessian should not be specified at the same time with \codefamily as built-in families have cost functions implemented in C++ to provide better performance. If not specified, the default is the negative log-likelihood for the corresponding family. Custom cost functions can be provided in the following two formats:
-
–
\code
cost = function(data) {…}
-
–
\code
cost = function(data, theta) {…}
Users can specify a loss function using the second format that will be used to calculate the cost value as in (8). In both formats, the input data is a subset of the original data frame in the form of a matrix (a matrix with a single column in the case of a univariate data set). In the first format, the specified cost function directly calculates the cost value. \codefastcpd() performs the vanilla PELT algorithm, and \codecost_gradient and \codecost_hessian should not be provided since no parameter updating is necessary for vanilla PELT. In the second format, the loss function is provided, which has to be optimized over the parameter to obtain the cost value. A detailed discussion about the custom cost function usage can be found in Section LABEL:sec:custom_cost_function.
-
–
-
•
\code
cost_gradient: Gradient of the custom cost function. Example usage: {Code} cost_gradient = function(data, theta) … return(gradient) The gradient function takes two inputs, the first being a matrix representing a segment of the data, similar to the format used in the \codecost function, and the second being the parameter that needs to be optimized. The gradient function returns the value of the gradient of the loss function, i.e., .
-
•
\code
cost_hessian: Hessian of the custom loss function. The Hessian function takes two inputs, the first being a matrix representing a segment of the data, similar to the format used in the \codecost function, and the second being the parameter that needs to be optimized. The gradient function returns the Hessian of the loss function, i.e., .
-
•
\code
line_search: If a vector of numeric values is provided, a line search will be performed to find the optimal step size for each update. Detailed usage of \codeline_search can be found in Section LABEL:subsec:advanced_usage_line_search.
-
•
\code
lower: Lower bound for the parameters. Used to specify the domain of the parameters after each gradient descent step. If not specified, the lower bound is set to be \code-Inf for all parameters. \codelower is especially useful when the estimated parameters take only positive values, such as the noise variance.
-
•
\code
upper: Upper bound for the parameters. Used to specify the domain of the parameters after each gradient descent step. If not specified, the upper bound is set to be \codeInf for all parameters.
-
•
\code
pruning_coef: Pruning coefficient used in the pruning step of the PELT algorithm in Eq (6) with the default value 0. If \codecost_adjustment is specified as \code"MBIC", an adjustment term will be added to the pruning coefficient. If \codecost_adjustment is specified as \code"MDL", an adjustment term will be added to the pruning coefficient. Detailed discussion about the pruning coefficient can be found in Section 2.1.
-
•
\code
segment_count: An initial guess of the number of segments. If not specified, the initial guess of the number of segments is 10. The initial guess affects the initial estimates of the parameters in SeGD.
-
•
\code
multiple_epochs: A function can be specified such that an adaptive number of multiple epochs can be utilized to improve the algorithm’s performance. \codemultiple_epochs is a function of the length of the data segment. The function returns an integer indicating how many epochs should be performed apart from the default update (see Algorithm 1). By default, the function returns zero, meaning no multiple epochs will be used to update the parameters. Example usage: {Code} multiple_epochs = function(segment_length) if (segment_length < 100) 1 else 0 This function will let SeGD perform parameter updates with an additional epoch for each segment with a length less than 100 and no additional epoch for segments with lengths greater or equal to 100.
-
•
\code
vanilla_percentage: The parameter is between zero and one. For each segment, when its length is no more than , the cost value will be computed by performing an exact minimization of the loss function over the parameter. When its length is greater than , the cost value is approximated through SeGD. Therefore, this parameter induces an algorithm that can be interpreted as an interpolation between dynamic programming with SeGD () and the vanilla PELT (). The readers are referred to Section LABEL:subsec:advanced_usage_vanilla_pelt for more details.
-
•
\code
warm_start: If \codeTRUE, the algorithm will use the estimated parameters from the previous segment as the initial value for the current segment. This parameter is only used for the \code"glm" families.
-
•
\code
…: Other parameters for specific models. One use case is \codeinclude.mean, which determines if a mean/intercept term should be included in the ARIMA(, , ) or GARCH(, ) models.
The return value of the main function is a ‘\codefastcpd’ object, which can be used to perform further visualization and downstream analysis. The ‘\codefastcpd’ object contains the following outputs: \codecall, \codedata, \codefamily, \codecp_set, \codecost_values, \coderesiduals, \codethetas, and \codecp_only. In particular,
-
•
\code
cp_set: The set of change point locations.
-
•
\code
cost_values: The cost values for each segment.
-
•
\code
residuals: The residuals of the fitted model with the estimated change points. Only for the built-in families.
-
•
\code
thetas: The estimated parameters for each segment. Only for the built-in families.
Utility functions, including \codeplot(), \codeprint() and \codesummary() are provided as a part of the package, where a ‘\codefastcpd’ object can be passed to these functions to produce a plot of the response values with the change point locations, a simple summary of the model and the estimated change points, or a detailed summary of the model including the estimated change points, the corresponding cost values, and the estimated parameters for each segment.
4 Mean and variance change models
Detecting mean change, variance change, and mean-variance change are fundamental scenarios in change point analysis. The \pkgfastcpd package provides built-in functions that can handle these settings with multivariate data.
We first discuss the multivariate mean change model with a constant but unknown covariance matrix. We illustrate the usage of the package through a simple example here. Consider a data sequence with and three-dimensional observations generated from three different multivariate Gaussian distributions with the mean vectors , and and the covariance matrices , i.e.,
The two change points are located at and . The \codefastcpd.mean() function implements the vanilla PELT for detecting mean change, with the cost being the minimum negative log-likelihood of the multivariate Gaussian model. Specifically, for the data segment , the cost function is given by
where , denotes the determinant of a matrix and is the Rice estimator of
See Section 5.1 for a detailed discussion of the difference-based variance estimation and its extension to linear models with changes in the regression coefficients. {Schunk} {Sinput} R> result <- fastcpd.mean(mean_data) R> summary(result) {Soutput} Call: fastcpd.mean(data = mean_data)
Change points: 300 700
Cost values: 2558.102 3417.845 2551.517
Next, we consider the variance change model, where the mean vector is fixed but unknown. Suppose we have a data sequence with . The cost function here for data segment is given by
We generate a data sequence of length from three-dimensional Gaussian distributions with zero mean and varying covariance matrices. Specifically,
where . Again, the two change points are located at and . The \codefastcpd.variance() function implements the vanilla PELT for detecting variance change, with the cost being the minimum negative log-likelihood of the multivariate Gaussian model. {Schunk} {Sinput} R> result <- fastcpd.variance(variance_data) R> summary(result) {Soutput} Call: fastcpd.variance(data = variance_data)
Change points: 300 700
Cost values: 753.6359 1706.144 1280.607 Finally, we consider a model where both the mean vector and the covariance matrix are allowed to change over time. The cost function for the data segment in this case is defined as
We generate a data sequence of length from four-dimensional Gaussian distributions with time-varying mean and covariance matrix:
The change points are located at , , , , and , where each change point is associated with a specific type of structural break, namely, mean change, variance change, and mean-variance change. The \codefastcpd.meanvariance() function implements the vanilla PELT for detecting mean-variance change, with the cost value being the minimum negative log-likelihood of the multivariate Gaussian model. {Schunk} {Sinput} R> meanvariance_result <- fastcpd.meanvariance(mean_variance_data) R> summary(meanvariance_result) {Soutput} Call: fastcpd.meanvariance(data = mean_variance_data)
Change points: 300 700 1000 1300 1700
Cost values: 1714.968 2299.119 4500.027 1654.917 2259.023 4444.359 The \codefastcpd.meanvariance() correctly identifies all the change point locations. To detect those change points associated with only variance change, one can use \codefastcpd.variance(), which successfully detect the variance change at , and . {Schunk} {Sinput} R> variance_result <- fastcpd.variance(mean_variance_data) R> summary(variance_result) {Soutput} Call: fastcpd.variance(data = mean_variance_data)
Change points: 700 1000 1700
Cost values: 5645.66 4607.095 5546.242 4525.403
5 Linear models
Linear models are of fundamental importance in statistical analysis. In this section, we show how to use the \pkgfastcpd package to detect changes in the coefficients of linear regression models. Specifically, we focus on the model
| (13) |
where and the regression coefficients s are assumed to be piece-wise constant over time , i.e., there exists a set of change points such that
Denote by the observation at time . Under the Gaussian assumption on the errors, we define the cost function for the segment to be the minimum value of the negative log-likelihood
where is the least square estimator and is the Rice estimator of the error variance; see more details in the next subsection.
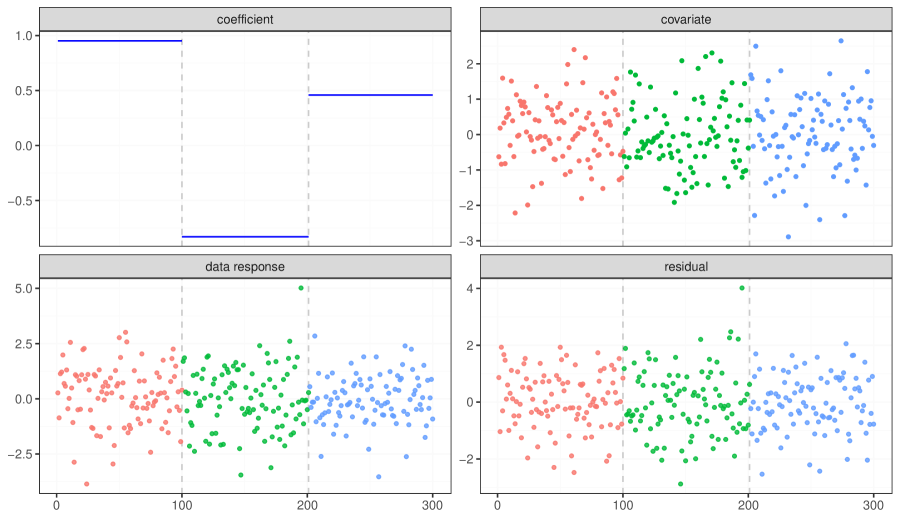
The \codefastcpd.lm() function is specifically designed for change point analysis in the above linear models. We illustrate its usage through a simple numerical example. We generate observations from model (13) with (i.e., ), and The change points are at and , and for the three segments respectively. The following code shows how to use the \codefastcpd.lm() function to detect structural breaks in the regression coefficients. {Schunk} {Sinput} R> result <- fastcpd.lm(cbind(y, x)) R> summary(result) {Soutput} Call: fastcpd.lm(data = cbind(y, x))
Change points: 100 201
Cost values: 48.16996 66.1816 45.66268
Parameters: segment 1 segment 2 segment 3 1 0.9520606 -0.8307605 0.4593161 The \codesummary() function applied to a ‘\codefastcpd’ object returns the estimated change points, the estimated parameters for each segment, and the corresponding cost values. The \codeplot() function applied to a ‘\codefastcpd’ object produces a set of plots of the estimated coefficients, responses, residuals, and covariates, together with the estimated change point locations (marked with vertical grey lines). The estimated change point locations divide the data into three segments. The residual plot is based on the linear regression models fitted on each segment. It is a diagnostic tool for checking the goodness of fit of the linear regression model with piecewise constant regression coefficients (a homogeneous residual plot suggests a good fit of the model to the data). When , only the response values and residuals are plotted.
R> plot(result)
5.1 Variance estimation
In both the mean change models with constant variance and the linear models with changing coefficients but constant variance, the unknown variance must be estimated to compute the cost value. Classical variance estimators are no longer reliable in the presence of change points. In the nonparametric regression literature, there have been several proposals for difference-based variance estimation (rice1984bandwidth; gasser1986residual; muller1987estimation; hall1990asymptotically; dai2014variance), which are robust to potential structural break in the conditional mean function. As a simple illustration, consider the model
where s have zero mean and common variance rice1984bandwidth proposed the first-order difference-based variance estimator
| (14) |
which has been shown to be consistent under change point models (muller1999discontinuous).
We extend the Rice estimator to the linear regression setup by considering the consecutive difference between two least squares estimators based on a sliding window containing data points. In particular, we define
where is the window size such that Define
for , where and
We propose the following generalized Rice estimator
Remark 2
We remark that the idea can be directly extended to multivariate multiple linear models, where the response is multi-dimensional.
To illustrate the performance of this variance estimator, let us consider model (13) with
| (15) |
for and . The true change points are located at and . True ’s for the three segments are defined respectively as
With , the estimated variance is 103.0231, which is relatively close to the truth. {Schunk} {Sinput} R> (variance_estimator <- variance.lm(cbind(y, x))) {Soutput} [1] 103.0231 We remark that this variance estimation method has been implemented in \codefastcpd() for linear models and \codefastcpd.lm() as a default.
5.2 High-dimensional linear regression
In this section, we illustrate how our package is useful in detecting change points in high-dimensional linear regression. More precisely, we consider the following model
| (16) |
where is mean zero with variance , and the regression coefficients ’s are assumed to be piece-wise constant over time . We assume that is sparse and can be large as compared to . The cost function for the data segment is defined as
where and with being an estimate of the noise level. The constant in the pruning condition (4) can be specified as
where we have used the fact that for all integers . In this case, we shall update the parameters using the sequential proximal gradient descent introduced in Section 3.3 of zhang2023sequential.
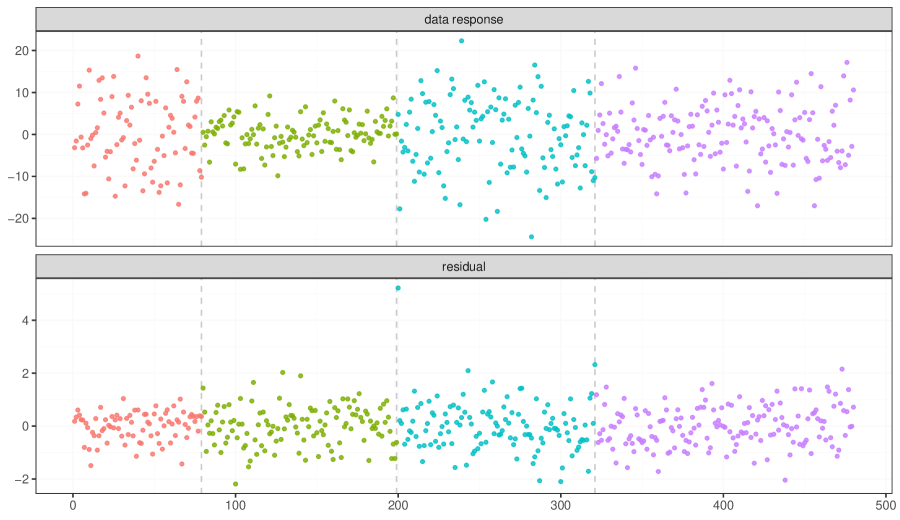
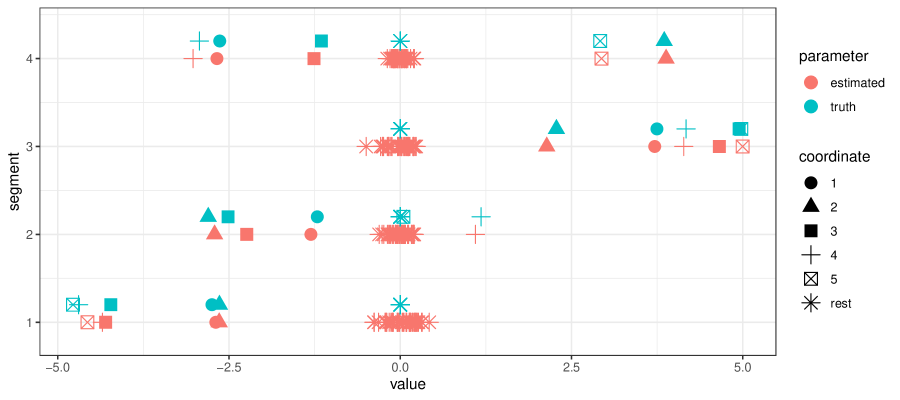
As an illustration, we generate data from model (16) with and for and The regression coefficient is piece-wise constant with the change points located at , , and . Within each segment, the first five components of are nonzero, and the remaining components are zero across all segments. The following code illustrates the use of the \codefastcpd.lasso() function. {Schunk} {Sinput} R> result <- fastcpd.lasso(cbind(y, x)) R> result@cp_set {Soutput} [1] 79 199 321 The \codeplot() function (applied to the ‘\codefastcpd’ object) returns the plots of the responses and residuals together with the estimated change point locations marked with vertical grey lines in Figure 2. The residual plot suggests that the sparse linear model with the estimated change point locations provides a good fit to the data. Figure 3 shows the estimated coefficients for each segment and the true coefficients with each coordinate marked with different shapes.
R> plot(result)
6 Generalized linear regression models
In generalized linear models (GLM), the response variable is assumed to follow a distribution from the canonical exponential family
where is the canonical parameter, is the dispersion parameter and is some known weight. The mean of can be obtained through a known link function , i.e.,
where the regression coefficients s are assumed to be piece-wise constant over time . Denote by for When is known, the cost function is given by
When is unknown and can be estimated by from the data, we can define the cost function in the same way with replaced by . In the case where is unknown and allowed to vary over time, we define
6.1 Logistic regression
Consider the following logistic regression model:
Set , , and the true change point location at 300. The code below demonstrates how the \codefastcpd.binomial() function can be utilized to detect change points in this scenario. {Schunk} {Sinput} R> result <- fastcpd.binomial(cbind(y, x)) R> summary(result) {Soutput} Call: fastcpd.binomial(data = cbind(y, x))
Change points: 302
Cost values: 124.4554 54.26381
Parameters: segment 1 segment 2 1 -0.9260182 2.1294962 2 -1.6033835 2.7583247 3 1.0343338 2.3818010 4 0.3653870 0.7261152
6.2 Poisson regression
Consider the following Poisson regression model:
We set , , and the true change point locations at , and with the coefficients for each segment defined as
where and is a fixed random vector with each element () obtained from standard normal distribution. The \codefastcpd.poisson() function can be used to detect change points in the coefficients of Poisson regression. Note that we set \codeepsilon to be to ensure that the Hessian matrix is invertible in the updates in SeGD. {Schunk} {Sinput} R> result <- fastcpd.poisson(cbind(y, x), epsilon = 1e-5) R> summary(result) {Soutput} Call: fastcpd.poisson(data = cbind(y, x), epsilon = 1e-05)
Change points: 498 805 1003
Cost values: 230.0866 190.1381 82.77324 38.45199
Parameters: segment 1 segment 2 segment 3 segment 4 1 1.020002 0.6391880 1.0424108 1.4451928 2 0.275458 -0.2585056 0.2620085 0.9910079 3 -1.048875 -0.5768481 -0.9632918 -1.4354638
7 Time series models
Change point analysis is often concerned with data collected sequentially over time. It is, therefore, crucial to take into account the temporal dependence among the observations. In the subsequent sections, we shall discuss the usage of the \pkgfastcpd package for detecting change points in several stylized time series models, including AR, ARMA, GARCH, and VAR models.
7.1 AR() models
We begin with the autoregressive models of order (or the AR() model) defined as
where are the (autoregressive) coefficients and is a white noise with variance . As the AR() model is an obvious extension of the linear regression models, we can borrow the techniques introduced in Section 5 for linear models. Specifically, we define and consider the cost function over the segment defined as
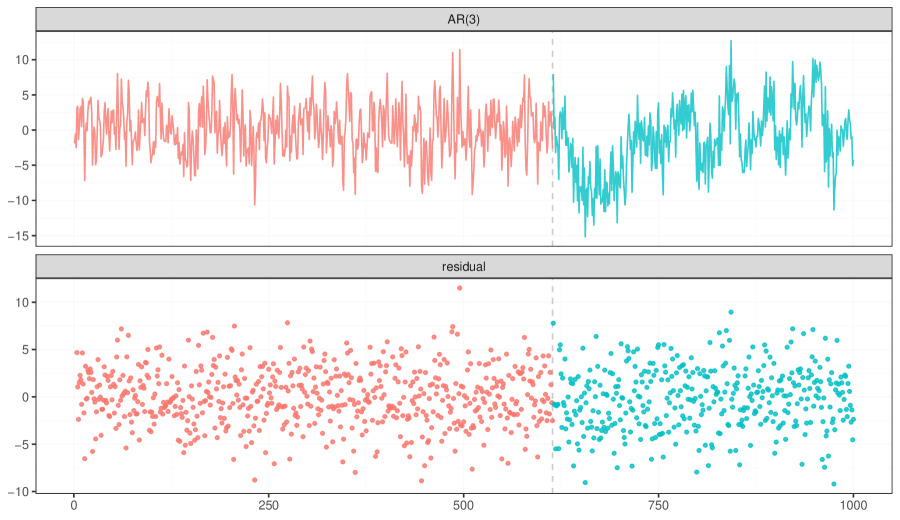
where and is the generalized Rice estimator developed in Section 5.1. The \codefastcpd.ar() function implements this method. To illustrate its usage, we consider an AR(3) model defined as
where . In this example, the \codefastcpd.ar() function detects a structural break at . The \codesummary() function returns the estimated parameters for each segment as well as the corresponding cost values. {Schunk} {Sinput} R> result <- fastcpd.ar(ar3_data, order = 3) R> summary(result) {Soutput} Call: fastcpd.ar(data = ar3_data, order = 3)
Change points: 614
Cost values: 2743.759 2028.588
Parameters: segment 1 segment 2 1 0.57120256 0.2371809 2 -0.20985108 0.4031244 3 0.08221978 0.2290323
R> plot(result)
7.2 ARMA(, ) models
The ARMA (Autoregressive Moving Average) model is a classical statistical model used in time series analysis, which generalizes and combines the AR model and the Moving Average (MA) model. A time series is an ARMA process if it is stationary and
| (17) |
where and are the AR and MA coefficients respectively and is a white noise sequence with variance .
Here we consider a time-varying ARMA model where , and can change over time, i.e.,
where , and is a white noise sequence with variance .
Coefficient changes. Suppose we have a data sequence generated from the ARMA model with time-varying AR and MA coefficients and fixed but unknown. Assume the ARMA model is invertible, and we can represent the ARMA model with an AR() model. (shumway2000time). Here, we adapt the Rice estimator in Section 5.1 to estimate :
-
1.
We approximate the time-varying ARMA(, ) model by a time-varying AR() model with , where the order is chosen using AIC or BIC described below.
-
2.
We estimate by the generalized Rice estimator developed in Section 5.1 with the linear model defined as
where , and is assumed to be piece-wise constant.
The order for the AR model (used to approximate the ARMA model) can be obtained by minimizing the AIC or BIC (hannan1984method) defined as:
We define the cost function for the data segment utilizing obtained through the above procedure as follows:
Coefficient and variance changes. The \codefastcpd.arma() function implements the vanilla PELT when \codevanilla_percentage333See Section LABEL:subsec:advanced_usage_vanilla_pelt for more discussions about this parameter. is set to be 1, where the cost value is defined as the negative log-likelihood which can be computed using \codeforecast::Arima() (forecastrpackage; forecastrpaper). To speed up the calculation, the \codefastcpd.arma() function also implements the SeGD when \codevanilla_percentage < 1 with the following cost function. Specifically, assuming and , we define the cost value for the data segment as
where can be obtained recursively. The cost function defined above is closely related to the conditional likelihood and is preferred over the exact likelihood due to its simpler form, which improves computational efficiency. The explicit forms of the corresponding gradient and Hessian can be found in Appendix LABEL:sec:gradient_and_hessian_of_qmle_for_arma(p,_q)_model.
We now illustrate the use of the \codefastcpd.arma() function using SeGD with the above cost function. Consider the following data-generating process
where for . We project the updated parameters in each step onto the following domains when performing SeGD for better convergence (see (10) for the projection step in SeGD) by specifying the \codelower and \codeupper parameters in the function:
An additional line search is performed at each updating step to find the optimal step size by specifying the \codeline_search parameter (see Section LABEL:subsec:advanced_usage_line_search for detailed instructions on how to use line search). {Schunk} {Sinput} R> result <- fastcpd.arma( + data = arma32_data, + order = c(3, 2), + segment_count = 3, + lower = c(-1, -1, -1, -1, -1, 1e-10), + upper = c(1, 1, 1, 1, 1, Inf), + line_search = c(1, 0.1, 1e-2) + ) R> summary(result)