Reconstructing rotation curves with artificial neural networks
Abstract
Galactic rotation curves have been served as indispensable tools for determining the distribution of mass within galaxies. Despite several advances in precision observations, some discrepancies still persist between the inferred matter distribution from luminosity and observed rotation velocities, often attributed to the presence of dark matter. Traditional parametric models, while insightful, struggle with the complexity of galaxies with prominent bulges or non-circular motions, but in contrast, non-parametric methods offer a promising alternative, adapting to the intricate nature of rotation curves without any prior assumptions. In this work, we employ artificial neural networks to reconstruct rotation curves of 17 spiral galaxies from high-quality data, demonstrating the efficacy of the non-parametric approaches in characterizing galactic dynamics. Our findings underscore the importance of employing diverse methodological approaches to comprehensively understand galactic dynamics in modern astrophysics research. Moreover, the non-parametric reconstruction approach with neural networks presents a promising avenue for further investigations, capable of generating interpolations based on the intrinsic patterns of the data.
I Introduction
Since the pioneered galactic rotation curves (RCs) measurements Slipher (1914), and particularly after the first precision observations Rubin and Ford (1970), they have been an indispensable tool for determining the distribution of mass in galaxies. Although rotation curves of different types of galaxies exhibit their own distinct features, they also share several common characteristics Karukes and Salucci (2017); notably, in most RCs the matter distribution inferred from luminosity shows a discrepancy with the derived from the observed rotation velocities. An explanation for this inconsistency is that galaxies are embedded in extended dark matter (DM) halos, whose gravitational influence is appreciated in the rotation velocities, not in the luminosity.
Galaxies can be classified into Low-Surface-Brightness (LSB) or High-Surface-Brightness (HSB) types based on their surface brightness, irrespective of morphology, this classification has implications for their associated RCs. LSB galaxies are more gas-rich than HSB galaxies, but they exhibit lower surface brightness due to their very low star formation rates; they are DM-dominated at all radii, including their centers de Blok and McGaugh (1997); Pahwa and Saha (2018). On the other hand, in addition to the gas component, for HSB galaxies the stellar component may be significant, especially in the inner parts. Therefore, the DM halo parameters are sensitive to the assumed stellar mass-to-light ratio, Sellwood and Moore (1999), which converts luminous to gravitational mass.
Measuring RCs in LSB and HSB galaxies presents distinct challenges and considerations. For example, LSB galaxies require specialized techniques and longer exposure times for detection, particularly, in their faint outer regions. Higher spatial resolution is crucial to studying the fine details of LSB galaxies (de Blok and Bosma, 2002). In contrast, HSB galaxies are generally easier to detect, and lower spatial resolution suffices for central studies. RCs in HSB galaxies may show a more rapid increase in rotational velocities towards the center, indicative of higher mass concentration.
The inherent complexity of galactic dynamics, whether LSB or HSB, coupled with the limitations of observational methods, present challenges in obtaining precise and detailed RCs data. Even with perfect observations, it is challenging to obtain enough information to construct a comprehensive theoretical model that fully describes the mass distribution within these objects. As a response to these challenges, there is a growing use of statistical and machine learning methods, which provide additional tools in the astrophysical data analysis Fernández-Hernández et al. (2019); Yi et al. (2022); Thuruthipilly et al. (2024); Tanoglidis et al. (2021); Cortés et al. (2024). In particular, machine learning methods have already been used in RCs data for curve fitting Argüelles and Collazo (2023), for light profile extraction Stone et al. (2021) and to model the DM contribution and density profile Pato and Iocco (2015).
In Reference Fernández-Hernández et al. (2019), the authors show an interesting approach to modeling rotation curves using a non-parametric reconstruction based on the Locally Weighted Scatterplot Smoothing (LOESS) and simulation and Extrapolation (SIMEX) regression methods. Non-parametric methods allow information to be extracted directly from the data without assuming any astrophysical model or parametric approximation beforehand. Instead, under minimal assumptions, non-parametric reconstructions aim to recreate an unknown quantity based solely on the available data for that observable. Various non-parametric techniques are employed for model-independent modeling of astrophysical or cosmological functions directly from the data using a variety of methods such as Principal Component AnalysisSharma et al. (2020), Gaussian processes Keeley et al. (2021); L’Huillier et al. (2020); Escamilla et al. (2023), and recently, artificial neural networks Wang et al. (2020); Gómez-Vargas et al. (2023a).
In this paper, we use a non-parametric reconstruction to model the rotational velocities of galaxies using artificial neural networks based on Refs. Gómez-Vargas et al. (2023a, b). In particular, we use a type of neural network called a feed-forward neural network, with a Bayesian approach to consider the uncertainty of the method, to learn a mapping between the observed velocities and the underlying matter distribution. Our method has several advantages over traditional parametric and non-parametric techniques, including the ability to handle complex, non-linear, and irregular velocity data without theoretical or statistical assumptions about the data.
We apply our reconstruction method to 17 observed rotation curves of spiral galaxies from the high-quality data of The HI Nearby Galaxy Survey (THINGS)Walter et al. (1985); de Blok et al. (2008). For a historical context, we recommend the Ref. Sofue and Rubin (2001). These galaxies are mostly spiral HSB galaxies whose mass profile can be described by an empirical DM density profile Einasto (1965); Navarro et al. (1996); Burkert (1995); Begeman et al. (1991); Salucci et al. (2007); Mastache et al. (2013); Navarro-Boullosa et al. (2023), plus a stellar distribution and a gas component.
The mass models for these galaxies have been constructed by combining their HI RCs with information about the gas and stellar distribution within them, the latter obtained from m data from the Spitzer Infrared Nearby Galaxies Survey (SINGS) Kennicutt et al. (2003).
Then, the RC associated with the DM halo is obtained and thus can be fitted using a parametric density model.
In this work, we demonstrate the potential of neural reconstruction for RCs and highlight the importance of non-parametric methods for accurately characterizing the distribution of DM in galaxies. This paper is organized as follows. In Sec. II, we present the statistical basics to understand the method we apply in this manuscript. Sec. III describes the sample of galaxies, providing specific details about their distribution profiles. In Sec. IV, we describe the methodology followed in this work to accurately reconstruct the RCs for the data sets employed, whereas in Sec. V, we show the main results of our reconstructions. Also, we compare the performance of our approach to that of traditional parametric models. Finally, in Sec. VI we give some final comments and conclusions.
II Statistical background
Statistical modeling is an indispensable tool to analyze data. There are two main approaches in statistical modeling: parametric and non-parametric. The first one is in which a functional model is assumed for the data beforehand and with statistical inference its parameters are constrained according to the data. The second approach, non-parametric inference techniques, has the goal of inferring an unknown quantity based mainly on the data and with the fewest possible assumptions Wasserman (2006). In this present work, we use Artificial Neural Networks to model data from rotation curves in a non-parametric way.
Artificial Neural Networks (ANNs) are part of the machine learning methods that generate models based on the data. In particular, ANNs have the property to be able to model any nonlinear continuous function Hornik et al. (1990). Their great ability to model complex data allows to use them to model the rotation of galaxy curves, offering the benefit of circumventing any astrophysical or statistical assumptions during the model generation.
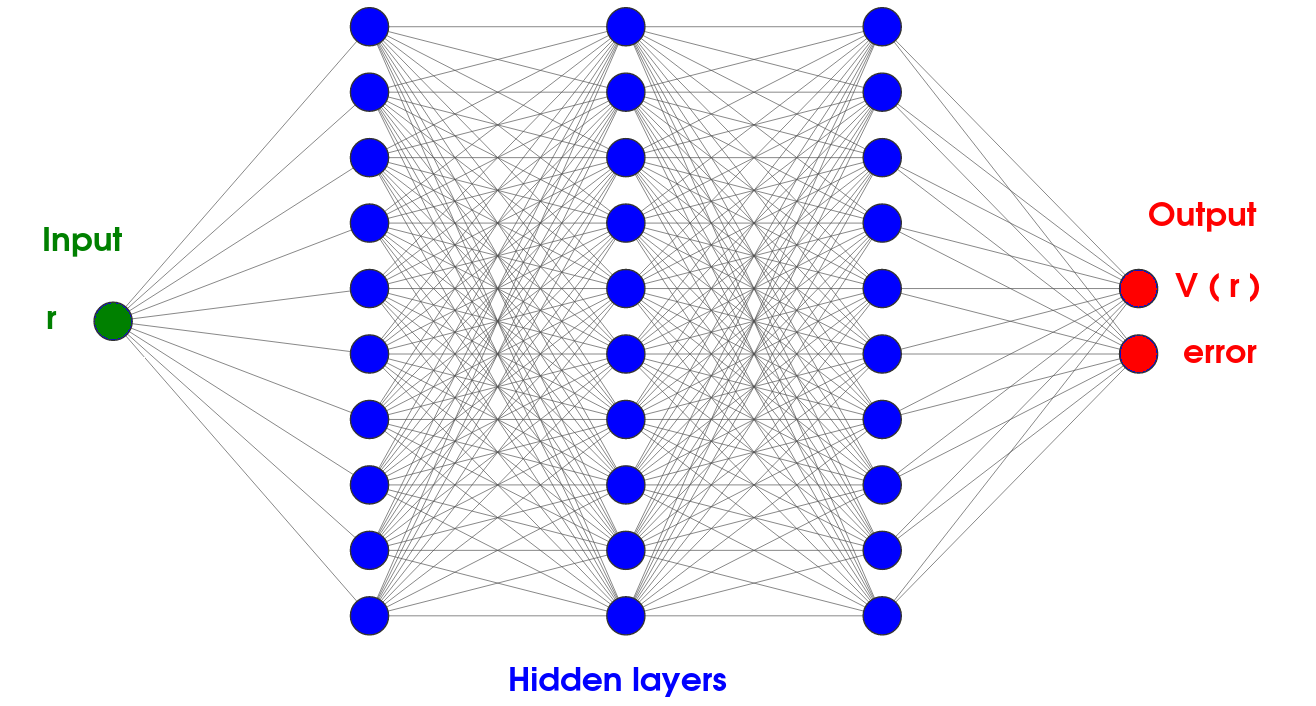
Artificial neural networks are computational models originally inspired by nature, designed to emulate the behavior of synapses of biological neurons. An artificial neural network is built of interconnected layers of nodes or neurons, which serve as the fundamental processing units for information. The most basic type of ANN is the Multilayer perceptron (MLP), also known as feedforward neural network, which consists of three types of layers: an input layer that receives the initial data, hidden layers that extract patterns and introduce nonlinearity effects, and an output layer that presents the processed result. The connections between neurons have associated numbers known as weights, which are the parameters of the mathematical model; a tiny neural network can have thousands or millions of them.
Because of their exceptional capability to handle large and complex datasets, Artificial Neural Networks are versatile in a wide range of tasks including classification, regression, image and audio processing, and generative modeling, to name a few. This success has led to the start of a new research area known as Deep Learning, which focuses only on studying neural networks. While a complete review of deep learning or neural networks is beyond the scope of this article, we highly recommend References Nielsen (2015); Goodfellow et al. (2016) as excellent sources for further exploration.
The inherent parameters of a neural network are called hyperparameters, contrasting with the trainable weights that are adapted throughout the training process, these hyperparameters require a configuration before the training process and they include factors such as the network’s architecture (e.g., the number of layers and nodes per layer), learning parameters (like the number of epochs, learning rate, and batch size), and parameters related with the regularization or other sectors of the training. While certain hyperparameters are predetermined, others are treated as free parameters subject to adjustment through tuning strategies. There are several ways to find a good combination of hyperparameters, the most popular is with a hyperparameter grid encompassing various values for the hyperparameters, Larochelle et al. (2007), this grid is then systematically evaluated to determine the performance of all combinations and, ultimately, the combination with the most favorable results is identified through a comparative analysis. Alternatively, recent approaches are grounded in mathematical optimization, Bayesian techniques, or metaheuristic algorithms to find an appropriate combination of hyperparameters. For this purpose, in this work, we employ a simple genetic algorithm, with elitism as suggested in Ref. Gómez-Vargas et al. (2023b).
On the other hand, dropout is a fundamental neural network regularisation method that avoids overfitting by randomly deactivating neurons during training. Using a variant known as Monte Carlo dropout (MC-DO), dropout can be used to estimate statistical uncertainties in trained ANN models and have more robust models Gal and Ghahramani (2015); Benatan et al. (2023). In our ANNs models, as suggested in Gómez-Vargas et al. (2023a), we incorporate MC-DO in their predictions.
III Galaxy sample for a parametric description
The observed rotation curves in the THINGS sample we are considering have contributions from three different mass distributions: gas , stars , and a DM halo .
These contributions are taken into account in the calculation of the total RC as follows:
| (1) |
Theoretically, this is a parametric equation with parameters associated with specific models of the stellar mass and the DM model. Given that the main goal of this paper is to compare the fit provided by theoretical models with reconstruction algorithms, for the parametric approach, we shall use the results from Tables 3 and 6 of de Blok et al. (2008). Both models assume a NFW distribution for the dark matter halo, but there is a different assumption regarding . For clarity, in the following subsections, we will outline the assumptions related to each mass component on which the utilized data relies. More specific details about the galaxies can be found in de Blok et al. (2008); Walter et al. (1985).
III.1 Gas distribution
The rotation curve for the neutral gas component has been derived for the THINGS galaxies Walter et al. (1985) using integrated hydrogen (HI) emission maps. The surface density profiles were corrected by a factor of to take into account the contribution of helium and metals. In the analysis, the rotation curve of this component, , is calculated under the assumption of a thin disk distribution.
III.2 Stellar distribution
For this component the stellar mass distribution, , is not directly measured; instead, measurements are based on the surface brightness profile, . In some galaxies within the sample, this component can be further decomposed into a central (bulge, inner) and outer component, each one is considered to reside in a thick disk, whose radial distribution is characterized by an exponential profile Freeman (1970):
| (2) |
where is the characteristic scale of the bulge/outer component and the vertical distribution is taken as . Some uncertainties in this mass component are associated with the determination of . The reference values used in this paper were determined in the band Oh et al. (2008) and assume an initial mass function (IMF) of diet Salpeter Bell and de Jong (2001).
In this manuscript, the parametric models with which we compare assume, , first as a fixed constant, and in a second model as a free parameter, introducing and then fixed along with the DM parameters.
III.3 Dark matter distribution
To be conservative with the standard cosmological model, the dark matter halo distribution will be assumed to follow the NFW profile Navarro et al. (1996), characterized by the density at the time of the halo collapse, , and by a characteristic scale, :
| (3) |
Commonly, the two free parameters, and are used to define new ones, for example, the radius, , at which the enclosed density is 200 times the critical density. Additionally, a concentration parameter is introduced, and the reference velocity measured at . Consequently, the new set of free parameters for this parametric model becomes and . For the galaxies analyzed in this work these values have been extracted from Tables 3 and 6 of de Blok et al. (2008).
IV Methodology
| Galaxy | # hidden layers | # neurons | batch size |
|---|---|---|---|
| NGC4736 | 4 | 200 | 8 |
| NGC2841 | 3 | 150 | 8 |
| NGC925. | 4 | 200 | 4 |
| NGC2903 | 4 | 150 | 8 |
| DDO154. | 4 | 200 | 4 |
| NGC6946 | 4 | 200 | 8 |
| NGC7793 | 4 | 150 | 4 |
| NGC2976 | 4 | 200 | 4 |
| NGC7331 | 3 | 200 | 4 |
| NGC3198 | 3 | 150 | 4 |
| NGC3621 | 4 | 200 | 4 |
| NGC3521 | 3 | 200 | 4 |
| NGC5055 | 4 | 100 | 4 |
| NGC2366 | 4 | 200 | 8 |
| NGC2403 | 3 | 150 | 8 |
| NGC3031 | 3 | 200 | 4 |
| IC2574. | 3 | 200 | 4 |
We follow the methodology proposed in Gómez-Vargas et al. (2023a) using the hyperparameter optimization method from Gómez-Vargas et al. (2023b). The suggestion from Reference Gómez-Vargas et al. (2023a) is to use an independent observable variable as input of a feedforward neural network, while an observable function of this variable and its statistical observable error as output, in addition to the use of Monte Carlo dropout to have Bayesian behavior in the neural network predictions and have uncertainties for each prediction Gal and Ghahramani (2015); Benatan et al. (2023). In our case, we set the radius as input, and the two outputs are the radial velocity and its statistical error, as shown in Figure 1.
Therefore, we use the observed rotation curve with its error bars as the training set of the neural network. After gaining some intuition about the data through data exploration, and preliminary training of the neural nets, we set the hyperparameter space with the number of hidden layers , number of neurons by layers , and batch size . Next, we use the code nnogada Gómez-Vargas et al. (2023b) with a genetic algorithm that contains elitism from the DEAP library Fortin et al. (2012) and we obtain the best combination for each galaxy. In general, the architectures of the neural networks are similar to Figure 1, varying the number of layers and hidden layers for each case.
In particular, Table 1 shows the architecture used for each galaxy, each one was found using the simple genetic algorithm with elitism included in the DEAP library through the nnogada code. The used algorithm for minimizing the loss function is Adam Kingma and Ba (2014) with a learning rate of 0.0005, using the ReLU activation function for the hidden layers and linear function for the output, we train all the models through 1000 epochs. As in Ref. Gómez-Vargas et al. (2023a), we use the Monte Carlo dropout method Gal and Ghahramani (2015) from the AstroANN library Leung and Bovy (2019); Leung (2024. Accesed on 22/02/2024.) to obtain uncertainties for the neural network predictions, to avoid overfitting and have more robust models. In all our models, we fix the dropout value at 0.3.
After the careful training of neural network models for each galaxy, we perform several predictions for different radius within the range of the original rotation curves data, therefore we obtain a non-parametric reconstruction of the considering the neural network model for their statistical errors and the uncertainty of the neural networks predictions. The results of these reconstructions are discussed in the next section. With the neural reconstructions, and using a metric, we can analyze what model agrees more with the data points; there are several ways to make this comparison, in this work, for simplicity and interpretability we have chosen the mean square error (MSE):
| (4) |
where represents the number of samples, is the actual value of the th sample, and is the predicted value of the th sample. For the interested reader, we have available the notebooks with the plots of the reconstructions and the tuning of hyperparameters in a GitHub repository111https://github.com/igomezv/Reconstructing-RC-with-ANN.
| Galaxy | MSE(fix, data) | MSE(free, data) | MSE(neural, data) | MSE(fix, neural) | MSE(free, neural) |
|---|---|---|---|---|---|
| NGC4736 | 46.66 | 43.68 | 42.66 | 37.19 | 31.55 |
| NGC2841 | 32.43 | 21.50 | 27.68 | 62.65 | 32.32 |
| NGC925 | 66.52 | 34.65 | 25.11 | 72.61 | 48.41 |
| NGC2903 | 10.04 | 6.85 | 17.38 | 11.89 | 13.07 |
| DDO154 | 2.83 | 2.91 | 3.50 | 6.78 | 6.97 |
| NGC6946 | 119.78 | 51.66 | 26.71 | 105.19 | 28.51 |
| NGC7793 | 59.74 | 53.47 | 21.39 | 89.33 | 74.62 |
| NGC2976 | 25.88 | 11.15 | 3.10 | 32.65 | 16.48 |
| NGC7331 | 309.23 | 19.78 | 12.64 | 294.04 | 17.79 |
| NGC3198 | 100.39 | 7.98 | 26.03 | 117.61 | 27.66 |
| NGC3621 | 12.24 | 10.17 | 22.10 | 22.14 | 21.06 |
| NGC3521 | 335.01 | 225.37 | 62.68 | 292.89 | 192.91 |
| NGC5055 | 239.95 | 42.84 | 124.15 | 389.89 | 105.98 |
| NGC2366 | 15.75 | 7.60 | 2.97 | 17.20 | 6.08 |
| NGC2403 | 11.56 | 11.35 | 12.34 | 13.68 | 13.13 |
| NGC3031 | 144.49 | 103.98 | 105.42 | 159.44 | 98.33 |
| IC2574 | 14.59 | 8.55 | 2.47 | 9.48 | 3.57 |
| Means | 91.01 | 39.03 | 31.67 | 102.04 | 43.44 |
V Results
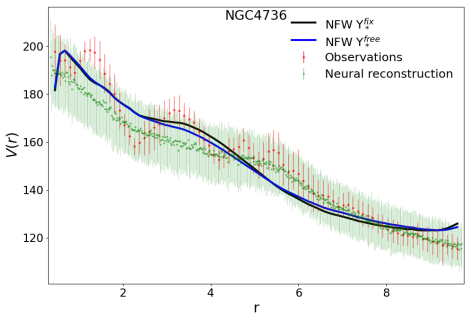
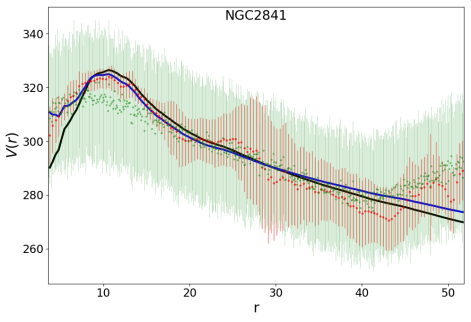
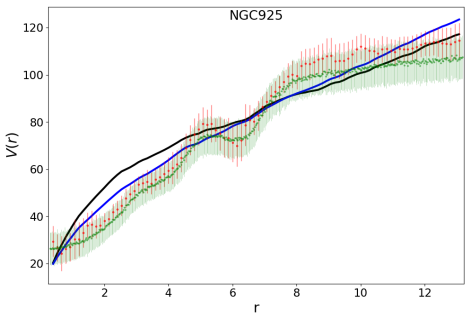
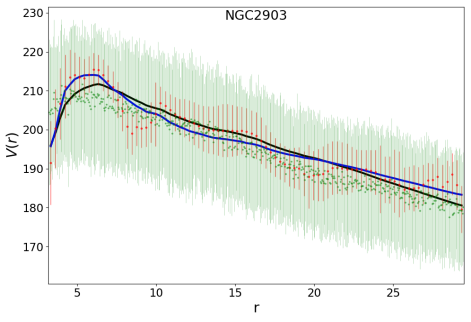
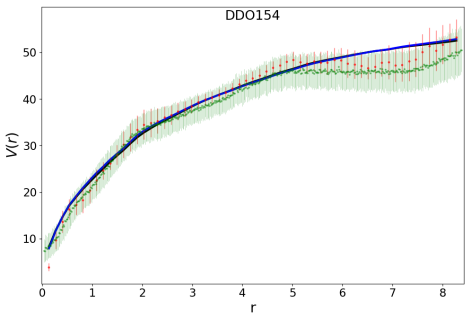
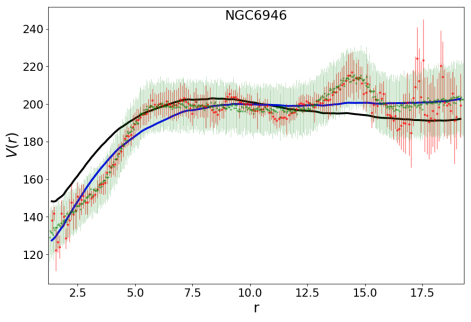
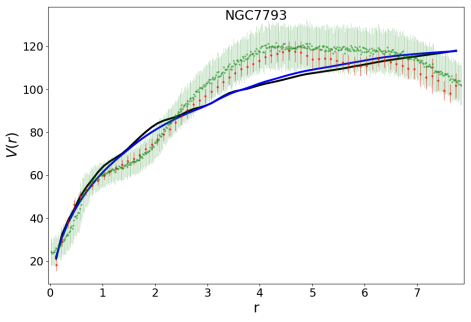
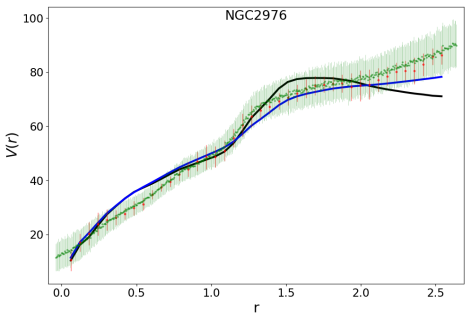
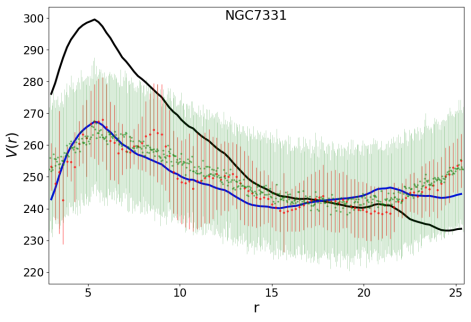
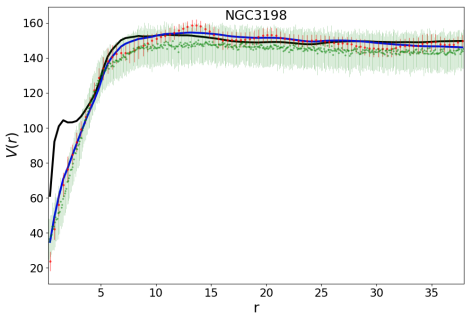
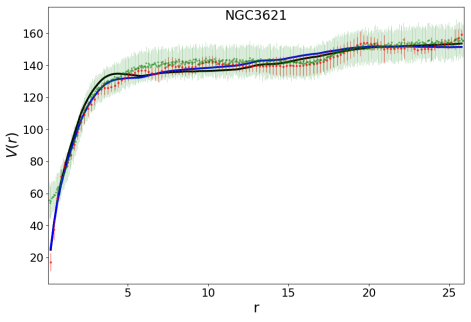
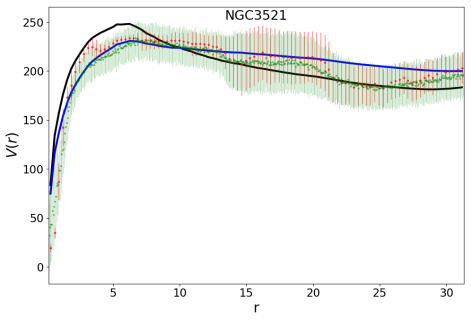
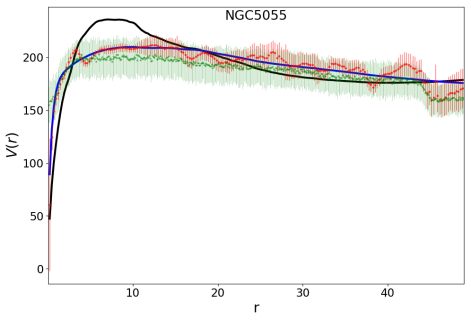
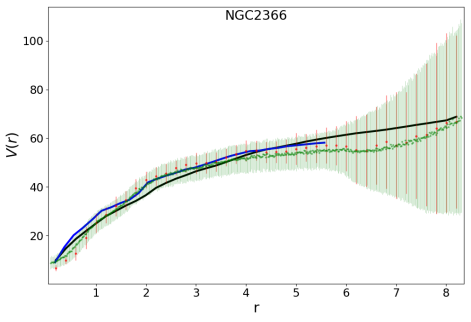
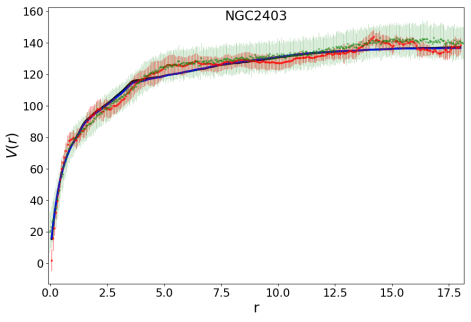
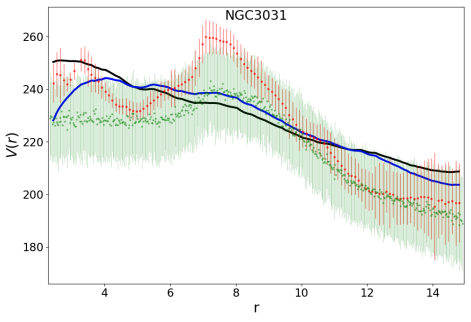
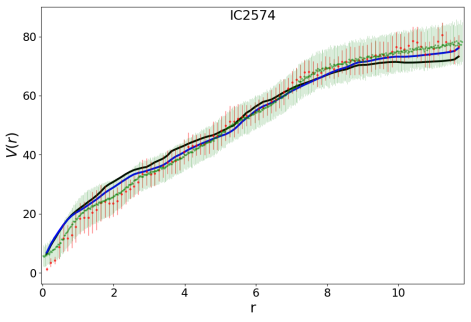
As described above, we performed neural network reconstructions for RCs of 17 different galaxies. Figure 2 contains all the neural reconstructions for each galaxy. The results of the neural reconstruction to the different velocity RCs of the considered sample are depicted in green, along with their associated error bars, which include the neural network prediction to the statistical error plus the uncertainty of the neural network predictions. The red points represent the observational measurements.
For comparison, we include two theoretical models, both considering a NFW dark matter halo, but the assumption regarding the mass-to-light ratio is different. In all the panels of Figure 2, the black lines represent the fitting for as a fixed parameter, whereas the blue lines correspond to as a free parameter. The parameter estimation using these same datasets for both models was performed in Ref. de Blok et al. (2008) to reproduce the total observed rotation curve.
We can see that the observational data points do not follow a smooth pattern. Instead, they show peaks and lows that are difficult to model accurately using parametric profiles. For this reason, it is interesting to generate a model based on the data in which we can propose a different behavior and, perhaps, make more reliable interpolations, or at least complement the predictions of the theoretical models.
Using the mean squared error, we can obtain a systematic comparison, providing insights into the relative performance of each model in capturing the observed data. Table 2 summarizes the MSE values for each model compared to both other models and the observational data. We also consider the comparison between the NFW profiles and the neural network reconstruction, under the assumption that if we believe that a data-driven model can be a sensible choice, then it makes sense to analyze which of the two theoretical models is more in agreement with it.
Concerning the parametric models, we can notice that the MSE indicates that the one with is closer to the data than the one with . This is not conclusive to prefer one model over the other one, particularly because the has an extra parameter and this criterion does not penalize it. However, an exception is noted for the galaxy DDO154, where the opposite happens, although the difference is minimal and can be understood by the fact that the free stellar model predicts a higher contribution of it.
| Group | Galaxies | Criterion |
|---|---|---|
| A | DDO154, NGC2903, NGC3621, NGC2403 | ANNs are worst versus both NFW+ profiles. |
| B | NGC3031, NGC2841, NGC3198, NGC5055 | ANNs are better than and worst than . |
| C | NGC4736, NGC925, NGC6946, NGC7793, NGC2976, NGC7331, NGC3521, NGC2366, IC2574 | ANNs are best versus both NFW+ profiles. |
On the other hand, comparing the parametric NFW+ models with the neural reconstruction, our findings indicate that there are three different groups, summarized in Table 3. Group A comprising galaxies DDO154, NGC2903, NGC3621, and NGC2403, for which the neural reconstruction is farther from the data than both parametric models, whereas in Group B, the MSE of the non–parametric reconstruction falls between the models, specifically, it is greater than the corresponding to but lower than , the galaxies included in this group are NGC3031, NGC2841, NGC3198, and NGC5055. Finally, in Group C, comprising the remaining nine galaxies, the non-parametric reconstruction can describe the data more closely than the parametric models used for comparison, as indicated by the lower mean squared error associated with the reconstruction. This suggests that for these galaxies, fitting the data well with parametric models is more difficult.
To highlight the peculiar characteristics of the previously reported groups, we examined a galaxy from each one of them.
-
•
The galaxy NGC3621, from Group A, exhibits a HI distribution characterized by a regularly rotating disk, with its stellar distribution modeled using a single disk. Both parametric models (considered in this work) and neural reconstruction effectively capture the overall shape of the rotation curve. Nevertheless, discrepancies arise in the innermost parts of the galaxy, where the velocity is predominantly influenced by the stellar component. In this region, the neural reconstruction tends to over-predict the velocity, resulting in a greater deviation from the data compared to the corresponding parametric models.
-
•
From Group B, we select the galaxy NGC5055, for which the parametric models suggest the existence of two exponential disks to accurately describe its stellar luminosity. This assumption exactly holds when is fixed, resulting in two different values: one for the inner region and a second one for the outer region (that actually overestimates the RC in the inner region). However, when considering parametric models with two free parameters, undesirable values are obtained for the outer component, so its value is set to zero by hand. This discrepancy explains the significant difference between these models. On the other hand, the neural reconstruction is capable of capturing the overall trend of the global rotation curve, except for the innermost radii where it predicts higher velocities than observed. Consequently, its MSE with the data increases in this region.
-
•
From Group C, we select the galaxy NGC3521, whose mass profiles indicate that its stellar component, characterized by a single exponential disk 2, significantly contributes to the total distribution of matter and, consequently, to the overall RC. Regarding parametric models, when is fixed, the stellar component prominently dominates and dictates the global shape of the RC, the high value of this mass-to-light ratio leads to an over-prediction in the velocity in the inner part, which is what causes the high MSE value of this model. In contrast, the parametric model with free does not over-predict the inner region; instead, it requires dark matter to fit the data at all radii. This causes the DM, whose contribution does not decay, to begin to dominate the global trend of the RC at a radius of approximately 10 kpc. As a result, beyond this radius, the parametric curve remains relatively constant. However, for this model, a slight overprediction is observed at large radii, which although not as dramatic, still contributes to the high MSE of this model. On the other hand, given the availability of data points at various distances for this galaxy, neural reconstruction achieves high accuracy in mimicking the observational data at all different radii without needing to make assumptions regarding the mass profiles. This results in a small MSE between the non-parametric reconstruction and the observational data.
A noticeable difference between the previously reported groups is that the effectiveness of the non-parametric reconstruction improves with a more evenly distributed set of data points. On closer inspection, the galaxies NGC2366 and IC2574 stand out as having the lowest mean squared error (MSE ) between the neural network (ANN) predictions and the observed data. These galaxies are classified as dwarfs and are characterized by a lower stellar contribution compared to their neutral gas content. As for the parametric models, a discrepancy in both galaxies is that the free model imposes a null stellar contribution; otherwise, the predicted value becomes non-physical. Moreover, the ANN’s superior performance in modeling these galaxies suggests that this potential variability in needs to be better understood to provide a more accurate description of dark matter, which is evidently influenced by this consideration.
VI Conclusions
In summary, the results presented shed light on the comparative performance of parametric models and neural reconstruction in characterizing galactic rotation curves. While parametric models offer detailed insights into the influence of the stellar and dark matter components on galactic dynamics, neural reconstruction stands out for its ability to adapt to the inherent complexity of rotation curves without the need for prior assumptions about mass profiles. These findings highlight the importance of employing diverse methodological approaches to comprehensively understand galaxy dynamics in modern astrophysics research.
Modeling galaxies with a very bright bulge component and/or with non-circular motions in the inner and outer regions represent challenges for parametric approaches to accurately describe the observational data, especially because taking a value fully determines the profile of the velocities associated with the stellar component. This can lead to an overestimation of the velocity at the galactic center, particularly if the bulge is prominent, as indicated by the MSE calculated in Table 2; in such cases, the model deviates significantly from the observed data. In the context of parametric models, the next consideration to mitigate the overestimation is to treat as a free parameter, avoiding maximum disk scenarios. Frequently, this modification brings the new model closer to the data. However, as also indicated in Table 2, the model may still not be closely aligned with the data, and in addition, this assumption influences the DM distribution. Also, it is important to note that in this work we are not penalizing the addition of the extra parameters.
In contrast, when the description provided by theoretical models is set aside, neural reconstruction presents a promising alternative by capturing overall trends in the rotation curve, albeit with slight deviations in specific regions where the amount of data is poor, which is an expected issue given the small size of the datasets. However, neural reconstructions offer interesting alternative models for the rotation curves within the range of the radius of the observed data points.
The success of neural reconstruction in accurately reproducing observational data is evident in Group C of galaxies, such as the rotation curve of NGC3521, which is difficult to model and where parametric models fail. This highlights the potential of machine learning techniques to improve our understanding of galactic dynamics, as they reflect the underlying astrophysical complexities and properties of the galaxies in the THINGS catalog, providing a window into the interplay between baryonic matter, dark matter, and galaxy dynamics.
The non-parametric reconstruction approach stands out for its capability to generate new predictions or interpolations, based on the statistical patterns observed, presenting a promising avenue for further investigation.
Acknowledgments
GGA and IGV thank the CONAHCYT postdoctoral grant and ICF-UNAM. JAV acknowledges the support provided by FOSEC SEP-CONACYT Investigación Básica A1-S-21925, FORDECYT-PRONACES-CONACYT 304001 and UNAM-DGAPA-PAPIIT IN117723. We appreciate the help of Prof. Erwing De Blok for providing us with the employed data. Lastly, we thank Luis E. Padilla Albores for his useful comments.
References
- Slipher [1914] V. M. Slipher. The detection of nebular rotation. Lowell Observatory Bulletin, 2:66–66, January 1914.
- Rubin and Ford [1970] Vera C. Rubin and W. Kent Ford, Jr. Rotation of the Andromeda Nebula from a Spectroscopic Survey of Emission Regions. Astrophys. J., 159:379–403, 1970. doi: 10.1086/150317.
- Karukes and Salucci [2017] E. V. Karukes and P. Salucci. The universal rotation curve of dwarf disc galaxies. Mon. Not. Roy. Astron. Soc., 465(4):4703–4722, 2017. doi: 10.1093/mnras/stw3055.
- de Blok and McGaugh [1997] W. J. G. de Blok and S. S. McGaugh. The Dark and visible matter content of low surface brightness disk galaxies. Mon. Not. Roy. Astron. Soc., 290:533–552, 1997. doi: 10.1093/mnras/290.3.533.
- Pahwa and Saha [2018] Isha Pahwa and Kanak Saha. Structural properties of faint low-surface-brightness galaxies. Monthly Notices of the Royal Astronomical Society, 478(4):4657–4668, May 2018. ISSN 1365-2966. doi: 10.1093/mnras/sty1139. URL http://dx.doi.org/10.1093/mnras/sty1139.
- Sellwood and Moore [1999] Jerry A. Sellwood and E. M. Moore. On the formation of disk galaxies and massive central objects. Astrophys. J., 510:125–135, 1999. doi: 10.1086/306557.
- de Blok and Bosma [2002] W. J. G. de Blok and A. Bosma. High-resolution rotation curves of low surface brightness galaxies. Astron. Astrophys., 385:816, 2002. doi: 10.1051/0004-6361:20020080.
- Fernández-Hernández et al. [2019] Lizbeth M Fernández-Hernández, Ariadna Montiel, and Mario A Rodríguez-Meza. Galaxy rotation curves using a non-parametric regression method: core, cuspy and fuzzy scalar field dark matter models. Monthly Notices of the Royal Astronomical Society, 488(4):5127–5144, 2019.
- Yi et al. [2022] Zhenping Yi, Jia Li, Wei Du, Meng Liu, Zengxu Liang, Yongguang Xing, Jingchang Pan, Yude Bu, Xiaoming Kong, and Hong Wu. Automatic detection of low surface brightness galaxies from sloan digital sky survey images. Monthly Notices of the Royal Astronomical Society, 513(3):3972–3981, 2022.
- Thuruthipilly et al. [2024] H Thuruthipilly, Junais Junais, A Pollo, U Sureshkumar, M Grespan, P Sawant, K Małek, and A Zadrozny. Shedding light on low-surface-brightness galaxies in dark energy surveys with transformer models. Astronomy & Astrophysics, 682:A4, 2024.
- Tanoglidis et al. [2021] Dimitrios Tanoglidis, Aleksandra Ćiprijanović, and Alex Drlica-Wagner. Deepshadows: Separating low surface brightness galaxies from artifacts using deep learning. Astronomy and Computing, 35:100469, 2021.
- Cortés et al. [2024] P Marchant Cortés, JL Castellón, MV Alonso, L Baravalle, C Villalón, MA Sgró, IV Daza-Perilla, M Soto, F Milla Castro, D Minniti, et al. Galaxies in the zone of avoidance: Misclassifications using machine learning tools. arXiv preprint arXiv:2403.03098, 2024.
- Argüelles and Collazo [2023] Carlos R Argüelles and Santiago Collazo. Galaxy rotation curve fitting using machine learning tools. Universe, 9(8):372, 2023.
- Stone et al. [2021] Connor J Stone, Nikhil Arora, Stéphane Courteau, and Jean-Charles Cuillandre. Autoprof–i. an automated non-parametric light profile pipeline for modern galaxy surveys. Monthly Notices of the Royal Astronomical Society, 508(2):1870–1887, 2021.
- Pato and Iocco [2015] Miguel Pato and Fabio Iocco. The Dark Matter Profile of the Milky Way: a Non-parametric Reconstruction. Astrophys. J. Lett., 803(1):L3, 2015. doi: 10.1088/2041-8205/803/1/L3.
- Sharma et al. [2020] Ranbir Sharma, Ankan Mukherjee, and HK Jassal. Reconstruction of late-time cosmology using principal component analysis. preprint arXiv:2004.01393, 2020.
- Keeley et al. [2021] Ryan E. Keeley, Arman Shafieloo, Gong-Bo Zhao, Jose Alberto Vazquez, and Hanwool Koo. Reconstructing the universe: Testing the mutual consistency of the pantheon and SDSS/eBOSS BAO data sets with gaussian processes. The Astronomical Journal, 161(3):151, Feb 2021. doi: 10.3847/1538-3881/abdd2a. URL https://doi.org/10.3847/1538-3881/abdd2a.
- L’Huillier et al. [2020] Benjamin L’Huillier, Arman Shafieloo, David Polarski, and Alexei A Starobinsky. Defying the laws of gravity i: model-independent reconstruction of the universe expansion from growth data. Monthly Notices of the Royal Astronomical Society, 494(1):819–826, 2020. doi: https://doi.org/10.1093/mnras/staa633.
- Escamilla et al. [2023] Luis A Escamilla, Özgür Akarsu, Eleonora Di Valentino, and J Alberto Vazquez. Model-independent reconstruction of the interacting dark energy kernel: Binned and gaussian process. Journal of Cosmology and Astroparticle Physics, 2023(11):051, 2023.
- Wang et al. [2020] Guo-Jian Wang, Xiao-Jiao Ma, Si-Yao Li, and Jun-Qing Xia. Reconstructing functions and estimating parameters with artificial neural networks: A test with a hubble parameter and sne ia. Astrophysical Journal Supplement Series, 246(1):13, 2020. doi: https://doi.org/10.3847/1538-4365/ab620b.
- Gómez-Vargas et al. [2023a] Isidro Gómez-Vargas, Ricardo Medel-Esquivel, Ricardo García-Salcedo, and J Alberto Vázquez. Neural network reconstructions for the hubble parameter, growth rate and distance modulus. The European Physical Journal C, 83(4):304, 2023a.
- Gómez-Vargas et al. [2023b] Isidro Gómez-Vargas, Joshua Briones Andrade, and J Alberto Vázquez. Neural networks optimized by genetic algorithms in cosmology. Physical Review D, 107(4):043509, 2023b.
- Walter et al. [1985] F. Walter, E. Brinks, W. J. G. de Blok, F. Bigiel, R. C. Kennicutt, Jr., M. D. Thornley, and A. K. Leroy. THINGS: The HI Nearby Galaxy Survey. Astron. J., 136:2563–2647, 1985. doi: 10.1088/0004-6256/136/6/2563.
- de Blok et al. [2008] W. J. G. de Blok, F. Walter, E. Brinks, C. Trachternach, S-H. Oh, and R. C. Kennicutt, Jr. High-Resolution Rotation Curves and Galaxy Mass Models from THINGS. Astron. J., 136:2648–2719, 2008. doi: 10.1088/0004-6256/136/6/2648.
- Sofue and Rubin [2001] Yoshiaki Sofue and Vera Rubin. Rotation curves of spiral galaxies. Ann. Rev. Astron. Astrophys., 39:137–174, 2001. doi: 10.1146/annurev.astro.39.1.137.
- Einasto [1965] J. Einasto. On the Construction of a Composite Model for the Galaxy and on the Determination of the System of Galactic Parameters. Trudy Astrofizicheskogo Instituta Alma-Ata, 5:87–100, January 1965.
- Navarro et al. [1996] Julio F. Navarro, Carlos S. Frenk, and Simon D. M. White. The Structure of cold dark matter halos. Astrophys. J., 462:563–575, 1996. doi: 10.1086/177173.
- Burkert [1995] A. Burkert. The Structure of dark matter halos in dwarf galaxies. Astrophys. J. Lett., 447:L25, 1995. doi: 10.1086/309560.
- Begeman et al. [1991] K. G. Begeman, A. H. Broeils, and R. H. Sanders. Extended rotation curves of spiral galaxies: Dark haloes and modified dynamics. Mon. Not. Roy. Astron. Soc., 249:523, 1991. doi: 10.1093/mnras/249.3.523.
- Salucci et al. [2007] Paolo Salucci, A. Lapi, C. Tonini, G. Gentile, I. Yegorova, and U. Klein. The Universal Rotation Curve of Spiral Galaxies. 2. The Dark Matter Distribution out to the Virial Radius. Mon. Not. Roy. Astron. Soc., 378:41–47, 2007. doi: 10.1111/j.1365-2966.2007.11696.x.
- Mastache et al. [2013] Jorge Mastache, Jorge L. Cervantes-Cota, and Axel de la Macorra. Testing modified gravity at large distances with the HI Nearby Galaxy Survey’s rotation curves. Phys. Rev. D, 87(6):063001, 2013. doi: 10.1103/PhysRevD.87.063001.
- Navarro-Boullosa et al. [2023] Atalia Navarro-Boullosa, Argelia Bernal, and J. Alberto Vazquez. Bayesian analysis for rotational curves with -boson stars as a dark matter component. JCAP, 09:031, 2023. doi: 10.1088/1475-7516/2023/09/031.
- Kennicutt et al. [2003] R. C. Kennicutt, Jr. et al. SINGS: The SIRTF Nearby Galaxies Survey. Publ. Astron. Soc. Pac., 115:928–952, 2003. doi: 10.1086/376941.
- Wasserman [2006] Larry Wasserman. All of nonparametric statistics. Springer Science & Business Media, 2006.
- Hornik et al. [1990] Kurt Hornik, Maxwell Stinchcombe, and Halbert White. Universal approximation of an unknown mapping and its derivatives using multilayer feedforward networks. Neural networks, 3(5):551–560, 1990. doi: https://doi.org/10.1016/0893-6080(90)90005-6.
- Nielsen [2015] Michael A Nielsen. Neural networks and deep learning, volume 25. Determination press San Francisco, CA, USA, 2015.
- Goodfellow et al. [2016] Ian Goodfellow, Yoshua Bengio, Aaron Courville, and Yoshua Bengio. Deep learning, volume 1. MIT press Cambridge, 2016.
- Larochelle et al. [2007] Hugo Larochelle, Dumitru Erhan, Aaron Courville, James Bergstra, and Yoshua Bengio. An empirical evaluation of deep architectures on problems with many factors of variation. Proc. 24th Int. Conf. Machine Learning, pages 473–480, 2007. doi: https://doi.org/10.1145/1273496.1273556.
- Gal and Ghahramani [2015] Yarin Gal and Zoubin Ghahramani. Dropout as a bayesian approximation: Insights and applications. Deep Learning Workshop, ICML, 1:2, 2015.
- Benatan et al. [2023] Matt Benatan, Jochem Gietema, and Marian Schneider. Enhancing Deep Learning with Bayesian Inference: Create more powerful, robust deep learning systems with Bayesian deep learning in Python. Packt Publishing, 2023.
- Freeman [1970] K. C. Freeman. On the disks of spiral and SO Galaxies. Astrophys. J., 160:811, 1970. doi: 10.1086/150474.
- Oh et al. [2008] Se-Heon Oh, W. J. G. de Blok, Fabian Walter, Elias Brinks, and Robert C. Kennicutt, Jr. High-resolution dark matter density profiles of THINGS dwarf galaxies: Correcting for non-circular motions. Astron. J., 136:2761, 2008. doi: 10.1088/0004-6256/136/6/2761.
- Bell and de Jong [2001] Eric F. Bell and Roelof S. de Jong. Stellar mass-to-light ratios and the Tully-Fisher relation. Astrophys. J., 550:212–229, 2001. doi: 10.1086/319728.
- Fortin et al. [2012] Félix-Antoine Fortin, François-Michel De Rainville, Marc-André Gardner, Marc Parizeau, and Christian Gagné. DEAP: Evolutionary algorithms made easy. Journal of Machine Learning Research, 13:2171–2175, 07 2012.
- Kingma and Ba [2014] Diederik P Kingma and Jimmy Ba. Adam: A method for stochastic optimization. arXiv preprint arXiv:1412.6980, 2014.
- Leung and Bovy [2019] Henry W Leung and Jo Bovy. Deep learning of multi-element abundances from high-resolution spectroscopic data. Monthly Notices of the Royal Astronomical Society, 483(3):3255–3277, 2019.
- Leung [2024. Accesed on 22/02/2024.] Henry W Leung. Deep learning for astronomers with tensorflow. https://github.com/henrysky/astroNN., 2024. Accesed on 22/02/2024.