Data Readiness for AI: A 360-Degree Survey
Abstract.
Data are the critical fuel for Artificial Intelligence (AI) models. Poor quality data produces inaccurate and ineffective AI models that may lead to incorrect or unsafe use. Checking for data readiness is a crucial step in improving data quality. Numerous R&D efforts have been spent on improving data quality. However, standardized metrics for evaluating data readiness for use in AI training are still evolving. In this study, we perform a comprehensive survey of metrics used for verifying AI’s data readiness. This survey examines more than 120 papers that are published by ACM Digital Library, IEEE Xplore, other reputable journals, and articles published on the web by prominent AI experts. This survey aims to propose a taxonomy of data readiness for AI (DRAI) metrics for structured and unstructured datasets. We anticipate that this taxonomy can lead to new standards for DRAI metrics that would be used for enhancing the quality and accuracy of AI training and inference.
1. Introduction
Data readiness for artificial intelligence (AI) refers to the critical process of preparing and ensuring the quality, accessibility, and suitability of datasets before using them for artificial intelligence applications. Readying the data is a fundamental step, which involves collecting, cleaning, organizing, and validating the dataset not only to make them compatible with AI algorithms and models but also to make certain that the datasets are appropriate and unbiased. By achieving data readiness, organizations can maximize the accuracy, efficiency, and effectiveness of their AI systems, ultimately leading to more informed decision-making and successful AI-driven outcomes.
Data readiness for AI is an important concern in the field of AI applications, as evidenced by a survey conducted by Scale AI (Hwang, 2022). The survey highlights that a significant number of participants encountered challenges related to data readiness within their machine learning (ML) projects. Similarly, a comprehensive study (Woodie, 2020) involving nearly 2,400 respondents from over 100 countries explains the time-intensive nature of data preparation and cleaning tasks for data scientists working with AI applications. Moreover, this study reveals that these activities toward readying data can adversely affect job satisfaction. It is crucial to recognize that the quality of outcomes generated by an AI system is strongly linked to the readiness of the input data. This connection highlights the significance of addressing the ”garbage in, garbage out” saying, which emphasizes that flawed or insufficient input data will inevitably lead to inaccurate and unreliable results from AI algorithms (Schmelzer, 2019). Hence, ensuring the availability of high-quality and well-prepared data for training ML models is crucial, as it leads to more precise and dependable predictions.
With growing requirements of unbiased high-quality data for AI, the field of quantitative evaluation of data quality with appropriate metrics is still evolving. IBM has developed the Data Quality Toolkit (Developer, 2021) provides a suite of tools and functionalities to streamline the preparation and cleaning of their data. A notable feature of the IBM Data Quality Toolkit is the Data Readiness Report, which is generated automatically after the data preparation and cleansing process. This report offers insightful observations into the quality and readiness of the data for use in AI applications, including data quality metrics defined by Sidi et al. (Sidi et al., 2012) such as completeness, consistency, accuracy, and timeliness, along with suggestions for improvement. On the other hand, Ravi et al. (Ravi et al., 2022) focus on the critical process of making experimental datasets FAIR (Findable, Accessible, Interoperable, Reusable) for AI readiness. Throughout their analysis, they emphasize the usage of current data infrastructure to establish a framework suitable for automatic AI-powered exploration. To achieve this objective, they publish FAIR and AI-ready datasets. The published datasets are at The Materials Data Facility (Blaiszik et al., 2016). Additionally, the study complements these efforts by illustrating how FAIR and AI-ready datasets can be effectively used for AI inference.
Although separate efforts and tools mentioned above are available to prepare data for AI, there is a lack of a comprehensive study on effective metrics for various types of data. To address that gap, we perform a comprehensive examination of the existing data readiness metrics for AI, covering both structured and unstructured data dimensions, and discuss on the existing tools and techniques employed to assess data readiness. Furthermore, we explore in this survey the metrics designed to evaluate fairness and privacy related issues in data that could impact the decision-making processes of AI algorithms. The significance of not incorporating social-minded measures such as fairness and bias into data quality processes has the potential to compromise the integrity of the data quality.
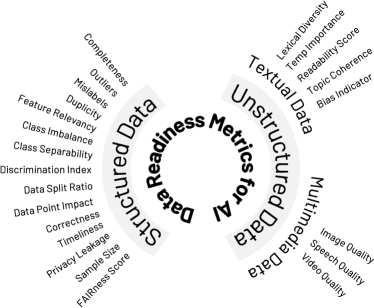
Our survey draws upon a comprehensive set of data quality dimensions and data preparation techniques by specifically focusing on defining the primary data readiness dimensions essential for AI applications. We aim to identify and showcase the existing metrics and scoring mechanisms available in the literature that effectively measure the readiness of data for AI. By thoroughly exploring these dimensions and metrics, our survey provides valuable insights into assessing the preparedness of data for AI, contributing to a comprehensive understanding of data readiness. Fig. 1 illustrates the 360° plot of data readiness dimensions for AI, encompassing data evaluation metrics discussed in this study.
Given the critical importance of data readiness for AI metrics, it is essential to stay up to date with the most effective research and advancements in this area. We have performed an extensive search for available data readiness metrics by sifting through the literature available in ACM Digital Library, IEEE Xplore, and other reputable journals in computer science. Considering that the field of assessing data readiness is still nascent, we have also surveyed several web articles that are available online. Overall, we have surveyed nearly 30 papers from ACM Digital Library, over 20 papers from IEEE Xplore, 10 papers each from Springer and Science Direct, and more than 40 papers from other reputable journals worldwide. Additionally, we highlight discussions on six web articles and explore the metrics used in four commercially used tools in this field. In Table 1, we present the search queries used to procure the sources for this study, categorized into general, structured data, and unstructured data search queries.
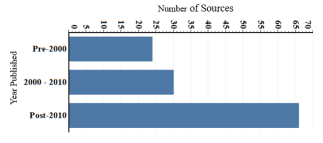
In shaping this study, our focus encompassed sources published across different timeframes – pre-2000, 2000-2010, and post-2010. Fig. 2 illustrates the distribution of sources across different timeframes. Paying attention to references prior to 2000 is particularly important because they include some well-established data readiness metrics that have stood the test of time and remain relevant today. These earlier references help provide context and insights into the evolution of data readiness metrics over the years.
| General | Structured Data Related | Unstructured Data Related | |||
|---|---|---|---|---|---|
| ”data readiness” AND ”AI” | ”data quality” AND ”assessment” |
|
”speech quality” AND ”metric” OR ”measure” OR ”evaluat*” | ||
| ”data readiness” | ”data quality dimension” | ”audio quality” AND ”metric”OR ”measure” OR ”evaluat*” | |||
| ”data readiness” AND ”machine learning” OR ”ML” | ”data quality” AND ”metric” | ”video quality” AND ”metric”OR ”measure” OR ”evaluat*” | |||
| ”AI ready” | ”data prepare” AND ”AI” | ”image quality” AND ”metric”OR ”measure” OR ”evaluat*” | |||
| ”data quality” AND ”machine learning” | ”data read*” AND ”metric” | ”visual quality” AND ”metric” OR ”measure” OR ”evaluat*” | |||
| ”data quality AND ”measure” | ”data preprocess” | ||||
| ”data quality” AND ”evaluation” | ”data clean” | ||||
| ”data quality” and ”AI” | ”data quality” AND ”survey” | ||||
In the remainder of the paper, we describe studies that target understanding metrics for AI data readiness. We provide our definition of data readiness for AI and how it can be used to shape AI pipelines. In Section 4, we introduce a comprehensive set of metrics being used for measuring the readiness of structured and unstructured data. In Section 5, we list a set of gaps and challenges in defining data readiness for AI and then conclude the discussion with future work.
2. Related Work
Toward gaining an understanding of metrics for AI data readiness, a small number of studies surveyed data quality and preprocessing stages in preparing data for AI. Priestley et al. (Priestley et al., 2023) conducted a significant study highlighting the critical role of decision-makers and practitioners in driving the shift toward data-focused practices. They emphasized the need for high-quality data and underscored the significance of data cleaning and preprocessing stages, including feature selection, duplicate elimination, outlier removal, consistency assurance, and handling of missing values. Documentation of these preprocessing steps was deemed essential to ensure compatibility and identify potential dependencies and information leakages among features. Their insights, derived from an extensive literature survey, laid the foundation for recognizing the pivotal role of data quality in AI applications. Yalaoui et al. (Yalaoui and Boukhedouma, 2021) presented a survey paper specifically focused on data quality evaluation and enhancement. They compared existing frameworks, models, and methods for data quality evaluation and enhancement, and identified research directions and challenges.
There are a few studies that looked into metrics for unstructured data. Elmagarmid et al. (Elmagarmid et al., 2007) explored into similarity metrics for duplicate record detection, specifically focusing on challenges posed by typographical variations in string data. Li et al. (Li et al., 2017) concentrated on feature selection metrics, categorizing traditional approaches into wrapper methods, filter methods, embedded methods, and hybrid methods. Furthermore, Forman (Forman, 2003) explored feature selection metrics for text classification, examining their performance. The studies on image quality measures (Thung and Raveendran, 2009) and perceptual visual quality metrics (Lin and Jay Kuo, 2011) play a crucial role in understanding data readiness for unstructured data, particularly in the context of visual data, where image quality assessment and perceptual metrics are essential for effective AI applications.
In the context of bias and fairness, Shahbazi et al. (Shahbazi et al., 2023) provided a survey of techniques focused on identifying and mitigating representation bias across diverse data types, such as structured data, image data, textual data, and graph data. They discussed the problem definition, causes, and methods for measuring and quantifying representation bias in both structured and unstructured data. Addressing the issue of discrimination in data readiness for AI systems, Ntoutsi et al. (Ntoutsi et al., 2020) focused on the challenges and implications of biased data on the fairness and accuracy of AI-based decision-making. They emphasized the importance of understanding and mitigating biases in data to prevent the perpetuation of discriminatory practices. Similarly, in the context of privacy, Wagner et al. (Wagner and Eckhoff, 2018) reviewed over 80 privacy metrics across six domains categorizing them based on the aspect of privacy measured, required inputs, and data types needing protection. It identifies research gaps in areas such as metric combination and interdependent privacy, proposing a method for selecting appropriate metrics through nine key questions. Emphasizing the importance of employing multiple metrics to address diverse privacy facets, the paper serves as a reference guide and toolbox for privacy researchers, aiding informed choices in metric selection for specific scenarios.
Building upon existing comprehensive surveys, our study aims to contribute to the evolving field of data readiness metrics, with a specific focus on metrics for both structured and unstructured data. While previous works have explored specific dimensions or focused on individual metrics, we address the lack of a comprehensive study including numerous data readiness dimensions for AI applications. There are broader perspectives in addressing data readiness for AI applications. We identify numerous crucial factors that define data readiness, such as data preparation, privacy leakage evaluation, data discrimination evaluation, compliance to FAIR principles, mislabeled data detection, feature relevancy analysis, bias-related issues, and quality evaluation of speech and multimedia data. To survey existing literature in these dimensions and to identify gaps, our effort aims to advance the AI data readiness field and inform best practices for evaluating the suitability of data for AI applications. Given the growing importance of data readiness, our study fills a crucial gap in the literature and provides valuable insights for practitioners and decision-makers in the field.
3. Data Readiness for AI (DRAI)
In this section, we examine the concept of data readiness for AI and explore the processes involved in preparing data for effective AI usage. Furthermore, we will discuss the significance of assessing data readiness for AI, emphasizing the importance of robust frameworks, methodologies, and metrics to evaluate and enhance the suitability of data for AI applications. By addressing the key challenges and considerations in data readiness, organizations can lay a solid foundation for AI implementation and unlock the full potential of their data resources.
3.1. Processes of Readying Data for AI
The AI community defines the processes of readying data for AI as a series of steps aimed at preparing the data to be suitable for machine learning and AI applications. According to IBM Biddle et al. (Biddle and Christensen, nd) describe that data preparation for AI involves transforming data into a format suitable for model development, measurement, and training. This includes processes such as selecting relevant attributes, merging data sets, deriving new attributes, formatting, sorting the data, addressing missing values, and ensuring data accuracy and completeness. In parallel, Informatica (Tawfik et al., 2021) emphasizes critical processes in data preparation for AI projects. These processes include finding and accessing trusted data, analyzing data lineage and relationships, preparing and cleansing the data, enriching the data through feature engineering or incorporating additional data, and operationalizing the data pipeline for reuse and automation. Similarly, Lawton (Lawton, 2022) characterizes data preparation as a time-consuming and complex process. It involves various processes such as problem formulation, data collection, data exploration, data cleansing and validation, data structuring, feature engineering, and feature selection. These processes collectively aim to ensure accurate and adaptable algorithms, ultimately saving time and effort for data scientists and business users.
To further enhance the quality, relevance, and usability of data for AI and machine learning applications, AltexSoft (Editor, 2020) outlines ten fundamental processes for preparing datasets. These processes incorporate problem articulation, establishing data collection mechanisms, assessing data quality, formatting data for consistency, reducing data, data cleaning, creating features, joining transactional and attribute data, rescaling data, and discretizing data.
In addition to these essential processes, the Data Readiness Report, as introduced by Afzal et al. (Afzal et al., 2020), assumes a crucial role in readying data for AI. This report serves as documentation of operations conducted during data preparation, cleaning, and quality analysis. By providing insights into dataset characteristics and evaluating them against relevant quality dimensions, the Data Readiness Report effectively addresses upfront data challenges and contributes to the overall effectiveness of data preparation for AI applications.
Overall, the AI community defines the processes of readying data for AI as a set of tasks that involve transforming, cleaning, validating, enriching, and documenting the data to make it suitable for model development, training, and analysis. These processes aim to ensure data quality, accuracy, relevance, and consistency, ultimately facilitating effective AI and machine learning outcomes.
3.2. Assessing Data Readiness
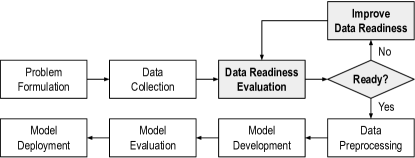
Assessing data readiness for AI is crucial for ensuring the performance, fairness, and reliability of AI systems. It involves evaluating quality, completeness, representativeness, and other data readiness dimensions, including feature relevancy, duplicity, class separability, FAIR (Findable, Accessible, Interoperable, and Reusable) compliance, and outliers used for training and deploying AI models. By conducting a thorough assessment, AI users can identify and address data quality issues, mitigate bias and fairness concerns, improve model generalization and robustness, and comply with data governance and ethical guidelines. In addition, assessing data readiness in the early stages of the ML pipeline is highly beneficial. By evaluating data readiness at an early stage, organizations can identify any data-related challenges or limitations upfront, allowing for proactive measures and adjustments. In Fig. 3, we illustrate the placement of data readiness evaluation within the ML pipeline, emphasizing the importance of conducting these assessments early on. Ultimately, assessing data readiness enhances the overall effectiveness and trustworthiness of AI systems, enabling them to make accurate predictions and informed decisions in real-world applications.
Assessing data readiness for AI applications is a multifaceted challenge, as discussed by Allen (Allen, 2019) and Gupta et al. (Gupta et al., 2021). These complementary approaches provide insights into various aspects of data readiness. On the one hand, Allen’s article highlights five key dimensions: data accessibility, size, usability, understandability, and maintainability. It underscores the need for strategic data management, including external sources and adherence to good data practices. On the other hand, Gupta et al.’s toolkit offers a practical, automated approach to assessing data quality and addressing data readiness challenges. It provides an array of quality metrics for structured datasets, covering dimensions like completeness, accuracy, consistency, and timeliness. These metrics empower data scientists to understand data limitations and guide data preparation effectively. By merging these studies, there is potential for a comprehensive framework that improves data readiness in AI projects, including both strategic considerations and practical data quality assessment techniques.
Data scientists often face challenges during the pre-processing stage, which can significantly impact productivity and introduce data quality issues. These include dealing with missing or incomplete data, handling noisy or irrelevant features, addressing class imbalances in the dataset, ensuring data privacy and security, managing data scalability and storage constraints, handling unstructured or semi-structured data formats, and dealing with inconsistencies or errors in data sources. Afzal et al. (Afzal et al., 2020) introduced the concept of a data readiness report seeking to address these challenges. This report provides detailed insights into the quality of input data across various dimensions. It captures data properties, identifies quality issues, and documents data operations performed by different individuals involved in the data preparation process. Alongside Datasheets (Gebru et al. (Gebru et al., 2018)) and Model Cards (Mitchell et al. (Mitchell et al., 2019)), the data readiness report enhances transparency, documentation, and governance in the AI pipeline. It promotes responsible AI development by ensuring stakeholders have a clear understanding of the dataset’s strengths, limitations, and suitability for training machine learning models.
To further enhance the assessment of data readiness for AI, Lawrence (Lawrence, 2017) focuses on assessing data readiness by categorizing it into different bands (C, B, and A) based on accessibility, accuracy, representation, and appropriateness. Each band represents a specific level of data quality and readiness for analysis or distribution. Band C focuses on data accessibility, requiring it to be made machine-readable and ethically handled. Band B emphasizes verifying data accuracy and representation, addressing missing values and errors. Band A considers the appropriateness of the dataset for specific tasks involving careful evaluation and potential annotation or new data collection. By categorizing data readiness into these bands, the framework provides a structured methodology for evaluating and improving data quality, thereby enhancing the reliability and effectiveness of AI systems.
Similar to Lawrence’s (Lawrence, 2017) work on data readiness, Harvey et al. (Harvey and Glocker, 2019) also addressed the topic by introducing the MIDaR (Medical Imaging Data Readiness) scale. It is a framework for assessing the readiness of medical imaging data for AI applications, considering FAIR (Findable, Accessible, Interoperable, and Reusable) principles and different stages of data preparation. It categorizes data into four levels: D, C, B, and A. Level D represents abundant but inaccessible and un-anonymized data. Level C indicates anonymized data with artifacts and noise. Level B signifies structured and quality-controlled data without labels, and Level A represents labeled and statistically powered data ready for AI tasks. As data progresses toward Level A, its value increases, although the volume may decrease. The MIDaR scale provides insights into data quality, ethics, labeling, and statistical power when preparing medical imaging data for AI analysis.
In line with the focus on data readiness assessment, Patel et al. (Patel et al., 2022) (Patel et al., 2023) underscore the importance of systematically analyzing data quality to improve the efficacy of machine learning and artificial intelligence applications. Their research emphasizes the need for intelligently designed metrics and transformation operations that effectively address data quality gaps, reducing the effort required for debugging in the machine learning pipeline. This perspective on data quality aligns with the principles embedded in OpenDataVal introduced by Jiang et al. (Jiang et al., 2023), an existing benchmark framework. OpenDataVal provides a unified environment for researchers and practitioners to apply and compare various data valuation algorithms. With a diverse collection of datasets, the implementation of state-of-the-art data valuation algorithms, and proposed machine learning tasks for evaluating data quality, OpenDataVal significantly contributes to streamlining data preparation. The framework’s integrated environment and prediction model API further facilitate the seamless integration of various models. This comprehensive approach in OpenDataVal aims to enhance machine learning outcomes by promoting robust data preparation and evaluation strategies.
| Reference | Summary | ||||
|---|---|---|---|---|---|
| Allen (Allen, 2019) |
|
||||
| Gupta et al.(Gupta et al., 2021) |
|
||||
| Afzal et al. (Afzal et al., 2020) |
|
||||
| Lawrence (Lawrence, 2017) |
|
||||
| Harvey et al. (Harvey and Glocker, 2019) |
|
||||
| Patel et al. (Patel et al., 2022) (Patel et al., 2023) |
|
||||
| Jiang et al. (Jiang et al., 2023) |
|
In Table 2, we compare various AI readiness approaches discussed in this section. Evaluating data readiness for AI is crucial for robust and reliable machine learning systems. This process – includind data quality, completeness, representativeness, and more – aids in addressing issues, reducing biases, enhancing model performance, and ensuring ethical compliance. The complexities involved emphasize the need for a strong data strategy, exploration of external data sources, and robust data pipelines. The advent of assessment frameworks and toolkits empowers practitioners to improve the trustworthiness of AI systems. Ongoing research in data readiness will contribute to responsible AI deployment, enabling accurate decisions across diverse applications. Prioritizing data readiness establishes a solid foundation for AI success, promoting transparency, accountability, and responsible development.
4. DRAI Metrics
In this section, we describe the existing metrics found in the literature that are used to measure the preparedness of data for AI. We will explore both structured and unstructured data, with a primary focus on structured data. Nevertheless, we briefly touch upon important unstructured data metrics, including textual, multimedia, image, speed, and video-related data. In Table 3, we provide a summary of the dimensions and metrics defined in this study.
| Structured Data | Unstructured Data | ||||||||||||
| Dimension | Metrics | Data Type | Dimension | Metrics | |||||||||
| Completeness |
|
Textual Data | Lexical Diversity |
|
|||||||||
| Outliers |
|
Term Importance |
|
||||||||||
| Mislabels | Gupta et al’s (Gupta et al., 2021), Cohen’s Kappa (Cohen, 1960) | Readability Score |
|
||||||||||
| Duplicity |
|
Topic Coherence |
|
||||||||||
| Feature Relevancy |
|
Bias Indicator | Papakyriakopoulos et al. (Papakyriakopoulos et al., 2020), | ||||||||||
| Class Imbalance |
|
Multimedia Data | Image Quality |
|
|||||||||
| Class Separability |
|
Speech Quality |
|
||||||||||
| Discrimination Index |
|
Video Quality |
|
||||||||||
| Data Split Ratio | Joseph (Joseph, 2022), Affendras et al. (Afendras and Markatou, 2019) | ||||||||||||
| Data Point Impact |
|
||||||||||||
| Correctness | Kaiser et al. (Kaiser et al., 1970), Pipino et al’s(Pipino et al., 2002) | ||||||||||||
| Timeliness |
|
||||||||||||
| Privacy Leakage |
|
||||||||||||
| Sample Size |
|
||||||||||||
| FAIRness Score | Wilkinson et al. (Wilkinson et al., 2018), Clarke et al. (Clarke et al., 2019) | ||||||||||||
4.1. Structured data
This section aims to comprehensively define the various dimensions of readiness of structured data for AI and support the definitions with relevant examples. Additionally, we will emphasize the significance of existing metrics and scoring mechanisms presented in the literature that enable the measurement and evaluation of structured data readiness for AI across each dimension. It is important to note that specific dimensions discussed may be applicable primarily to supervised learning (e.g., mislabeled data), while others may be more relevant to unsupervised learning (e.g., duplicity). By exploring these dimensions and metrics within their respective learning paradigms, this paper contributes to a deeper understanding of the crucial factors in preparing data for successful AI training.
4.1.1. Completeness
Completeness refers to the presence or availability of required data and attribute values in a dataset. It indicates whether data points or entries are complete, with all relevant attribute values recorded and available.
Example: In a dataset containing information about customer demographics, if the “income” attribute is complete for all individuals, there are no missing values for “income” across the entire dataset. This completeness ensures that a dataset is reliable and suitable for analysis, as there is no loss of information due to missing data in the “income” attribute.
Metrics in Literature: Blake et al. (Blake and Mangiameli, 2011) propose the “completeness” metric to measure the presence of missing values in a dataset. This metric quantifies the proportion of data records with null (missing) values compared to the total number of data records. By conducting a thorough examination of the completeness metric, researchers demonstrate how the presence of missing data can significantly impact the results of classification tasks. For example, Jäger et al. (Jäger et al., 2021) demonstrates that handling missing values significantly enhances predictive model performance, resulting in substantial improvements of up to 20% for classification tasks and around 15% for regression tasks, emphasizing the importance of addressing missing data to optimize downstream machine learning outcomes.
In the context of addressing missing data, Santos et al. (Santos et al., 2020) emphasize the importance of data imputation, which involves filling in or estimating missing values to maintain data integrity. Particularly, the authors highlight the efficacy of the k-nearest neighbors (KNN) imputation technique in this process. They discuss the significance of choosing appropriate distance metrics, such as HVDM and HEOM, which effectively handle both nominal and continuous data while preserving data distribution during imputation. In line with this, Bors et al. (Bors et al., 2018) propose a different approach to quantify missing values in a dataset, using indicators to distinguish missing from non-missing values. Their method offers a practical tool for data preparation, enabling easy identification of missing data in AI applications. Synthesizing these research findings, we can extract valuable insights into effective data imputation and missing data handling, which collectively contribute to enhancing data quality and bolstering the trustworthiness of AI analysis and modeling.
Gupta et al. (Gupta et al., 2021) further contribute to the field with their data completeness metric in the data quality toolkit. This metric is designed to detect and handle missing values in datasets, which can significantly impact ML models and lead to inaccurate inferences. Valuable insights are provided by the quality component of the metric through its ability to identify the presence and location of missing values in the data. When the score is 1, it indicates that there are no missing values in the dataset. However, when the score is not perfect, the metric offers a remediation mechanism that leverages constraints and an association-based approach. This approach takes into consideration the diverse data types and the relationships between attributes, enabling the imputation of missing entries and enhancing the overall quality and reliability of the dataset for ML modeling purposes. Thus, Gupta et al.’s work complements Santos et al.’s findings by providing a practical and effective method for addressing missing data and improving the quality of datasets.
Gupta et al. (Gupta et al., 2021) contribute a data completeness metric in their toolkit, addressing missing values in datasets. The metric, part of the data quality toolkit, detects and handles missing values, offering insights into their presence and location. A perfect score indicates no missing values, while an imperfect score prompts a remediation mechanism. Leveraging constraints and an association-based approach, it considers data types and attribute relationships for effective imputation.
Summary: Data completeness is crucial for accurate analysis and modeling. Metrics proposed by various researchers quantify the impact of missing values and suggest remedies such as KNN imputation with suitable evaluation metrics. Additionally, using indicators for distinction, and incorporating completeness metrics that consider data types and relationships further improve the handling of missing data.
4.1.2. Outliers
An outlier in a dataset refers to a data point or instance that significantly deviates from the typical or expected values within the dataset. It is an observation that lies far away from most of the data points and does not conform to the general patterns or trends present in the dataset.
Example: Consider a dataset of housing prices based on factors such as location, size, and number of bedrooms. In this dataset, an outlier could be a property with an extremely high price that does not align with the average price range of similar properties. This outlier might be an exceptional case, such as a luxury mansion in an otherwise average neighborhood, or it could be a data entry error.
Metrics in Literature: In their research, Bors et al. (Bors et al., 2018) discuss the concept of plausibility as a metric to identify outliers in datasets for AI applications, which can disrupt statistical analyses and modeling. To quantify the number of outliers, data analysts employ two main approaches: non-robust statistics and robust statistics. On the one hand, non-robust statistics involve using the mean and standard deviation to identify entries that deviate significantly from the mean. On the other hand, robust statistics use the median and the robust interquartile range estimator, which are more resistant to outliers. Li et al. (Li et al., 2021) further explore the standard deviation and interquartile range-based outlier detection methods in their study.
Breunig et al. (Breunig et al., 2000) introduce the Local Outlier Factor (LOF) as a metric for identifying outliers in a dataset. LOF quantifies the level of being an outlier for each data instance by considering the density of the dataset’s distribution. Outliers are expected to have lower local densities compared to their surrounding instances. The LOF algorithm computes the LOF value for a specific instance by comparing the density of that instance’s neighborhood with its neighboring instances, where the neighborhood is defined by a user-defined parameter (e.g., number of nearest neighbors). Higher LOF values indicate a higher probability of an instance being an outlier, implying a notably lower density in its local neighborhood than neighboring data points. The LOF approach is flexible and adaptable, incorporating distribution density information to effectively identify outliers not detectable by other methods based solely on statistical measures or global properties of the data. Building on this foundation, Pokraja et al. (Pokrajac et al., 2007) introduced the ILOF (Incremental Local Outlier Factor) method, which uses the LOF (Local Outlier Factor) metric to determine if a new data point is an outlier. By analyzing the computed LOF value, the ILOF method assigns a score to the incoming sample, indicating whether it is classified as an outlier or not. This approach allows for real-time outlier detection and updates the scores of existing points to reflect the impact of the new data point.
Degirmenci et al. (Degirmenci and Karal, 2021) introduce the RiLOF method, which addresses limitations in existing statistical outlier detection techniques by introducing the MoNNAD (Median of Nearest Neighborhood Absolute Deviation) metric. This metric is calculated as the median of the absolute variances among the LOF values of the -nearest neighboring data points and the LOF value of a given sample. This score indicates how much the sample deviates from its local neighborhood. In the RiLOF method, the MoNNAD score is used to label and score query samples. Samples are categorized as outliers when their MoNNAD scores are equal to or greater than a specified threshold value. Unlike traditional techniques, the RiLOF method assigns more importance to the query sample, resulting in clearer differentiation between inliers and outliers. The study demonstrates that the MoNNAD metric, incorporated in the RiLOF method, successfully detects outliers, including outlier clusters, that other techniques fail to recognize.
The GESD (Generalized Extreme Studentized Deviation) technique, as introduced by Rosner et al. (Rosner, 1983), and the MAD (Median Absolute Deviation) technique, proposed by Leys et al. (Leys et al., 2013), are both outlier detection methods that share similarities in their underlying principles. Both techniques aim to identify outliers within datasets by using statistical measures to assess the deviation of data points from central tendencies. GESD identifies outliers by evaluating the maximum absolute difference between each sample and the dataset’s mean, while normalizing it by the standard deviation. MAD identifies outliers by considering the median of absolute differences between data records and the dataset’s median, incorporating a constant associated with the assumption of data normality. Additionally, the Z-score method aligns with this principle by normalizing sample values using the mean and standard deviation or MAD. The robust Z-score version, introduced by Rousseeuw et al. (Rousseeuw and Hubert, 2018), substitutes the median and MAD for more resilient measures, demonstrating the shared concept of using statistical measures to detect outliers in datasets.
Gupta et al. (Gupta et al., 2021) contribute to outlier detection by introducing a new metric in their toolkit, which is designed to pinpoint and eliminate outliers within the dataset. The metric uses an approach for detecting outliers and provides an aggregate score between 0 and 1 to quantify the presence of outliers. A score of 1 indicates that there are no outliers. Additionally, the metric provides the exact indices of the outlier samples, facilitating easy removal and complementary remediation. By incorporating outlier detection, Gupta et al. offer a comprehensive solution for flagging and handling outliers, enhancing the quality and reliability of the dataset for improved model training.
Summary: Outliers are data points that deviate significantly from most of the dataset and do not follow the general patterns. Different metrics and techniques have been proposed to identify and measure outliers in datasets. These include measures based on column heterogeneity, statistical measures like median, standard deviation, mean, and interquartile range, and techniques such as Local Outlier Factor (LOF), Generalized Extreme Studentized Deviation (GESD), Z-score.
4.1.3. Mislabeled Data
Mislabeled data in the context of preparing a dataset for AI refers to instances or data points with incorrect or inaccurate labels. It represents a form of labeling error or inconsistency within the dataset, where the assigned labels do not align with the true or expected labels.
Example: Consider a dataset for email spam classification, where each email is labeled as either “spam” or “not spam”. If some emails are mistakenly labeled as “not spam” when they should have been labeled as “spam”, or vice versa, it introduces mislabeled data. In this case, the mislabeled instances create discrepancies between the assigned labels and the actual content or characteristics of the emails.
Metrics in Literature: Gupta et al.’s (Gupta et al., 2021) data quality toolkit introduces the label purity metric that evaluates the effect of inducing random noise on the performance of a classifier trained on the dataset. In the example provided in the study, random noise is introduced to datasets from UCI (Dua et al. (Dua and Graff, 2017)) and Kaggle ((Kag, nd)) repositories, and the performance of an AutoAI classifier (Liu et al. (Liu et al., 2020)) is measured using 3-fold cross-validation. The results show a drop in classifier performance after inducing noise, with varying degrees of decrease observed across the datasets. The label purity metric assigns a quality score to indicate the presence of noise in the data, where a score of represents an absence of noise. It also highlights the indices of noisy samples and suggests correct labels for them.
In evaluating the accuracy of labels assigned by multiple annotators, Cohen’s Kappa (Cohen, 1960) is widely employed for assessing inter-rater reliability, especially with categorical or binary labels. Cohen’s Kappa calculates the agreement beyond chance, ranging from -1 to 1, where values near 1 indicate substantial agreement. Lavitas et al. (Lavitas et al., 2021) contribute a credibility metric, assessing the likelihood of correct annotations based on multiple reviewers’ agreement. The metric ranges from to 1, reflecting high credibility with close agreement and lower credibility with less consensus among reviewers, offering insights into the reliability of the annotation process involving multiple reviewers.
Summary: Mislabeled data refers to instances in a dataset that have inaccurate labels, creating discrepancies between assigned labels and the true or expected labels. Available approaches include a label purity metric for classifying performance under induced noise, label agreement among annotators, and credibility metric through reviewer consensus.
4.1.4. Duplicity
Refers to the presence of duplicate or redundant instances or records within a dataset. It occurs when the same or very similar data entries appear multiple times, potentially skewing the analysis or modeling process.
Example: Consider a dataset of customer transactions where each entry represents a purchase made by a customer. Suppose there are duplicate records in the dataset. In that case, a particular transaction is represented more than once, leading to an over-representation of that specific transaction in the analysis. This duplication can distort the patterns, statistics, or relationships derived from the data, potentially affecting the accuracy and effectiveness of AI models trained on such a dataset.
Metrics in Literature: Bors et al. (Bors et al., 2018) propose a mechanism to identify duplicate entries in a dataset using a scoring system based on uniqueness. The user selects one or more columns in the dataset that are expected to have unique combinations of values. The system assigns a score of (true) to values with a unique combination in the selected columns and a (false) score to values found multiple times. By incorporating this score, the system effectively flags duplicate entries in the dataset. This scoring system provides a way to distinguish between unique and duplicate values, contributing to data quality in AI applications where the accurate identification of duplicates is essential.
Elmagarmid et al. (Elmagarmid et al., 2007) conducted a comprehensive survey exploring various similarity metrics for duplicate detection, addressing challenges in handling typographical variations in string data. One of the highlighted character-based similarity metrics in the survey is the Levenshtein distance metric (Levenshtein, 1965). This metric measures the number of operations needed to transform one string into another through edit operations (insertion, deletion, and character replacement). Waterman et al. (Waterman et al., 1976) introduced the Affine Gap Distance metric as a solution to the limitations of the standard edit distance metric in matching shortened or truncated strings. It introduces two edit operations: open and extend the gap. An open gap marks the beginning of a gap in sequence alignment, representing missing or deleted characters. In contrast, an extended gap prolongs an existing one, accommodating consecutive missing characters. This metric allows for smaller penalties for gap mismatches, resulting in more accurate measurements for truncated or shortened strings. Additionally, Jaro’s distance metric (Jaro, 1976) quantifies the similarity between two strings by identifying common characters that appear at the same positions in both strings and counting the number of transpositions. The Jaro metric is calculated using a formula that considers the number of shared characters, the lengths of the strings, and the number of transpositions. Monge et al. (Monge and Elkan, 1996) introduced a token-based similarity metric designed to detect duplicates in text fields using atomic strings. Atomic strings are identified by punctuation characters, acting as delimiters, and consist of alphanumeric characters as individual units within the text fields. Two atomic strings are considered duplicates if they are either identical or if one is a prefix of the other. This approach helps identify duplicates in text fields by considering matching atomic strings and provides a similarity score to assess the degree of duplication between fields.
The Soundex algorithm, introduced by Russell et al. (Russell, 1922), is a phonetic coding scheme used to detect duplicates by comparing the phonetic similarity of surnames. The algorithm transforms surnames into codes based on rules of phonetic similarity. It preserves the initial letter of the surname as the prefix letter and assigns codes to each remaining letter according to specific phonetic groups. Vowels act as separators between consecutive consonants. Consecutive occurrences of the same code are consolidated, and if the resulting code has fewer than three characters, zeros are added as padding. By applying the Soundex algorithm, surnames are encoded into phonetic codes that capture their phonetic similarities, enabling the detection of similar-sounding surnames indicating potential duplicates.
Gupta et al. (Gupta et al., 2021) further enhance data readiness with their duplicate record detection metric in the toolkit. This metric aims to address the negative implications of data duplicates, such as resource wastage and data imbalance. Like other metrics in the toolkit, it provides a quality score ranging from to , with a score of indicating an absence of duplicates. The toolkit offers a remediation process that removes these duplicate records, ensuring clean data. Leveraging the “duplicated” function from the Pandas library (Wes McKinney, 2010), this metric provides a practical approach for identifying and resolving duplicate records.
Summary: Duplicity refers to the presence of duplicate or redundant instances in a dataset, which can distort analysis and modeling. Bors et al. propose a uniqueness-based scoring system to flag duplicates. Various similarity metrics are introduced, including Levenshtein distance, Affine Gap Distance, Jaro’s distance, Monge et al.’s token-based algorithm, and the Soundex phonetic coding scheme. Gupta et al.’s toolkit provides a duplicate record detection metric that quantifies duplicate extent and offers a practical removal process.
4.1.5. Feature Relevancy
Feature relevance refers to identifying and selecting the most informative and significant features or variables that contribute to the model’s predictive power. In a dataset, various features or variables are typically collected for each instance, representing different aspects or characteristics of the data. However, not all features may be equally relevant or valuable for the AI model. Feature relevance aims to identify the subset of features that are most influential in making accurate predictions or capturing the underlying patterns in the data.
Example: Consider a dataset for predicting house prices. The dataset may include the number of bedrooms, square footage, location, and proximity to amenities. In this case, feature relevance or selection would involve analyzing the relationship between each feature and the target variable (house prices) to determine which ones have the strongest correlation or impact on the predictions. Features that are found to have weak or negligible influence can be excluded, resulting in a more concise and informative feature set.
Metrics in Literature: The column heterogeneity measure proposed by Dai et al. (Dai et al., 2006) uses soft clustering techniques and mutual information to quantify the relevancy of features in a dataset. Soft clustering assigns fractional memberships to data points across multiple clusters, allowing for a more nuanced representation of underlying patterns. Mutual information is used to measure the dependence between feature values and soft clustering results, capturing the association between them. The computed mutual information values are then used to derive column heterogeneity scores for each feature, indicating relevancy and diversity. Features with higher scores are considered more informative and likely to contribute significantly to AI tasks.
The survey by Li et al. (Li et al., 2017) collectively explores similarity-based feature selection metrics including Laplacian Score, SPEC, Fisher Score, Trace Ratio, and ReliefF. The Laplacian Score algorithm by He et al. (He et al., 2005) constructs affinity and Laplacian matrices to gauge similarities and differences among data points, producing scores that prioritize features capturing underlying data structures. SPEC, an extension of Laplacian Score, introduced by Zhao et al. (Zhao and Liu, 2007), emphasizes alignment with data structure through spectral analysis, adapting to unsupervised and supervised scenarios. On the other hand, Duda et al’s (Duda et al., 2012) Fisher Score emphasizes comparability within classes and distinctiveness between classes, while the Trace Ratio criterion by Nie et al.(Nie et al., 2008) and ReliefF algorithm by Robnik-Sikonja et al. (Robnik-Šikonja and Kononenko, 2003) emphasize within-class similarity and between-class dissimilarity. Collectively, these algorithms highlight the significance of exploiting data relationships and class structures.
Li et al. (Li et al., 2017) focus on information-theoretical-based feature selection methods, including Mutual Information Maximization (MIM) (Lewis (Lewis, 1992)). MIM relies on the concept of entropy to evaluate the significance of features by measuring the reduction in uncertainty they bring to a classification task. MIM evaluates each feature’s significance based on its correlation with class labels, aiming to identify features strongly associated with the target variable. Features with higher Mutual Information (MI) scores are considered more informative and are selected until the desired number of features is reached.
Li et al. (Li et al., 2017) comprehensively survey prominent statistical-based methods, outlining their roles and applications. Among these techniques, the Low Variance method measures feature relevance by evaluating variances and removing features with variances below a specified threshold. In binary classification, the T-Score method, proposed by Davis et al. (Davis and Sampson, 1986), quantifies a feature’s capacity to differentiate classes by calculating T-scores based on class means and standard deviations, with higher scores indicating stronger discriminatory power. Conversely, the Chi-Square Score method, introduced by Liu et al. (Liu and Setiono, 1995), assesses feature-class independence through an independence test derived from differences between observed and expected frequencies. Gini Index (Gini, 1912) evaluates a feature’s partitioning potential across different classes, using class probabilities, considering how effectively its values divide the dataset. Another method, CFS (Correlation-based Feature Selection) by Hall et al. (Hall and Smith, 1999), evaluates feature subsets worth using a correlation-based heuristic. The CFS score balances predictive power with redundancy, using symmetrical uncertainty to assess feature correlations.
Gupta et al. (Gupta et al., 2021) have showcased the practical application of the feature relevance metric as a valuable data readiness measure in their data quality toolkit. This metric effectively evaluates the importance of each feature and assigns a relevance score to rank them accordingly. The quality metric component of this measure plays a pivotal role in identifying and suggesting the elimination of less relevant features, ensuring that only the most pertinent ones are retained for subsequent classification tasks.
Summary: Feature relevancy helps identify and select the most informative and significant features that contribute to the predictive power of AI models. Dai et al. introduce a column heterogeneity measure using soft clustering and mutual information. Li et al.’s survey explores similarity-based, information-theoretical, and statistical methods. These include Laplacian Score, SPEC, Fisher Score, Trace Ratio, ReliefF, Mutual Information Maximization (MIM), Low Variance, T-Score, Chi-Square Score, Gini Index, and CFS. Gupta et al.’s toolkit offers a feature relevance metric that assigns scores, aiding in feature selection for optimized model performance.
4.1.6. Class Imbalance
Class imbalance in the context of AI-ready data refers to a situation where the distribution of instances among different classes in a dataset is significantly skewed or uneven. It means that one or more classes have a much larger number of instances than others, leading to an imbalanced representation of the classes.
Example: Consider a dataset for customer churn prediction in a telecommunications company. The dataset contains information about customer attributes such as age, gender, usage patterns, and whether or not the customer churned. In this case, the positive class refers to the smaller group or category within the dataset, consisting of customers who churned, while the negative class denotes the larger group or category in the dataset, consisting of customers who did not churn. If only 5% of the instances belong to the positive churn class, while the remaining 95% belong to the negative non-churn class, it indicates a severe class imbalance.
Class imbalance can pose challenges during AI model training and evaluation. Models trained on imbalanced data tend to prioritize the majority class, resulting in poor performance for the minority class. In the customer churn example, an imbalanced dataset may lead to a model that performs well in predicting non-churn instances but performs poorly in identifying churn instances, which are often the class of interest.
Metrics in Literature: The Individual Bayes Imbalance Impact Index (IBI3), introduced by Lu et al. (Lu et al., 2019) assesses the impact of class imbalance on individual samples, providing insights into potential biases and dataset limitations. IBI3 quantifies the difference in posterior probabilities between balanced and imbalanced scenarios, revealing how class imbalance influences classification outcomes. It requires trained models and estimation of posterior probabilities to calculate, making it essential to have access to both for an accurate assessment. IBI3 measures the influence of class imbalance on classification outcomes for each minority class sample, with lower values indicating less impact and higher values indicating a more significant impact.
The Imbalance Ratio (IR), introduced by Francisco et al. (Alberto et al., 2018), is a widely used metric to quantify the level of class imbalance in a dataset, especially in binary classification problems. It provides a numerical representation of the discrepancy between the majority class instances and minority class instances in the dataset. The IR is calculated by dividing the count of instances in the majority class () by the count of instances in the minority class (). A higher IR indicates a more imbalanced dataset with a significant disparity between class frequencies, while a lower IR suggests a relatively balanced or less imbalanced dataset.
Ortigosa-Hernández et al. (Ortigosa-Hernández et al., 2017) propose the Imbalance Degree (ID) as an advanced metric to measure class imbalance, considering specific characteristics of the class distribution for a more accurate representation. Despite its advantages, ID has drawbacks, such as sensitivity to the choice of distance function and potential unreliability in extreme cases. In contrast, Zhu et al. (Zhu et al., 2018) introduce the Likelihood Ratio Imbalance Degree (LRID) as a novel metric that overcomes ID limitations. LRID uses the likelihood ratio (LR) test, providing a high-resolution measurement of imbalance by comparing empirical class distribution to a balanced distribution. LRID offers insights into the deviation from balance, aiding researchers in making informed decisions on data preprocessing to mitigate imbalance’s impact on AI model performance.
In addition to LRID, Gupta et al. (Gupta et al., 2021) propose the class parity metric, which considers various data properties, including the imbalance ratio, dataset size, and proportion of difficult samples in the extreme minority class. By analyzing these factors, data scientists can gain a comprehensive understanding of class imbalance in the dataset and apply remedial re-sampling strategies to balance the data effectively.
Summary: Class imbalance in AI-ready data is assessed using metrics like Imbalance Ratio (IR), with Imbalance Degree (ID) offering nuanced measurements. Likelihood Ratio Imbalance Degree (LRID) provides high-resolution assessment through the likelihood ratio test. Gupta et al.’s class parity metric considers imbalance ratio, dataset size, and difficult samples for comprehensive evaluation and mitigation.
4.1.7. Class Separability
In the context of AI, it refers to the degree of similarity or shared characteristics between different classes or categories within the dataset. It indicates how much the data points from different classes overlap or share common features, making it challenging for an AI system to distinguish between them accurately.
Example: Consider a facial recognition dataset consisting of two classes: “smiling” and “not smiling.” The overlap in this dataset refers to the extent to which the facial features of individuals in the “smiling” class overlap with those in the “not smiling” class. If the dataset contains many instances where individuals in both classes have similar facial expressions or features, it indicates a high overlap. In this case, it becomes more difficult for the AI system to correctly classify whether a person is smiling or not based solely on facial features.
Metrics in Literature: Gupta et al.’s data quality toolkit introduces a class overlap metric, which identifies and quantifies overlapping regions among different classes in a dataset, analyzing data points residing in overlapping regions of the data space. Additionally, the evaluation of class overlap in imbalanced classification settings is addressed through metrics such as the -value and augmented -value. Sejong’s (Oh, 2011) -value assesses the extent of overlap between classes by considering the proportion of instances in a specific class located in regions of the feature space shared with instances from other classes. Borsos et al. Borsos et al. (Borsos et al., 2018) enhance this approach with the augmented -value, which incorporates the dataset’s imbalance ratio (IR), providing a weighted measure that combines class overlap and dataset imbalance for a more comprehensive understanding.
Summary: Class separability pertains to the level of similarity among diverse classes in a dataset. Gupta et al.’s data quality toolkit introduces a metric to detect overlapping areas between classes, assessing data points that are close yet belong to different classes. The R-value is a measure proposed to quantify the degree of overlap in imbalanced classification problems. By considering the R-value of each class and the dataset’s imbalance ratio, an augmented R-value can be calculated, providing a more comprehensive measure of overlap.
4.1.8. Discrimination Index
Mitigating discrimination in data refers to the process of understanding and addressing potential biases or discriminatory outcomes that may arise when using data in AI systems. It involves recognizing and mitigating unfairness or unjust treatment towards certain individuals or groups that may be encoded or perpetuated in the data used to train or deploy AI models.
Example: An example to illustrate fairness awareness in data for AI is in the context of hiring practices. Consider a company that uses an AI system to screen job applicants based on their resumes. The AI model is trained on historical data of successful candidates and their qualifications. However, suppose the historical data is biased and reflects discriminatory practices, such as favoring candidates from certain gender or ethnic groups. In that case, the AI model may inadvertently perpetuate those biases and lead to unfair outcomes in the hiring process.
Metrics in Literature: The Difference metric, introduced by Azzalini et al. (Azzalini et al., 2022), assesses the degree of unethical behavior or bias within a dependency by comparing the confidence of that dependency with and without consideration of sensitive attributes. A higher Difference value indicates a stronger indication of unfair behavior, with the support of the Approximate Conditional Functional Dependency (ACFD) also factored in. Additionally, the authors propose the P-Difference metric to address dependencies involving multiple sensitive attributes, measuring unfairness tied to specific attributes. The P-Difference gauges the impact on dependency confidence by excluding one sensitive attribute at a time, highlighting influential attributes contributing to unfairness.
Feldman et al. (Feldman et al., 2015) introduce the “Likelihood Ratio” () metric to measure disparate impact in a dataset, calculated based on sensitivity and specificity. It assesses the impact of the protected class on classification outcomes, but it requires a model trained on the dataset to generate results. Celis et al. (Celis et al., 2020) contribute two metrics for measuring discrimination based on sensitive attributes: the ”representation rate” quantifies fairness in representing different attribute values, assessing the ratio’s adherence to a threshold, while the ”statistical rate” evaluates fairness through conditional probabilities of class labels given attribute values, identifying potential discrimination. These metrics provide tailored quantitative fairness evaluation, offering flexibility based on specific application requirements.
Simonetta et al. (Simonetta et al., 2021) introduce two distinct metrics that contribute to assessing fairness, bias, and completeness in AI-ready datasets. The first metric, a “combinatorial metric,” evaluates dataset completeness by focusing on the distinct combinations of categories within specific columns. It quantifies completeness by comparing the total count of unique data points to the expected number of distinct combinations. This metric provides insights into how well the dataset represents the full spectrum of category combinations. In contrast, the second metric, rooted in “frame theory,” offers a sophisticated approach to measuring fairness and bias. It treats the dataset as a matrix and applies operations to analyze the distribution of vectors within the matrix. Eigenvalues obtained from this matrix assessment gauge the tightness of the frame, with uniform eigenvalue distribution indicating a balanced dataset. The Gini-Simpson index ((Simpson, 1949)) is used to further assess balance and homogeneity. The difference lies in the focus: the combinatorial metric targets the representation of distinct combinations, while the frame theory-based metric centers on the overall distribution and balance of the dataset’s vectors.
The Amazon SageMaker Developer Guide (Kemka, 2019) introduces the demographic disparity metric (DD) to assess imbalanced proportions of accepted and rejected outcomes within demographic facets as a pre-training data bias measure. The conditional form (CDD) addresses Simpson’s paradox by analyzing subgroups, revealing apparent imbalances. In contrast, Gupta et al.’s data quality toolkit presents a disparate impact measure to quantify group discrimination, offering a score for assessing fairness. The toolkit includes remediation strategies to mitigate bias in data and its impact on AI model applications, enhancing group fairness.
Summary: The discrimination index allows analysts to quantify and measure biases or discriminatory outcomes encoded in the data used for training and deploying AI models. The metrics such as the Difference metric, P-Difference metric, Likelihood Ratio (), representation rate, statistical rate, completeness metric, and frame theory-based metrics, provide quantitative measures to detect and evaluate unfairness, disparate impact, and discriminatory behavior in the dataset.
4.1.9. Data Split Ratio
Optimal data splitting in the context of AI involves dividing a dataset into training, validation, and testing subsets to maximize the performance and generalization of the AI model. The goal is to allocate the appropriate proportions of data for effective model training, hyperparameter tuning, and unbiased evaluation.
Example: In the context of sentiment analysis, consider a dataset of 10,000 customer reviews to build an AI model for predicting whether a review is positive or negative. To ensure the best performance and generalization of the model, the dataset could be divided into three subsets. The training set comprises 7,000 instances, accounting for 70% of the data, allowing the model to learn and capture underlying patterns and relationships in the reviews. For fine-tuning and hyperparameter selection, 1,500 instances are allocated (15% of the data) to the validation set. This smaller subset helps optimize the model’s performance during training. Lastly, 1,500 instances (15% of the data) are set aside for the testing set. This subset consists of unseen reviews and objectively evaluates the model’s performance, ensuring its ability to generalize effectively to new and real-world instances. By splitting the dataset in this manner, one can ensure that the AI model is trained on diverse and representative data, fine-tuned for optimal performance, and tested on unseen instances, enabling a robust sentiment analysis system.
Metrics in Literature: Affendras et al. (Afendras and Markatou, 2019) suggests that irrespective of data distribution or analytic task, the optimal training sample size in cross-validation is identified as half of the total sample size. Building on this, Joseph (Joseph, 2022) examines the ideal data splitting ratio for training and validation sets in linear regression models. The authors propose a ratio of , where is the number of parameters required to estimate a well-fitting linear regression model accurately. The authors also present a practical strategy for determining using variable selection methods. It suggests that this approach can be useful for regression and classification tasks.
Summary: The data split ratio, crucial for optimizing AI model performance, entails dividing a dataset into training, validation, and testing subsets. Affendras et al. suggest a guideline, proposing the training set to be half of the total dataset. With metrics like the ratio guides to ideal splits in linear regression models.
4.1.10. Data Point Impact
It refers to the measure of the influence or significance of individual data points within a dataset in the context of AI. It quantifies the extent to which each data point contributes to an AI model or system’s overall performance, accuracy, or behavior.
Example: Consider a dataset containing medical records of patients. Each data point represents a patient’s age, medical history, symptoms, and diagnostic outcomes. By analyzing the data point impact, we can determine which specific patient records have a higher influence on the predictions or outcomes of an AI model built for disease diagnosis.
Consider a machine learning model trained to predict the likelihood of a patient having a specific medical condition based on the dataset. By calculating the data point impact, we can identify the patient records with the most significant effect on the model’s predictions. These influential data points could correspond to patients with rare symptoms or unique characteristics that strongly impact the model’s decision-making process.
Metrics in Literature: Ghorbani et al. (Ghorbani and Zou, 2019) introduced the Data Shapley metric, based on the Shapley value from cooperative game theory, to assess the value of individual data points in supervised machine learning. The metric measures the contribution of each data point to the model’s predictions, revealing its importance in model training. Various techniques, such as Monte Carlo and gradient-based methods, estimate a data point’s value by considering its combinations with different subsets of the training data. Similarly, Wang et al. (Wang and Jia, 2023) propose the Banzhaf value, a metric to assess data point value in the presence of noisy model performance scores. The authors investigate the robustness of data valuation in stochastic gradient descent, where randomness can lead to inconsistent data value rankings.
Summary: Data point impact refers to the measure of the influence or significance of individual data points within a dataset. One commonly used metric to evaluate data point impact is the Data Shapley metric. It calculates the value of individual data points based on their contribution to the model’s predictions. The Banzhaf value is another metric that addresses the challenge of noisy model performance scores and provides robust differentiation of data quality in stochastic machine learning algorithms.
4.1.11. Correctness
In the context of data values for AI, it refers to the degree of accuracy and fidelity in representing real-world information. It measures how closely the recorded data values align with the actual values they intend to represent. The goal is to minimize discrepancies, errors, or deviations between the recorded data and the ground truth.
Example: Consider a dataset containing temperature measurements from weather stations. The correctness of data values would involve ensuring that each recorded temperature value accurately reflects the actual temperature at the corresponding location and time. Variations, inconsistencies, or inaccuracies in the recorded values compared to the actual temperature values would indicate a lack of correctness in the dataset.
Metrics in Literature: Pipino et al’s(Pipino et al., 2002) correctness metric quantifies data accuracy by calculating the complement of the error ratio. It emphasizes clear criteria, like precision levels, and acknowledges contextual variations in error tolerability for a systematic evaluation of data correctness. Similarly, Kaiser et al. (Kaiser et al., 1970) involves comparing attribute values in the dataset () with their corresponding values in the real world (). A domain-specific distance function, denoted as , quantifies the difference between these attribute values. The metric’s objective is to ensure normalization within the interval [0, 1] without using a quotient.
Summary: Correctness, in the context of data values for AI, refers to the accuracy and fidelity of the recorded data in representing real-world information. They involve calculations related to error ratios, precision criteria, contextual error tolerability, and comparisons between dataset attribute values and their real-world counterparts.
4.1.12. Timeliness
The timeliness of data refers to the recency and relevance of the data in relation to the current state of the phenomenon or domain it represents. It measures how closely the data captures the most recent information available at the time of analysis or model training, ensuring that the data is up-to-date and reflects the present conditions.
Example: Consider an AI system that predicts product demand for an e-commerce company. Timeliness of the data used for training the model would involve using the most recent sales data, customer preferences, and market trends. If the dataset contains sales data from several months ago, it may not accurately capture the current demand patterns and consumer behavior. By ensuring timely data, such as incorporating daily or weekly sales updates, the AI model can better adapt to the changing market dynamics and provide more accurate demand predictions.
Metrics in Literature: Two studies, one by Kaiser et al. (Kaiser et al., 1970) and the other by Heinrich et al. (Heinrich and Klier, 2015), introduce data readiness metrics for evaluating the timeliness of attribute values. Both metrics use probability-based approaches to assess the freshness and relevance of data. Kaiser et al.’s metric employs an exponential distribution model to calculate attribute decline rates, indicating the average proportion of outdated attribute values within a specified time frame. It quantifies attribute age based on data quality assessment time and data acquisition time, offering an automated and interpretable measure of timeliness. In contrast, Heinrich et al. propose a probability-based currency metric (PBCM) that assesses data item timeliness using a set of probabilities. These probabilities are derived from diverse data sources and methods, including expert assessments, historical data analysis, and machine learning algorithms. The PBCM combines these probabilities using a weighted average formula to generate an overall score, with weights determined by context and importance. While both metrics share a foundation in probability theory, Kaiser et al.’s metric focuses on attribute-level timeliness. In contrast, Heinrich et al.’s PBCM assesses data item timeliness, offering flexibility for various data types and contexts.
Blake et al. (Blake and Mangiameli, 2011) propose a method to assess data timeliness using a classification model. They introduce a metric called , which measures the impact of introducing new and more current data into the dataset. To evaluate data volatility and timeliness, the authors replace a percentage of old instances with new ones in the training data while assuming a fixed currency. The metric is computed based on the total quantity of records in the training and test data and the number of replacement records introduced for reclassification. This metric provides valuable insights into the timeliness of data and its impact on the performance of the classification model.
Summary: The timeliness metric for data readiness in AI assesses the recency and relevance of the data about the current state of the phenomenon or domain it represents. Kaiser et al. and Heinrich et al. introduced metrics for assessing data timeliness. Both use probability-based approaches, with Kaiser et al. focusing on attribute-level timeliness and Heinrich et al. assessing data item timeliness. Another method by Blake et al. evaluates data timeliness through a classification model by assessing data replacement’s impact on model performance.
4.1.13. Privacy Leakage
Data privacy in the context of AI refers to protecting and preserving sensitive information contained within datasets, particularly concerning the risk of unauthorized disclosure or inference of private details. One notable technique used to assess privacy is Membership Inference Attacks (MIA).
Membership Inference Attacks involve determining whether a specific data record was included in the training dataset used to build an AI model. By exploiting patterns and characteristics of the model’s outputs, one can infer whether or not a particular data point was part of the training set. This raises concerns about the privacy of individual data records and the potential for unauthorized access to such information.
Example: Consider a healthcare dataset used to train a machine-learning model for disease diagnosis. The dataset contains sensitive medical information about patients, including their symptoms, test results, and diagnoses. Suppose one can successfully perform a membership inference attack on this model. In that case, one may determine whether a specific patient’s data was used during training, posing a significant privacy risk as it could reveal a patient’s medical condition or other confidential information.
Metrics in Literature: The focus of Vatsalan et al.’s (Vatsalan et al., 2022) work centers on mitigating re-identification risks in released datasets within the education sector. In contrast to existing approaches that often presume prior knowledge, the proposed method employs a Markov Model to quantify re-identification risks by leveraging all available information in the datasets, including event-level details associating multiple records with the same individual and exploring correlations between attributes.
In the broader context of privacy metrics in literature, the study positions itself alongside notable works such as SHAP R introduced by Duddu et al. (Duddu et al., 2022) and Song et al.’s (Song and Mittal, 2021) privacy risk metric. SHAP R quantifies the susceptibility of individual training data records to membership inference attacks by calculating Shapley values, emphasizing the influence of specific data points on model predictions. In contrast, Song et al.’s metric assesses the likelihood of a data record being present in a model’s training dataset, focusing on evaluating the privacy risk from an adversarial perspective. Both metrics aim to address privacy concerns by assessing the privacy risks associated with data records, with their applicability tied to a specific AI model.
In another study, Carlini et al. (Carlini et al., 2022) introduced the Attack Success Rate (ASR) as a metric for privacy leakage. ASR measures the success of an attack in predicting if a specific example is part of the training dataset. It is calculated by training a model, performing an attack, and evaluating the attack’s success in correctly predicting membership. However, ASR can only be measured after training a model and conducting an attack. Alongside these contributions, entropy-based metrics, demonstrated by Bezzi (Bezzi, 2007), Longpr ’e et al. (Longpré et al., 2017), and Sevgi et al. (Arca and Hewett, 2020) offer valuable insights into dataset anonymity by leveraging entropy to measure unpredictability and disorder in released data.
Summary: The privacy leakage metric in AI aims to safeguard sensitive information from unauthorized disclosure. Vatsalan et al. employ a Markov Model to address re-identification risks, while SHAP R quantifies membership privacy risk using Shapley values. Attack Success Rate (ASR) gauges privacy leakage in membership inference attacks. Entropy-based metrics are also explored for assessing dataset anonymity.
4.1.14. Sample Size
In the context of AI, it refers to the number of data points or instances selected from a population to be included in a dataset for analysis or training. It represents the subset of data used to make inferences or predictions.
Example: Consider a medical research study to predict a particular disease’s likelihood based on various patient characteristics. The researchers collected data from 500 patients, including their age, gender, medical history, and test results. In this case, the sample size of the dataset would be 500, indicating that the analysis or model development is based on these 500 patient records.
The sample size is essential in AI as it can affect the statistical power, generalizability, and reliability of the results or models. A larger sample size generally provides more representative and reliable insights, while a smaller sample size may introduce higher uncertainty or limitations in the analysis.
Metrics in Literature: In their study, Alwosheel et al. (Alwosheel et al., 2018) investigate the sample size requirements for accurate decision-making analysis using Artificial Neural Networks (ANNs). They propose a novel guideline called “factor 50,” suggesting that the ideal dataset size for an ANN should be the number of adjustable parameters in the model multiplied by 50, which is more conservative compared to the widely used “factor 10” rule-of-thumb found in the literature (Haykin, 2009). However, determining the appropriate sample size for ANN-based decision-making is complex and depends on the model’s complexity, which is difficult to predict. To address this, the authors propose three approaches: evaluating ex-post if the training sample size was sufficient, using prior studies or literature to estimate the optimal number of neurons, or leveraging existing literature to estimate the expected number of neurons required for the analysis.
Summary: In AI, sample size denotes the quantity of data points chosen from a population for analysis or model training. Alwosheel et al. propose the “factor 50” guideline for determining sample size in decision-making with Artificial Neural Networks (ANNs), contrasting with the commonly used “factor 10”.
4.1.15. FAIRness Score
FAIRness of a dataset for AI refers to the degree to which the dataset adheres to the principles of Findability, Accessibility, Interoperability, and Reusability. A FAIR dataset in the context of AI should be well-documented, easily discoverable, accessible, formatted in a way that facilitates integration and analysis and can be effectively reused for different AI applications.
Example: Consider a FAIR dataset containing information about different types of cars for training an AI model tasked with predicting car prices. The FAIR principles applied to this dataset would resemble:
-
•
Findability: The dataset should be easily discoverable with standardized metadata containing details about car attributes, including make, model, year, mileage, engine type, and other pertinent features. Clear information on the dataset’s source and data collection methodologies is also essential.
-
•
Accessibility: The dataset’s accessibility is crucial, requiring hosting on a publicly available platform or a platform with controlled access, considering privacy or licensing constraints. Secure access should be ensured through proper authentication and authorization mechanisms.
-
•
Interoperability: Ensuring seamless integration with AI systems and tools, the dataset should be structured and formatted according to established standards like CSV or JSON. A well-defined schema must accompany the dataset, specifying the meaning and format of each attribute. This promotes consistency and compatibility across diverse AI models and applications.
-
•
Reusability: The dataset should come with clear usage licenses or permissions that outline how the dataset can be used. Additionally, comprehensive documentation should accompany the dataset, providing details about data collection procedures, preprocessing steps (such as data cleaning or feature engineering), and any potential biases or limitations in the data.
By following these FAIR principles, the structured dataset of car information becomes a valuable resource for AI researchers and practitioners, facilitating the development of accurate car price prediction models and promoting transparent and ethical AI practices.
Metrics in Literature: In their work, Wilkinson et al. (Wilkinson et al., 2018) introduced a comprehensive FAIRness measurement framework, aligning with the four FAIR sub-principles. The framework includes 14 universal metrics, corresponding to specific sub-principles, covering aspects such as identifier schemes, metadata accessibility, findability, access protocols, metadata longevity, knowledge representation languages, linking, adherence to standards, and provenance. This flexible approach, applicable across scholarly domains, facilitates the objective assessment and improvement of FAIRness in various digital resources. In a similar framework introduced by Clarke et al. (Clarke et al., 2019), FAIR metrics and FAIR rubrics play a key role, allowing users to associate digital resources with existing metrics. The authors emphasized the manual or automated quantification of FAIR metrics and contextual assessments using FAIR rubrics, empowering users to evaluate and enhance data correctness in diverse projects. DataONE(Data Observation Network for Earth) (Jones and Slaughter, 2019) is a community-driven initiative that has adopted metrics to measure FAIRness of research data. Based on the FAIR criteria, the DataONE FAIR suite generates comprehensive assessment scores based on the metadata.
Summary: The FAIRness score, in the context of AI, measures the extent to which a dataset adheres to the principles of Findability, Accessibility, Interoperability, and Reusability. Both Wilkinson et al. and Clarke et al. created frameworks to assess the FAIRness of digital resources, aligned with FAIR sub-principles.
4.2. Unstructured Data
Unstructured data, including textual, image, and audio data, present unique challenges in evaluating and ensuring readiness for AI applications. This section provides a brief overview of the existing metrics and scoring mechanisms employed to assess the suitability of unstructured data for AI. While the evaluation techniques for structured data are well-established, we will highlight the relevant measuring techniques from structured data that can be applied to unstructured data. By examining these evaluation methods, we gain insights into the quality, relevance, and accuracy of unstructured data, enabling us to make informed decisions when using such data in AI models. This exploration will facilitate a deeper understanding of the evaluation process and contribute to effectively integrating unstructured data in AI applications.
4.2.1. Textual Data
Firstly, let us examine some important dimensions of data readiness on textual data and explore the existing metrics and scoring mechanisms outlined in the literature for each dimension.
4.2.1.1 Lexical Diversity
Lexical diversity is a crucial metric for assessing the readiness of textual data for AI applications. It measures the richness, variety, and complexity of the vocabulary used within the text. By quantifying the diversity of word usage, lexical diversity offers insights into the level of linguistic expression, domain coverage, and potential challenges in understanding and processing textual data. A higher lexical diversity score indicates a broader range of words and linguistic patterns, providing a solid foundation for AI to learn from the data.
Example: Consider two datasets: A with a low lexical diversity score and B with a high lexical diversity score. Dataset A comprises repetitive and limited vocabulary, such as a chatbot dialogue focused on a specific topic. The low lexical diversity suggests a constrained range of language, potentially limiting the chatbot’s ability to respond effectively to diverse user inputs. In contrast, Dataset B consists of a collection of news articles from various domains, exhibiting a wide range of vocabulary and language styles. The high lexical diversity in Dataset B indicates a greater readiness for AI applications, as it offers a more comprehensive representation of language usage, enabling models to generalize across different topics and understand a broader array of inputs.
Metrics in Literature: TTR (Type-Token Ratio) introduced by Templin (Templin, 1957) is a metric used to measure lexical diversity in a text. It calculates the ratio of unique word types (vocabulary size) to the total number of tokens (words or other linguistic units) in the text. TTR provides an estimate of the text’s richness and variety of vocabulary. A higher TTR indicates greater lexical diversity, suggesting a more comprehensive range of word usage in the text.
McCarthy et al.’s (McCarthy and Jarvis, 2010) metrics, vocd-D and HD-D, focus on measuring lexical diversity in textual data. vocd-D uses type-token ratios (TTR) from randomly selected text samples to derive a D coefficient, representing lexical diversity. HD-D, on the other hand, employs the hypergeometric distribution to directly calculate the probabilities of word occurrence in randomly selected samples, resulting in the HD-D index. While both metrics assess lexical diversity, vocd-D uses random sampling and the D coefficient, whereas HD-D approximates results for all possible word arrangements. The correlation between HD-D and vocd-D is high, offering alternative perspectives on measuring lexical diversity. Additionally, McCarthy introduces MTLD (Measure of Textual Lexical Diversity) (McCarthy, 2005), which quantifies lexical diversity by considering unique words and segment length. MTLD is beneficial for assessing the lexical diversity of longer texts, providing insights into vocabulary richness throughout the text.
Summary: Lexical diversity, necessary for assessing linguistic richness in textual data for AI, is measured by metrics like TTR and vocd-D, evaluating the ratio of unique word types to total tokens with standardized scores. HD-D offers a probability-based alternative for assessing diversity, while MTLD, dividing text into segments, calculates average segment length where vocabulary richness falls below a threshold.
4.2.1.2 Term Importance
Term importance is used to assess the readiness of textual data for AI applications by evaluating the significance of individual terms within the text. It measures terms’ relevance and impact in capturing the text’s essence and meaning. Term importance considers various factors, such as the frequency of a term within the text, its rarity across the entire dataset or corpus, and its discriminative power in distinguishing the text from others. By assigning weights or scores to terms based on their importance, this metric enables AI models to focus on key terms that carry valuable semantic information and discard less informative or common terms, assisting in feature selection, document ranking, or topic extraction.
Example: In a dataset of news articles, the term “pandemic” might be considered highly important due to its relevance in conveying crucial information about current events. On the other hand, common words like “the” or “and” would be assigned lower importance scores as they provide little discriminative power or unique information. AI models can prioritize and focus on the most significant terms by analyzing term importance, enabling better understanding, classification, or summarization of textual data.
Metrics in Literature: TF-IDF (Term Frequency-Inverse Document Frequency) is a widely used quantitative metric to evaluate the importance of words in a document or collection of documents (Ramos (Ramos et al., 2003), Simha (Simha, 2021), Qaiser et al. (Qaiser and Ali, 2018)). It combines term frequency (TF), measuring word occurrence in a document, and inverse document frequency (IDF), assessing word rarity across the entire corpus. TF-IDF quantifies a word’s significance by considering its frequency in a document and its discriminative power across the corpus. The TF-IDF score is computed by multiplying TF and IDF values for each word. High TF-IDF scores indicate words that are both frequent in a document and rare in the corpus, making them essential for the context. This metric aids in identifying essential features and characteristics, enabling information retrieval, document classification, and keyword extraction in natural language processing.
Summary: Term importance is a metric used to assess the significance of individual terms in textual data for AI applications. TF-IDF is a widely used metric that combines term frequency and inverse document frequency to quantify term importance.
4.2.1.3 Readability Score
The readability score is a quantitative metric used to assess textual data complexity and ease of understanding, enabling effective preparation for AI. It measures various linguistic factors, such as sentence length, word choice, and syntactic structure, to determine the readability of a text. By considering these factors, readability scores provide valuable insights into the suitability of text for different target audiences and applications. AI applications can be optimized by selecting appropriate training data using readability scores, ensuring that the content aligns with the desired level of comprehension and avoids potential barriers to understanding. This metric is important in enabling the development of more accessible and contextually appropriate language models.
Example: Consider a scenario where an AI model is trained to generate educational content for elementary school students. In this case, readability scores can be used to assess the complexity of different texts and select appropriate training data. By analyzing factors such as sentence length, vocabulary difficulty, and grammatical complexity, the readability scores can help identify texts that align with the target audience’s reading abilities. This ensures that the AI model is trained on comprehensible and engaging content for young learners, promoting effective knowledge transfer and enhancing the overall learning experience. The AI model can be fine-tuned by leveraging readability scores to generate age-appropriate and easily understandable educational materials catering to elementary school students’ unique needs and capabilities.
Metrics in Literature: The Flesch-Kincaid Grade Level, introduced by Rudolf Flesch (Flesch, 1986) calculates the approximate grade level needed to comprehend a given text based on the average number of words per sentence and the average number of syllables per word. The resulting score represents the education level required to understand the text, with lower values indicating easier readability. This metric provides a standardized measure for assessing text comprehension and enables content tailoring to suit specific audience reading abilities.
The Coleman-Liau Index, developed by Coleman and Liau (Coleman and Liau, 1975), is another readability scoring method that assesses the reading level of a text based on factors like letter count and sentence length. Unlike the Flesch-Kincaid Grade Level, which considers syllable count, the Coleman-Liau Index calculates the grade level based on the average number of letters per 100 words and the average number of sentences per 100 words. A score of 5 on the index indicates that the text is at a reading level equivalent to that of a fifth grader in the US schooling system. It is widely used in schools and provides a quick measure of readability.
Furthermore, the Gunning Fog Index introduced by Robert Gunning Associates (rea, nd) offers an additional perspective on the readability of textual data for AI model training. Unlike the Coleman-Liau Index and the Flesch-Kincaid Grade Level, which focus on sentence and letter count, the Gunning Fog Index considers both the percentage of complex words and the sentence length. It generates a score between 0 and 20, with lower scores representing easier readability.
Summary: The readability score is a quantitative metric used to assess the complexity of textual data and ease of understanding. Popular readability metrics include the Flesch-Kincaid Grade Level, which calculates the grade level needed to comprehend a text based on average words per sentence and syllables per word. The Coleman-Liau Index assesses reading level based on average letter count and sentence length. The Gunning Fog Index evaluates readability by considering the percentage of complex words and sentence length.
4.2.1.4 Topic Coherence
This measure evaluates the readiness of textual data for AI by assessing the logical and semantic connectedness within a set of topics or a document. It quantifies the degree to which words within a topic exhibit meaningful relationships and contribute to a coherent theme. A higher coherence score indicates stronger semantic coherence, indicating that the words are closely related and provide a clearer understanding of the topic. By evaluating topic coherence, AI practitioners can ensure that the textual data is well-structured, coherent, and ready for AI model training, promoting more accurate and meaningful text generation and facilitating better comprehension and usage of the data by AI algorithms.
Example: Consider a collection of news articles about technology trends. Topic coherence can be measured to evaluate the readiness of this textual data for AI. Data can be segmented into topics like “Artificial Intelligence,” “Blockchain Technology,” and “Internet of Things” by applying topic modeling techniques. Topic coherence analysis assesses the semantic relationships between words within each topic. A high coherence score would indicate that words within a topic, such as “machine learning,” “algorithm,” and “predictive analytics” in the “Artificial Intelligence” topic, are closely related and contribute to a coherent theme. This demonstrates that the textual data is well-prepared for AI, as it exhibits clear and meaningful topic structures, allowing the models to understand better and generate text related to specific technology trends.
Metrics in Literature: The CV coherence score, proposed by R”oder et al. (Röder et al., 2015), is a metric for quantifying topic coherence in text by assessing the semantic similarity between words within a topic. It is computed using techniques like Latent Dirichlet Allocation (Blei et al., 2003) to extract topics from the text and then measures the pairwise word similarity within each topic to evaluate how well the words contribute to a coherent theme. Higher scores indicate stronger semantic relatedness and better topic coherence. Despite its popularity, the CV score has limitations, such as sensitivity to topic size, potential mismatch with human judgment, and inability to capture higher-level coherence aspects.
The UMass coherence score, introduced by Mimno et al. (Mimno et al., 2011), is another metric used to assess the topic coherence of a set of topics extracted from a text corpus. It evaluates coherence by considering the probability of word co-occurrences within topics. The score is computed by summing the logarithm of the co-occurrence probabilities of all word pairs within and across topics. A higher UMass coherence score indicates stronger word co-occurrence patterns and better topic coherence, while a lower score suggests weaker word associations and less coherent topics. Compared to the CV coherence score, the UMass coherence score offers a more reliable evaluation of topic coherence, accounting for topic size, aligning better with human judgment, and directly measuring word co-occurrence probabilities.
Like other coherence scores, the UCI coherence score introduced by Newman et al. (Newman et al., 2010) is a metric used to assess the coherence of topics generated by a topic model. It measures the semantic relatedness and meaningful connections between words within a topic by calculating the semantic association between word pairs based on their co-occurrence in sliding windows. The score is computed using a specific equation considering the probabilities of observing individual words and word pairs in the sliding window. Higher UCI coherence scores indicate stronger associations between word pairs and better topic coherence.
Summary: Topic coherence is a metric used to evaluate the logical and semantic connectedness within a set of topics or a document. Coherence scores, such as the CV coherence score, UMass coherence score, and UCI coherence score, quantify the semantic similarity or word co-occurrence probabilities within topics to assess their coherence. Higher coherence scores indicate stronger semantic relatedness and better topic coherence.
4.2.1.5 Bias Indicator
A bias indicator is a measure used to prepare textual data for AI by quantifying and identifying potential biases in the text. It serves as a tool to assist in detecting and mitigating biased content, ensuring that AI systems can make more informed and fair decisions. The bias indicator analyzes various linguistic and semantic features within the text, such as word choice, sentence structure, and contextual references, to assess the potential presence of biases related to factors like gender, race, religion, or other sensitive attributes. By providing a quantitative assessment of bias, the indicator helps developers and users understand the underlying biases in the data. It enables them to address and mitigate these biases during AI model development, promoting more equitable and unbiased AI systems.
Example: Consider a dataset of job application essays that will be used to train an AI system to evaluate and rank applicants. A bias indicator can be employed to analyze the textual data, ensuring fairness and reducing bias. The indicator would examine language and semantic patterns to identify potential biases, such as gender, race, or age-related biases. For instance, if the indicator detects a bias where certain occupations or characteristics are consistently favored or discriminated against, it would flag it for further examination. This enables developers to address and mitigate biases in the dataset before training the AI model, promoting equal opportunities and minimizing discriminatory outcomes during the evaluation process. The bias indicator plays a crucial role in preparing the textual data, allowing the creation of more objective and unbiased AI systems for job application assessments.
Metrics in Literature: Papakyriakopoulos et al. (Papakyriakopoulos et al., 2020) propose a robust bias measurement technique using word embeddings and cosine similarity calculations. The method involves defining word pairs to represent different types of discrimination and creating a list of concepts for measuring bias. For variable concepts, which change based on social groups, the bias calculation equation considers the cosine similarity between word pair embeddings and concept embeddings. A modified bias calculation equation is used for non-variable concepts, which remain the same irrespective of social groups. By quantifying the differences in cosine distances, the proposed method comprehensively analyzes bias in different contexts, accounting for variable and non-variable concepts.
Summary: A bias indicator is used to quantify and identify potential biases in textual data for AI applications. Papakyriakopoulos et al. introduced a bias indicator that uses word embeddings and cosine similarity calculations.
4.2.2. Multimedia Data
This section will focus on exploring the key aspects of data readiness for image, speech, and video data. Specifically, we will concentrate on quality evaluation metrics for each data type. The reason for this exclusive emphasis on quality evaluation metrics is that they are fundamentally crucial in determining the reliability and usability of data for AI applications.
Quality evaluation metrics provide a standardized way to quantify multimedia data accuracy, consistency, and overall reliability. By examining and understanding these metrics, we can ascertain the suitability of data for training AI models effectively and achieving reliable results. Moreover, quality metrics play a pivotal role in identifying potential biases, noise, or inconsistencies in the data, which are essential steps in preparing high-quality datasets for AI algorithms.
While other aspects of data readiness, such as preprocessing techniques or data augmentation methods, are valuable in improving the dataset’s performance, quality evaluation metrics are the foundation for data quality assessment. By focusing on quality evaluation metrics, we can comprehensively analyze the readiness of data, thus ensuring a more in-depth exploration and understanding of the integrity of data for AI applications.
4.2.2.1 Image Quality
As a metric to measure the readiness of image data for AI, image quality refers to the degree to which an image accurately represents the visual content it intends to depict. It includes various aspects such as sharpness, clarity, color accuracy, and the absence of artifacts or distortions. Assessing image quality is crucial in AI applications as it directly impacts the reliability and effectiveness of algorithms that rely on visual data. High-quality images provide a solid foundation for AI to extract meaningful features, recognize patterns, and make accurate decisions.
Example: In an AI system designed for autonomous driving, image quality plays a vital role in ensuring the accuracy and reliability of object detection and recognition. High-quality images with clear details and accurate colors allow the AI system to accurately identify pedestrians, vehicles, and traffic signs, enabling it to make precise decisions in real-time. Conversely, low-quality images with blurriness or artifacts may lead to misinterpretation of objects or false detections, compromising the safety and efficiency of the autonomous driving system.
Metrics in Literature: The field of image quality assessment is a heavily researched area, constantly evolving to meet the demands of various applications. In this discussion, we explore some of the favored and widely used measures developed to evaluate image quality accurately.
Mean Squared Error (MSE) and Peak Signal-to-Noise Ratio (PSNR) (psn, nd) are essential metrics for evaluating image quality and are widely used in AI applications. MSE measures the average squared difference between the pixel values of a reference and processed image, providing a quantifiable representation of distortion. PSNR, derived from MSE, offers a perceptual quality metric expressed in decibels, comparing the maximum signal power with the average squared error. Higher PSNR values indicate high-quality images. While MSE alone may not align with human perception of quality, PSNR provides a standardized measure that accounts for human visual perception.
Wang et al. (Wang and Bovik, 2002) present a universal image quality index, distinct from MSE and PSNR, defined mathematically for independence from specific images, viewing conditions, and observers. This index incorporates correlation coefficient, mean luminance difference, and contrast similarity, offering practical advantages in simplicity and universality. In related work, Wang et al. (Wang et al., 2004) introduce the Structural Similarity (SSIM) index as an alternative to traditional error-sensitive methods, emphasizing structural similarities in luminance, contrast, and structure to align more closely with human visual perception. Furthermore, their Multi-Scale Structural Similarity (MSSIM) approach, as proposed in (Wang et al., 2003), extends SSIM by considering variations in resolution and viewing conditions, providing increased flexibility and demonstrating improved performance.
In a similar vein, Sarnoff’s JND-Metrix (sar, nd) takes into account Just Noticeable Differences (JND) based on the Human Visual System (HVS) principles. Unlike traditional metrics such as PSNR or MSE, the JND-Metrix considers the sensitivity and perception of the HVS to different types of image distortions. By incorporating knowledge of the HVS, including factors like contrast sensitivity, spatial masking, and visual attention, it quantifies the perceptual impact of image distortions more accurately. The method measures the visibility of distortions by estimating JND thresholds for various distortions, indicating the level of distortion perceptually distinguishable from the original image.
Two notable advancements in image quality assessment include Sheikh et al.’s (Sheikh and Bovik, 2006) Visual Information Fidelity (VIF) criterion and Chandler et al.’s (Chandler and Hemami, 2007) Visual Signal-to-Noise Ratio (VSNR) metric. VIF, a full-reference method, evaluates the correlation between image information and visual quality, outperforming traditional metrics in various scenarios. On the other hand, VSNR uniquely considers human visual system properties, including near-threshold and suprathreshold perception, providing a more accurate representation of perceived quality by addressing contrast sensitivity and global precedence.
Lakhani (Lakhani, 2020) and Sabottke et al. (Sabottke and Spieler, 2020) demonstrate that resolution is a critical image quality metric when developing deep learning models for medical imaging and radiology applications. Higher image resolutions can lead to improved AI model performance, especially in detecting specific medical conditions. However, it is essential to strike a balance with computational resources to avoid limitations in the training process. The appropriate image resolution for a given task can vary based on several factors, including the image data type, the specific AI model or algorithm being used, and the application’s requirements. Additionally, blurriness is another factor that can impact the performance of AI models, particularly those tailored for image recognition, object detection, and segmentation tasks. Additionally, blurriness, a significant factor affecting AI model performance, has been extensively studied. Lin et al.’s (Lin et al., 2005) method estimates contrast decrease on edges, while Marziliano et al. (Marziliano et al., 2002) gauge blurriness by analyzing edge spread, providing valuable insights into overall blurriness levels.
Summary: Image quality refers to how accurately an image represents its visual content and cover aspects such as sharpness, clarity, color accuracy, and the absence of artifacts. Commonly used metrics for image quality assessment include MSE, PSNR, SSIM, MSSIM, JND-Metrix, VSNR, and VIF. These metrics provide quantitative measurements of image distortion and quality, allowing practitioners to determine the suitability of image data for AI tasks. Additionally, considering factors like image resolution and blurriness is crucial to balance improved model performance and computational resources.
4.2.2.2 Speech Quality
Speech quality refers to the overall perceived clarity, intelligibility, and fidelity of speech signals. It captures the extent to which speech data effectively conveys the intended information and is free from distortions, noise, or artifacts that could impact its understandability. Speech quality includes factors such as signal clarity, absence of background noise, the naturalness of speech, and the ability to capture and reproduce various linguistic and acoustic properties accurately. A high level of speech quality in the data ensures that AI models can effectively process and interpret speech inputs, leading to more accurate and reliable performance across speech-related tasks, such as speech recognition, synthesis, or understanding.
Example: Speech quality is important for the optimal functioning of voice-controlled virtual assistants. In a scenario with high speech quality, a user’s command is delivered with clarity, intelligibility, and minimal background noise. This ensures the virtual assistant accurately interprets and executes the request. However, in a low speech quality scenario with distortions and noise, the AI system may struggle to comprehend the command, leading to potential errors in execution.
Metrics in Literature: One commonly used metric is the Mean Opinion Score (MOS), introduced by the ITU-T (International Telecommunication Union – Telecommunication Standardization Sector) (International Telecommunication Union, 2018), involves human listeners rating the perceived quality of speech. MOS helps to understand how well the speech data aligns with human expectations, enabling improvements based on listener feedback. On the other hand, Perceptual Evaluation of Speech Quality (PESQ), introduced by Rix et al. (Rix et al., 2001), quantifies the quality of processed or degraded speech signals objectively. It uses a model that simulates human auditory perception to calculate prediction scores. Segmental Signal-to-Noise Ratio (SNRseg), introduced by Jayant et al. (Jayant and Noll, 1984), is another speech quality metric that gauges the ratio of the clean speech signal to the background noise within short segments. By providing a localized evaluation, SNRseg helps assess the impact of noise on speech intelligibility. It assists in identifying segments of speech that may be affected by noise, leading to targeted noise reduction or enhancement techniques.
Widely used objective metrics for evaluating speech quality and intelligibility are Short-Time Objective Intelligibility (STOI), Perceptual Speech Quality Measure (PSQM), Itakura-Saito Spectral Distortion (IS), and Objective Difference Grade (ODG). STOI, introduced by Taal et al. (Taal et al., 2010), primarily assesses the similarity between clean and degraded speech signals, focusing on how well the degraded speech retains intelligibility compared to the original signal. In contrast, PSQM, introduced by Beerends et al. (Beerends and Stemerdink, 1994), explores various factors affecting speech quality, including distortion, noise, and echo. IS (Itakura and Saito, 1968) quantifies spectral distortion in the frequency domain, helping to understand the impact of different operations on speech quality. On the other hand, ODG, specified in (itu, nd), evaluates the perceived difference in quality between two speech signals, aiding in comparing speech processing algorithms or system configurations. These metrics offer distinct perspectives on speech quality, with STOI and PSQM emphasizing intelligibility and overall quality, IS focusing on spectral distortion, and ODG providing a comparative quality assessment.
Summary: Speech quality refers to the perceived clarity, intelligibility, and fidelity of speech signals. Metrics like Mean Opinion Score (MOS), Perceptual Evaluation of Speech Quality (PESQ), Segmental Signal-to-Noise Ratio (SNRseg), Short-Time Objective Intelligibility (STOI), Perceptual Speech Quality Measure (PSQM), Itakura-Saito Spectral Distortion (IS), and Objective Difference Grade (ODG) are used to assess speech quality objectively and subjectively.
4.2.2.3 Video Quality
As a metric to evaluate the readiness of video data for AI, video quality refers to the overall visual fidelity and perceptual coherence of a video sequence. It assesses the accuracy with which the video represents the original content, ensuring that crucial details, structures, and visual cues are preserved without significant degradation or distortion. Evaluating video quality involves objective and subjective criteria, where objective assessments employ computational algorithms to analyze pixel-wise differences and feature similarities. In contrast, subjective evaluations incorporate human perception and user feedback. By considering video quality as a crucial factor, AI practitioners can determine the suitability of video data for their applications, ensuring that the data meets the necessary standards for achieving accurate and reliable AI-driven results.
Example: In preparation for developing an AI-powered autonomous driving system, a team of engineers collects a vast amount of video data from various in-car cameras and external sensors. To evaluate the readiness of this video data for AI training, they carefully assess its quality. In this context, video quality refers to the video sequences’ overall visual fidelity and coherence, ensuring that critical details are preserved without significant degradation. The engineers analyze the videos to detect potential artifacts or distortions that may impact the AI system’s perception algorithms. They also involve human evaluators to rate the video quality subjectively based on their perceived visual appeal.
Metrics in Literature: PSNR, SSIM, VIF, and VSNR are image quality metrics, discussed in section 4.2.2.1, that can also be effectively applied to measure the quality of video data. When applied to videos, these metrics analyze individual frames’ spatial quality and temporal coherence to capture the visual information across consecutive frames. PSNR, SSIM, VIF, and VSNR provide objective insights into video quality and its perceptual fidelity by assessing the pixel-wise differences, structural similarity, information fidelity, and sensitivity to visual distortions. This adaptability makes them valuable tools for researchers and practitioners seeking to quantify and improve the visual experience in video applications. Furthermore, like speech quality assessments discussed in section 4.2.2.2, video quality evaluations often employ the Mean Opinion Score (MOS) methodology. MOS in video quality involves presenting video samples to human viewers who rate their subjective perception of the video’s quality. The average MOS scores offer valuable insights into human preferences and perceptual experiences, complementing the objective metrics’ findings to make more informed decisions regarding video data suitability for various AI applications.
VQM (Video Quality Metric) introduced by Huynh-Thu et al. (Huynh-Thu and Ghanbari, 2008), VMAF (Video Multimethod Assessment Fusion) introduced by Netflix (Blog, 2017), and OPTICOM’s PEVQ (Perceptual Evaluation of Video Quality) (PEV, 2008) are advanced and specialized metrics specifically designed to assess the quality of video data. VQM focuses on replicating human visual perception to evaluate video quality accurately. By analyzing spatial and temporal characteristics of video frames, VQM provides a comprehensive measure of video fidelity, making it invaluable in video compression and transmission applications. VMAF takes a multifaceted approach by combining traditional metrics like PSNR and SSIM with machine learning techniques. VMAF predicts how viewers perceive video quality by leveraging a human-rated dataset, making it highly effective for video streaming, content delivery, and codec research. Meanwhile, PEVQ, standardized by ITU (International Telecommunication Union), offers both objective and subjective evaluations. Its computational model estimates video quality based on visual and temporal features, while human evaluators provide MOS-based subjective assessments. Widely used in video telephony and conferencing systems, PEVQ ensures that video communication meets acceptable quality standards.
Summary: Video quality refers to a video sequence’s overall visual fidelity and perceptual coherence, assessing its accuracy in representing the original content. Objective metrics such as PSNR, SSIM, VIF, and VSNR, which are commonly used for image quality assessment, can be effectively applied to measure video quality by analyzing spatial and temporal characteristics. Additionally, specialized metrics like VQM, VMAF, and PEVQ are specifically designed to address the challenges unique to video data, incorporating human perceptual aspects and machine learning techniques to predict viewer perception.
Preparation of unstructured data for AI applications involves adapting key dimensions typically applied to structured data (4.1). “Correctness” is fundamental, ensuring the accuracy and integrity of content within unstructured data like text, images, audio, and video to maintain AI model reliability. “Feature Relevancy” is crucial for identifying informative elements within unstructured data, aiding pattern recognition and decision-making. “Privacy Leakage” safeguards sensitive information, requiring privacy-preserving techniques. Addressing “Class Imbalance” and “Class Separability” enhances classification tasks in unstructured data by ensuring balanced representation and category distinguishability. Lastly, “Timeliness” is vital, particularly in dynamic data domains, as it ensures AI models stay relevant and up-to-date with evolving data patterns. These dimensions collectively contribute to unstructured data readiness for AI applications.
5. Gaps and Challenges
This section discusses the gaps and challenges in the metrics for assessing data readiness for AI in structured and unstructured data. While structured data poses unique challenges regarding standardization, interpretability, and context sensitivity, unstructured datasets present additional complexities due to their diverse formats, varying modalities, and contextual nuances. By exploring the gaps and challenges in both structured and unstructured data readiness metrics, we aim to discuss the key areas that require further research, collaboration, and innovation in AI and data science.
Assessing data readiness for AI and data science applications, regardless of its structure, presents several significant challenges origins from the absence of a unified framework that complicates the comparison and consistent application of existing metrics across diverse dimensions. This absence hampers the development of a cohesive and comprehensive data readiness assessment method explicitly tailored for different types of data. Although Gupta et al.’s (Gupta et al., 2021) data quality toolkit has taken initial steps in addressing this concern, its coverage is primarily focused on structured data, leaving a need for further advancements to include a broader range of dimensions related to structured data readiness and extend the toolkit’s capabilities to address unstructured data challenges.
In the rapidly evolving fields of AI and data science, emergence of new use cases and diverse data structures constantly challenges the evaluation of data readiness. To ensure these metrics remain effective in assessing data preparedness for the latest AI applications, they must adapt and evolve alongside the technology. Striking the right balance between data quality and quantity is another crucial challenge. While numerous metrics focus on data quality, a comprehensive approach should consider the trade-off between data quality and sufficiency. Sufficient data volumes are essential for meaningful analysis and effective AI model training, making finding the optimal equilibrium between data quality and quantity a challenge. Additionally, clear interpretability of these readiness metrics is essential for stakeholders to grasp their implications on overall data quality and their potential impacts on AI model performance. Enhanced visualization and explanation techniques can significantly improve the practical utility of these metrics, facilitating more informed decision-making processes.
Addressing the challenges in the dynamic field of AI and data readiness is important. Specific AI applications often require customized data readiness metrics due to varied data quality standards, necessitating domain-specific expertise for effective navigation. Simultaneously, addressing subjective judgments and human biases, particularly concerning fairness and privacy, adds another layer of complexity. Developing unbiased and ethical metrics that adapt to various data types and applications requires ongoing research and innovation. Furthermore, the ever-evolving nature of real-world datasets require continuous data readiness assessment throughout an AI system’s lifecycle, extending beyond the initial data preparation phase.
Data access and ownership concerns can impede data readiness evaluation, particularly when datasets are restricted due to privacy and ownership issues. These limitations can delay a comprehensive data readiness assessment, requiring collaborative efforts and agreements between data providers and users to navigate these challenges effectively. Furthermore, the ongoing challenge lies in establishing meaningful thresholds that define acceptable data readiness levels. Given the context-dependent nature of data and the diversity of AI use cases, universal and context-independent threshold values are challenging to define. Clear guidelines regarding data quality thresholds are essential to ensure consistent and effective data preparation practices. Lastly, to compare and evaluate various data readiness metrics, developing well-established benchmark datasets and evaluation protocols becomes crucial. Creating representative benchmarks spanning different industries and data structures can facilitate a more comprehensive comparison of diverse metrics and scoring mechanisms.
Addressing these gaps and challenges in data readiness metrics urges collaboration among researchers, practitioners, and industry experts. Advancing the state-of-the-art in these metrics will contribute to more reliable utilization of data in AI applications, unlocking the maximum potential of this valuable resource.
6. Conclusion
This comprehensive survey underscores the critical role of data preparation in the success of AI applications. We explored the challenges, tools, and metrics associated with data readiness, emphasizing its significance in achieving accurate and dependable AI-driven outcomes. Our study highlights the need for a holistic approach, covering structured and unstructured data, and underscores the importance of incorporating fairness-related metrics to ensure unbiased AI decision-making. We have identified and showcased existing metrics and scoring mechanisms that effectively measure data readiness available in literature by studying more than 120 sources from reputable journals including ACM, IEEE, and other reputable journals, as well as web articles, spanning the past three decades. By thoroughly exploring these dimensions and metrics, we have contributed to a deeper understanding of data readiness within AI applications. As AI advances and data becomes an even more critical asset, staying up to date with the latest research and advancements in data readiness metrics is essential. This survey provides a foundational resource for researchers and practitioners, equipping them with the essential insights needed to navigate the complexities of data preparation for AI effectively and emphasizing that data readiness is not just a preliminary step but an ongoing commitment.
References
- (1)
- PEV (2008) 2008. PEVQ – the Standard for Perceptual Evaluation of Video Quality. http://www.pevq.com/pevq.html Accessed 22 July 2023.
- itu (nd) n.d.. BS.1387 : Method for Objective Measurements of Perceived Audio Quality. https://www.itu.int/rec/R-REC-BS.1387/en. Accessed 17 July 2023.
- rea (nd) n.d. The Gunning Fog Index. https://readable.com/readability/gunning-fog-index/. Accessed 12 July 2023.
- sar (nd) n.d.. JNDmetrix Technology. http://www.sarnoff.com/products_services/video_vision/jndmetrix/. Accessed 12 July 2023.
- Kag (nd) n.d.. Kaggle. https://www.kaggle.com/ Accessed: Sept 2023.
- psn (nd) n.d.. PSNR. https://www.mathworks.com/help/vision/ref/psnr.html Data Accessed 7/26/2023.
- Afendras and Markatou (2019) Georgios Afendras and Marianthi Markatou. 2019. Optimality of training/test size and resampling effectiveness in cross-validation. Journal of Statistical Planning and Inference 199 (2019), 286–301. https://doi.org/10.1016/j.jspi.2018.07.005
- Afzal et al. (2020) Shazia Afzal, Rajmohan C, Manish Kesarwani, Sameep Mehta, and Hima Patel. 2020. Data Readiness Report. arXiv:2010.07213 [cs.DB]
- Alberto et al. (2018) Francisco Alberto, Salvador García, Mikel Galar, Ronaldo Prati, Bartosz Krawczyk, and Francisco Herrera. 2018. Learning from Imbalanced Data Sets. Springer.
- Allen (2019) Robbie Allen. 2019. Assessing Your Data Readiness for Machine Learning. Medium. https://medium.com/machine-learning-in-practice/assessing-your-data-readiness-for-machine-learning-ab97e0e81166 Accessed on June 27, 2023.
- Alwosheel et al. (2018) Ahmad Alwosheel, Sander van Cranenburgh, and Caspar G. Chorus. 2018. Is your dataset big enough? Sample size requirements when using artificial neural networks for discrete choice analysis. Journal of Choice Modelling 28 (2018), 167–182. https://doi.org/10.1016/j.jocm.2018.07.002
- Arca and Hewett (2020) Sevgi Arca and Rattikorn Hewett. 2020. Is Entropy enough for measuring Privacy?. In 2020 International Conference on Computational Science and Computational Intelligence (CSCI). 1335–1340. https://doi.org/10.1109/CSCI51800.2020.00249
- Azzalini et al. (2022) Fabio Azzalini, Chiara Criscuolo, and Letizia Tanca. 2022. E-FAIR-DB: Functional Dependencies to Discover Data Bias and Enhance Data Equity. J. Data and Information Quality 14, 4, Article 29 (nov 2022), 26 pages. https://doi.org/10.1145/3552433
- Beerends and Stemerdink (1994) J. Beerends and J. Stemerdink. 1994. A Perceptual Speech Quality Measure Based on a Psychoacoustic Sound Representation. Journal of Audio Eng. Soc. 42 (December 1994), 115–123.
- Bezzi (2007) Michele Bezzi. 2007. An entropy based method for measuring anonymity. In 2007 Third International Conference on Security and Privacy in Communications Networks and the Workshops - SecureComm 2007. 28–32. https://doi.org/10.1109/SECCOM.2007.4550303
- Biddle and Christensen (nd) Edd Biddle and Paul Christensen. n.d. Prepare Your Data for AI and Data Science. https://www.ibm.com/garage/method/practices/code/data-preparation-ai-data-science/. Accessed 26 June 2023.
- Blaiszik et al. (2016) B. Blaiszik et al. 2016. The Materials Data Facility: Data Services to Advance Materials Science Research. JOM 68 (2016). https://doi.org/10.1007/s11837-016-2001-3
- Blake and Mangiameli (2011) Roger Blake and Paul Mangiameli. 2011. The Effects and Interactions of Data Quality and Problem Complexity on Classification. J. Data and Information Quality 2, 2, Article 8 (feb 2011), 28 pages. https://doi.org/10.1145/1891879.1891881
- Blei et al. (2003) David M. Blei, Andrew Y. Ng, and Michael I. Jordan. 2003. Latent Dirichlet Allocation. Journal of Machine Learning Research 3 (January 2003), 993–1022. Submitted 2/02; Published 1/03.
- Blog (2017) Netflix Technology Blog. 2017. Toward a practical perceptual video quality metric. https://netflixtechblog.com/toward-a-practical-perceptual-video-quality-metric-653f208b9652
- Bors et al. (2018) Christian Bors, Theresia Gschwandtner, Simone Kriglstein, Silvia Miksch, and Margit Pohl. 2018. Visual Interactive Creation, Customization, and Analysis of Data Quality Metrics. J. Data and Information Quality 10, 1, Article 3 (may 2018), 26 pages. https://doi.org/10.1145/3190578
- Borsos et al. (2018) Z. Borsos, C. Lemnaru, and R. Potolea. 2018. Dealing with overlap and imbalance: a new metric and approach. Pattern Anal Applic 21, 2 (2018), 381–395. https://doi.org/10.1007/s10044-016-0583-6
- Breunig et al. (2000) Markus M. Breunig, Hans-Peter Kriegel, Raymond T. Ng, and Jörg Sander. 2000. LOF: Identifying density-based local outliers. In Proc. ACM SIGMOD Int. Conf. Manage. Data. 93–104.
- Carlini et al. (2022) Nicholas Carlini, Matthew Jagielski, Chiyuan Zhang, Nicolas Papernot, Andreas Terzis, and Florian Tramer. 2022. The Privacy Onion Effect: Memorization is Relative. arXiv:2206.10469 [cs.LG]
- Celis et al. (2020) L. Elisa Celis, Vijay Keswani, and Nisheeth K. Vishnoi. 2020. Data preprocessing to mitigate bias: A maximum entropy based approach. arXiv:1906.02164 [cs.LG]
- Chandler and Hemami (2007) Damon M. Chandler and Sheila S. Hemami. 2007. VSNR: A Wavelet-Based Visual Signal-to-Noise Ratio for Natural Images. IEEE Transactions on Image Processing 16, 9 (2007), 2284–2298. https://doi.org/10.1109/TIP.2007.901820
- Clarke et al. (2019) Daniel JB Clarke, Lily Wang, Alex Jones, Megan L Wojciechowicz, Denis Torre, Kathleen M Jagodnik, Sherry L Jenkins, Peter McQuilton, Zachary Flamholz, Moshe C Silverstein, et al. 2019. FAIRshake: toolkit to evaluate the FAIRness of research digital resources. Cell systems 9, 5 (2019), 417–421.
- Cohen (1960) J. Cohen. 1960. A Coefficient of Agreement for Nominal Scales. Educational and Psychological Measurement 20, 1 (1960), 37–46. https://doi.org/10.1177/001316446002000104
- Coleman and Liau (1975) Meri Coleman and Ta Lin Liau. 1975. A computer readability formula designed for machine scoring. J. of Applied Psychology 60 (1975), 283–284.
- Dai et al. (2006) Bing Tian Dai, Nick Koudas, Beng Chin Ooi, Divesh Srivastava, and Suresh Venkatasubramanian. 2006. Rapid Identification of Column Heterogeneity. In Sixth International Conference on Data Mining (ICDM’06). 159–170. https://doi.org/10.1109/ICDM.2006.132
- Davis and Sampson (1986) John C. Davis and Robert J. Sampson. 1986. Statistics and Data Analysis in Geology. Vol. 646. Wiley, New York.
- Degirmenci and Karal (2021) Ali Degirmenci and Omer Karal. 2021. Robust Incremental Outlier Detection Approach Based on a New Metric in Data Streams. IEEE Access 9 (2021), 160347–160360. https://doi.org/10.1109/ACCESS.2021.3131402
- Developer (2021) IBM Developer. 2021. IBM Data Quality AI Toolkit. https://developer.ibm.com/learningpaths/data-quality-ai-toolkit/overview/ Date accessed: June 12, 2023.
- Dua and Graff (2017) Dheeru Dua and Casey Graff. 2017. UCI Machine Learning Repository. http://archive.ics.uci.edu/ml.
- Duda et al. (2012) Richard O. Duda, Peter E. Hart, and David G. Stork. 2012. Pattern Classification. John Wiley & Sons.
- Duddu et al. (2022) Vasisht Duddu, Sebastian Szyller, and N. Asokan. 2022. SHAPr: An Efficient and Versatile Membership Privacy Risk Metric for Machine Learning. arXiv:2112.02230 [cs.CR]
- Editor (2020) Editor. 2020. Preparing your dataset for Machine Learning: 10 basic techniques that make your data better. https://www.altexsoft.com/blog/datascience/preparing-your-dataset-for-machine-learning-8-basic-techniques-that-make-your-data-better/
- Elmagarmid et al. (2007) Ahmed K. Elmagarmid, Panagiotis G. Ipeirotis, and Vassilios S. Verykios. 2007. Duplicate Record Detection: A Survey. IEEE Transactions on Knowledge and Data Engineering 19, 1 (2007), 1–16. https://doi.org/10.1109/TKDE.2007.250581
- Feldman et al. (2015) Michael Feldman, Sorelle A. Friedler, John Moeller, Carlos Scheidegger, and Suresh Venkatasubramanian. 2015. Certifying and Removing Disparate Impact. In Proceedings of the 21th ACM SIGKDD International Conference on Knowledge Discovery and Data Mining (Sydney, NSW, Australia) (KDD ’15). Association for Computing Machinery, New York, NY, USA, 259–268. https://doi.org/10.1145/2783258.2783311
- Flesch (1986) Rudolf Flesch. 1986. The Art of Readable Writing (19th print.-collier books ed ed.). MacMillan.
- Forman (2003) George Forman. 2003. An Extensive Empirical Study of Feature Selection Metrics for Text Classification. J. Mach. Learn. Res. 3 (mar 2003), 1289–1305.
- Gebru et al. (2018) Timnit Gebru, Jamie Morgenstern, Briana Vecchione, Jennifer Wortman Vaughan, Hanna Wallach, Hal Daumé III, and Kate Crawford. 2018. Datasheets for Datasets. arXiv preprint arXiv:1803.09010 (2018).
- Ghorbani and Zou (2019) Amirata Ghorbani and James Zou. 2019. Data Shapley: Equitable Valuation of Data for Machine Learning. arXiv:1904.02868 [stat.ML]
- Gini (1912) C. Gini. 1912. Variability and Mutability: Contribution to the Study of Statistical Distribution and Relations. Studi Economico-Giuridici della R (1912).
- Gupta et al. (2021) Nitin Gupta, Hima Patel, Shazia Afzal, Naveen Panwar, Ruhi Sharma Mittal, Shanmukha Guttula, Abhinav Jain, Lokesh Nagalapatti, Sameep Mehta, Sandeep Hans, Pranay Lohia, Aniya Aggarwal, and Diptikalyan Saha. 2021. Data Quality Toolkit: Automatic assessment of data quality and remediation for machine learning datasets. arXiv:2108.05935 [cs.LG]
- Hall and Smith (1999) Mark A. Hall and Lloyd A. Smith. 1999. Feature Selection for Machine Learning: Comparing a Correlation-Based Filter Approach to the Wrapper. In FLAIRS. 235–239.
- Harvey and Glocker (2019) Hugh Harvey and Ben Glocker. 2019. A Standardised Approach for Preparing Imaging Data for Machine Learning Tasks in Radiology. Springer International Publishing, Cham, 61–72. https://doi.org/10.1007/978-3-319-94878-2_6
- Haykin (2009) Simon S. Haykin. 2009. Neural networks and learning machines (third ed.). Pearson Education, Upper Saddle River, NJ.
- He et al. (2005) Xiaofei He, Deng Cai, and Partha Niyogi. 2005. Laplacian Score for Feature Selection. In NIPS. 507–514.
- Heinrich and Klier (2015) Bernd Heinrich and Mathias Klier. 2015. Metric-based data quality assessment — Developing and evaluating a probability-based currency metric. Decision Support Systems 72 (2015), 82–96. https://doi.org/10.1016/j.dss.2015.02.009
- Huynh-Thu and Ghanbari (2008) Q. Huynh-Thu and M. Ghanbari. 2008. Scope of validity of PSNR in image/video quality assessment. Electronics Letters 44, 13 (Jun 19 2008), 1–2. http://proxy.lib.ohio-state.edu/login?url=https://www.proquest.com/scholarly-journals/scope-validity-psnr-image-video-quality/docview/1625957339/se-2 Copyright - Copyright The Institution of Engineering & Technology Jun 19, 2008; Document feature - Graphs; Tables; ; Last updated - 2015-03-27; CODEN - ELLEAK.
- Hwang (2022) Helen Hwang. 2022. New AI readiness report reveals insights into ML lifecycle. https://www.datacenterknowledge.com/machine-learning/new-ai-readiness-report-reveals-insights-ml-lifecycle. Accessed on May 15, 2023.
- International Telecommunication Union (2018) International Telecommunication Union. 2018. ITU-T Recommendation P.808: Subjective Evaluation of Speech Quality with a Crowdsourcing Approach. Technical Report. International Telecommunication Union, Geneva.
- Itakura and Saito (1968) F. Itakura and S. Saito. 1968. Analysis Synthesis Telephony Based on the Maximum Likelihood Method. In Proc. 6th Int. Congr. Acoust. Tokyo, Japan, C–17–C–20.
- Jaro (1976) M.A. Jaro. 1976. Unimatch: A Record Linkage System: User’s Manual. Technical Report. US Bureau of the Census, Washington, D.C.
- Jayant and Noll (1984) N.C. Jayant and P. Noll. 1984. Digital Coding of Waveforms: Principles and Applications to Speech and Video. Prentice Hall, NJ, USA.
- Jiang et al. (2023) Kevin Fu Jiang, Weixin Liang, James Zou, and Yongchan Kwon. 2023. OpenDataVal: a Unified Benchmark for Data Valuation. arXiv:2306.10577 [cs.LG]
- Jones and Slaughter (2019) Matthew B Jones and Peter Slaughter. 2019. https://www.dataone.org/uploads/dataonewebinar_jonesslaughter_fairmetadata_190514.pdf
- Joseph (2022) V. Roshan Joseph. 2022. Optimal Ratio for Data Splitting. Statistical Analysis and Data Mining: The ASA Data Science Journal 15, 4 (August 2022), 531–538. https://doi.org/10.1002/sam.11583
- Jäger et al. (2021) Sven Jäger, Anders Allhorn, and Felix Bießmann. 2021. A Benchmark for Data Imputation Methods. Frontiers in Big Data 4 (2021), 693674. https://doi.org/10.3389/fdata.2021.693674
- Kaiser et al. (1970) M. Kaiser, Mathias Klier, and Bernd Heinrich. 1970. [PDF] how to measure data quality? - A metric-based approach: Semantic scholar. https://www.semanticscholar.org/paper/How-to-Measure-Data-Quality-A-Metric-Based-Approach-Kaiser-Klier/afcdf53c5a88f3320c861ad3f09f28237b6744cb
- Kemka (2019) Martin Kemka. 2019. Learning Amazon Sagemaker. https://docs.aws.amazon.com/sagemaker/latest/dg/clarify-data-bias-metric-cddl.html
- Lakhani (2020) Paras Lakhani. 2020. The Importance of Image Resolution in Building Deep Learning Models for Medical Imaging. Radiology: Artificial Intelligence 2, 1 (2020), e190177. https://doi.org/10.1148/ryai.2019190177
- Lavitas et al. (2021) Liliya Lavitas, Olivia Redfield, Allen Lee, Daniel Fletcher, Matthias Eck, and Sunil Janardhanan. 2021. Annotation quality framework-accuracy, credibility, and consistency. In NEURIPS 2021 Workshop for Data Centric AI.
- Lawrence (2017) Neil D. Lawrence. 2017. Data Readiness Levels. arXiv:1705.02245 [cs.DB]
- Lawton (2022) George Lawton. 2022. Data Preparation in Machine Learning: 6 key steps. https://www.techtarget.com/searchbusinessanalytics/feature/Data-preparation-in-machine-learning-6-key-steps
- Levenshtein (1965) V.I. Levenshtein. 1965. Binary Codes Capable of Correcting Deletions, Insertions and Reversals. Doklady Akademii Nauk SSSR 163, 4 (1965), 845–848. Original in Russian—translation in Soviet Physics Doklady, vol. 10, no. 8, pp. 707–710, 1966.
- Lewis (1992) David D. Lewis. 1992. Feature Selection and Feature Extraction for Text Categorization. In Workshop on Speech and Natural Language. 212–217.
- Leys et al. (2013) Christophe Leys, Christophe Ley, Olivier Klein, Pierre Bernard, and Laurent Licata. 2013. Detecting outliers: Do not use standard deviation around the mean, use absolute deviation around the median. J. Exp. Social Psychol. 49, 4 (2013), 764–766.
- Li et al. (2017) Jundong Li, Kewei Cheng, Suhang Wang, Fred Morstatter, Robert P. Trevino, Jiliang Tang, and Huan Liu. 2017. Feature Selection: A Data Perspective. ACM Comput. Surv. 50, 6, Article 94 (dec 2017), 45 pages. https://doi.org/10.1145/3136625
- Li et al. (2021) Peng Li, Xi Rao, Jennifer Blase, Yue Zhang, Xu Chu, and Ce Zhang. 2021. CleanML: A Study for Evaluating the Impact of Data Cleaning on ML Classification Tasks. In 2021 IEEE 37th International Conference on Data Engineering (ICDE). 13–24. https://doi.org/10.1109/ICDE51399.2021.00009
- Lin et al. (2005) Weisi Lin, Li Dong, and Ping Xue. 2005. Visual distortion gauge based on discrimination of noticeable contrast changes. IEEE transactions on circuits and systems for video technology 15, 7 (2005), 900–909.
- Lin and Jay Kuo (2011) Weisi Lin and C.-C. Jay Kuo. 2011. Perceptual visual quality metrics: A survey. Journal of Visual Communication and Image Representation 22, 4 (2011), 297–312. https://doi.org/10.1016/j.jvcir.2011.01.005
- Liu and Setiono (1995) Huan Liu and Rudy Setiono. 1995. Chi2: Feature Selection and Discretization of Numeric Attributes. In ICTAI. 388–391.
- Liu et al. (2020) Sijia Liu, Parikshit Ram, Deepak Vijaykeerthy, Djallel Bouneffouf, Gregory Bramble, Horst Samulowitz, Dakuo Wang, Andrew Conn, and Alexander Gray. 2020. An ADMM-based Framework for AutoML Pipeline Configuration. In Proceedings of the AAAI Conference on Artificial Intelligence, Vol. 34. 4892–4899.
- Longpré et al. (2017) Luc Longpré, Vladik Kreinovich, and Thongchai Dumrongpokaphan. 2017. Entropy as a Measure of Average Loss of Privacy. Thai Journal of Mathematics (2017), 7–15. https://api.semanticscholar.org/CorpusID:6672504
- Lu et al. (2019) Yang Lu, Yiu ming Cheung, and Yuan Yan Tang. 2019. Bayes Imbalance Impact Index: A Measure of Class Imbalanced Dataset for Classification Problem. arXiv:1901.10173 [cs.LG]
- Luhn (1957) H. P. Luhn. 1957. A Statistical Approach to Mechanized Encoding and Searching of Literary Information. IBM Journal of Research and Development 1, 4 (1957), 309–317. https://doi.org/10.1147/rd.14.0309
- Marziliano et al. (2002) Pina Marziliano, Frederic Dufaux, Stefan Winkler, and Touradj Ebrahimi. 2002. A no-reference perceptual blur metric. In Proceedings. International conference on image processing, Vol. 3. IEEE, III–III.
- McCarthy (2005) Philip M McCarthy. 2005. An assessment of the range and usefulness of lexical diversity measures and the potential of the measure of textual, lexical diversity (MTLD). Ph. D. Dissertation. The University of Memphis.
- McCarthy and Jarvis (2010) Peter M. McCarthy and Scott Jarvis. 2010. MTLD, VOCD-D, and HD-D: A Validation Study of Sophisticated Approaches to Lexical Diversity Assessment. Behavior Research Methods 42, 2 (2010), 381–392. https://doi.org/10.3758/BRM.42.2.381
- Mimno et al. (2011) David Mimno, Hanna M. Wallach, Edmund Talley, Miriam Leenders, and Andrew McCallum. 2011. Optimizing Semantic Coherence in Topic Models. In Proceedings of the Conference on Empirical Methods in Natural Language Processing (Edinburgh, United Kingdom) (EMNLP ’11). Association for Computational Linguistics, USA, 262–272.
- Mitchell et al. (2019) Margaret Mitchell, Simone Wu, Andrew Zaldivar, Parker Barnes, Lucy Vasserman, Ben Hutchinson, Elena Spitzer, Inioluwa Deborah Raji, and Timnit Gebru. 2019. Model Cards for Model Reporting. In Proceedings of the Conference on Fairness, Accountability, and Transparency. 220–229.
- Monge and Elkan (1996) A.E. Monge and C.P. Elkan. 1996. The Field Matching Problem: Algorithms and Applications. In Proc. Second Int’l Conf. Knowledge Discovery and Data Mining (KDD ’96). 267–270.
- Newman et al. (2010) David Newman, Youn Noh, Edmund Talley, Sarvnaz Karimi, and Timothy Baldwin. 2010. Evaluating Topic Models for Digital Libraries. In Proceedings of the 10th Annual Joint Conference on Digital Libraries (Gold Coast, Queensland, Australia) (JCDL ’10). Association for Computing Machinery, New York, NY, USA, 215–224. https://doi.org/10.1145/1816123.1816156
- Nie et al. (2008) Feiping Nie, Shiming Xiang, Yangqing Jia, Changshui Zhang, and Shuicheng Yan. 2008. Trace Ratio Criterion for Feature Selection. In AAAI. 671–676.
- Ntoutsi et al. (2020) E. Ntoutsi, P. Fafalios, U. Gadiraju, V. Iosifidis, W. Nejdl, E. Vidal, S. Ruggieri, F. Turini, S. Papadopoulos, E. Krasanakis, I. Kompatsiaris, K. Kinder-Kurlanda, C. Wagner, F. Karimi, M. Fernandez, H. Alani, B. Berendt, T. Kruegel, C. Heinze, and S. Staab. 2020. Bias in data-driven artificial intelligence systems—An introductory survey. Wiley Interdisciplinary Reviews: Data Mining and Knowledge Discovery 10, 3 (2020), e1356. https://doi.org/10.1002/widm.1356
- Oh (2011) Sejong Oh. 2011. A new dataset evaluation method based on category overlap. Computers in Biology and Medicine 41, 2 (2011), 115–122. https://doi.org/10.1016/j.compbiomed.2010.12.006
- Ortigosa-Hernández et al. (2017) Jonathan Ortigosa-Hernández, Iñaki Inza, and Jose A. Lozano. 2017. Measuring the class-imbalance extent of multi-class problems. Pattern Recognition Letters 98 (2017), 32–38. https://doi.org/10.1016/j.patrec.2017.08.002
- Papakyriakopoulos et al. (2020) Orestis Papakyriakopoulos, Simon Hegelich, Juan Carlos Medina Serrano, and Fabienne Marco. 2020. Bias in Word Embeddings. In Proceedings of the 2020 Conference on Fairness, Accountability, and Transparency (Barcelona, Spain) (FAT* ’20). Association for Computing Machinery, New York, NY, USA, 446–457. https://doi.org/10.1145/3351095.3372843
- Patel et al. (2022) Hima Patel, Nitin Gupta, Naveen Panwar, Ruhi Sharma Mittal, Sameep Mehta, Shanmukha Guttula, Shashank Mujumdar, Shazia Afzal, Srikanta Bedathur, and Vitobha Munigala. 2022. Automatic Assessment of Quality of Your Data for AI. In 5th Joint International Conference on Data Science & Management of Data (9th ACM IKDD CODS and 27th COMAD) (Bangalore, India) (CODS-COMAD 2022). Association for Computing Machinery, New York, NY, USA, 354–357. https://doi.org/10.1145/3493700.3493774
- Patel et al. (2023) Hima Patel, Shanmukha Guttula, Nitin Gupta, Sandeep Hans, Ruhi Sharma Mittal, and Lokesh N. 2023. A Data Centric AI Framework for Automating Exploratory Data Analysis and Data Quality Tasks. J. Data and Information Quality (jun 2023). https://doi.org/10.1145/3603709
- Pipino et al. (2002) Leo L. Pipino, Yang W. Lee, and Richard Y. Wang. 2002. Data Quality Assessment. Commun. ACM 45, 4 (apr 2002), 211–218. https://doi.org/10.1145/505248.506010
- Pokrajac et al. (2007) Dragoljub Pokrajac, Aleksandar Lazarevic, and Longin Jan Latecki. 2007. Incremental local outlier detection for data streams. In Proc. IEEE Symp. Comput. Intell. Data Mining. 504–515.
- Priestley et al. (2023) Maria Priestley, Fionntán O’Donnell, and Elena Simperl. 2023. A Survey of Data Quality Requirements That Matter in ML Development Pipelines. J. Data and Information Quality (apr 2023). https://doi.org/10.1145/3592616 Just Accepted.
- Qaiser and Ali (2018) Shahzad Qaiser and Ramsha Ali. 2018. Text Mining: Use of TF-IDF to Examine the Relevance of Words to Documents. International Journal of Computer Applications 181 (07 2018). https://doi.org/10.5120/ijca2018917395
- Ramos et al. (2003) Juan Ramos et al. 2003. Using tf-idf to determine word relevance in document queries. In Proceedings of the first instructional conference on machine learning, Vol. 242. Citeseer, 29–48.
- Ravi et al. (2022) Nikil Ravi, Pranshu Chaturvedi, E. A. Huerta, Zhengchun Liu, Ryan Chard, Aristana Scourtas, K. J. Schmidt, Kyle Chard, Ben Blaiszik, and Ian Foster. 2022. FAIR principles for AI models with a practical application for accelerated high energy diffraction microscopy. Scientific Data 9, 1 (nov 2022). https://doi.org/10.1038/s41597-022-01712-9
- Rix et al. (2001) A.W. Rix, J.G. Beerends, M.P. Hollier, and A.P. Hekstra. 2001. Perceptual evaluation of speech quality (PESQ)-a new method for speech quality assessment of telephone networks and codecs. In 2001 IEEE International Conference on Acoustics, Speech, and Signal Processing. Proceedings (Cat. No.01CH37221), Vol. 2. 749–752 vol.2. https://doi.org/10.1109/ICASSP.2001.941023
- Robnik-Šikonja and Kononenko (2003) Marko Robnik-Šikonja and Igor Kononenko. 2003. Theoretical and Empirical Analysis of ReliefF and RReliefF. Machine Learning 53, 1-2 (2003), 23–69.
- Röder et al. (2015) Michael Röder, Andreas Both, and Alexander Hinneburg. 2015. Exploring the Space of Topic Coherence Measures. In Proceedings of the Eighth ACM International Conference on Web Search and Data Mining (Shanghai, China) (WSDM ’15). Association for Computing Machinery, New York, NY, USA, 399–408. https://doi.org/10.1145/2684822.2685324
- Rosner (1983) Bernard Rosner. 1983. Percentage points for a generalized ESD many-outlier procedure. Technometrics 25, 2 (1983), 165–172.
- Rousseeuw and Hubert (2018) Peter J. Rousseeuw and Mia Hubert. 2018. Anomaly detection by robust statistics. WIREs Data Mining Knowl. Discovery 8, 2 (Mar. 2018), e1236.
- Russell (1922) R.C. Russell. 1922. Index. http://patft.uspto.gov/netahtml/srchnum.htm
- Sabottke and Spieler (2020) Carl F. Sabottke and Bradley M. Spieler. 2020. The Effect of Image Resolution on Deep Learning in Radiography. Radiology: Artificial Intelligence 2, 1 (2020), e190015. https://doi.org/10.1148/ryai.2019190015
- Santos et al. (2020) Miriam Seoane Santos, Pedro Henriques Abreu, Szymon Wilk, and João Santos. 2020. How distance metrics influence missing data imputation with k-nearest neighbours. Pattern Recognition Letters 136 (2020), 111–119. https://doi.org/10.1016/j.patrec.2020.05.032
- Schmelzer (2019) Ron Schmelzer. 2019. The Achilles’ Heel of AI. https://www.forbes.com/sites/cognitiveworld/2019/03/07/the-achilles-heel-of-ai/?sh=20e53e4d7be7
- Shahbazi et al. (2023) Nima Shahbazi, Yin Lin, Abolfazl Asudeh, and H. V. Jagadish. 2023. Representation Bias in Data: A Survey on Identification and Resolution Techniques. ACM Comput. Surv. (mar 2023). https://doi.org/10.1145/3588433 Just Accepted.
- Sheikh and Bovik (2006) H.R. Sheikh and A.C. Bovik. 2006. Image information and visual quality. IEEE Transactions on Image Processing 15, 2 (2006), 430–444. https://doi.org/10.1109/TIP.2005.859378
- Sidi et al. (2012) Fatimah Sidi, Payam Hassany Shariat Panahy, Lilly Suriani Affendey, Marzanah A. Jabar, Hamidah Ibrahim, and Aida Mustapha. 2012. Data quality: A survey of data quality dimensions. In 2012 International Conference on Information Retrieval & Knowledge Management. 300–304. https://doi.org/10.1109/InfRKM.2012.6204995
- Simha (2021) Simha. 2021. Understanding TF-IDF for Machine Learning. https://www.capitalone.com/tech/machine-learning/understanding-tf-idf/
- Simonetta et al. (2021) A. Simonetta, A. Trenta, M. C. Paoletti, and A. Vetrò. 2021. Metrics for Identifying Bias in Datasets. SYSTEM (2021).
- Simpson (1949) E. Simpson. 1949. Measurement of Diversity. Nature 163, 688 (1949), 688. https://doi.org/10.1038/163688a0
- Song and Mittal (2021) Liwei Song and Prateek Mittal. 2021. Systematic Evaluation of Privacy Risks of Machine Learning Models. In 30th USENIX Security Symposium (USENIX Security 21). USENIX Association, 2615–2632. https://www.usenix.org/conference/usenixsecurity21/presentation/song
- Sparck Jones (1972) Karen Sparck Jones. 1972. A statistical interpretation of term specificity and its application in retrieval. J. of Documentation 28, 1 (1972), 11–21.
- Taal et al. (2010) Cees H. Taal, Richard C. Hendriks, Richard Heusdens, and Jesper Jensen. 2010. A short-time objective intelligibility measure for time-frequency weighted noisy speech. In 2010 IEEE Int. Conf. on Acoustics, Speech and Signal Processing. 4214–4217. https://doi.org/10.1109/ICASSP.2010.5495701
- Tawfik et al. (2021) Sam Tawfik, Anirudh Adithya Hanthur, and Ruma Sanyal. 2021. Data Preparation for Machine Learning: 5 critical steps to ensure AI success. https://www.informatica.com/blogs/data-preparation-for-machine-learning-5-critical-steps-to-ensure-ai-success.html Accessed 26 June 2023.
- Templin (1957) Maxine Templin. 1957. Certain Language Skills in Children. University of Minnesota Press, Minneapolis.
- Thung and Raveendran (2009) Kim-Han Thung and Paramesran Raveendran. 2009. A survey of image quality measures. In 2009 International Conference for Technical Postgraduates (TECHPOS). 1–4. https://doi.org/10.1109/TECHPOS.2009.5412098
- Vatsalan et al. (2022) Dinusha Vatsalan, Thierry Rakotoarivelo, Raghav Bhaskar, Paul Tyler, and Djazia Ladjal. 2022. Privacy risk quantification in education data using Markov model. British Journal of Educational Technology 53, 4 (2022), 804–821. https://doi.org/10.1111/bjet.13223 arXiv:https://bera-journals.onlinelibrary.wiley.com/doi/pdf/10.1111/bjet.13223
- Wagner and Eckhoff (2018) Isabel Wagner and David Eckhoff. 2018. Technical Privacy Metrics: A Systematic Survey. ACM Comput. Surv. 51, 3, Article 57 (jun 2018), 38 pages. https://doi.org/10.1145/3168389
- Wang and Jia (2023) Jiachen T. Wang and Ruoxi Jia. 2023. Data Banzhaf: A Robust Data Valuation Framework for Machine Learning. arXiv:2205.15466 [cs.LG]
- Wang and Bovik (2002) Zhou Wang and A.C. Bovik. 2002. A universal image quality index. IEEE Signal Processing Letters 9, 3 (2002), 81–84. https://doi.org/10.1109/97.995823
- Wang et al. (2004) Zhou Wang, A.C. Bovik, H.R. Sheikh, and E.P. Simoncelli. 2004. Image quality assessment: from error visibility to structural similarity. IEEE Transactions on Image Processing 13, 4 (2004), 600–612. https://doi.org/10.1109/TIP.2003.819861
- Wang et al. (2003) Z. Wang, E.P. Simoncelli, and A.C. Bovik. 2003. Multiscale structural similarity for image quality assessment. In The Thrity-Seventh Asilomar Conference on Signals, Systems & Computers, 2003, Vol. 2. 1398–1402 Vol.2. https://doi.org/10.1109/ACSSC.2003.1292216
- Waterman et al. (1976) M.S. Waterman, T.F. Smith, and W.A. Beyer. 1976. Some Biological Sequence Metrics. Advances in Math. 20, 4 (1976), 367–387.
- Wes McKinney (2010) Wes McKinney. 2010. Data Structures for Statistical Computing in Python. In Proceedings of the 9th Python in Science Conference, Stéfan van der Walt and Jarrod Millman (Eds.). 56 – 61. https://doi.org/10.25080/Majora-92bf1922-00a
- Wilkinson et al. (2018) Mark D. Wilkinson, Susanna-Assunta Sansone, Erik Schultes, Peter Doorn, Luiz Olavo Bonino da Silva Santos, and Michel Dumontier. 2018. A design framework and exemplar metrics for fairness. https://www.nature.com/articles/sdata2018118
- Woodie (2020) Alex Woodie. 2020. Data Prep Still Dominates Data Scientists’ Time, Survey Finds. https://www.datanami.com/2020/07/06/data-prep-still-dominates-data-scientists-time-survey-finds/. Accessed on May 15, 2023.
- Yalaoui and Boukhedouma (2021) Mehdi Yalaoui and Saida Boukhedouma. 2021. A survey on data quality: principles, taxonomies and comparison of approaches. In 2021 International Conference on Information Systems and Advanced Technologies (ICISAT). 1–9. https://doi.org/10.1109/ICISAT54145.2021.9678209
- Zhao and Liu (2007) Zheng Zhao and Huan Liu. 2007. Spectral Feature Selection for Supervised and Unsupervised Learning. In ICML. 1151–1157.
- Zhu et al. (2018) Rui Zhu, Ziyu Wang, Zhanyu Ma, Guijin Wang, and Jing-Hao Xue. 2018. LRID: A new metric of multi-class imbalance degree based on likelihood-ratio test. Pattern Recognition Letters 116 (2018), 36–42. https://doi.org/10.1016/j.patrec.2018.09.012