Eye Tracking on Text Reading with Visual Enhancements
Abstract.
The interplay between text and visualization is gaining importance for media where traditional text is enriched by visual elements to improve readability and emphasize facts. In two controlled eye-tracking experiments (), we approach answers to the question: How do visualization techniques influence reading behavior? We compare plain text to that marked with highlights, icons, and word-sized data visualizations. We assess quantitative metrics (eye movement, completion time, error rate) and subjective feedback (personal preference and ratings). The results indicate that visualization techniques, especially in the first experiment, show promising trends for improved reading behavior. The results also show the need for further research to make reading more effective and inform suggestions for future studies.
1. Introduction
The investigation of reading behavior has a long tradition in psychology research (Huey, 1908). For eye tracking research, the seminal work of Rayner (1977) helped identify common eye movements during reading and information processing. Since then, many experiments have been conducted to identify how people read and interpret different visual stimuli (Rayner, 1998). One important category of such stimuli is data visualizations and infographics, often containing text and graphics to communicate information (Goldberg and Helfman, 2011; Netzel et al., 2017).
A simple way of enhancing text with visual elements relies on highlighting specific words and passages, for instance, to emphasize important facts during studies and to guide attention to results of keyword searches in text documents. Alternatively, symbolic representations of keywords can be embedded into text. Early examples can be found in the book The Elements of Euclid by Byrne (1847), where geometric shapes were integrated into the text of the book “… for the greater ease of learners.” Modern publications also use this technique, for instance, to differentiate between experimental conditions (Abdelaal et al., 2023). Furthermore, visualization research investigated how to encode data in word-sized graphics to communicate information, e.g., temporal changes with sparklines (Tufte, 2006). Those word-sized graphics have been successfully used, for example, to augment texts that explain eye-tracking data (Beck et al., 2016, 2015), as part of scientific texts (Latif and Beck, 2018), or for better awareness of discussion topics in social media feeds (Huth et al., 2021b, a). Goffin et al. (2015, 2017) discussed design considerations of word-sized graphics in text and performed a study that finds positive effects on information gain.
A considerable body of work exists on text highlighting and its effects on comprehension and memory (Fowler and Barker, 1974; Lorch, 1989; Ben-Yehudah and Eshet-Alkalai, 2018), but only a few eye-tracking studies investigated the effect of text highlighting on reading behavior. Chi et al. (2007) found validation for the von Restorff isolation effect (Von Restorff, 1933), which states that highlighted areas draw the attention of the reader, whether they are important or not. Their study comprised three conditions; No highlights, keyword highlights, and ScentHighlights (Chi et al., 2005), which is an automatic approach for highlighting relevant keywords in texts. They found that approximately half of the fixations were in highlighted areas, suggesting a strong effect on reading behavior. Similarly, Yeari et al. (2017) studied if the level of information centrality, which refers to the importance of text segments, impacts online processing and offline memory. This specific study found that attention is driven by both highlights and the level of centrality, meaning that readers directed their attention to important words even if they were not highlighted. Interestingly, highlighting had no significant effect on the ability to recall information acquired by reading the text. These studies only looked at text highlighting, while our work also investigates reading behavior on text with icons and word-sized graphics. So far, there is no consensus on whether those visual enhancements aid people in recalling information from text documents (Ruchikachorn and Rattanawicha, 2018) or if they distract their reading flow. In this work, we aim to fill this research gap by addressing the following question:
How do visual enhancements (i.e., highlighting, icons) and word-sized graphics influence reading behavior with respect to gaze patterns, reading speed, and information assimilation?
We hypothesize that there are differences in the reading behavior of visually enhanced text versus plain text, and that task performance increases, i.e., people can grasp more information quicker. Our contributions in this work are two experiments to explore differences in viewing behavior when reading text with different visual enhancements. We investigate deviations from the baseline (plain text) for a memory task of facts in a short description text. Our results are also available via OSF (OSF, 2024) and indicate differences in viewing behavior, especially for texts with highlighted words.
2. Eye Tracking of Visually Enhanced Text
To find out how visual enhancement of text influences reading behavior, we conducted a small-scale study comprising two experiments investigating the influence of (1) highlighting and symbols and (2) word-sized graphics.
2.1. Participants and Experimental Setup
The experiments were conducted in a controlled lab environment isolated from outside distractions. For remote eye tracking, we used a Tobii Pro Spectrum with a resolution of 1920 1080 pixels. Gaze was recorded at 1200 Hz and processed into fixations by the Tobii I-VT filter with default settings. We used a 9-point calibration and displayed the stimuli horizontally and vertically centered.
We invited participants who volunteered to perform both experiments in consecutive order. Participation was completely voluntary without further compensation. of the participants were between 18 and 24, between 25 and 35, and participants were older than 35. participants identify as female, and as male. All but one participant had good or very good English language skills. Most participants frequently used icons or emojis and had high or very high experience with bar charts, line charts, and pie charts. After giving their informed consent and answering some demographic questions, participants were introduced to each experiment. They conducted one test task with a short text for each condition, before starting the experiment recording. The two experiments took about minutes together per participant.
We measured task performance as accuracy in answering the questions for each stimulus, time to read the texts and time to answer the questions. In terms of completion times, we did not limit the time for participants to read the text, nor when asked the respective question to remember the facts of a text. We also measured gaze data with fixations and saccades. In both experiments, participants rated task difficulty, confidence in their answer, and their stress level when solving the task after each stimulus-question pair. At the end of each experiment, we asked about participant’s reading strategies and preferences regarding the visualization techniques. All stimuli and questions can be found in this paper’s OSF repository (OSF, 2024).
2.2. Experiment 1: Highlighting and Symbols in Text
The first experiment compared three conditions: (1) plain text (as baseline ![]() ), (2) highlighting
), (2) highlighting ![]() , and (3) symbols
, and (3) symbols ![]() .
In a within-subjects design, we tested text augmented with each visualization type against the baseline without visual enhancements.
Highlighting specific terms in a text can steer readers’ attention to important aspects and may help them grasp information quickly.
Similarly, symbols that augment important terms catch the attention to these terms and may ease text understanding.
Our goal was to measure the strength of those effects.
.
In a within-subjects design, we tested text augmented with each visualization type against the baseline without visual enhancements.
Highlighting specific terms in a text can steer readers’ attention to important aspects and may help them grasp information quickly.
Similarly, symbols that augment important terms catch the attention to these terms and may ease text understanding.
Our goal was to measure the strength of those effects.
Stimuli and Task
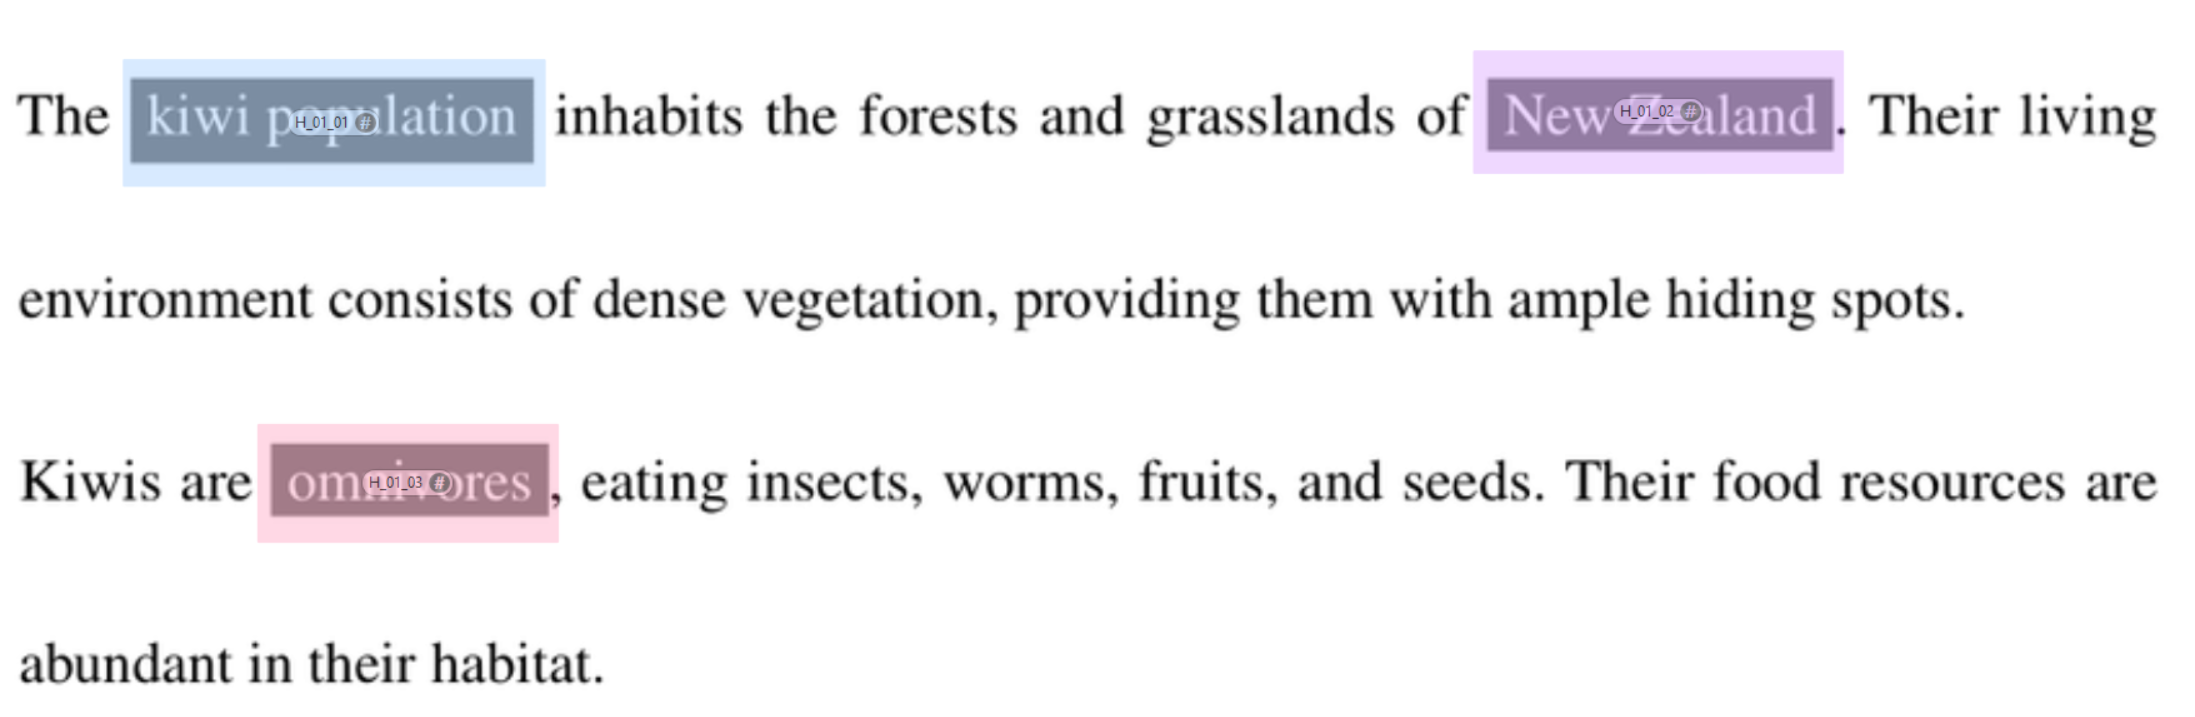
We created short texts with Chat GPT 3.5 (2023) about different animals in the style of a lexicon article. The texts contained information about habitats, food sources, etc. Some examples are depicted in Figure 1.
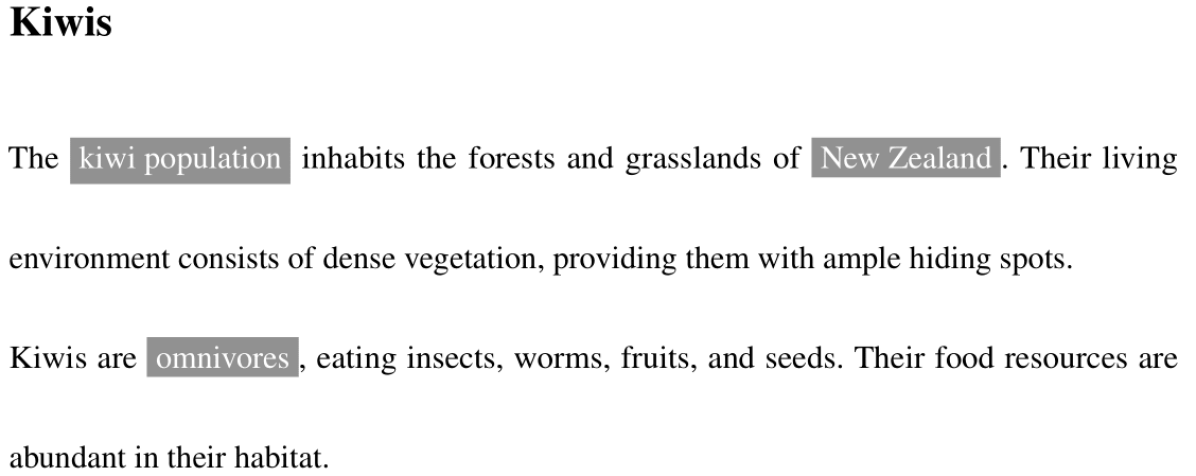
![]() \DescriptionThis figure shows two images of text about animals.
The image on top is a text about kiwis, with some of the factual terms in the text highlighted with a grey background, for example, “New Zealand” as a habitat region.
The bottom text is about bald eagles.
After some of the factual terms, there is an icon that depicts those terms.
\DescriptionThis figure shows two images of text about animals.
The image on top is a text about kiwis, with some of the factual terms in the text highlighted with a grey background, for example, “New Zealand” as a habitat region.
The bottom text is about bald eagles.
After some of the factual terms, there is an icon that depicts those terms.
In pilot studies within our lab, we iteratively refined the text length to avoid fatigue throughout the experiment, but still have enough information to challenge short-term memory. We edited the texts to the same formatting and length of to words, so that each stimulus contained a similar number of facts about the respective animal. We evenly emphasized about percent of these facts with the visual enhancements so participants could not rely on learning which type of fact was asked. Because the facts in the texts were AI-generated, we warned the participants that they may not be entirely correct. This feature also helped to balance against prior knowledge that participants might have had about the animals. The participants were given five texts per condition, with the order of the conditions based on a balanced Latin square. Before each text appeared on the screen, we briefly showed an “X” at the top left to guide the gaze to the beginning position of the text. When participants indicated they were done reading a text, we switched the view to the respective question about the text, in which we asked about one of the facts. There were multiple correct answer options, for example, correct answers to “What makes bald eagles skilled hunters?” could be “ good eyesight” or “diving abilities”.
2.3. Experiment 2: Word-sized Graphics
The second experiment considers how participants read text containing word-sized graphics. Such visualizations depict data and are more complex than symbols. Consequently, people have to investigate such visual elements in text longer and more intensely than symbols and highlighting, where preattentive visual features are often sufficient to convey their purpose. Analogous to Experiment 1, Experiment 2 was performed in a within-subjects design with the same participants.
Stimuli and Task
We only included one condition in addition to the second baseline ![]() of plain text.
The text was created similarly to Experiment 1, including statistical information enhanced by word-sized graphics
of plain text.
The text was created similarly to Experiment 1, including statistical information enhanced by word-sized graphics ![]() (Figure 2).
(Figure 2).
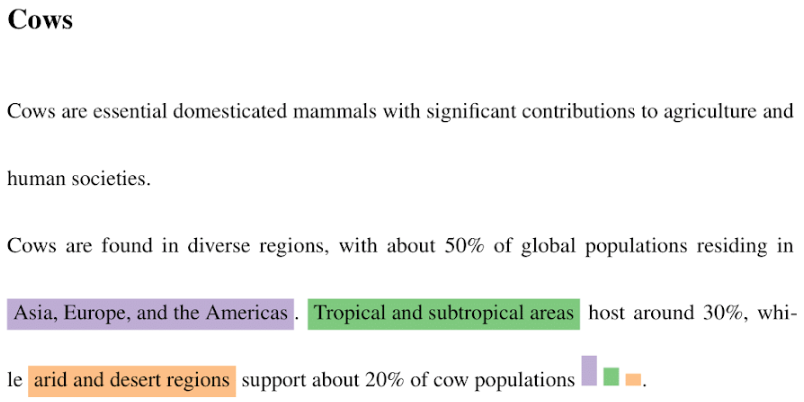
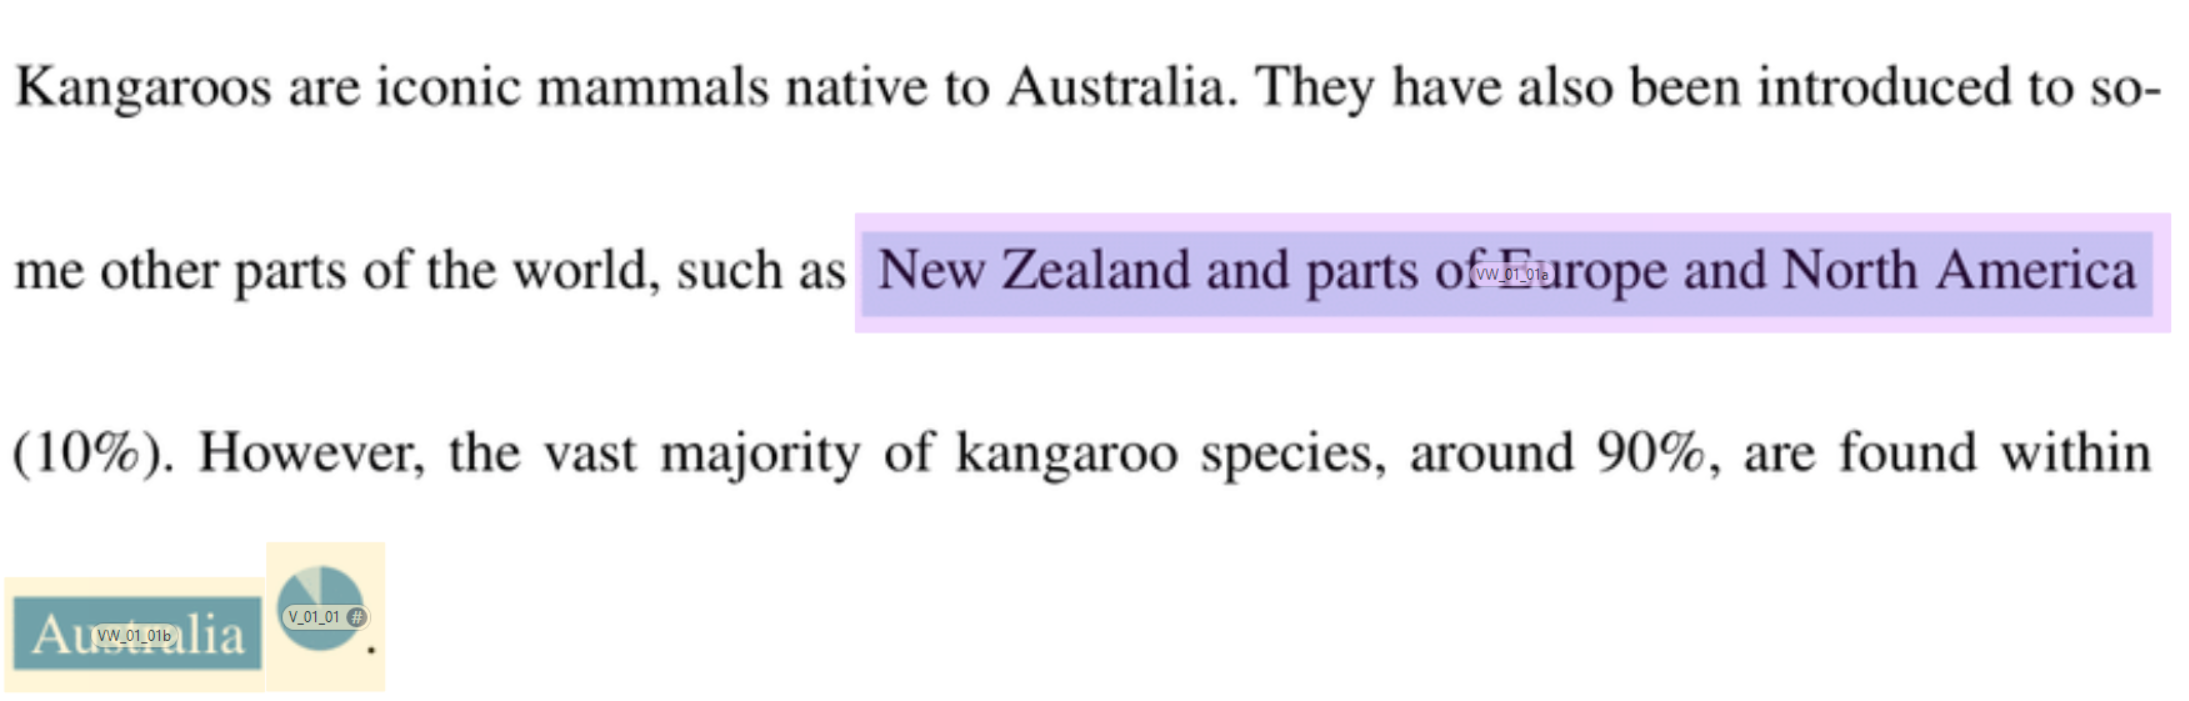
 \DescriptionThis figure shows two images of text about animals.
The image on top is a text about cows, with some of the factual terms in the text highlighted with a colored background, for example, “Asia, Europe, and the Americas” as a habitat region.
At the end of the sentence that has the colored terms, there is a bar chart that depicts the percentages of how many cows live in that region.
The bottom text is about kangaroos.
Again, some of the factual terms in the text are highlighted with a colored background.
In this text, there is a pie chart that depicts the percentages.
\DescriptionThis figure shows two images of text about animals.
The image on top is a text about cows, with some of the factual terms in the text highlighted with a colored background, for example, “Asia, Europe, and the Americas” as a habitat region.
At the end of the sentence that has the colored terms, there is a bar chart that depicts the percentages of how many cows live in that region.
The bottom text is about kangaroos.
Again, some of the factual terms in the text are highlighted with a colored background.
In this text, there is a pie chart that depicts the percentages.
We added simple diagrams, such as bar charts, line charts, and pie charts, and highlighted the terms that correspond to the elements of the chart in the respective colors. Again, about percent of the facts in each text were emphasized. We chose basic visualization types because of their widespread familiarity and ease of understanding. We gave each participant five texts, again in balanced order of conditions. Similar to Experiment 1, we asked participants to read the text, and when they were done, we asked about one of the facts in the text. Here, we asked about percentages, for example: “How much of the total cow population inhabit tropical and subtropical areas?”, to which the correct answer was “.” We excluded one of the stimuli in the evaluation, because only after the experiment we noticed that there was no highlighted text that corresponded to the visualization that we asked about.

This Figure is a graphical representation of the timeline of the experiments. First is Experiment 1 with three conditions, then Experiment 2 with two conditions.
Figure 3 shows the temporal setup of both experiments. The independent variable is the experiment condition, and as dependent variables, we measured reading and question answering time, answer accuracy, AOI fixations, saccade amplitude, as well as qualitative ratings. We chose not to prime the participants, as we did not see any benefit and did not want to increase the complexity of the experiments.
3. Results
We investigate the results of both experiments with traditional performance analysis, i.e., correctness and completion times. Further, we analyze differences in fixations and saccades between conditions. We evaluate significance based on the confidence intervals of pairwise differences (Besançon and Dragicevic, 2017; Cumming, 2013; Dragicevic, 2016). If those do not overlap with , there is evidence of a difference. This can be seen as equivalent to using p-value tests (Krzywinski and Altman, 2013). The further away the interval is from , the stronger the evidence. In this paper’s OSF repository (OSF, 2024), there is data from the experiments, additional figures, all underlying data of the figures, as well as the scripts we used. We further performed statistical inference on the data, details can be found in the OSF supplemental material.
3.1. Performance
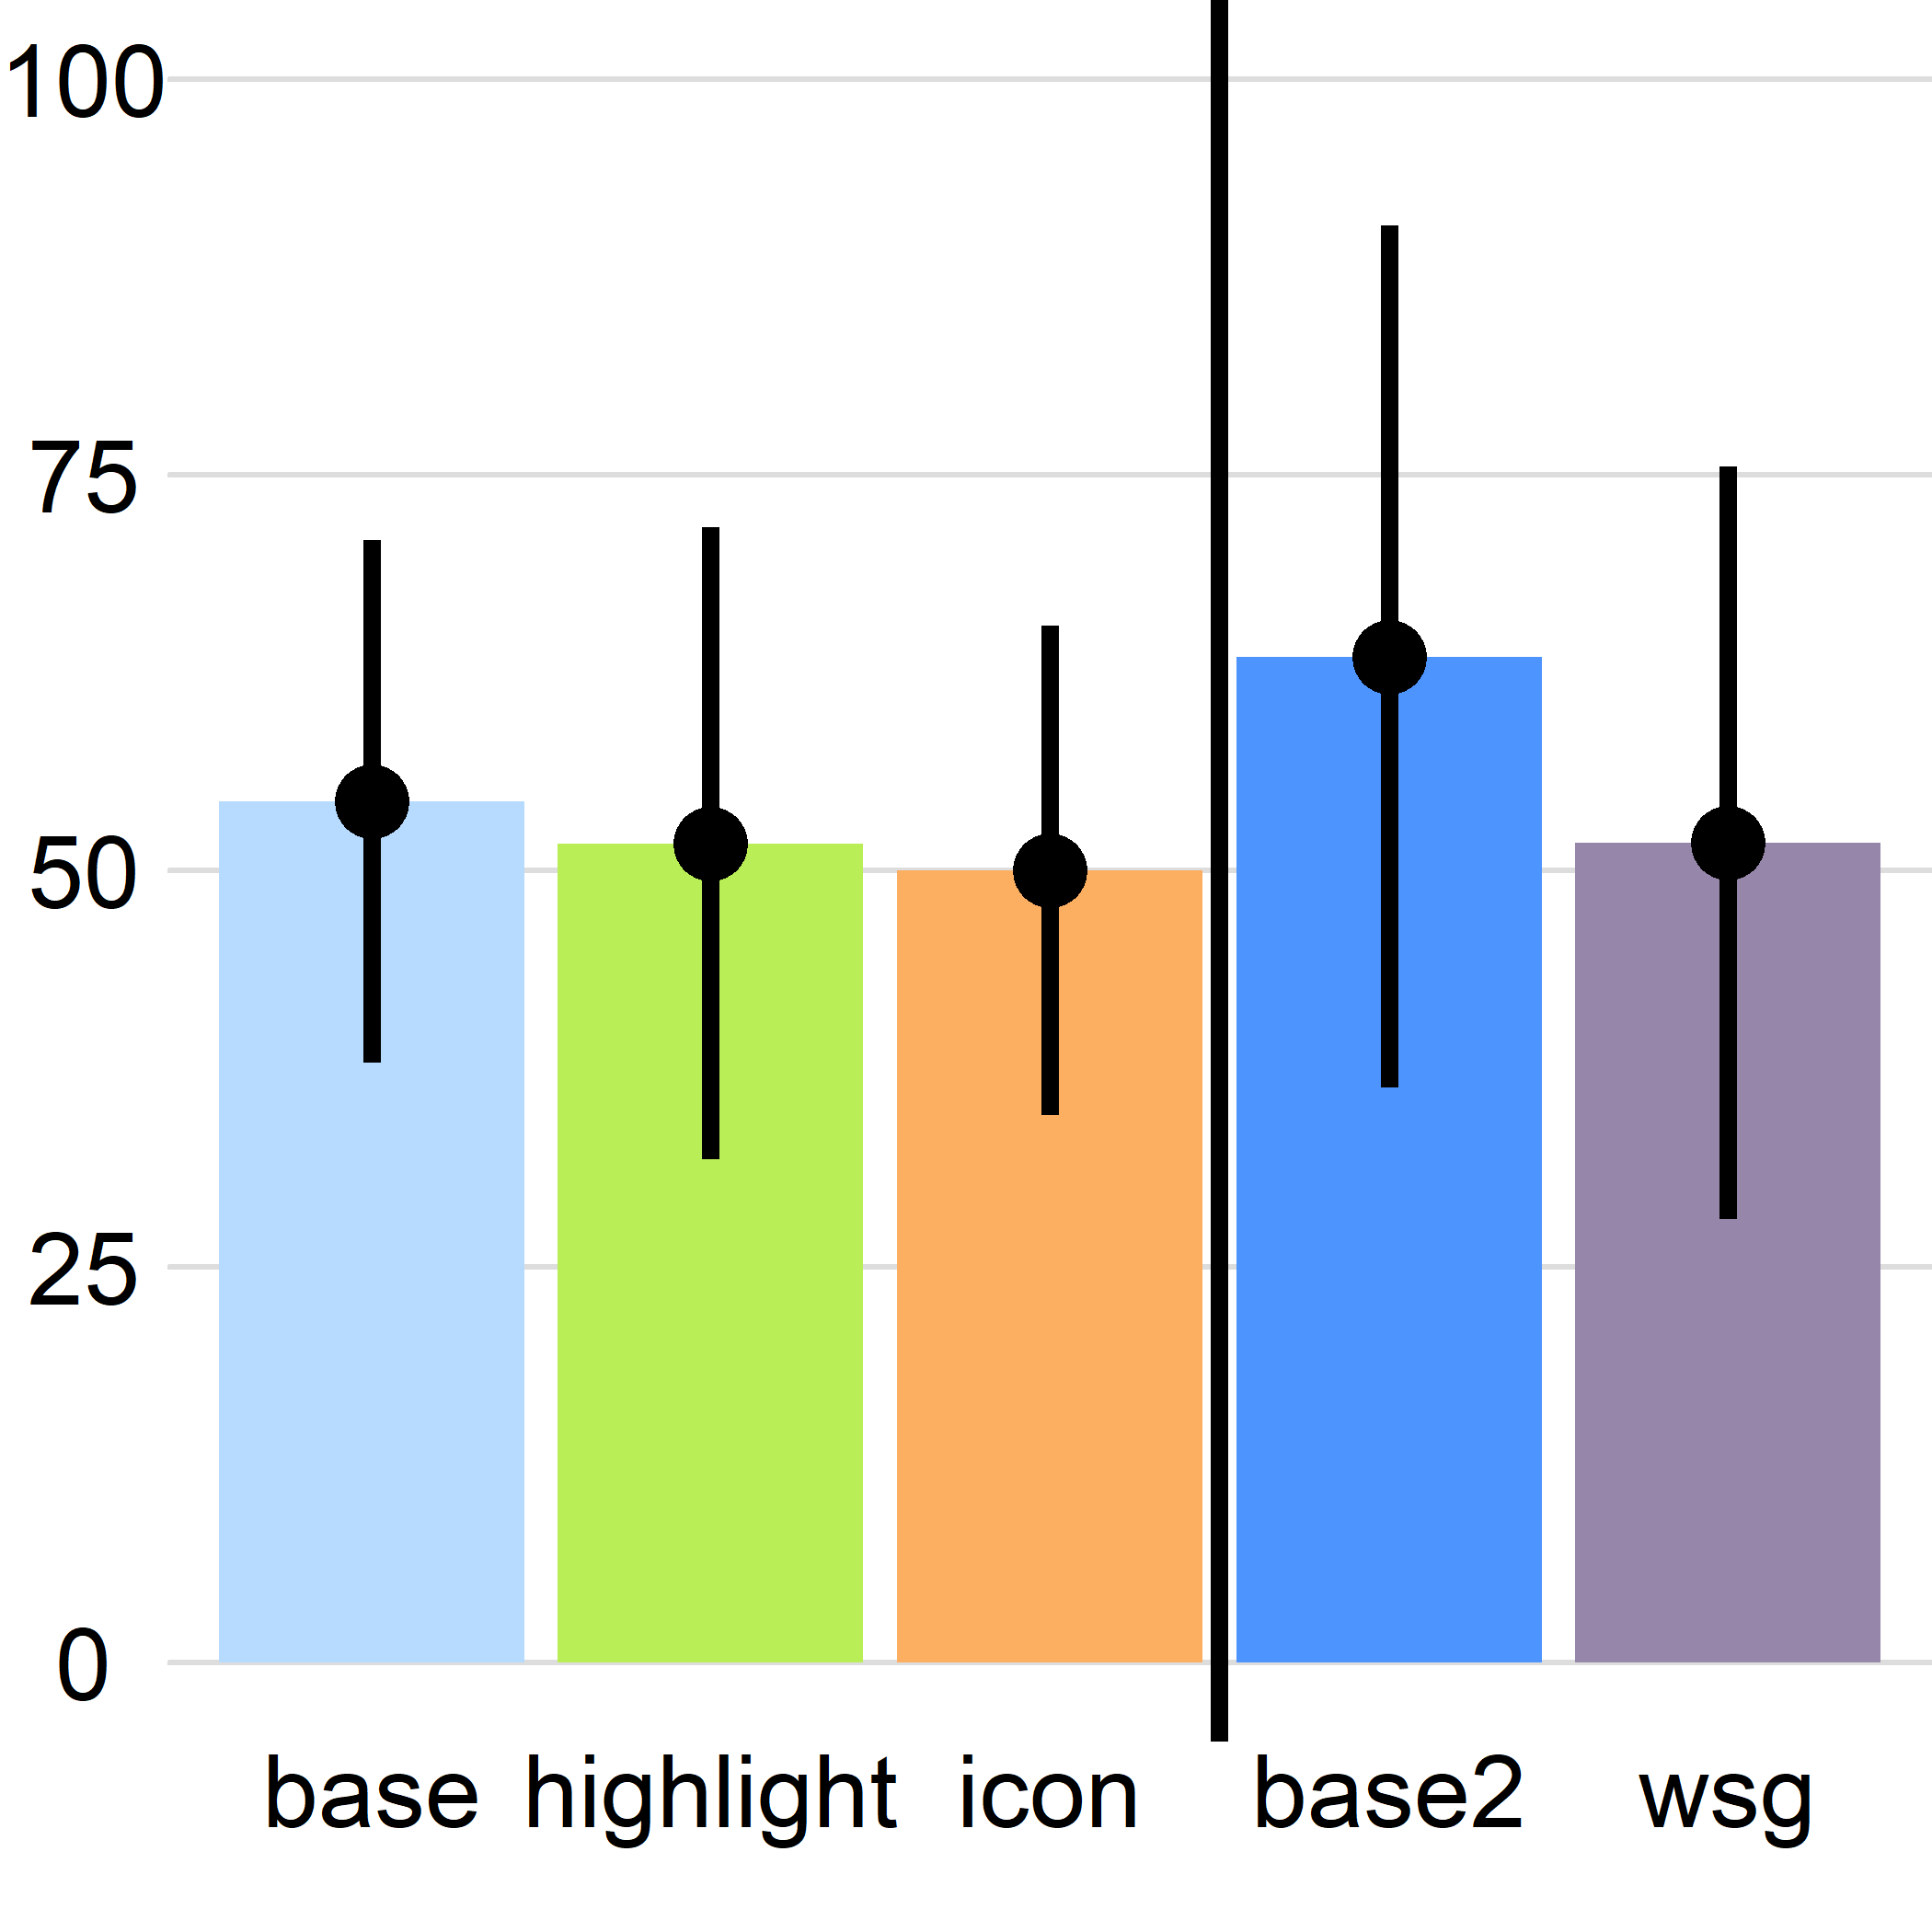
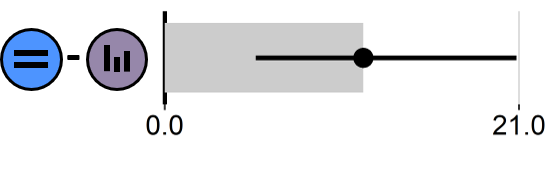
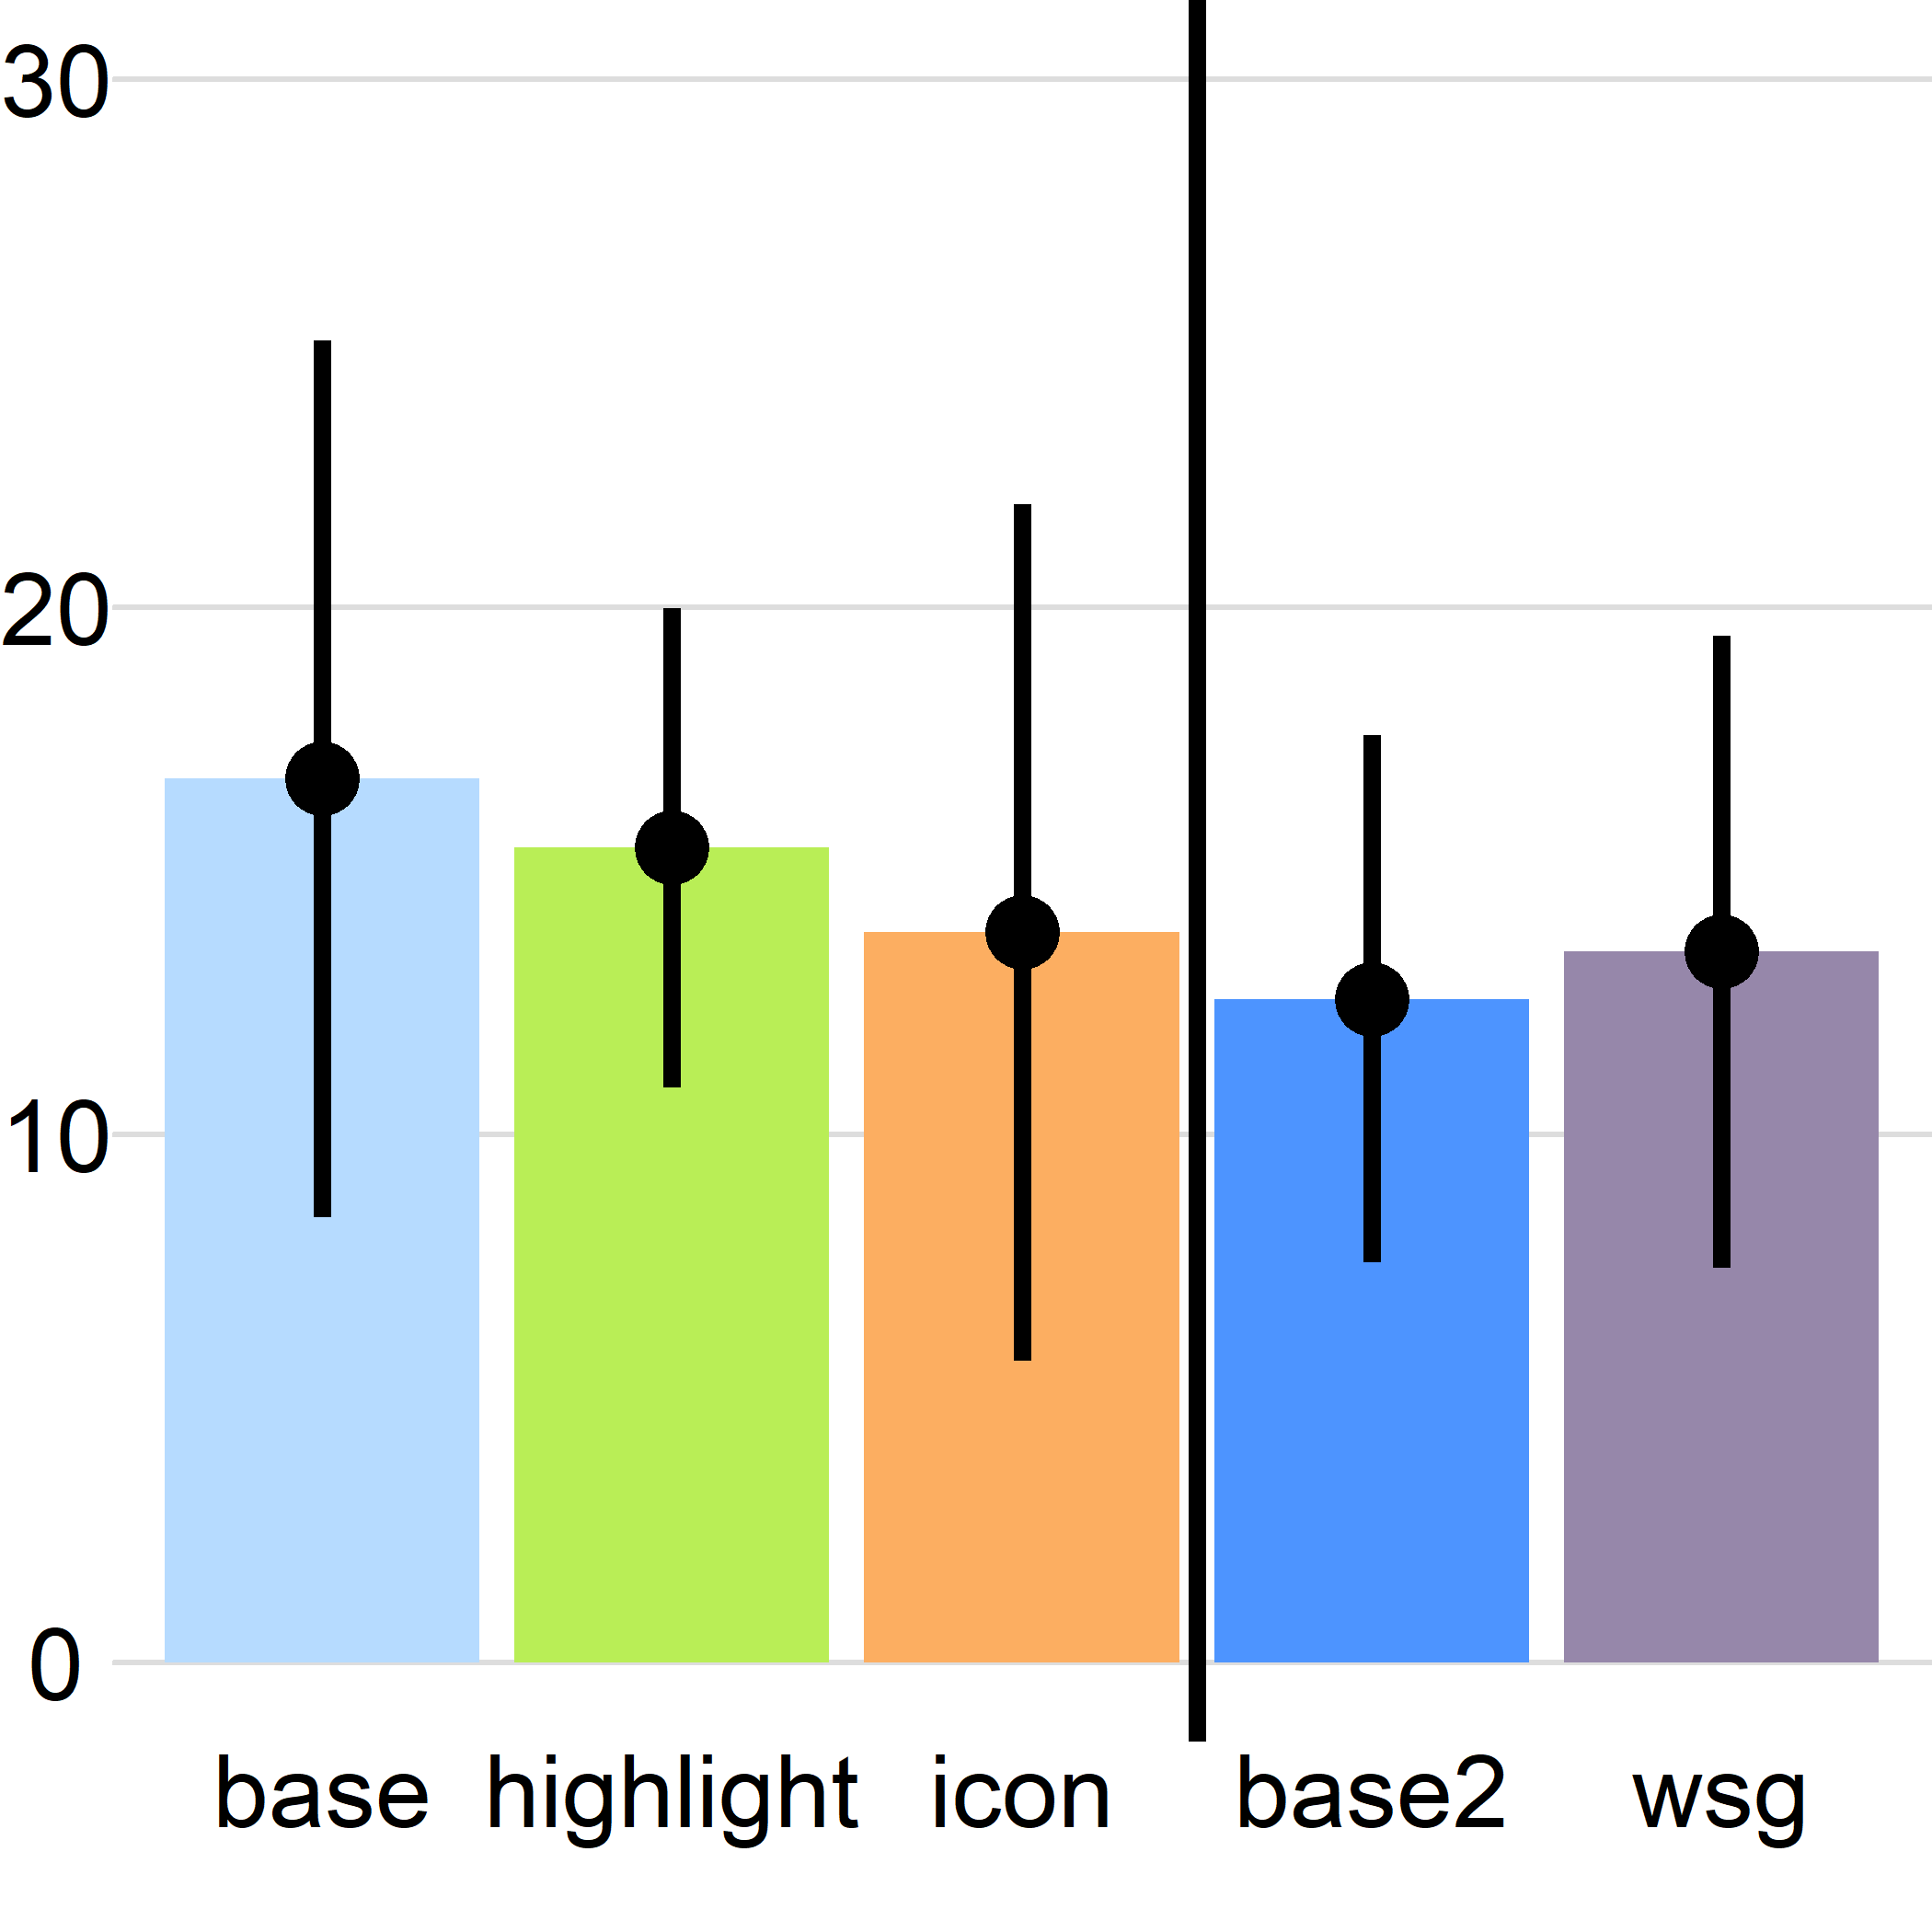
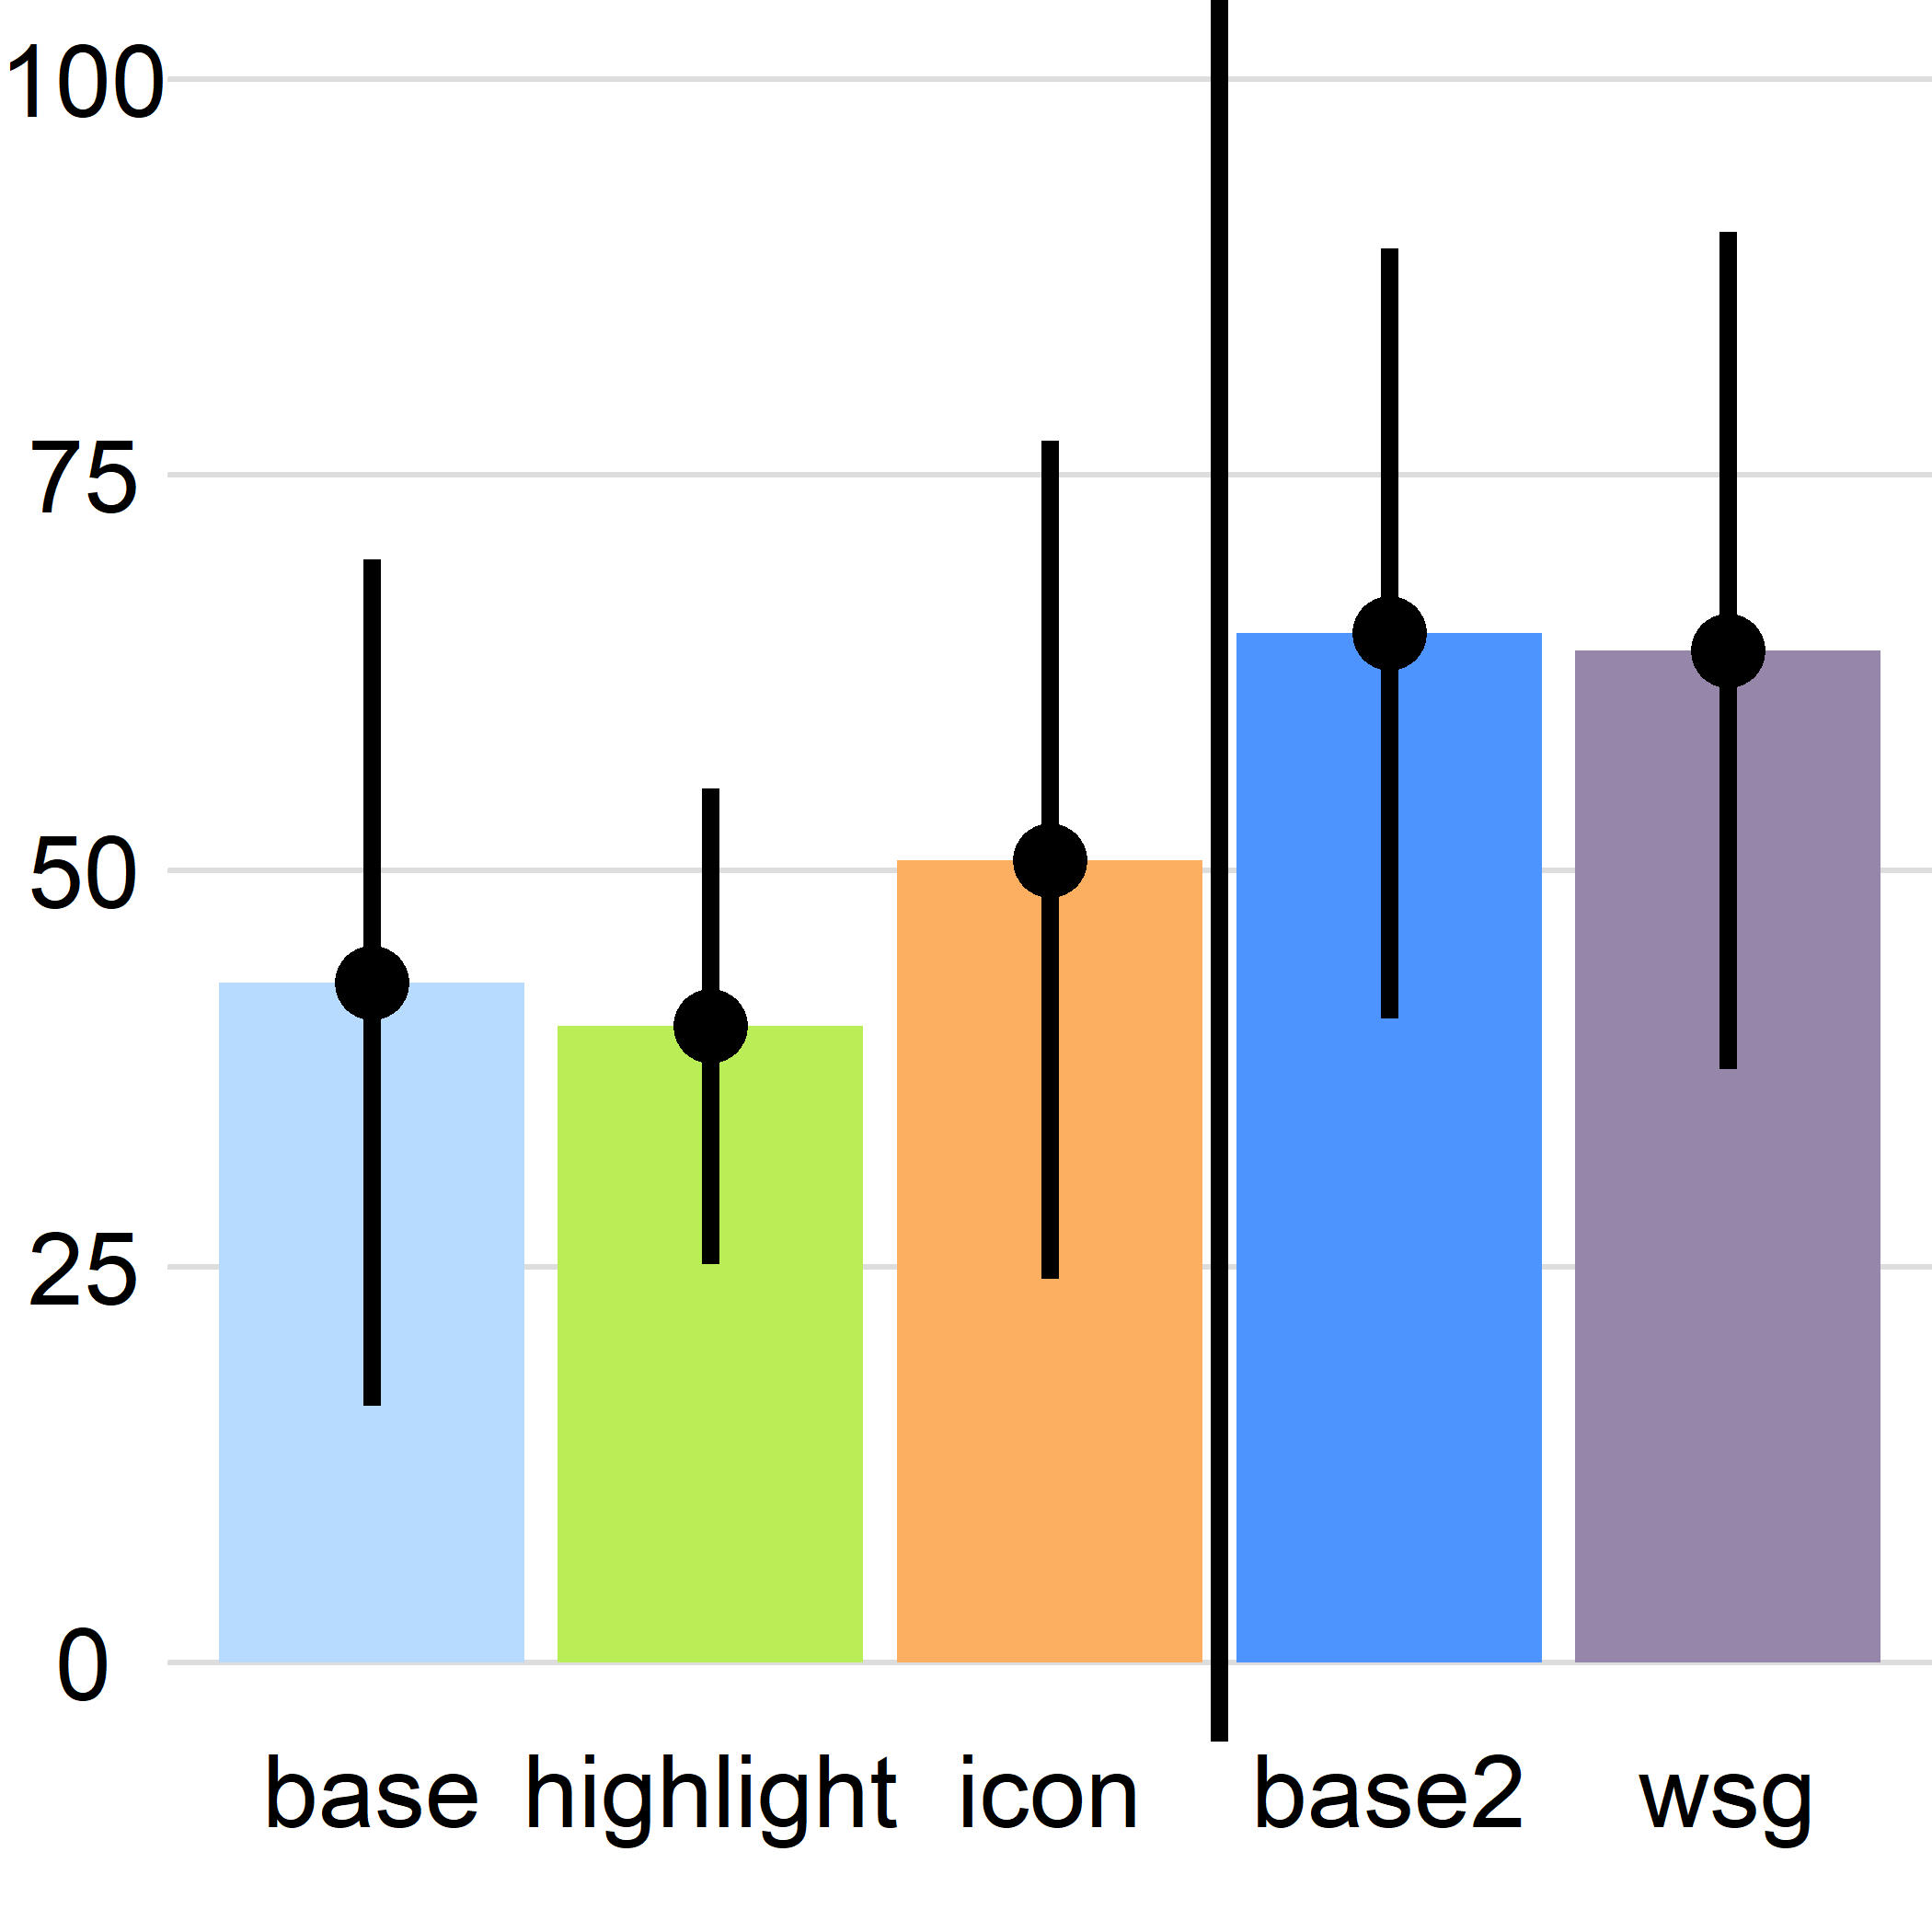

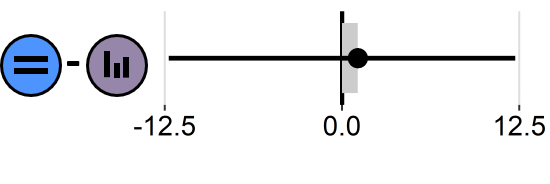
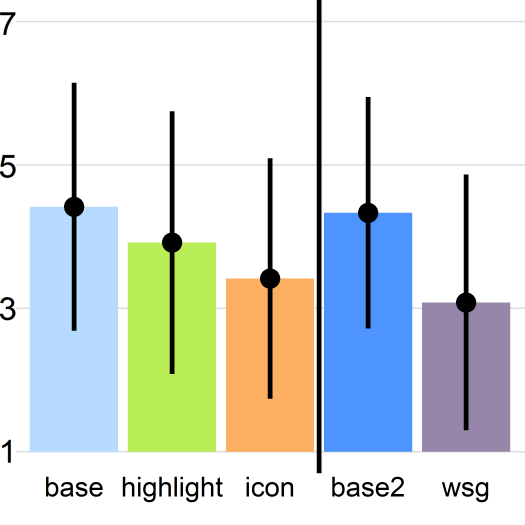
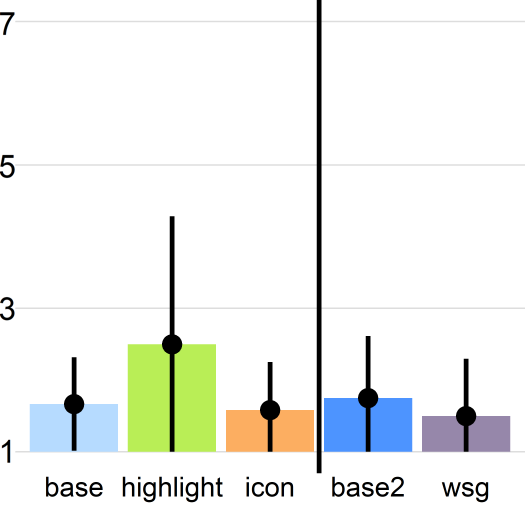
Describes statistical analysis (means, CIs, pairwise differences). Reading time Experiment 1: For the baseline condition, the reading time has a mean of 54.37s and a CI of [45.25s, 63.3s], the highlight condition has a mean of 51.72s and a CI of [42.43s, 64.49s], and the icon condition has a mean of 50s and a CI of [42.3s, 59.41s]. The mean of pairwise difference between the baseline and the highlight condition is 2.65, with a CI of [-8.58, 9.08]. The mean of pairwise difference between the baseline and the icon condition is 4.36, with a CI of [-0.61, 11.07]. The mean of pairwise difference between the highlight and the icon condition is 1.71, with a CI of [-7.4, 17.37]. Reading time Experiment 2: For the baseline 2 condition, the reading time has a mean of 63.53s and a CI of [50.89s, 81.39s], and the word-sized graphics (wsg) condition has a mean of 51.77s and a CI of [40.82s, 67.13s]. The mean of pairwise difference between the baseline 2 and the wsg condition is 11.76, with a CI of [5.39, 20.85]. Question answering time Experiment 1: For the baseline condition, the time to answer the question has a mean of 16.75s and a CI of [13.10s, 22.28s], the highlight condition has a mean of 15.44s and a CI of [13.32s, 18.35s], and the icon condition has a mean of 13.83s and a CI of [10.78s, 20.68s]. The mean of pairwise difference between the baseline and the highlight condition is 1.3, with a CI of [-1.75, 7.2]. The mean of pairwise difference between the baseline and the icon condition is 2.91, with a CI of [-2.2, 10.13]. The mean of pairwise difference between the highlight and the icon condition is 1.61, with a CI of [-2.81, 7.37]. Question answering time Experiment 2: For the baseline 2 condition, the time to answer the question has a mean of 12.58s and a CI of [10.51s, 16.25s], and the word-sized graphics (wsg) condition has a mean of 13.47s and a CI of [10.56s, 17.05s]. The mean of pairwise difference between the baseline 2 and the wsg condition is -0.89, with a CI of [-4.87, 2.81]. Accuracy Experiment 1: For the baseline condition, the accuracy has a mean of 42.95% and a CI of [28.85%, 58.33%], the highlight condition has a mean of 40.2% and a CI of [32.84%, 49.51%], and the icon condition has a mean of 50.7% and a CI of [34.03%, 63.19%]. The mean of pairwise difference between the baseline and the highlight condition is 2.75, with a CI of [-11.43, 16.55]. The mean of pairwise difference between the baseline and the icon condition is -7.75, with a CI of [-18.31, 7.53]. The mean of pairwise difference between the highlight and the icon condition is -10.5, with a CI of [-25.12, 6.88]. Accuracy Experiment 2: For the baseline 2 condition, the accuracy has a mean of 65% and a CI of [50%, 76.67%], and the word-sized graphics (wsg) condition has a mean of 63.89% and a CI of [47.22%, 75%]. The mean of pairwise difference between the baseline 2 and the wsg condition is 1.11, with a CI of [-12.22, 12.22].
Figure 5(c) shows the results for text reading time, question answering time, and accuracy. Since time was not limited, a relative increase in task duration between conditions for each participant might be an indicator that they had problems remembering the stimulus.
Experiment 1
Participants took a similar amount of time to read the stimulus texts for each of the conditions in Experiment 1, between and seconds on average (Figure 5(c), left).
The reading time is slightly higher in the baseline ![]() condition, and lowest for text with icons
condition, and lowest for text with icons ![]() , but there are no significant differences.
The average question answering time (Figure 5(c), center) shows a similar pattern.
Again, participants took the longest for the baseline
, but there are no significant differences.
The average question answering time (Figure 5(c), center) shows a similar pattern.
Again, participants took the longest for the baseline ![]() condition, and least for the icon
condition, and least for the icon ![]() condition, but without significant differences.
The accuracy of the responses (Figure 5(c), right) is highest for texts with icons
condition, but without significant differences.
The accuracy of the responses (Figure 5(c), right) is highest for texts with icons ![]() at around on average, lowest for texts with highlights
at around on average, lowest for texts with highlights ![]() at , with no significant differences.
at , with no significant differences.
Experiment 2
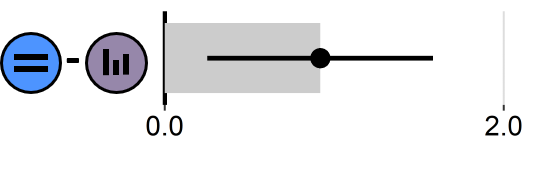
The reading time for each stimulus text (Figure 5(c), left) in Experiment 2 is significantly higher in the baseline 2 ![]() condition ( seconds on average) than for texts with word-sized graphics (wsg
condition ( seconds on average) than for texts with word-sized graphics (wsg ![]() , seconds).
In contrast, question answering time (Figure 5(c), center) is slightly higher in the wsg
, seconds).
In contrast, question answering time (Figure 5(c), center) is slightly higher in the wsg ![]() condition.
The accuracy (Figure 5(c), right) is similar for both conditions in Experiment 2 at around .
Overall, we found no significant differences in answering time and accuracy.
condition.
The accuracy (Figure 5(c), right) is similar for both conditions in Experiment 2 at around .
Overall, we found no significant differences in answering time and accuracy.
3.2. Focus on Visual Elements
 \DescriptionThis figure shows two images of text about animals, with some of the factual terms in the text highlighted with a colored background.
At the end of the sentence that has the colored terms, there is a small chart that depicts the percentages of the facts.
Additionally, the highlights and graphics are marked as areas of interest (AOIs), while the rest of the text is not.
\DescriptionThis figure shows two images of text about animals, with some of the factual terms in the text highlighted with a colored background.
At the end of the sentence that has the colored terms, there is a small chart that depicts the percentages of the facts.
Additionally, the highlights and graphics are marked as areas of interest (AOIs), while the rest of the text is not.
We defined the visualization elements as individual areas of interest (AOIs) to investigate transitions from text reading to visual elements.
Examples of these AOIs can be found in Figure 6.
For the baseline ![]()
![]() conditions, we defined AOIs on facts that are equivalent to the ones that were augmented with visual elements in the other conditions.
We investigated the relative duration of fixations on AOIs to identify potential distraction and the average saccade amplitude as indicator for jumps in reading in addition to the typical line regressions.
conditions, we defined AOIs on facts that are equivalent to the ones that were augmented with visual elements in the other conditions.
We investigated the relative duration of fixations on AOIs to identify potential distraction and the average saccade amplitude as indicator for jumps in reading in addition to the typical line regressions.
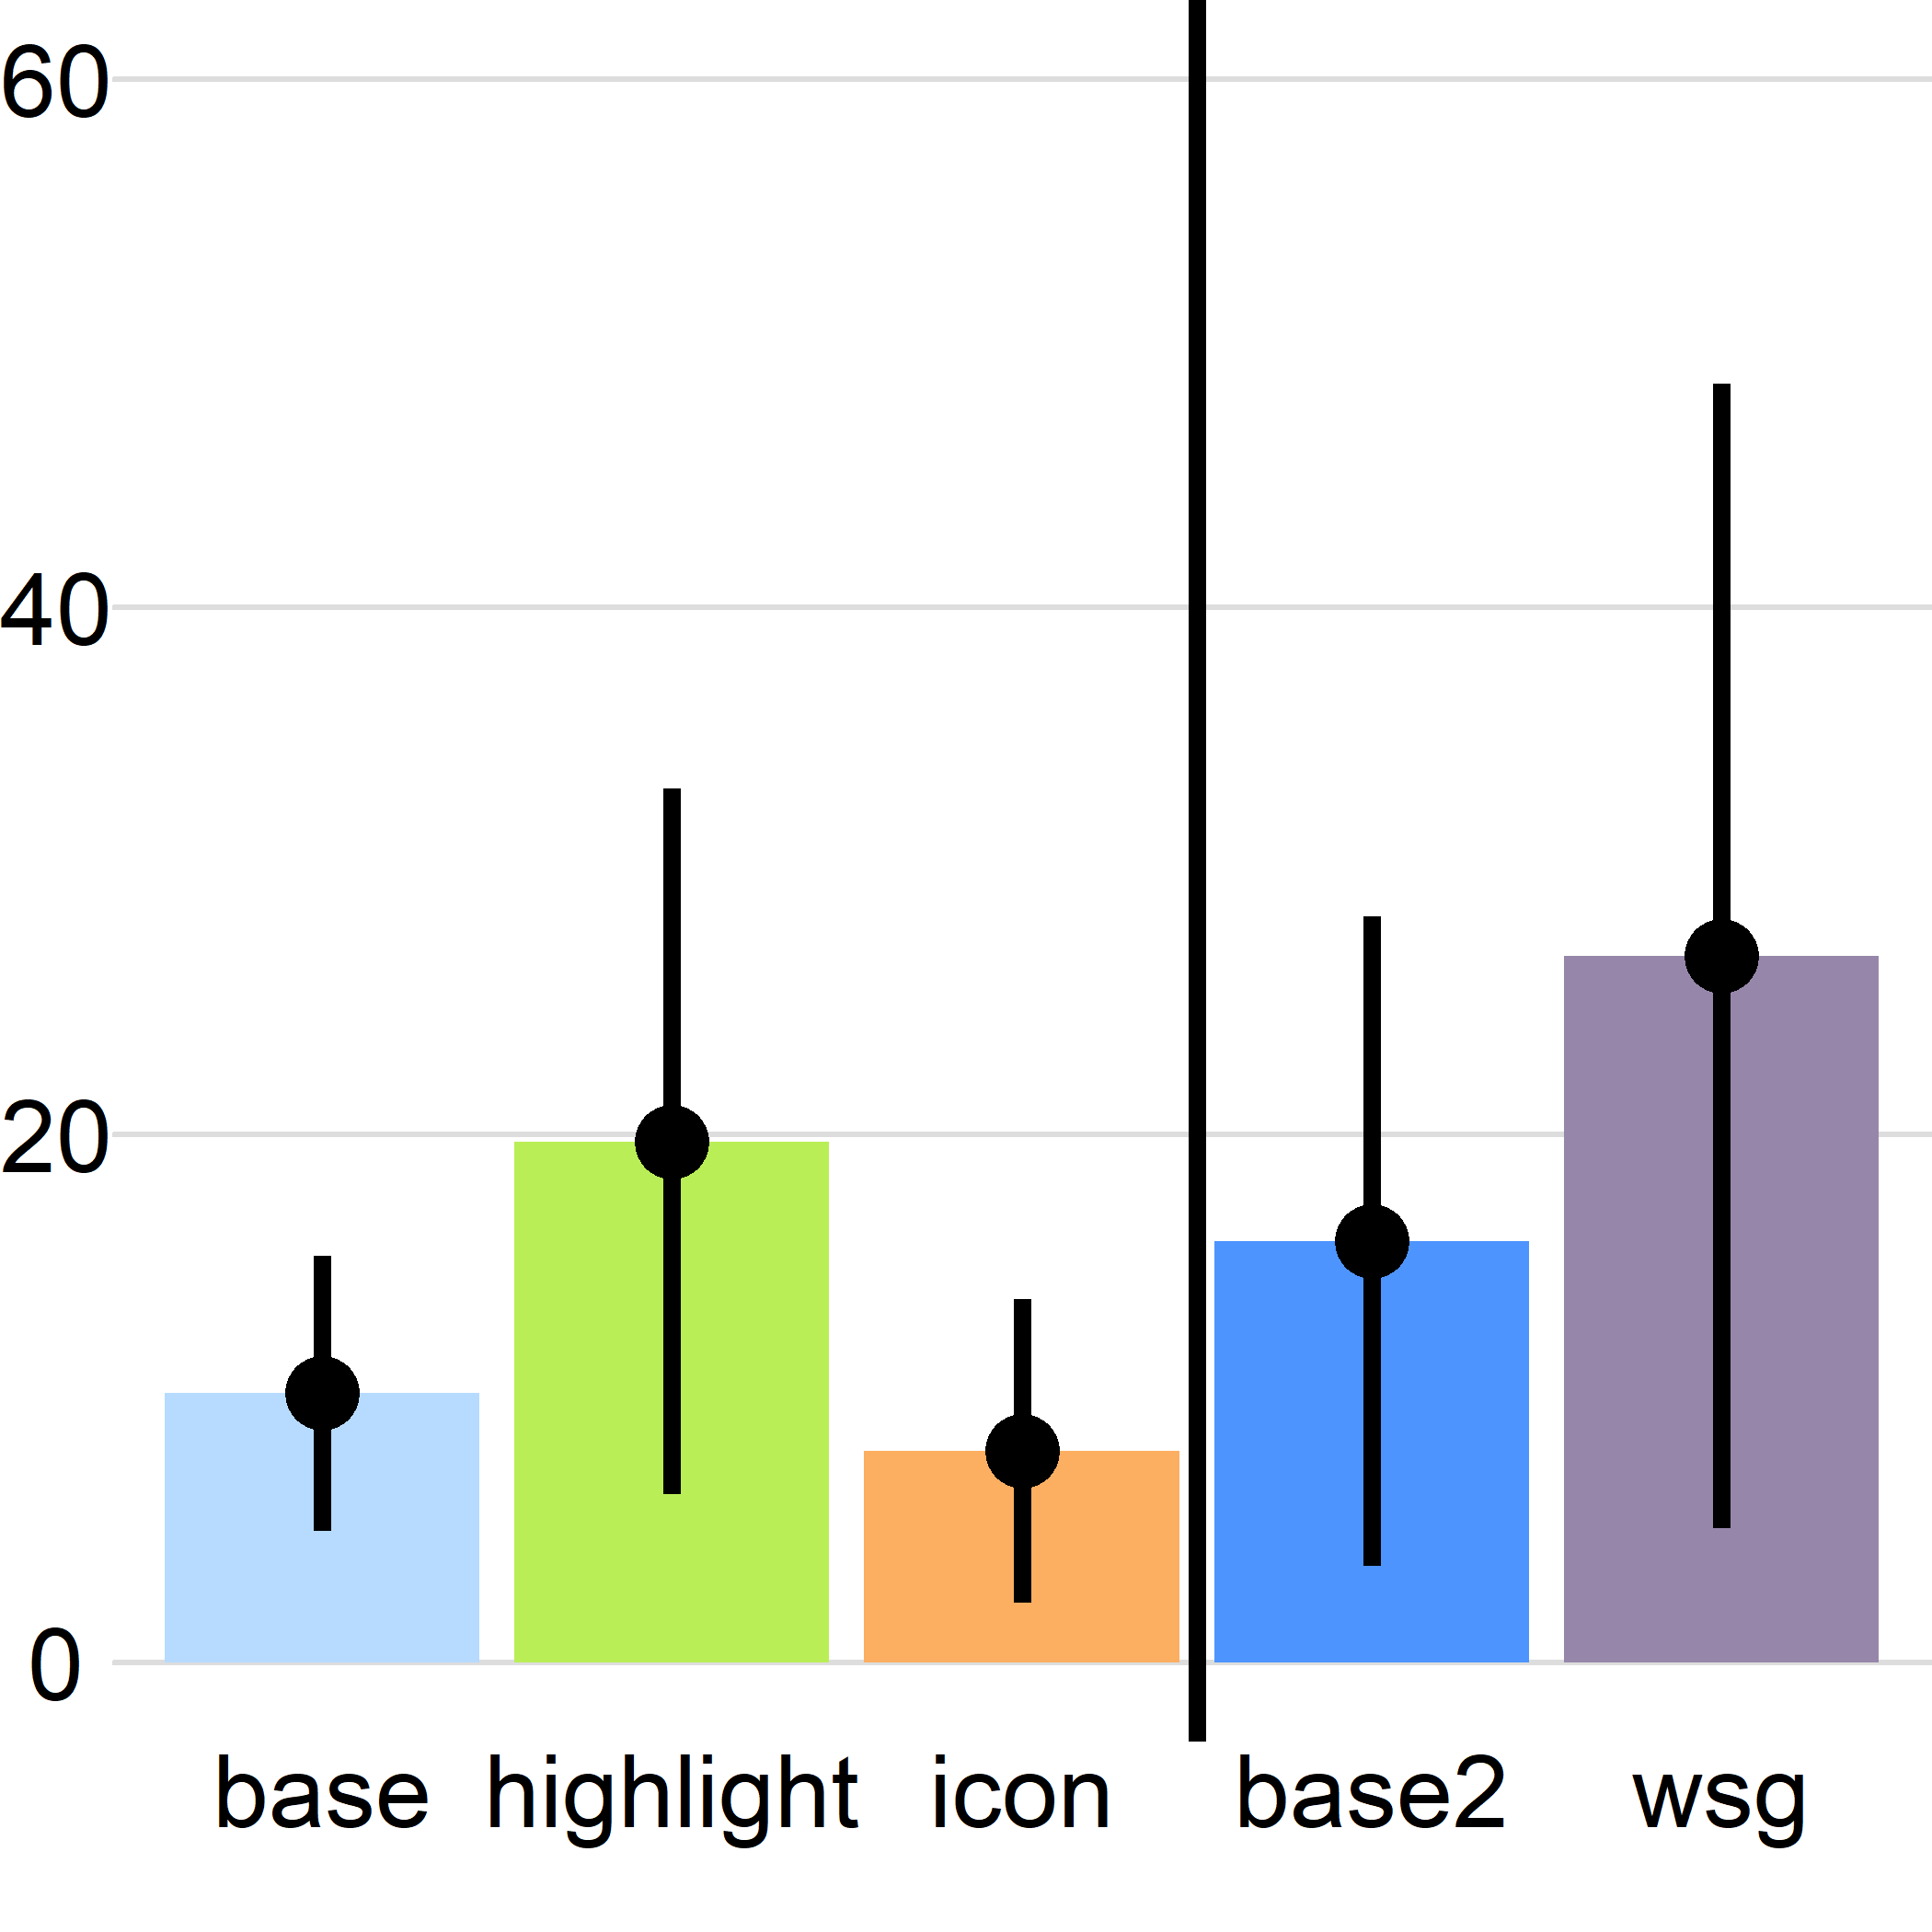
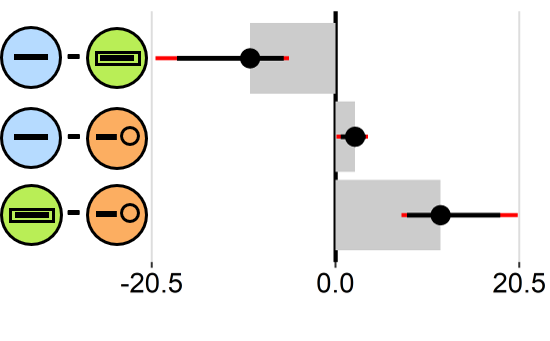
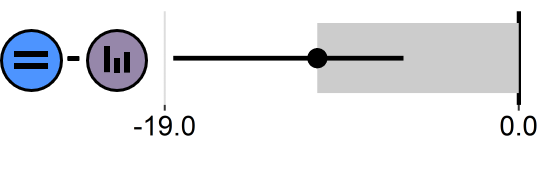
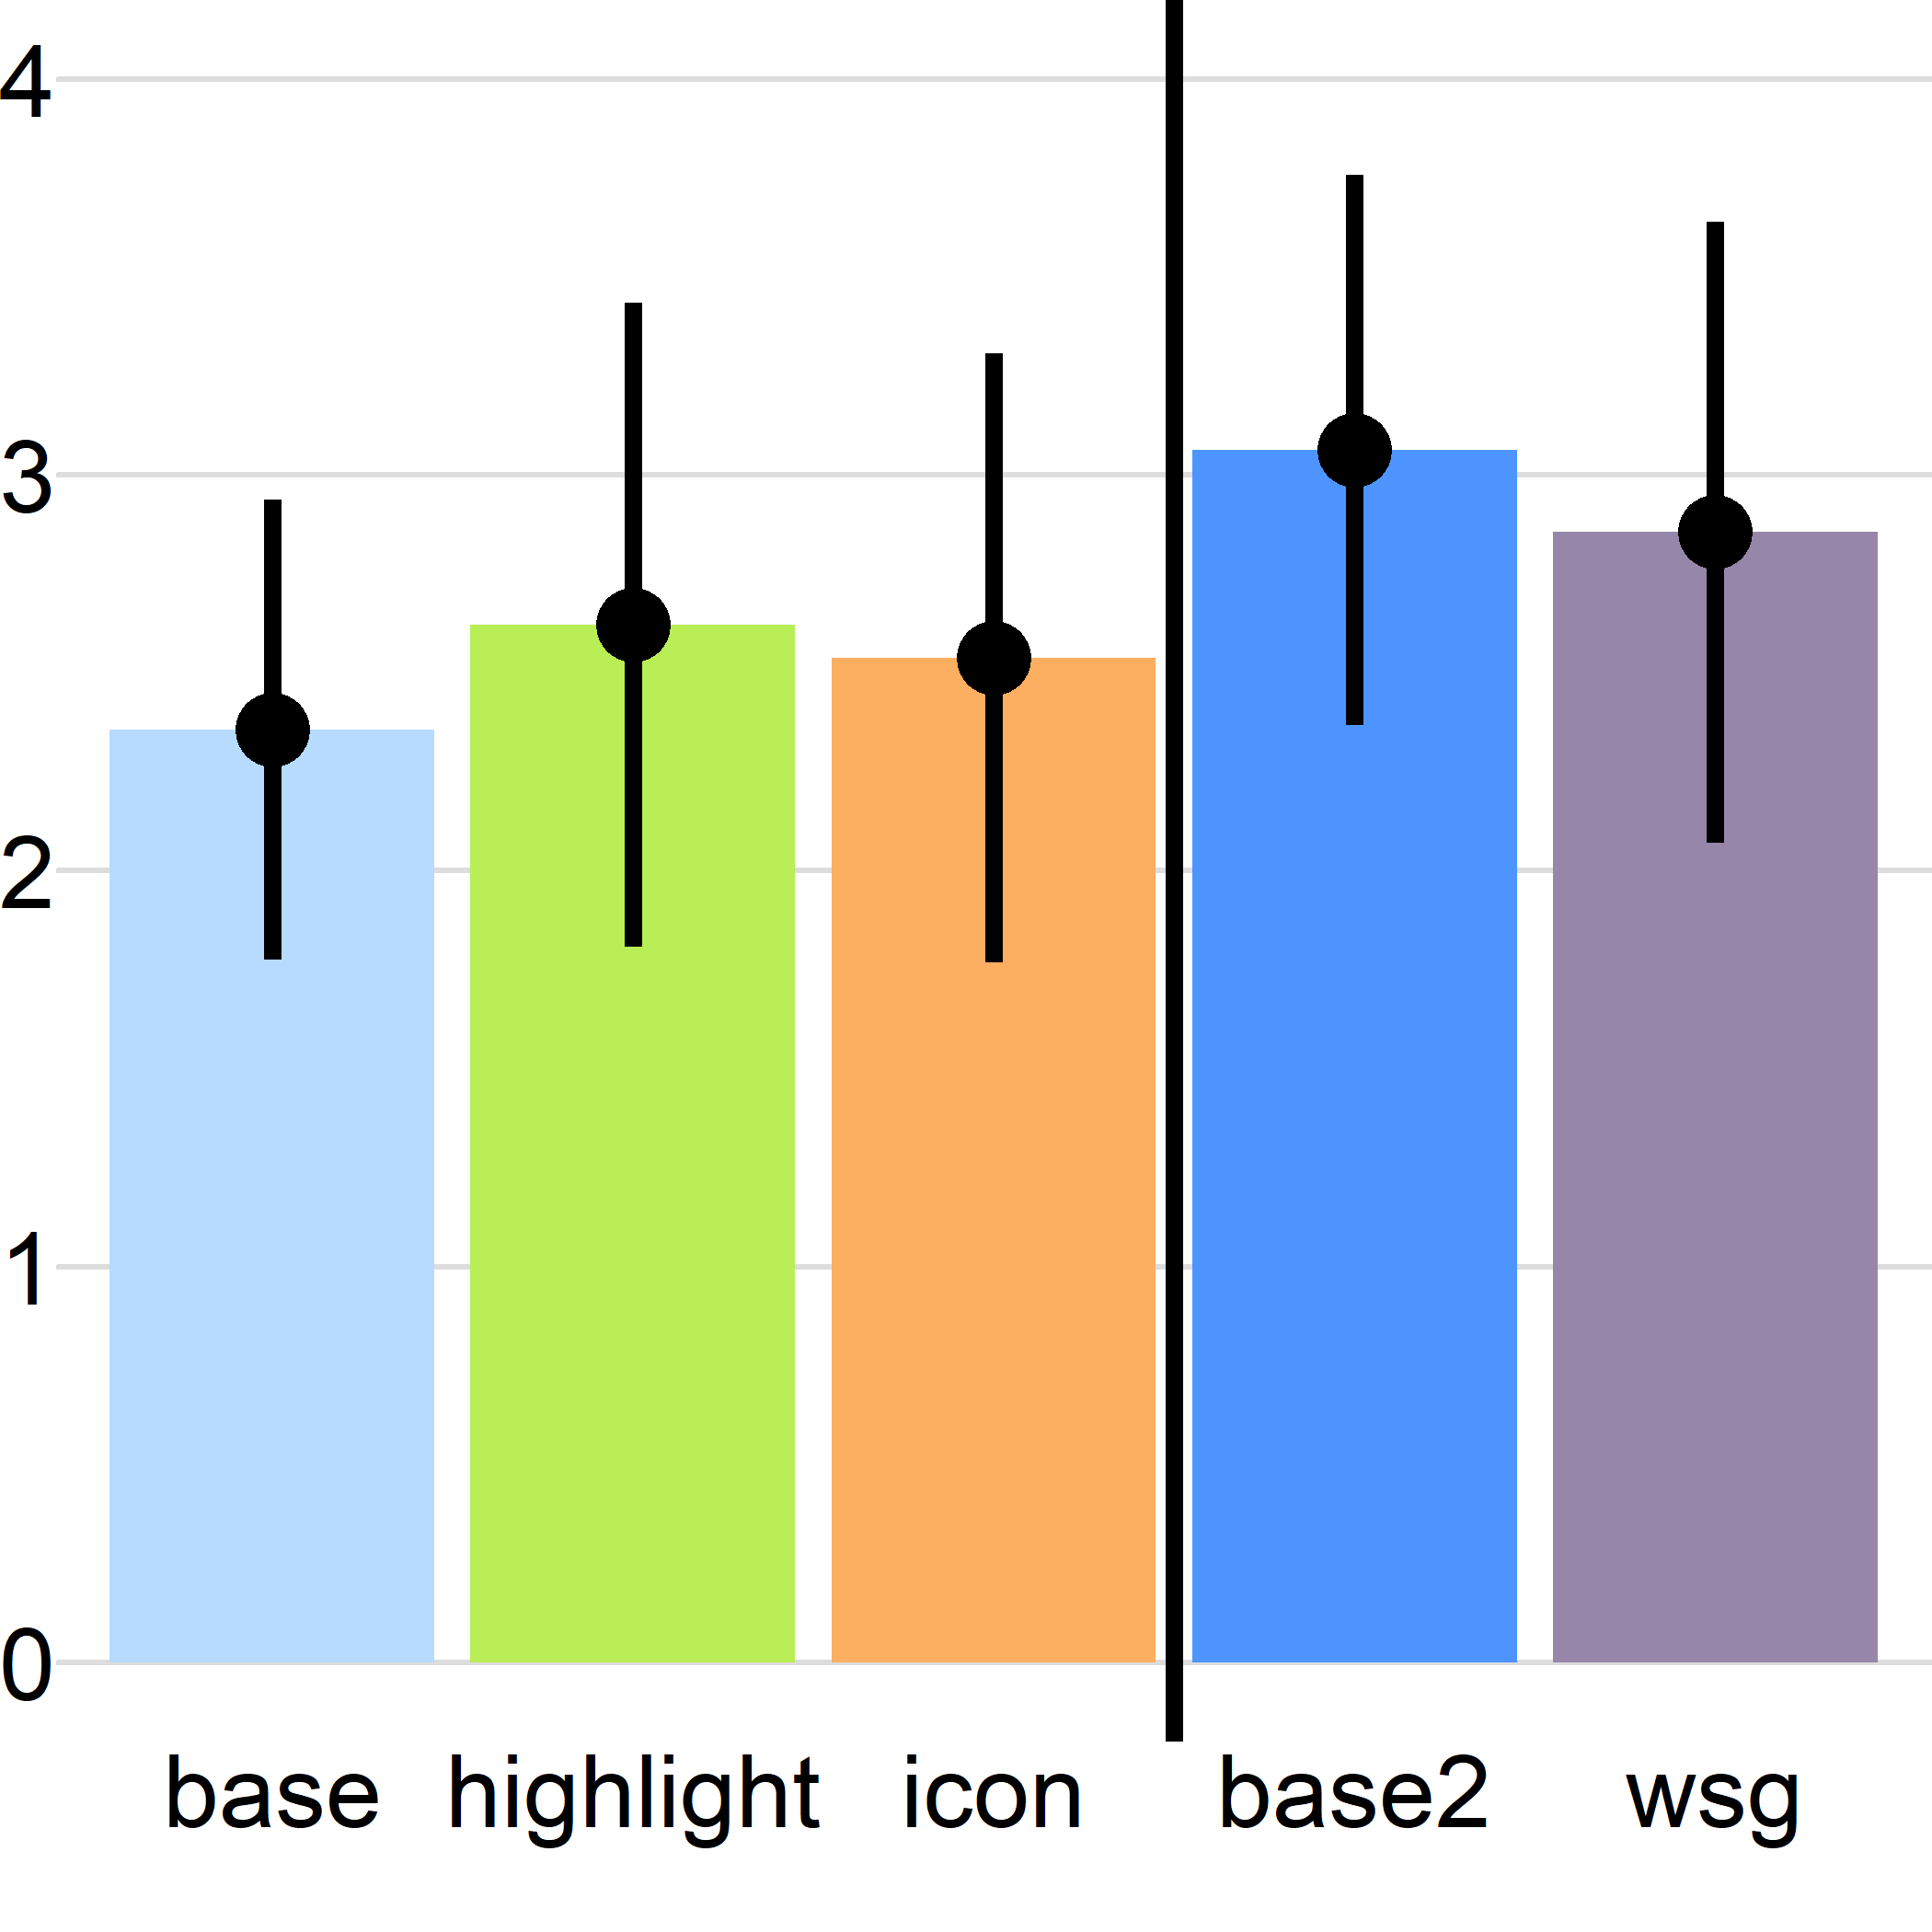
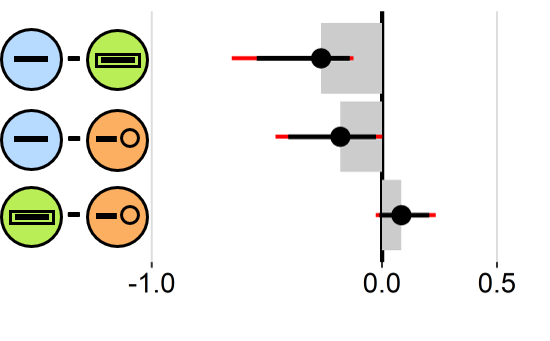
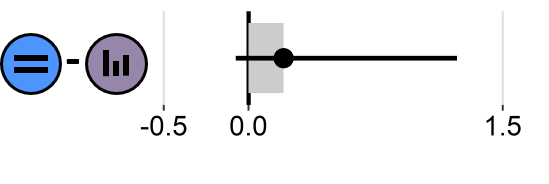
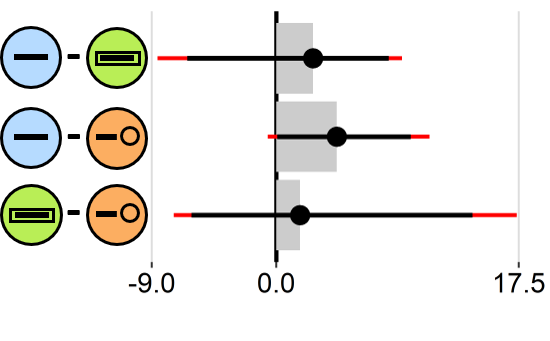
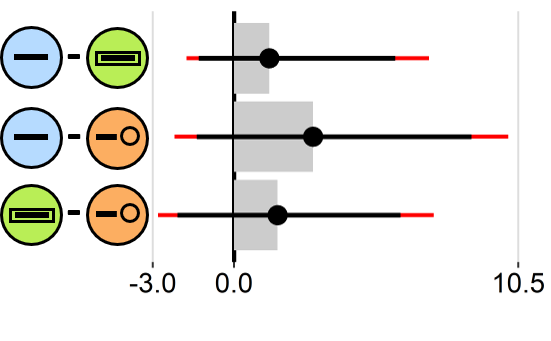
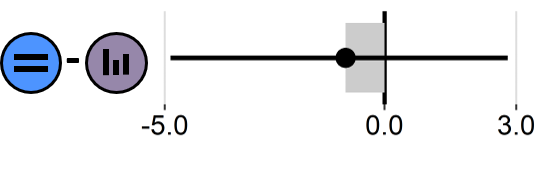
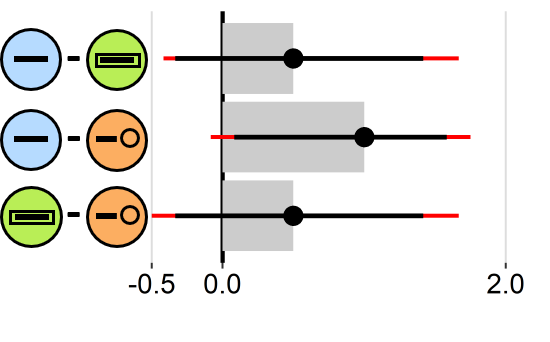
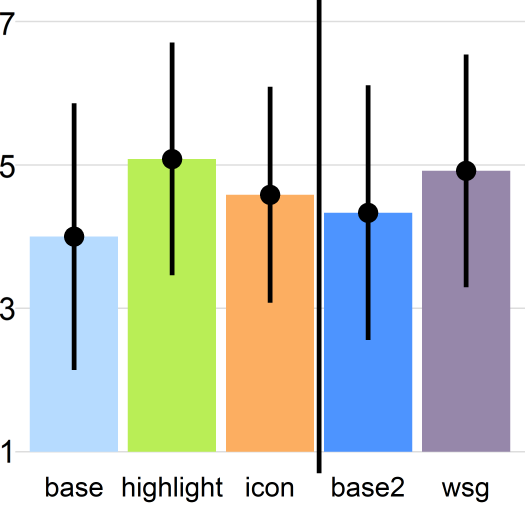
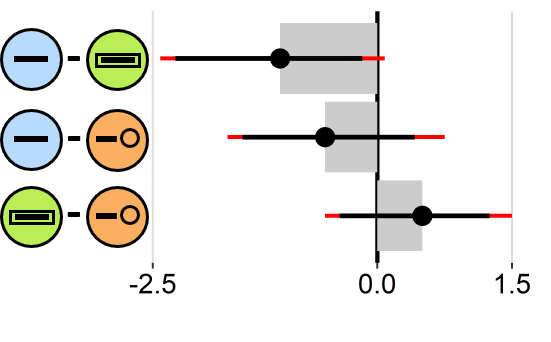
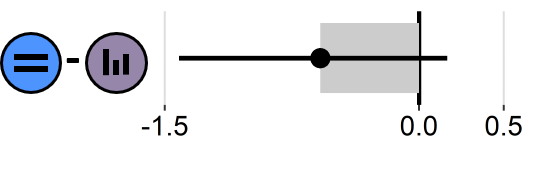
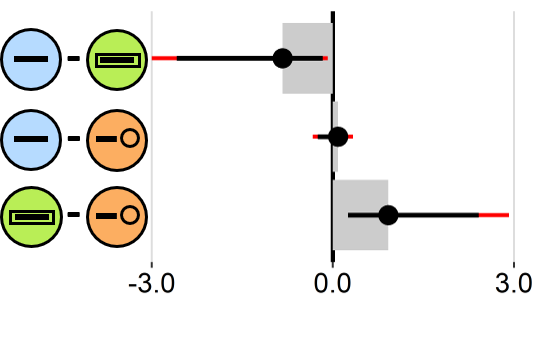
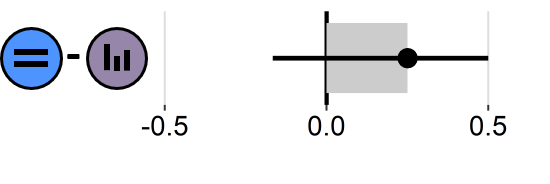
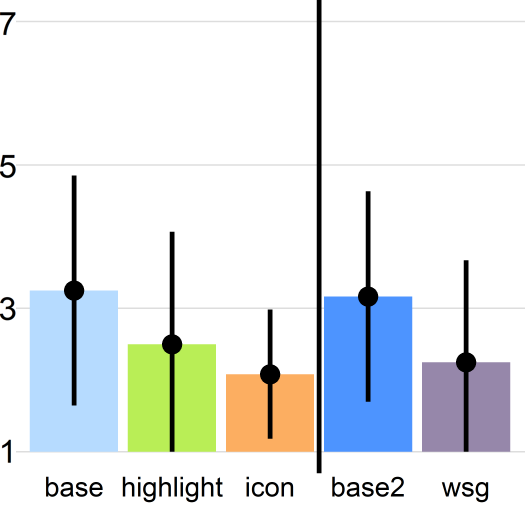
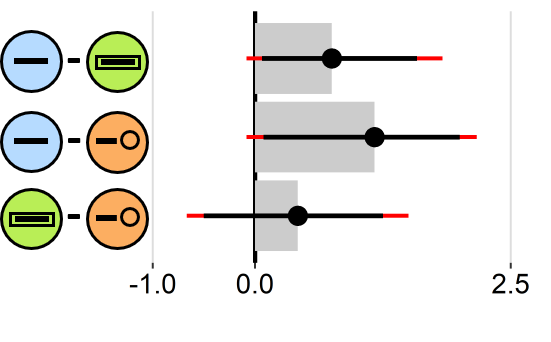
Describes statistical analysis (means, CIs, pairwise differences). Fixations on AOIs Experiment 1: For the baseline condition, the fixation duration on AOIs has a mean of 10.21% and a CI of [7.53%, 13.22%], the highlight condition has a mean of 19.75% and a CI of [14.57%, 31.27%], and the icon condition has a mean of 8.03% and a CI of [5.63%, 12.39%]. The mean of pairwise difference between the baseline and the highlight condition is -9.54, with a CI of [-20.08, -5.18]. The mean of pairwise difference between the baseline and the icon condition is 2.18, with a CI of [0.13, 3.63]. The mean of pairwise difference between the highlight and the icon condition is 11.72, with a CI of [7.37, 20.36]. Fixations on AOIs Experiment 2: For the baseline 2 condition, the fixation duration on AOIs has a mean of 16% and a CI of [10.58%, 24.63%], and the word-sized graphics (wsg) condition has a mean of 26.8% and a CI of [17.83%, 43.26%]. The mean of pairwise difference between the baseline 2 and the wsg condition is -10.81, with a CI of [-18.55, -6.19]. Saccade amplitude Experiment 1: For the baseline condition, the average saccade amplitude has a mean of 2.36% and a CI of [1.98%, 2.63%], the highlight condition has a mean of 2.62% and a CI of [2.17%, 3.05%], and the icon condition has a mean of 2.54% and a CI of [2.10%, 2.94%]. The mean of pairwise difference between the baseline and the highlight condition is -0.27, with a CI of [-0.65, -0.12]. The mean of pairwise difference between the baseline and the icon condition is -0.18, with a CI of [-0.46, 0.001]. The mean of pairwise difference between the highlight and the icon condition is 0.08, with a CI of [-0.03, 0.23]. Saccade amplitude Experiment 2: For the baseline 2 condition, the average saccade amplitude has a mean of 3.06% and a CI of [2.73%, 3.47%], and the word-sized graphics (wsg) condition has a mean of 2.86% and a CI of [2.38%, 3.24%]. The mean of pairwise difference between the baseline 2 and the wsg condition is 0.21, with a CI of [-0.08, 1.23].
Experiment 1
In relation to the reading time, the percentage of fixations on visual elements is significantly higher for highlights ![]() than for icons
than for icons ![]() and plain text
and plain text ![]() (Figure 8(b), left).
The duration of fixations on visual elements (or factual terms) is also significantly higher for plain texts
(Figure 8(b), left).
The duration of fixations on visual elements (or factual terms) is also significantly higher for plain texts ![]() than for texts with icons
than for texts with icons ![]() .
Regarding saccades (Figure 8(b), right), the average amplitude was similar for the highlight
.
Regarding saccades (Figure 8(b), right), the average amplitude was similar for the highlight ![]() and icon
and icon ![]() conditions, but significantly lower between the baseline
conditions, but significantly lower between the baseline ![]() and highlights
and highlights ![]() .
.
Experiment 2
In the second experiment (Figure 8(b)), the average relative fixation duration on AOIs was significantly higher with visual enhancements ![]() than for the baseline
than for the baseline ![]() .
The saccade amplitude was slightly higher in the baseline
.
The saccade amplitude was slightly higher in the baseline ![]() condition than for word-sized graphics
condition than for word-sized graphics ![]() with no significant difference.
with no significant difference.
3.3. Subjective Feedback

Describes statistical analysis (means, CIs, pairwise differences). Difficulty Experiment 1: For the baseline condition, the difficulty has a mean rating of 3.42 and a CI of [2.25, 4.17], the highlight condition has a mean rating of 2.92 and a CI of [1.83, 3.83], and the icon condition has a mean rating of 2.42 and a CI of [1.58, 3.42]. The mean of pairwise difference between the baseline and the highlight condition is 0.5, with a CI of [-0.42, 1.67]. The mean of pairwise difference between the baseline and the icon condition is 1, with a CI of [-0.08, 1.75]. The mean of pairwise difference between the highlight and the icon condition is 0.5, with a CI of [-0.5, 1.67]. Difficulty Experiment 2: For the baseline 2 condition, the difficulty has a mean rating of 3.3 and a CI of [2.17, 4], and the word-sized graphics (wsg) condition has a mean rating of 2.08 and a CI of [1.25, 3.17]. The mean of pairwise difference between the baseline 2 and the wsg condition is 1.25, with a CI of [-0.25, 2.33]. Confidence Experiment 1: For the baseline condition, the confidence has a mean rating of 3 and a CI of [1.92, 3.92], the highlight condition has a mean rating of 4.08 and a CI of [2.83, 4.75], and the icon condition has a mean rating of 3.58 and a CI of [2.67, 4.33]. The mean of pairwise difference between the baseline and the highlight condition is -1.08, with a CI of [-2.42, 0.08]. The mean of pairwise difference between the baseline and the icon condition is -0.58, with a CI of [-1.67, 0.75]. The mean of pairwise difference between the highlight and the icon condition is 0.5, with a CI of [-0.58, 1.5]. Confidence Experiment 2: For the baseline 2 condition, the confidence has a mean rating of 3.33 and a CI of [2.17, 4.17], and the word-sized graphics (wsg) condition has a mean rating of 3.92 and a CI of [2.67, 4.58]. The mean of pairwise difference between the baseline 2 and the wsg condition is -0.58, with a CI of [-1.42, 0.17]. Rushed Experiment 1: For the baseline condition, rushed has a mean rating of 0.67 and a CI of [0.25, 1], the highlight condition has a mean rating of 1.5 and a CI of [0.75, 2.75], and the icon condition has a mean rating of 0.58 and a CI of [0.25, 0.92]. The mean of pairwise difference between the baseline and the highlight condition is -0.83, with a CI of [-3, -0.08]. The mean of pairwise difference between the baseline and the icon condition is 0.08, with a CI of [-0.33, 0.33]. The mean of pairwise difference between the highlight and the icon condition is 0.92, with a CI of [0.25, 2.92]. Rushed Experiment 2: For the baseline 2 condition, rushed has a mean rating of 0.75 and a CI of [0.33, 1.33], and the word-sized graphics (wsg) condition has a mean rating of 0.5 and a CI of [0.08, 0.92]. The mean of pairwise difference between the baseline 2 and the wsg condition is 0.25, with a CI of [-0.17, 0.5]. Annoyed Experiment 1: For the baseline condition, annoyed has a mean rating of 2.25 and a CI of [1.25, 3], the highlight condition has a mean rating of 1.5 and a CI of [0.75, 2.42], and the icon condition has a mean rating of 1.08 and a CI of [0.58, 1.5]. The mean of pairwise difference between the baseline and the highlight condition is 0.75, with a CI of [-0.08, 1.83]. The mean of pairwise difference between the baseline and the icon condition is 1.17, with a CI of [-0.08, 2.17]. The mean of pairwise difference between the highlight and the icon condition is 0.42, with a CI of [-0.67, 1.5]. Annoyed Experiment 2: For the baseline 2 condition, annoyed has a mean rating of 2.17 and a CI of [1.25, 2.83], and the word-sized graphics (wsg) condition has a mean rating of 1.25 and a CI of [0.58, 2.17]. The mean of pairwise difference between the baseline 2 and the wsg condition is 0.92, with a CI of [0.25, 1.58].
Further, we collected subjective feedback with respect to difficulty, confidence, and the impressions of being rushed and annoyed.
Figure 10 shows the participants’ ratings of each condition, which were given on a to Likert scale.
The perceived difficulty is highest for the baseline ![]()
![]() conditions in both experiments and in Experiment 1 lowest for texts with icons
conditions in both experiments and in Experiment 1 lowest for texts with icons ![]() .
The confidence in the answers was rated highest for texts with highlights
.
The confidence in the answers was rated highest for texts with highlights ![]() in Experiment 1, and for texts with wsg
in Experiment 1, and for texts with wsg ![]() in Experiment 2.
For the baseline
in Experiment 2.
For the baseline ![]()
![]() conditions, the confidence rating was lowest in both experiments.
These differences are, however, not significant.
conditions, the confidence rating was lowest in both experiments.
These differences are, however, not significant.
Participants rated that they felt rushed or hurried significantly more for texts with highlights ![]() than for the other conditions in Experiment 1.
In Experiment 2, participants felt slightly more rushed in the baseline
than for the other conditions in Experiment 1.
In Experiment 2, participants felt slightly more rushed in the baseline ![]() than the wsg
than the wsg ![]() condition.
They also felt significantly more annoyed or stressed in the baseline
condition.
They also felt significantly more annoyed or stressed in the baseline ![]() than wsg
than wsg ![]() condition.
In Experiment 1, participants reported most annoyance with the baseline
condition.
In Experiment 1, participants reported most annoyance with the baseline ![]() condition and least with texts with icons
condition and least with texts with icons ![]() , but without a significant difference.
, but without a significant difference.
Experiment condition preferences
Almost all participants reported that they preferred texts with visual elements ![]()
![]()
![]() over plain texts
over plain texts ![]()
![]() , in both experiments, as they “make it easier to identify relevant parts” and are “helpful for memorization”.
Two participants found the highlighted
, in both experiments, as they “make it easier to identify relevant parts” and are “helpful for memorization”.
Two participants found the highlighted ![]() texts or the texts with word-sized graphics
texts or the texts with word-sized graphics ![]() too distracting, but still liked icons
too distracting, but still liked icons ![]() more than plain text
more than plain text ![]() .
In Experiment 1, about half of the participants preferred icons
.
In Experiment 1, about half of the participants preferred icons ![]() over highlights
over highlights ![]() , while the others liked highlights
, while the others liked highlights ![]() more.
In Experiment 2, participants especially liked the bar charts best and found them easiest to read.
more.
In Experiment 2, participants especially liked the bar charts best and found them easiest to read.
Reading strategies
Most participants claimed that they usually do not follow a specific reading strategy.
Some said that they sometimes skim over filler words, or read quickly and not word-for-word.
For the baseline ![]()
![]() conditions, some participants reported reading the text and then going through it again and “trying to remember possible key information”, and “after a few stimuli, started focusing more on the fact lists in the text”.
With visual elements
conditions, some participants reported reading the text and then going through it again and “trying to remember possible key information”, and “after a few stimuli, started focusing more on the fact lists in the text”.
With visual elements ![]()
![]()
![]() , most participants’ self-reported reading strategies changed.
They said they focused more on the visual elements than on the rest of the text, and, after reading the whole text, went back to the visual elements again to help with memorizing information.
For example, they “tried to link the word with the icon”
, most participants’ self-reported reading strategies changed.
They said they focused more on the visual elements than on the rest of the text, and, after reading the whole text, went back to the visual elements again to help with memorizing information.
For example, they “tried to link the word with the icon” ![]() , or were “skimming over it [the text] and focused on the highlights/icons”
, or were “skimming over it [the text] and focused on the highlights/icons” ![]()
![]() .
In Experiment 2, some participants stated that they inspected the word-sized graphics
.
In Experiment 2, some participants stated that they inspected the word-sized graphics ![]() more closely after reading the text, to better memorize the facts.
more closely after reading the text, to better memorize the facts.
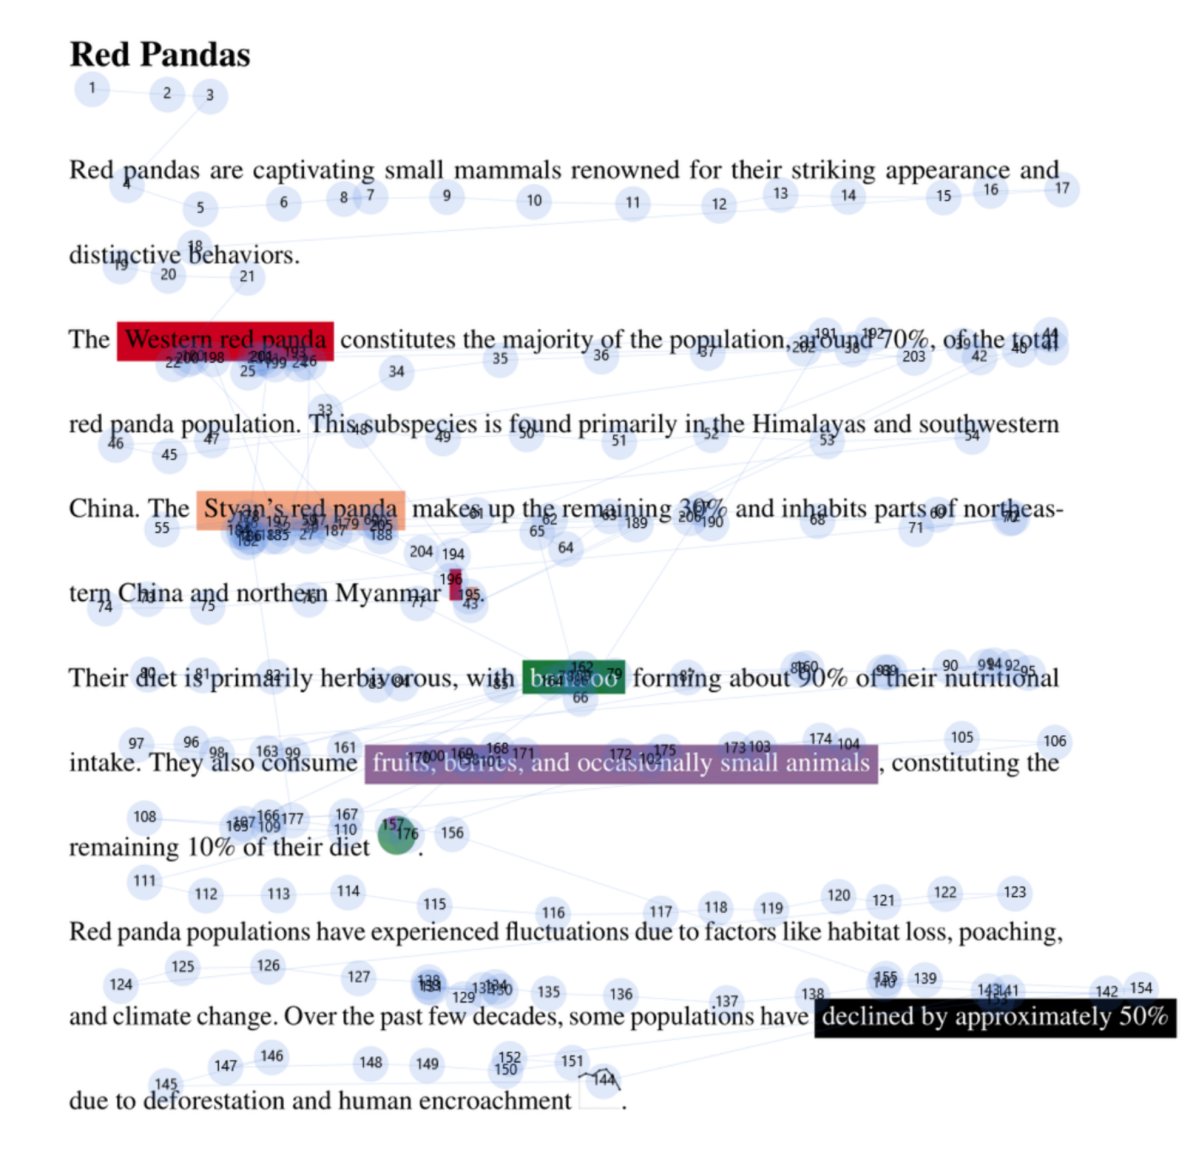
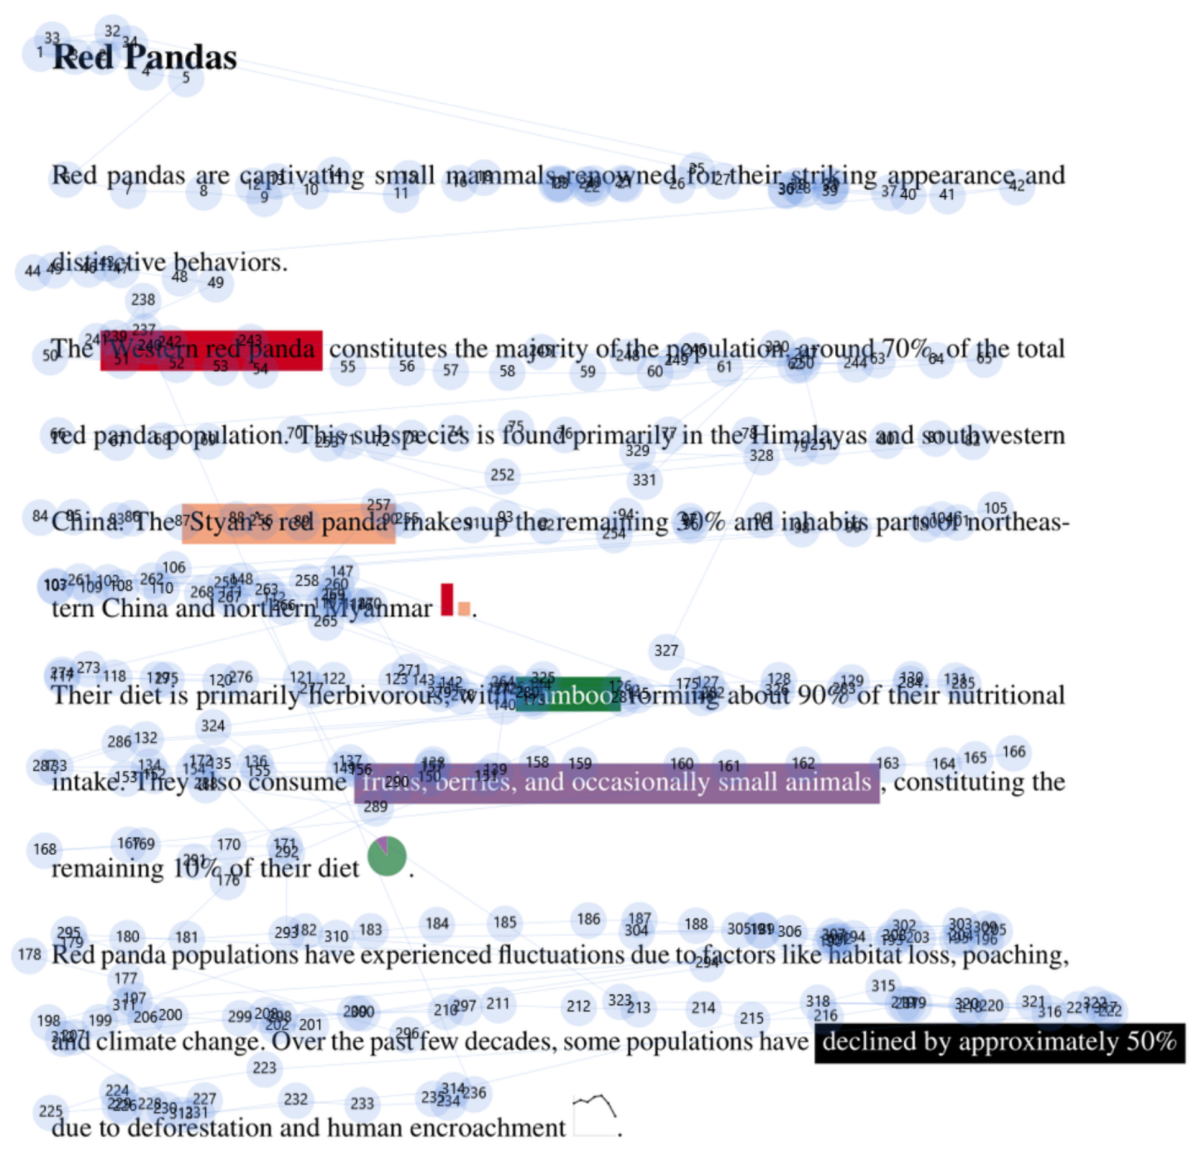
This figure shows two images of text about red pandas, with some of the factual terms in the text highlighted with a colored background. At the end of the sentence that has the colored terms, there is a small chart that depicts the percentages of the facts. Overlayed on the text is a gaze plot, i.e., numbered circled connected with lines to show where someone looked, and in which order, when reading the text. On the left, the image shows a gaze plot of a participant with correct answer to a question about the text. The circles that depict the fixations are mostly on the highlighted parts of the text. On the right, the gaze plot of a participant with a wrong answer to the question about the text shows fixations on the highlights, but also a lot of other parts of the text.
3.4. Correlations
As is to be expected, we found an inverse correlation between the difficulty and confidence ratings. There is also a correlation between the ratings for difficulty and level of annoyance. There are, however, no remarkable correlations between task performance and any other factors. We included further details in our supplemental material.
4. Discussion
Our preliminary results indicate that there are differences in reading behavior when text is enhanced with additional information. Some results confirm common expectations from experience and from the literature. Others, such as differences in results between the highlight and icon conditions, are more subtle.
Visual Elements: Distraction or help?
Our results showed that especially highlights in text attract attention.
This result was expected; highlighted text has a pop-out effect, making it pre-attentively perceivable and looked at more frequently than words in plain text.
The main question in this case is: Is this good or bad?
Highlighted texts (also with word-sized graphics) were found distracting by some participants, which is reflected in the higher fixation duration for highlight ![]() and word-sized graphics
and word-sized graphics ![]() than for icon
than for icon ![]() .
Text that was augmented with icons
.
Text that was augmented with icons ![]() overall received the best ratings, and participants tended to perform best.
The baseline condition
overall received the best ratings, and participants tended to perform best.
The baseline condition ![]() shows longer fixations than icon
shows longer fixations than icon ![]() , which could indicate that with icons it was easier to grasp the factual terms, while not being as distracting as highlights
, which could indicate that with icons it was easier to grasp the factual terms, while not being as distracting as highlights ![]() .
We further noticed frequent saccades to the visual elements
.
We further noticed frequent saccades to the visual elements ![]()
![]()
![]() , which is also reflected by the lower saccade amplitudes for plain text
, which is also reflected by the lower saccade amplitudes for plain text ![]()
![]() .
This could be one reason for some people feeling distracted, but it might also help them remember these particular elements better (Figure 11, left).
Further experiments will be necessary to confirm these assumptions.
.
This could be one reason for some people feeling distracted, but it might also help them remember these particular elements better (Figure 11, left).
Further experiments will be necessary to confirm these assumptions.
Hypotheses for further studies
We summarized our results in the form of hypotheses we plan to evaluate in future studies that focus less on the exploratory aspects of text enhancements and more on hypothesis-driven testing with specified tasks and stimuli.
-
H:
The fixations for texts augmented with icons are lower than for plain texts.
-
H:
Saccade amplitudes for text with visual enhancements are higher due to more frequent looks on these elements.
-
H:
Information memorization and reading speed are higher for texts with visual elements than for plain texts.
Further, there is a subjective preference for texts with visual enhancements over plain texts which we also plan to quantify and investigate in more detail in the future.
5. Conclusion
We presented the results of a small-scale study investigating the influence of highlighting, symbols, and word-sized graphics on reading behavior for text documents. To this point, the conducted experiments were exploratory to observe differences between conditions and build hypotheses. We performed the experiments with just participants to quickly achieve those first results. For future work, we plan to conduct a larger study with more statistical power to confirm our findings.
The presented results support findings from the literature (Fowler and Barker, 1974; Lorch, 1989; Ben-Yehudah and Eshet-Alkalai, 2018; Goffin et al., 2015) that visual enhancements help remember facts of a text better. By investigating the eye movements during reading, we could see that people tend to look at the added elements frequently, which can disturb a consistent reading flow and is perceived as annoying by some participants. Hence, the use of visual enhancements, especially highlights and word-sized graphics, should be considered carefully, focusing on the most important elements without overloading the text with additional elements. Further, there are challenges for choosing suitable icons. They should be clear in the terms and concepts they depict, as well as respect cultural differences.
Acknowledgements.
We thank all participants of the study. This research was funded by the Deutsche Forschungsgemeinschaft (DFG, German Research Foundation) – project 314647693 (VA4VGI) as part of the Priority Program VGIscience (SPP 1894), by DFG project 449742818, and under Germany’s Excellence Strategy - EXC 2075 - 390740016. Additionally, we acknowledge the funding by the Deutsche Forschungsgemeinschaft (DFG, German Research Foundation) – Project-ID 251654672 – TRR 161 (Project B01). We thank Petra Isenberg for early discussions on the topic.References
- (1)
- Abdelaal et al. (2023) Moataz Abdelaal, Nathan D. Schiele, Katrin Angerbauer, Kuno Kurzhals, Michael Sedlmair, and Daniel Weiskopf. 2023. Comparative Evaluation of Bipartite, Node-Link, and Matrix-Based Network Representations. IEEE Transactions on Visualization and Computer Graphics 29, 1 (2023), 896–906. https://doi.org/10.1109/TVCG.2022.3209427
- Beck et al. (2016) Fabian Beck, Yasett Acurana, Tanja Blascheck, Rudolf Netzel, and Daniel Weiskopf. 2016. An expert evaluation of word-sized visualizations for analyzing eye movement data. In Workshop on Eye Tracking and Visualization. Springer, 50–54. https://doi.org/10.1109/ETVIS.2016.7851166
- Beck et al. (2015) Fabian Beck, Tanja Blascheck, Thomas Ertl, and Daniel Weiskopf. 2015. Word-Sized Eye-Tracking Visualizations. In Workshop on Eye Tracking and Visualization. Springer, 113–128. https://doi.org/10.1007/978-3-319-47024-5_7
- Ben-Yehudah and Eshet-Alkalai (2018) Gal Ben-Yehudah and Yoram Eshet-Alkalai. 2018. The contribution of text-highlighting to comprehension: A comparison of print and digital reading. Journal of Educational Multimedia and Hypermedia 27, 2 (2018), 153–178. https://www.learntechlib.org/p/174353
- Besançon and Dragicevic (2017) Lonni Besançon and Pierre Dragicevic. 2017. The significant difference between p-values and confidence intervals. In Conference on l’Interaction Homme-Machine. Association for Computing Machinery, 53–62. https://hal.inria.fr/hal-01562281v2
- Byrne (1847) Oliver Byrne. 1847. The first six books of the Elements of Euclid: in which coloured diagrams and symbols are used instead of letters for the greater ease of learners. William Pickering.
- Chat GPT 3.5 (2023) Chat GPT 3.5 2023. GPT 3.5 turbo. platform.openai.com/docs/models/gpt-3-5.
- Chi et al. (2007) Ed Huai-hsin Chi, Michelle Gumbrecht, and Lichan Hong. 2007. Visual Foraging of Highlighted Text: An Eye-Tracking Study. In 12th International Conference on HCI Intelligent Multimodal Interaction Environments. Springer, 589–598. https://doi.org/10.1007/978-3-540-73110-8_64
- Chi et al. (2005) Ed H. Chi, Lichan Hong, Michelle Gumbrecht, and Stuart K. Card. 2005. ScentHighlights: highlighting conceptually-related sentences during reading. In 10th International Conference on Intelligent User Interfaces. Association for Computing Machinery, 272–274. https://doi.org/10.1145/1040830.1040895
- Cumming (2013) Geoff Cumming. 2013. Understanding the new statistics: Effect sizes, confidence intervals, and meta-analysis. Routledge.
- Dragicevic (2016) Pierre Dragicevic. 2016. Fair statistical communication in HCI. Springer, 291–330. https://doi.org/10.1007/978-3-319-26633-6_13
- Fowler and Barker (1974) Robert L H Fowler and Anne S. Barker. 1974. Effectiveness of highlighting for retention of text material. Journal of Applied Psychology 59, 3 (1974), 358–364. https://doi.org/10.1037/h0036750
- Goffin et al. (2017) Pascal Goffin, Jeremy Boy, Wesley Willett, and Petra Isenberg. 2017. An Exploratory Study of Word-Scale Graphics in Data-Rich Text Documents. IEEE transactions on visualization and computer graphics 23, 10 (2017), 2275–2287. https://doi.org/10.1109/TVCG.2016.2618797
- Goffin et al. (2015) Pascal Goffin, Wesley Willett, Anastasia Bezerianos, and Petra Isenberg. 2015. Exploring the effect of word-scale visualizations on reading behavior. In Conference on Human Factors in Computing Systems. Association for Computing Machinery, 1827–1832. https://doi.org/10.1145/2702613.2732778
- Goldberg and Helfman (2011) Joseph Goldberg and Jonathan Helfman. 2011. Eye tracking for visualization evaluation: Reading values on linear versus radial graphs. Information Visualization 10, 3 (2011), 182–195. https://doi.org/10.1177/1473871611406623
- Huey (1908) Edmund Burke Huey. 1908. The psychology and pedagogy of reading: With a review of the history of reading and writing and of methods, texts, and hygiene in reading. Macmillan.
- Huth et al. (2021a) Franziska Huth, Miriam Awad-Mohammed, Johannes Knittel, Tanja Blascheck, and Petra Isenberg. 2021a. Online Study of Word-Sized Visualizations in Social Media. In EuroVis 2021 - Posters. The Eurographics Association, 13–15. https://doi.org/10.2312/evp.20211069
- Huth et al. (2021b) Franziska Huth, Tanja Blascheck, Steffen Koch, Sonja Utz, and Thomas Ertl. 2021b. Word-sized Visualizations for Exploring Discussion Diversity in Social Media. In IVAPP 2021-12th International Conference on Computer Vision, Imaging and Computer Graphics Theory and Applications. SCITEPRESS, 256–265. https://doi.org/10.5220/0010328602560265
- Krzywinski and Altman (2013) Martin Krzywinski and Naomi Altman. 2013. Error bars: the meaning of error bars is often misinterpreted, as is the statistical significance of their overlap. Nature methods 10, 10 (2013), 921–923. https://doi.org/10.1038/nmeth.2659
- Latif and Beck (2018) Shahid Latif and Fabian Beck. 2018. Visually Augmenting Documents With Data. Computing in Science Engineering 20, 6 (2018), 96–103. https://doi.org/10.1109/MCSE.2018.2875316
- Lorch (1989) Robert F. Lorch. 1989. Text-signaling devices and their effects on reading and memory processes. Educational Psychology Review 1 (1989), 209–234. https://doi.org/10.1007/BF01320135
- Netzel et al. (2017) Rudolf Netzel, Bettina Ohlhausen, Kuno Kurzhals, Robin Woods, Michael Burch, and Daniel Weiskopf. 2017. User performance and reading strategies for metro maps: An eye tracking study. Spatial Cognition & Computation 17, 1-2 (2017), 39–64. https://doi.org/10.1080/13875868.2016.1226839
- OSF (2024) OSF 2024. OSF–Eye Tracking on Text Reading with Visual Enhancements. https://osf.io/utw7b/.
- Rayner (1977) Keith Rayner. 1977. Visual attention in reading: Eye movements reflect cognitive processes. Memory & Cognition 5, 4 (1977), 443–448. https://doi.org/10.3758/BF03197383
- Rayner (1998) Keith Rayner. 1998. Eye movements in reading and information processing: 20 years of research. Psychological Bulletin 124, 3 (1998), 372–422. https://doi.org/10.1037/0033-2909.124.3.372
- Ruchikachorn and Rattanawicha (2018) Puripant Ruchikachorn and Pimmanee Rattanawicha. 2018. An Eye-Tracking Study on Sparklines within Textual Context.. In EuroVis 2018 - Posters. The Eurographics Association, 17–19. https://doi.org/10.2312/eurp.20181119
- Tufte (2006) Edward R. Tufte. 2006. Beautiful Evidence (1 ed.). Graphics Press.
- Von Restorff (1933) Hedwig Von Restorff. 1933. Über die Wirkung von Bereichsbildungen im Spurenfeld. Psychologische Forschung 18 (1933), 299–342. https://doi.org/10.1007/BF02409636
- Yeari et al. (2017) Menahem Yeari, Marja Oudega, and Paul van den Broek. 2017. The effect of highlighting on processing and memory of central and peripheral text information: evidence from eye movements. Journal of Research in Reading 40, 4 (2017), 365–383. https://doi.org/10.1111/1467-9817.12072