Human Detection from 4D Radar Data in Low-Visibility Field Conditions
Abstract
Autonomous driving technology is increasingly being used on public roads and in industrial settings such as mines. While it is essential to detect pedestrians, vehicles, or other obstacles, adverse field conditions negatively affect the performance of classical sensors such as cameras or lidars. Radar, on the other hand, is a promising modality that is less affected by, e.g., dust, smoke, water mist or fog. In particular, modern 4D imaging radars provide target responses across the range, vertical angle, horizontal angle and Doppler velocity dimensions. We propose TMVA4D, a CNN architecture that leverages this 4D radar modality for semantic segmentation. The CNN is trained to distinguish between the background and person classes based on a series of 2D projections of the 4D radar data that include the elevation, azimuth, range, and Doppler velocity dimensions. We also outline the process of compiling a novel dataset consisting of data collected in industrial settings with a car-mounted 4D radar and describe how the ground-truth labels were generated from reference thermal images. Using TMVA4D on this dataset, we achieve an mIoU score of 78.2% and an mDice score of 86.1%, evaluated on the two classes background and person.
Index Terms:
Automotive Radar, 4D Radar, Human Detection, Semantic Segmentation, Convolutional Neural Network, Deep LearningI Introduction
For an autonomous vehicle to safely navigate in complex environments, it is necessary for it to sense and then internally represent its surroundings. In particular, in order to be able to navigate in spaces shared with people, it is imperative that people can be reliably detected. To this end, vision-based systems and lidar sensors should provide the vehicle with low-noise, high-resolution scene data. However, they both fall short in acquiring accurate information about the scene in adverse weather conditions such as rain and fog [4, 8]. In contrast to cameras and lidars, radars allow for obtaining data on parts of the environment that would otherwise be obscured by precipitation and airborne particles, albeit with the disadvantage of capturing the scene at a lower angular resolution and with more noise.
Mining is an industry that rapidly adopts autonomous vehicles. Underground operations often involve a serious risk of injury or death; a significant danger is posed by heavy machinery such as dump trucks or drill rigs operating near personnel [6]. Cameras and lidars bear the risk of failing to detect people obscured by airborne particulates such as smoke and dust. This makes radar a compelling option for detecting individuals under low-visibility conditions.
Advancements in deep learning have made it the prevailing approach in radar object detection. Previous research has been primarily focused on object detection using radar data that provides range-azimuth (RA) or range-azimuth-Doppler (RAD) information about the environment. While such data can be obtained with relatively inexpensive radar technology, these sensors lack the elevation dimension. On the other hand, radars that provide power measurements in four dimensions (range, azimuth, elevation, and Doppler) are also available and often denoted as 4D radars. The additional elevation data may be critical in cases where pedestrians have fallen due to loss of consciousness, particularly since their motionlessness makes them much harder to distinguish in terms of Doppler measurements. Fitting vehicles with 4D radar people detection technology may prove especially useful in mines, as it may enable people to work in the same areas as autonomous machines (whereas today, self-driving mining vehicles are typically forced to stop if a person enters the site).
Previous methods have represented the 4D radar data as point clouds or tensors [14, 20]. Representing the data as heatmaps, i.e., two-dimensional projections from the 4D radar data, constitutes a promising alternative.
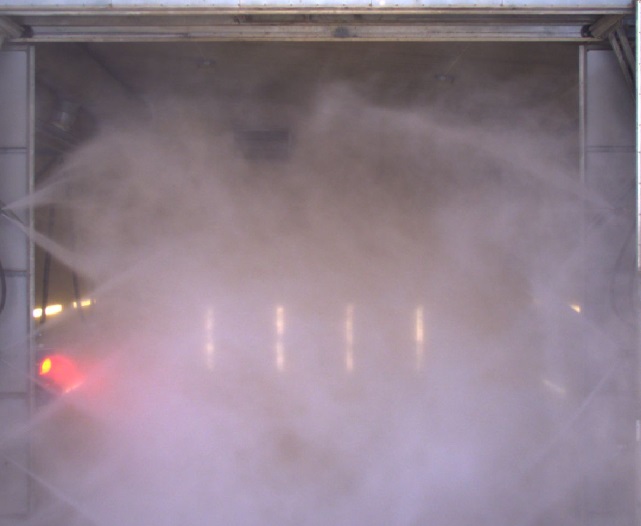
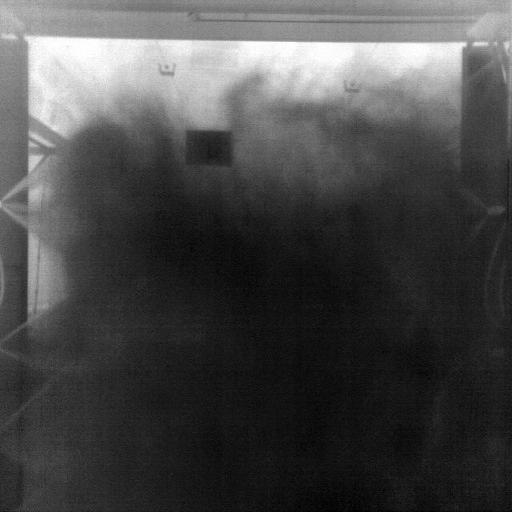
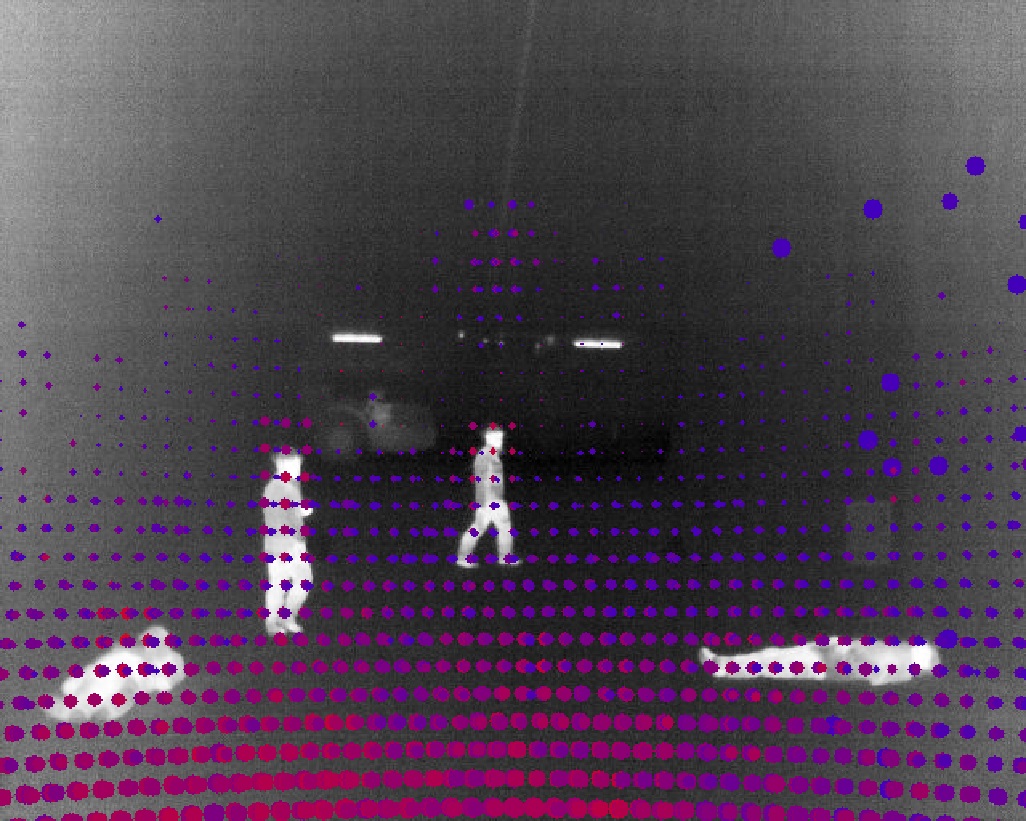
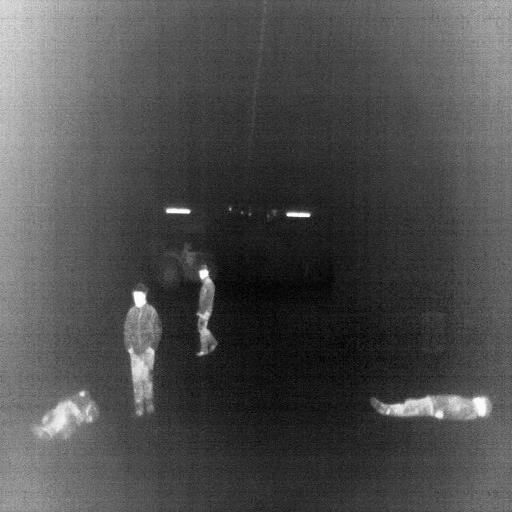
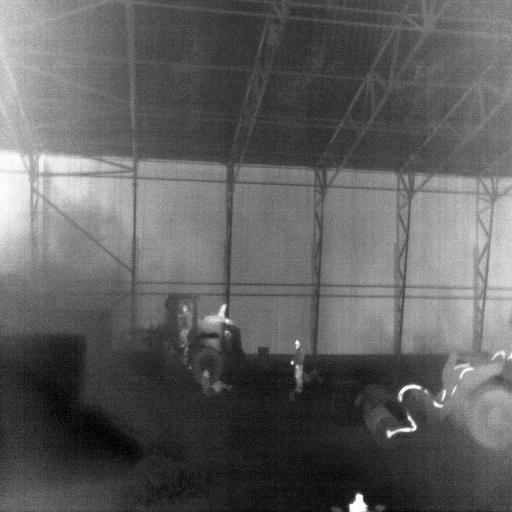
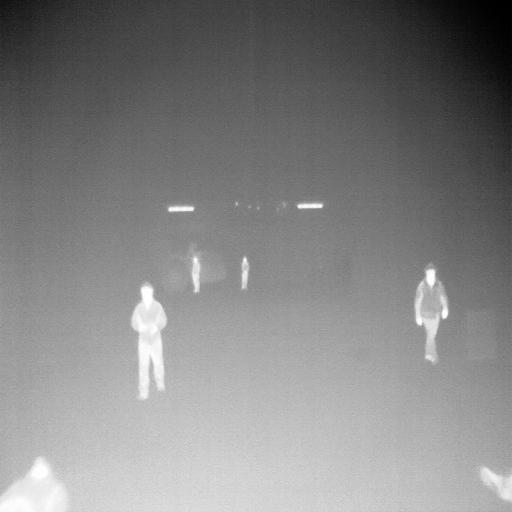
We propose TMVA4D: a temporal multi-view network with ASPP modules for 4D radar data. It is based on the TMVA-Net architecture (temporal multi-view network with ASPP modules), proposed by Ouaknine et al. [12]. TMVA4D is a convolutional neural network (CNN) architecture for semantic segmentation of humans in heatmaps representing 4D radar data. We also use a novel dataset for training and evaluating TMVA4D; the process of annotating and formatting the data is presented here. By training and evaluating TMVA4D on the dataset, we show that our method for representing and segmenting radar data is a viable approach for human detection, even where other sensor modalities fail due to the presence of airborne particles (as shown in Fig. 1).
II Related Work
As 2D radar is a well-established modality, there are several datasets available. They mostly aim for automotive scenarios with localization and detection tasks in mind.
The RADIATE dataset, presented by Sheeny et al. [15], includes 2D scanning radar data with 360° field of view (FoV), recorded in urban and motorway driving scenarios under various weather and illumination conditions. The radar data is represented as RA (range-azimuth) heatmaps in a Cartesian bird’s eye view (BEV), with 2D bounding box annotations.
The CARRADA dataset, presented by Ouaknine et al. [13], comprises data from a stationary automotive radar in a flat and open environment, with annotations for multiple types of moving objects. It represents the radar data as heatmaps in polar coordinates. The heatmaps are provided in three views: RA, range-Doppler (RD), and azimuth-Doppler (AD), with annotations in multiple forms including semantic segmentation masks.
The CRUW dataset, presented by Wang et al. [18], contains automotive radar data from on-road driving environments with varying levels of illumination. The radar data is represented as RA heatmaps in a Cartesian BEV, with point-wise annotations for the object instances.
The RADDet dataset, presented by Zhang et al. [19], includes automotive radar data from urban environments represented as RA and RD heatmaps. Annotations for the heatmaps are provided as 2D bounding boxes.
Finally, the Boreas dataset, presented by Burnett et al. [1], provides automotive radar recordings in a 360° FOV, captured in an urban environment under different illumination and weather conditions. Annotations are given in the form of 3D bounding boxes.
As we aim at detecting people in various poses, including lying on the ground, the additional elevation dimension in the 4D radar data makes it more suitable for the task. Moreover, we choose to trade the sensor range () for depth resolution () with our radar.
For 2D radars, several machine-learning-based architectures for detection and segmentation have been proposed.
Kaul et al. [7] present RSS-Net, a convolutional encoder-decoder architecture that semantically segments heatmaps in the RA view, with a single RA map as input. The architecture includes a single skip connection. An atrous spatial pyramid pooling (ASPP) module [3] is present between the encoder and decoder.
Gao et al. [5] propose RAMP-CNN, a CNN architecture that performs object detection in the RA view. It takes a RAD tensor as input and then extracts heatmaps from it in the RA, RD, and DA views. Each heatmap passes through one of three convolutional autoencoders, one for each view. Their output forms the latent space, whose content is then provided as input to an inception module [16].
Wang et al. [17] propose RODNet (RODNet-HGwI), a 3D convolutional autoencoder architecture. It takes RA heatmaps as input to perform object detection in the RA view. The architecture consists of an encoder and a decoder with skip connections. The encoder includes inception modules.
Ouaknine et al. [12] propose TMVA-Net, a convolutional encoder-decoder architecture for semantic segmentation in the RA and RD views. It takes multiple frames of input in the RA, RD, and AD views, each view with its own encoder. The output of the encoders forms the latent space, whose content is then provided as input to decoders for the RA and RD views. ASPP modules also connect the encoders to the decoders.
Since the 4D radar modality has become available more recently, there are some, but fewer, human detection methods and datasets in the literature.
ImmFusion [2] recovers the full body pose from 4D radar data fused with camera images. One important difference from our work is that they focus on pose recovery of nearby humans, and we focus on detection in difficult field conditions including far away humans.
[14] present the on-road K-Radar dataset together with a network for object and human detection directly on 4D radar tensors. Not all 4D radars provide the full tensor as output, which is why we chose to use heatmaps computed from a 4D point cloud instead.
[20] also present an automotive dataset including 4D radar data. They include human detection results using an adaptation of PointPillars [10] on the radar point clouds. However, their method only outputs bounding boxes, while our method does semantic segmentation.
Different from all aforementioned datasets, our dataset includes challenging field conditions relevant to mining, construction, and forestry, with visibility reduced by induced dust, water mist/spray, and smoke. Different from the existing people detection methods, TMVA4D has been trained on people performing various activities: lying down, walking, running, climbing.
III Dataset
III-A Data Collection
Our dataset was collected in multiple sequences using a car-mounted sensor system in four environments: an underground mine, a large car wash for heavy machinery, an industrial tent, and an outdoor wooded area. A large portion of the data featured people in different positions and performing various actions, including lying down, standing still, walking, running, and climbing. In some of these, a dummy is present in place of an actual person. In a subset of these scenes, visibility was reduced due to airborne particulates induced to replicate realistic and challenging scenarios: airborne dust, water spray, and smoke. Part of the data was collected during ego-motion.
Of the sensors used for data collection, two are of relevance to this work: a thermal imaging camera (FLIR AX5) and a 4D solid-state radar (Sensrad Hugin A3-Sample). The camera captured thermal images used to annotate the radar data for training and testing of the TMVA4D network. The data collected by the 4D radar were represented as point clouds. The data was recorded and saved using ROS as timestamped images and Point Cloud Data (PCD) files.
III-B Annotation Process
The preparation of the dataset involved multiple steps. First, the thermal images were scaled from a resolution of to . A portion of the resized images were picked for manual annotation. These constitute 4,900 (4.8%) of the 102,966 images used for compiling the dataset. The selected images were manually annotated in the Computer Vision Annotation Tool (CVAT) 111https://www.cvat.ai/ using polygon annotation. Specifically, the people in the images were annotated as belonging to class person, separating them from the background.
The manually annotated images were used to train a YOLOv8222https://yolov8.com/ model to semantically segment all of the resized images. The annotations were randomly split into a training set and a validation set, with a 90:10 split ratio. To speed up the training of the YOLOv8 model and improve its generalization, the training of the model was performed on the pre-trained segmentation model YOLOv8x-seg, using a 0.10 confidence threshold.
The trained YOLOv8 model achieved scores of 97.84% mAP50 and 80.19% mAP50-95 on the validation set. The validation results were only used to determine the number of epochs necessary for the model to converge; they were not used to fine-tune any other parameters. For this reason, the performance on the validation set is considered representative of the model’s performance on images it was not exposed to during training.
The YOLOv8 model was made to semantically segment all resized images for class person. The confidence threshold was set low, to 0.10, as we found that it led to the greatest number of true detections without significantly increasing the occurrence of false detections. The resulting segmentation masks were of size . Using the masks at their original size would have meant training and evaluating the architecture on masks whose resolution was needlessly high. To decrease the size of the TMVA4D architecture, and consequently the inference time, these masks were resized to matrices of size .
III-C Data Representation
From each point cloud, a heatmap is generated in each of the five views. The views, along with their dimensions, are as follows:
-
•
Elevation-azimuth (EA) –
-
•
Elevation-range (ER) –
-
•
Elevation-Doppler (ED) –
-
•
Range-azimuth (RA) –
-
•
Doppler-azimuth (DA) –
Each heatmap in the EA view can be conceptualized as a uniform grid spanning the camera frame, of the same size as the EA view. Looking at the dimensions separately, the azimuth and elevation dimensions of this grid both span an interval of values, corresponding to positions on the camera frame along its width or height. We partition each of these intervals into 128 bins. Similarly, the value intervals of the range and Doppler dimensions can both be discretized into 256 bins each.
For a heatmap in a given view, consider a point that falls within the bin of the vertical dimension and within the bin of the horizontal dimension when projected to a given view. This point will then belong to the cell at row and column of the grid representing this heatmap. The highest power of a point in a given cell was used to assign the value of that cell.
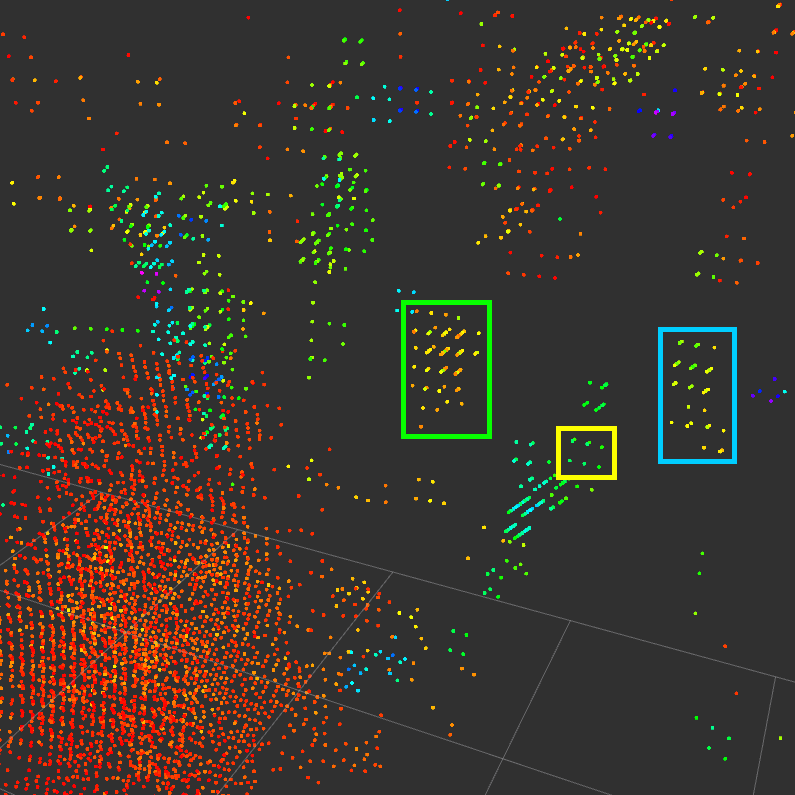
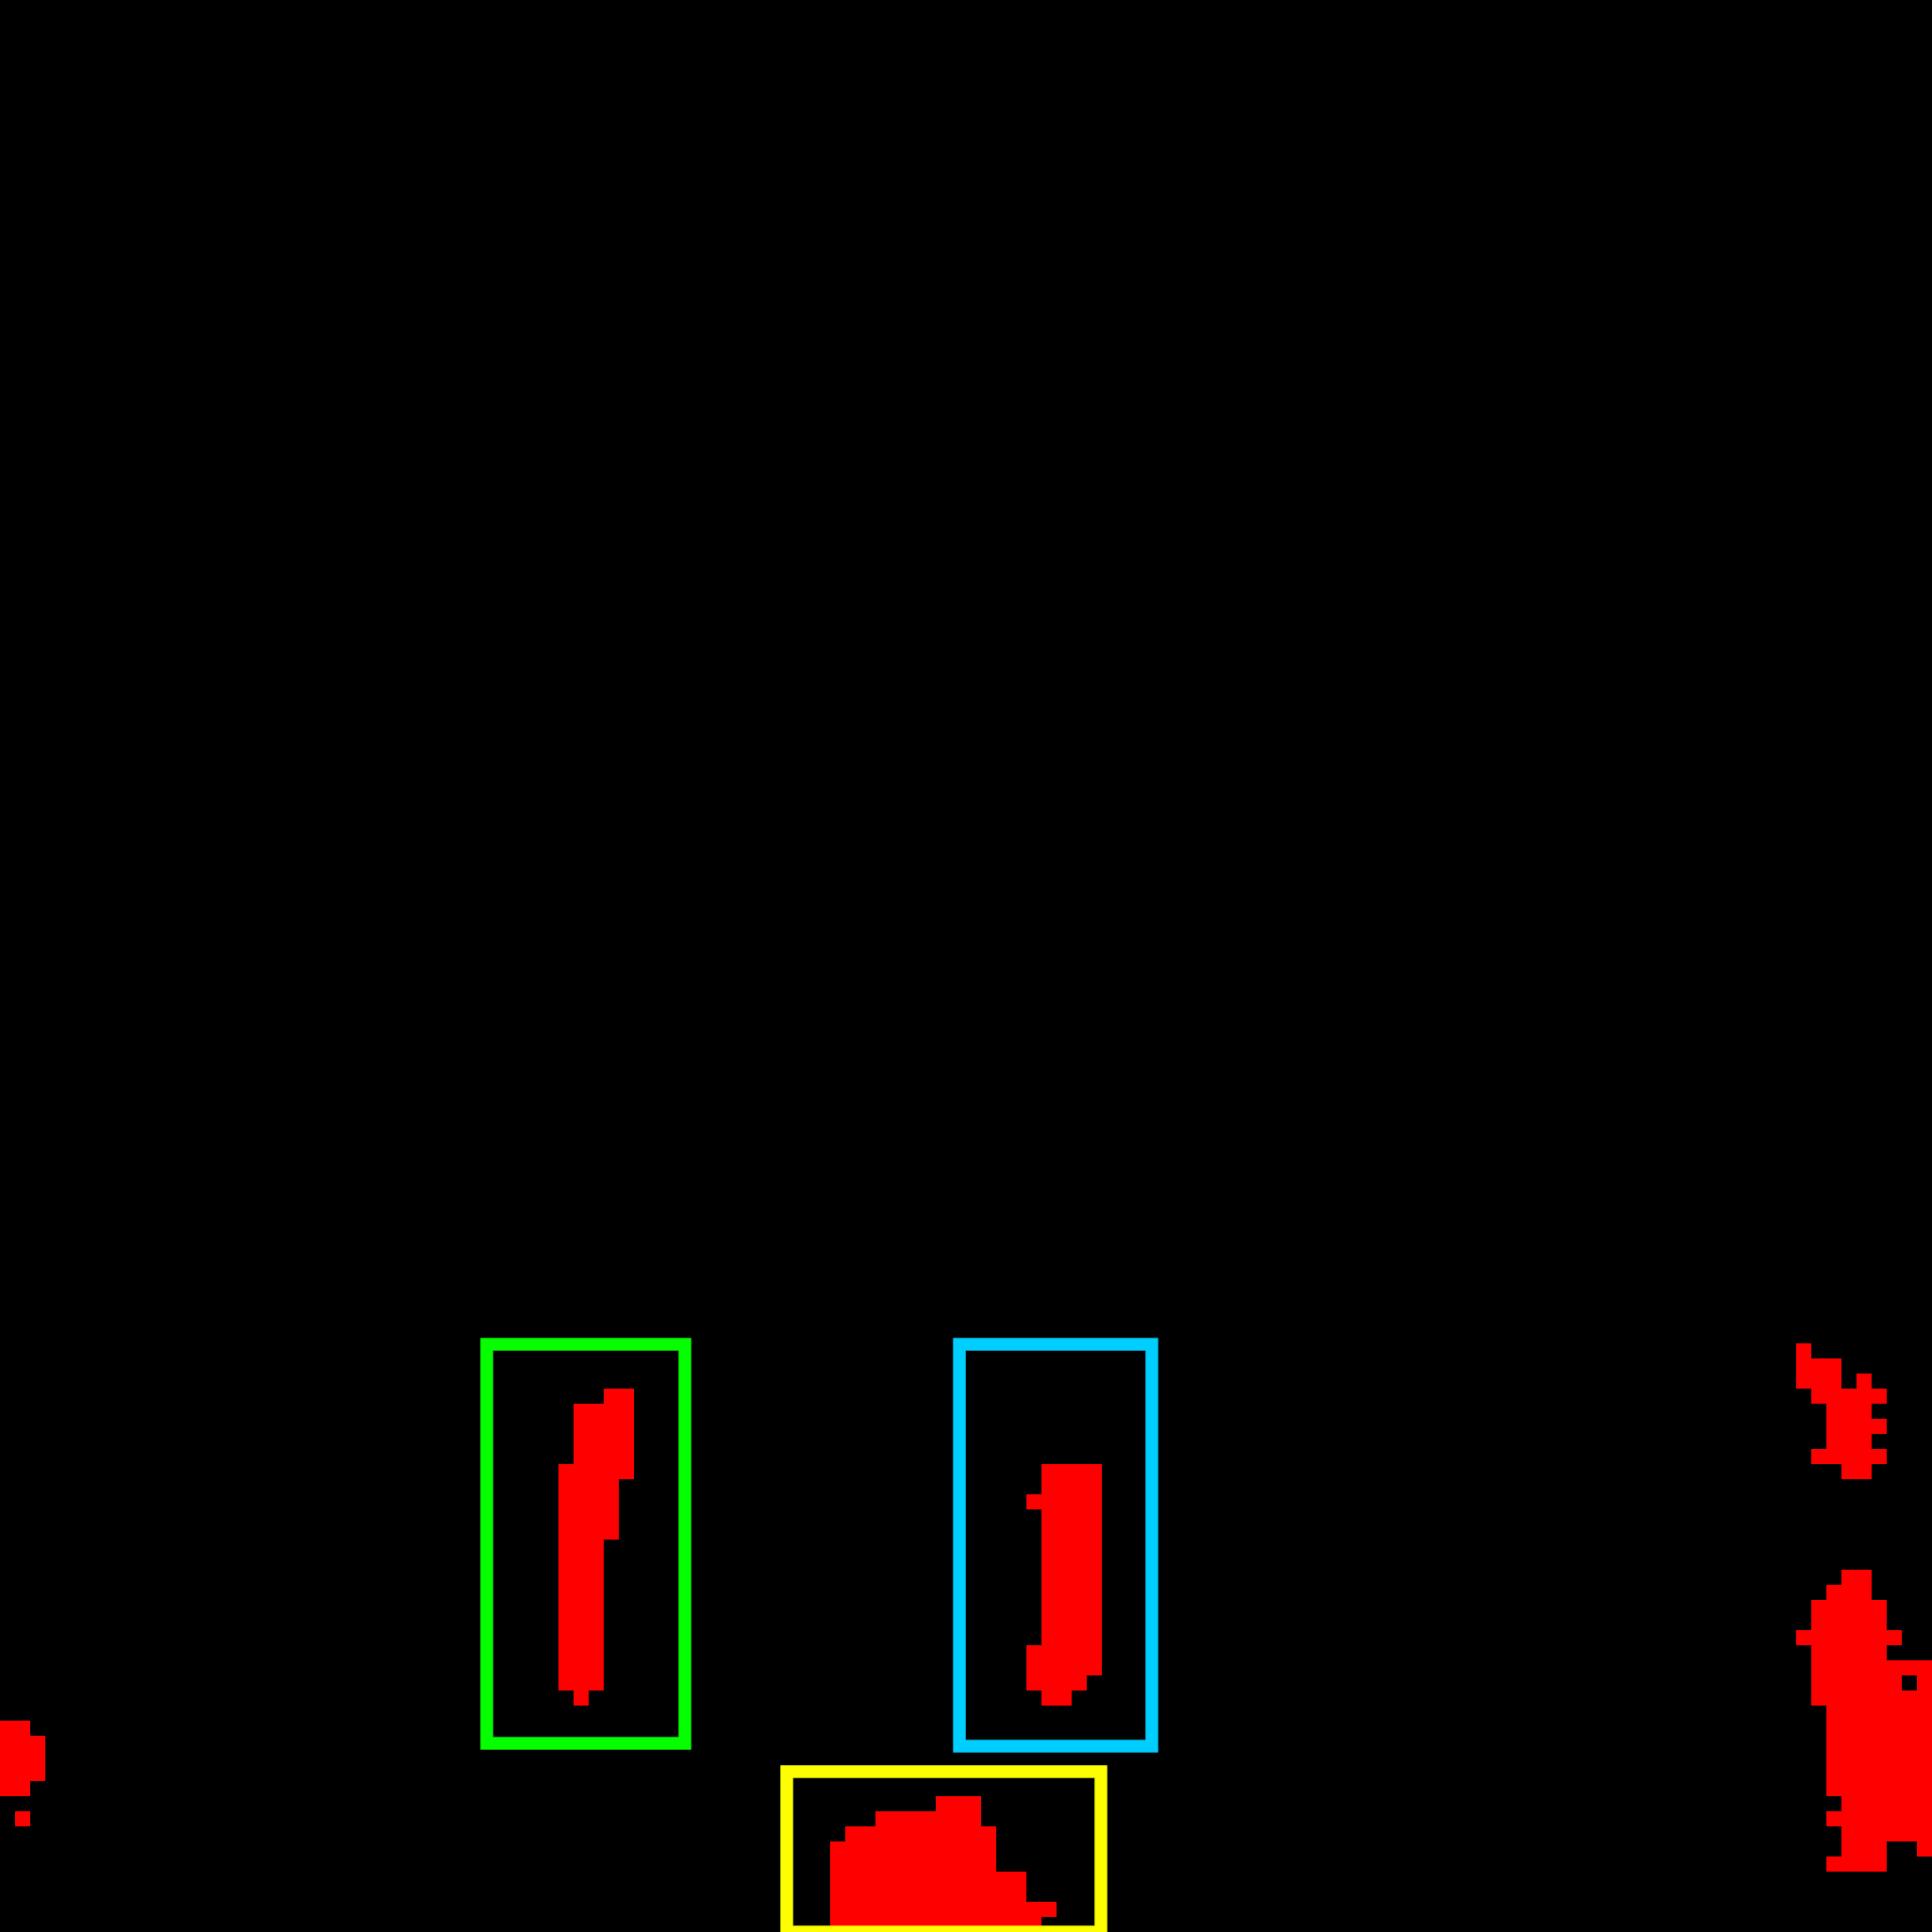
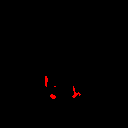
A graphical representation of the points projected to the EA view for one thermal image and the EA heatmap resulting from this projection is shown in Fig. 2.
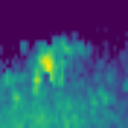
The power values of the points range from 63.0 to 132.6 (unit unknown). Cells without points were assigned a value of 0; cells with points were assigned the value , where is the power value of the point with maximum power value in a given cell and is its shifted equivalent. Setting the value of empty cells close to the values of the populated cells was done to avoid skewing the data towards the values of the empty cells. This was done to maintain sensitivity to the scale of the input features after normalization, in an attempt to improve the performance of the TMVA4D architecture.
Due to the sparsity of the points when projected to the EA view, for the elevation and azimuth dimensions the points were first discretized into 28 and 44 bins respectively. The values of all cells were then assigned using the aforementioned process, before then resizing these two dimensions in all views to 128 bins using linear interpolation.
III-D Dataset Compilation
Longer recorded sequences were first split into multiple shorter sequences. The sequence splitting was, in part, performed to reduce the size of the dataset by excluding shorter sequences that at no point featured any people. Another advantage of splitting the recorded sequences was that different splits of a single recorded sequence could then be assigned to the test, validation, and training sets for the TMVA4D architecture. This allowed for a greater variety of data in each of these three sets.
A frame in a sequence refers to heatmaps in all views originating from a singular point cloud, with annotations generated from its temporally closest thermal image. In the segmentation masks, evaluated across all frames in the dataset, the percentage of mask pixels representing class person was 1.1%; 61% of the segmentation masks contained at least one pixel representing the class. The file structure of the organized dataset follows that of the CARRADA dataset [13].
IV TMVA4D Architecture
Our CNN architecture TMVA4D (temporal multi-view network with ASPP modules for 4D radar data) is based on TMVA-Net, proposed by Ouaknine et al. [12]. TMVA-Net takes as input 3D radar data, formatted as multiple frames of heatmaps in the RA, RD, and AD views. Ouaknine et al. used the architecture to make predictions in the annotated RA and RD views as segmentation masks for four classes: background, pedestrian, cyclist, and car.
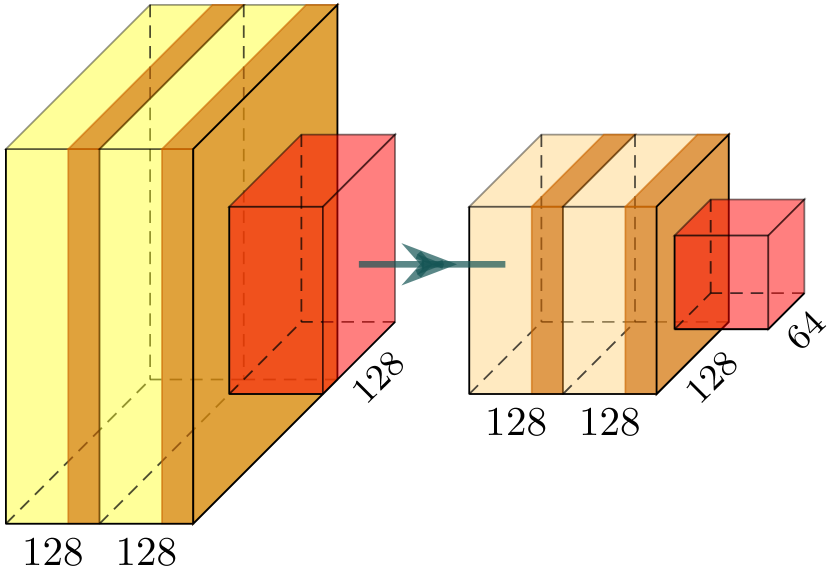
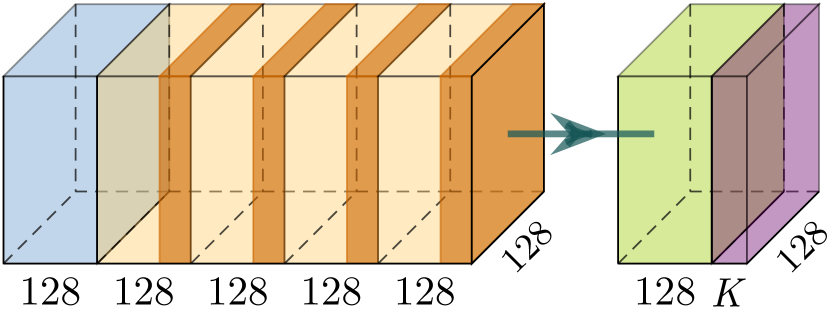
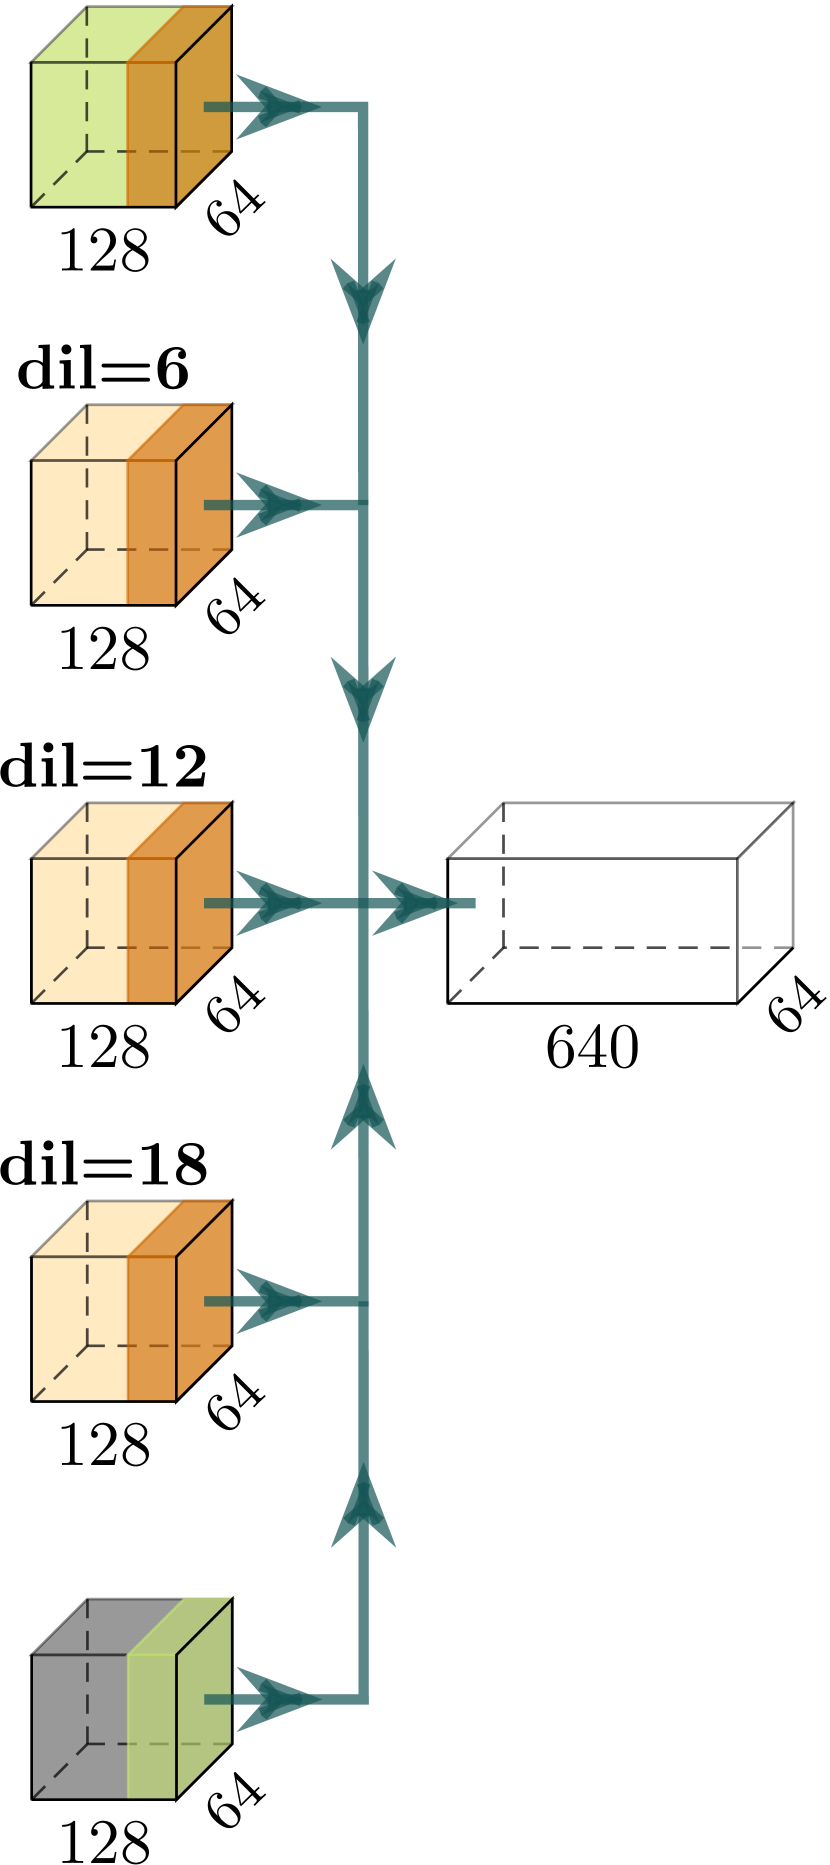
TMVA4D was designed to take as input 4D radar data, formatted as multiple frames of heatmaps in the EA, ER, ED, RA, and DA views. The architecture makes use of annotations in only the EA view, in the form of segmentation masks for two classes: background and person. As a result, the architecture is only able to output predictions for the EA view. An overview of the architecture is shown in Fig. 3, with its components described in Fig. 4. The TMVA4D model consists of 7.7 million parameters, compared to the 5.6 million parameters of TMVA-Net.
The code used to implement the architecture was a modified version of Python code produced by Arthur Ouaknine.333https://github.com/valeoai/MVRSS. The original code, besides implementing the architecture, also provides additional functionalities; these include normalizing, augmenting, and loading the data into the network, as well as outputting both quantitative and qualitative results from training and testing the model. This code was modified to accommodate the views and annotations used by TMVA4D, as opposed to those originally intended by Ouaknine et al. [12]. Both the original and modified code use PyTorch to implement their respective deep learning architectures.
V Model Training and Testing
We trained TMVA4D on a single Tesla V100 GPU, with each model taking under 43 hours to train. For the results, 10 models with different parameters were trained on the dataset using the architecture, each for 24 epochs. The number of epochs was chosen as it allowed the model to converge on the validation set while preventing overfitting from additional training. The learning rate was multiplied by a decay factor of after every learning rate step, as done by Ouaknine et al. for TMVA-Net [12]. The step size chosen for training TMVA4D was 2 epochs. The hyperparameters were selected empirically444The number of input frames was not selected empirically; it was kept the same as chosen by Ouaknine et al. for TMVA-Net [12], and are listed in Table I. The model parameters were updated, like Ouaknine et al. for TMVA-Net [12], using the Adam optimizer [9] for stochastic gradient descent.
The parameters of each of the trained models were those that resulted in the highest mDice score on the validation set during training.555During training, each model underwent 151 evaluations on the validation set, at consistently spaced intervals. The models were all tested on the test set to produce the results. The average processing time per frame was found to be under 50 ms using a single RTX 2080 Ti.
| Number of input frames | 5 |
| Batch size | 6 |
| Learning rate | |
| Learning rate step (epochs) | 2 |
| Number of epochs | 24 |
Ouaknine et al. propose a combination of loss metrics for the TMVA-Net architecture [12]. Their best-performing loss formula is
where represents weighted cross-entropy loss, represents soft Dice loss [11], and represents coherence loss (between the two views). RD and RA denote the two output views that the losses correspond to. , , and are weighing factors selected empirically.
Consider the per-class binary segmentation masks for a given frame. Each such mask corresponds to a particular class and a particular radar view. For any view AB, whose vertical dimension A is of size , and whose horizontal dimension B is of size , its mask for class can be represented as a matrix
where the value of an element specifies the truth label of whether it represents a specific class: 1 if true, 0 otherwise. Similarly, consider the prediction masks of the model for the same frame; each such mask corresponds to a particular class and a particular radar view. Consider a prediction mask whose vertical and horizontal dimensions, as well as its class, are the same as those of . It can be represented as a matrix
where the value of an element specifies the predicted probability of being 1.
With the classes , the weighted cross-entropy loss for this frame and view is then given by
where is the weight for class and view AB. The weight of for view AB is inversely proportional to the prevalence of the class in the entire dataset across all heatmaps in the view; specifically, is 1 subtracted by the proportion of elements belonging to class across all annotations of view AB. The soft Dice loss for the same frame and view is given by
The formula used to calculate the loss for the TMVA4D architecture was simply the best-performing loss formula used by Ouaknine et al. repurposed for TMVA4D, specifically
where EA denotes the output view that the losses correspond to. The weighing factors used were the same as those chosen by Ouaknine et al., namely , , and [12]. Note that since TMVA4D only uses a single output view, there is no coherence loss, making the coherence loss term redundant.
Data augmentation and normalization were both performed as done by Ouaknine et al. for TMVA-Net [12]. As data augmentation, vertical and horizontal flipping was performed to mitigate overfitting. The data was normalized to the range [0, 1] using the global statistics of the whole dataset. Specifically, the minimum and maximum element values across all heatmaps in each view were used to perform min-max normalization on the values of each view separately. The formula for min-max normalization to the range [0, 1] is
where is the original value and is the normalized value.
VI Results
We evaluate the performance of the trained TMVA4D models using both the IoU and Dice metrics. Table II shows the performance of our best-performing model on the test set, evaluated on the predictions in the EA view. Qualitative results are shown in Fig. 5.
| IoU (%) | Dice (%) | |
|---|---|---|
| Background | 99.5 | 99.8 |
| Person | 56.9 | 72.5 |
| Mean | 78.2 | 86.1 |


The model’s ability to predict accurate segmentation masks varies depending on several factors. The model’s predictions were least accurate for people lying down and most accurate for people walking, particularly when the movement was directed toward or away from the sensors. The predictions were also more accurate for frames without ego-motion and less accurate for people located at greater distances from the sensors.
VII Conclusions
We have presented TMVA4D, a CNN architecture for high-performance semantic segmentation of human beings in 4D radar data. This architecture takes multiple frames of radar heatmaps in the EA, ER, ED, RA, and DA views and outputs semantic segmentation masks in the EA view.
We have trained and evaluated TMVA4D on a new 4D radar dataset for human detection in field environments. The dataset features humans in different activities and modes of motion.
When using a 4D radar, elevation information of the radar’s surroundings can be utilized for human detection; this is particularly useful when attempting to detect a person lying flat on the ground.
References
- [1] Keenan Burnett, David J Yoon, Yuchen Wu, Andrew Z Li, Haowei Zhang, Shichen Lu, Jingxing Qian, Wei-Kang Tseng, Andrew Lambert, Keith YK Leung, Angela P Schoellig and Timothy D Barfoot “Boreas: A multi-season autonomous driving dataset” In The International Journal of Robotics Research 42.1-2, 2023, pp. 33–42 DOI: 10.1177/02783649231160195
- [2] Anjun Chen, Xiangyu Wang, Kun Shi, Shaohao Zhu, Bin Fang, Yingfeng Chen, Jiming Chen, Yuchi Huo and Qi Ye “ImmFusion: Robust mmWave-RGB Fusion for 3D Human Body Reconstruction in All Weather Conditions” In 2023 IEEE International Conference on Robotics and Automation (ICRA) IEEE, 2023 DOI: 10.1109/icra48891.2023.10161428
- [3] Liang-Chieh Chen, George Papandreou, Iasonas Kokkinos, Kevin Murphy and Alan L. Yuille “DeepLab: Semantic Image Segmentation with Deep Convolutional Nets, Atrous Convolution, and Fully Connected CRFs” In IEEE Transactions on Pattern Analysis and Machine Intelligence 40.4, 2018, pp. 834–848 DOI: 10.1109/TPAMI.2017.2699184
- [4] Emma Dawson, Eslam Mounier, Mohamed Elhabiby and Aboelmagd Noureldin “Merits and Limitations of Automotive Radar for Land Vehicle Positioning in Challenging Environments” In IEEE Sensors Journal 23.21, 2023, pp. 26691–26700 DOI: 10.1109/JSEN.2023.3318069
- [5] Xiangyu Gao, Guanbin Xing, Sumit Roy and Hui Liu “RAMP-CNN: A Novel Neural Network for Enhanced Automotive Radar Object Recognition” In IEEE Sensors Journal 21.4, 2021, pp. 5119–5132 DOI: 10.1109/JSEN.2020.3036047
- [6] International Council on Mining and Metals “Safety Performance: Benchmarking Progress of ICMM Company Members In 2022” International Council on MiningMetals, 2023
- [7] Prannay Kaul, Daniele Martini, Matthew Gadd and Paul Newman “RSS-Net: Weakly-Supervised Multi-Class Semantic Segmentation with FMCW Radar” In 2020 IEEE Intelligent Vehicles Symposium (IV), 2020, pp. 431–436 DOI: 10.1109/IV47402.2020.9304674
- [8] Jiyoon Kim, Bum-jin Park and Jisoo Kim “Empirical Analysis of Autonomous Vehicle’s LiDAR Detection Performance Degradation for Actual Road Driving in Rain and Fog” In Sensors 23.6, 2023 DOI: 10.3390/s23062972
- [9] Diederik Kingma and Jimmy Ba “Adam: A Method for Stochastic Optimization” In International Conference on Learning Representations, 2014
- [10] Alex H. Lang, Sourabh Vora, Holger Caesar, Lubing Zhou, Jiong Yang and Oscar Beijbom “PointPillars: Fast Encoders for Object Detection From Point Clouds” In 2019 IEEE/CVF Conference on Computer Vision and Pattern Recognition (CVPR), 2019, pp. 12689–12697 DOI: 10.1109/CVPR.2019.01298
- [11] Fausto Milletari, Nassir Navab and Seyed-Ahmad Ahmadi “V-Net: Fully Convolutional Neural Networks for Volumetric Medical Image Segmentation” In 2016 Fourth International Conference on 3D Vision (3DV), 2016, pp. 565–571 DOI: 10.1109/3DV.2016.79
- [12] Arthur Ouaknine, Alasdair Newson, Patrick Pérez, Florence Tupin and Julien Rebut “Multi-View Radar Semantic Segmentation” In 2021 IEEE/CVF International Conference on Computer Vision (ICCV), 2021, pp. 15651–15660 DOI: 10.1109/ICCV48922.2021.01538
- [13] Arthur Ouaknine, Alasdair Newson, Julien Rebut, Florence Tupin and Patrick Pérez “CARRADA Dataset: Camera and Automotive Radar with Range-Angle-Doppler Annotations” In 2020 25th International Conference on Pattern Recognition (ICPR), 2020, pp. 5068–5075 DOI: 10.1109/ICPR48806.2021.9413181
- [14] Dong-Hee Paek, Seung-Hyun Kong and Kevin Tirta Wijaya “K-Radar: 4D Radar Object Detection for Autonomous Driving in Various Weather Conditions” In Advances in Neural Information Processing Systems 35 Curran Associates, Inc., 2022, pp. 3819–3829 URL: https://proceedings.neurips.cc/paper_files/paper/2022/file/185fdf627eaae2abab36205dcd19b817-Paper-Datasets_and_Benchmarks.pdf
- [15] Marcel Sheeny, Emanuele De Pellegrin, Saptarshi Mukherjee, Alireza Ahrabian, Sen Wang and Andrew Wallace “RADIATE: A Radar Dataset for Automotive Perception in Bad Weather” In 2021 IEEE International Conference on Robotics and Automation (ICRA), 2021, pp. 1–7 DOI: 10.1109/ICRA48506.2021.9562089
- [16] Christian Szegedy, Wei Liu, Yangqing Jia, Pierre Sermanet, Scott Reed, Dragomir Anguelov, Dumitru Erhan, Vincent Vanhoucke and Andrew Rabinovich “Going deeper with convolutions” In 2015 IEEE Conference on Computer Vision and Pattern Recognition (CVPR), 2015, pp. 1–9 DOI: 10.1109/CVPR.2015.7298594
- [17] Yizhou Wang, Zhongyu Jiang, Yudong Li, Jenq-Neng Hwang, Guanbin Xing and Hui Liu “RODNet: A Real-Time Radar Object Detection Network Cross-Supervised by Camera-Radar Fused Object 3D Localization” In IEEE Journal of Selected Topics in Signal Processing 15.4, 2021, pp. 954–967 DOI: 10.1109/JSTSP.2021.3058895
- [18] Yizhou Wang, Gaoang Wang, Hung-Min Hsu, Hui Liu and Jenq-Neng Hwang “Rethinking of Radar’s Role: A Camera-Radar Dataset and Systematic Annotator via Coordinate Alignment” In 2021 IEEE/CVF Conference on Computer Vision and Pattern Recognition Workshops (CVPRW), 2021, pp. 2809–2818 DOI: 10.1109/CVPRW53098.2021.00316
- [19] Ao Zhang, Farzan Erlik Nowruzi and Robert Laganiere “RADDet: Range-Azimuth-Doppler based Radar Object Detection for Dynamic Road Users” In 2021 18th Conference on Robots and Vision (CRV), 2021, pp. 95–102 DOI: 10.1109/CRV52889.2021.00021
- [20] Lianqing Zheng, Zhixiong Ma, Xichan Zhu, Bin Tan, Sen Li, Kai Long, Weiqi Sun, Sihan Chen, Lu Zhang, Mengyue Wan, Libo Huang and Jie Bai “TJ4DRadSet: A 4D Radar Dataset for Autonomous Driving” In 2022 IEEE 25th International Conference on Intelligent Transportation Systems (ITSC), 2022, pp. 493–498 DOI: 10.1109/ITSC55140.2022.9922539