Hidden charge density wave induced shadow bands and ultrafast dynamics of CuTe investigated using time-resolved ARPES
Abstract
Revealing the fine electronic structure is critical for understanding the underlying physics of low-dimensional materials. Angle-resolved photoemission spectroscopy (ARPES) is a powerful experimental technique for mapping out the experimental electronic structure. By reducing the photon energy (e.g. to 6 eV) using laser sources, a greatly improved momentum resolution can be achieved, thereby providing opportunities for “zooming in” the fine electronic structure and even revealing the previously unresolvable bands near the Brillouin zone center. Here, by using quasi-one-dimensional material CuTe as an example, we demonstrate the unique capability of laser-based ARPES in revealing the fine electronic structures of “hidden” charge density wave induced shadow bands near the Brillouin zone center, which are previously unresolvable using synchrotron sources. The observation of the shadow bands reveals the CDW phase from the aspect of band folding, and the unpredicted CDW band hybridization strongly modifies the electronic structure and Fermi surface, which suggests that such hybridization must be taken into account for studying the CDW transition. Moreover, the ultrafast non-equilibrium carrier dynamics are captured by time-resolved ARPES, revealing the relaxation dynamics through electron-phonon scattering. Our work demonstrates the advantages of laser-based ARPES in zooming in the fine electronic structures, as well as capturing the ultrafast dynamics of low-dimensional materials.
The electronic structure E(k) determines the physical properties of low-dimensional materials, and therefore experimentally mapping out their electronic structure is critical. Angle-resolved photoemission spectroscopy (ARPES) is a powerful experimental technique for probing the electronic structure of low-dimensional materials Damascelli et al. (2003); Sobota et al. (2021); Zhang et al. (2022). Figure 1(a) shows a schematic experimental setup for ARPES, where a probe light source excites electrons from the solid-state materials. The range of accessible in-plane momentum is determined by the photon energy , where is the emission angle, is the binding energy of photoelectrons and is the work function. In order to cover a large energy and momentum range, synchrotron light sources with a photon energy of 20–100 eV are often used, which, however also inevitably leads to a compromised in-plane momentum resolution . Reducing the photon energy from 100 eV to 6 eV using laser sources Koralek et al. (2006); Kiss et al. (2008); Liu et al. (2008); Meng et al. (2009); Deng et al. (2016); Tamai et al. (2016); Bruno et al. (2016); Bareille et al. (2018); Lin et al. (2021); Kunisada et al. (2020) can significantly improve by almost eight times (Fig. 1(b)), making low energy laser-ARPES a potential “microscope” (see schematic illustration in Fig. 1(c)) for zooming in the fine electronic structures near the Brillouin zone (BZ) center, which are otherwise not resolvable using higher photon energy light sources generated from synchrotron. In addition, the ultrafast laser pulses also allow to capture the ultrafast carrier dynamics after exciting the sample with a pump beam by performing ARPES measurements in the pump-probe scheme, namely, time-resolved ARPES (TrARPES) Boschini et al. (2024); Perfetti et al. (2007); Schmitt et al. (2008); Sobota et al. (2012a); Hellmann et al. (2012); Gerber et al. (2017); Yang et al. (2019); Bao et al. (2022a); Ulstrup et al. (2016).
Here, we demonstrate the advantages of laser-ARPES in revealing the fine electronic structures near the BZ center of various quantum materials, such as Li-intercalated graphene, topological semimetal PtSn4, charge density wave (CDW) materials IrTe2 and CuTe. Using CuTe as an example Stolze et al. (2013); Zhang et al. (2018); Kwon et al. (2024), we further show that the “hidden” CDW shadow bands, which were unresolvable in previous ARPES measurements using synchrotron light sources Zhang et al. (2018), can now be clearly resolved using 6 eV laser sources, and the CDW-induced band hybridization is identified below the CDW transition temperature. Moreover, by performing TrARPES with a pump pulse, the relaxation dynamics of photo-excited carriers are captured, revealing the role of electron-phonon (el-ph) scattering the non-equilibrium state. Our work provides new insights into the CDW physics of CuTe, and demonstrates the advantages of low energy laser-ARPES in zooming in the fine electronic structures near the BZ center as well as revealing the related non-equilibrium carrier dynamics.
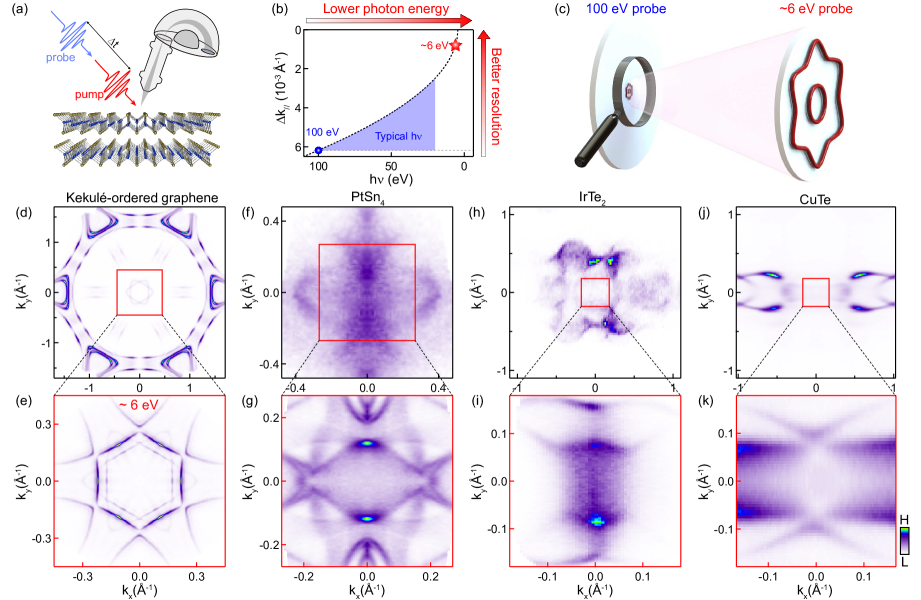
Low-energy laser-ARPES can not only “magnify” the electronic structures near the BZ center, more interestingly it can reveal the previously unresolvable “hidden” bands Meng et al. (2009); Kunisada et al. (2020) as demonstrated in Figs. 1(d)–(k). Figure 1(d) shows the Fermi surface map of Li-intercalated graphene where the pockets near the K points are folded to the point by the ()R30∘ Kekulé order Bao et al. (2021b, 2022b). While the three pockets corresponding to trilayer graphene are clearly observed near the BZ corners using helium lamp source, only one set of replica pockets is observed near the point Bao et al. (2021b); Zhang et al. (2021). Laser-ARPES measurements instead can zoom in the fine electronic structures near the BZ center, and resolve the other two folded pockets as shown in Fig. 1(e). In topological semimetal PtSn4 which has a complex Fermi surface structure Mun et al. (2012); Wu et al. (2016), only some broad features are observed in the Fermi surface map in Fig. 1(f) using a helium lamp source. Interestingly, laser-ARPES measurements successfully resolve a nice and complex fine electronic structure in Fig. 1(g). For CDW materials, the shadow bands induced by band folding due to the CDW periodicity are typically much weaker than the original bands, which are therefore often “hidden” or unresolvable as compared to the strong original bands. Laser-ARPES measurements provide new opportunities for resolving such “hidden” shadow bands. Figures 1(h)–(k) show comparisons between the Fermi surface maps measured with high and low photon energies in two CDW materials IrTe2 Qian et al. (2014); Kim et al. (2015); Bao et al. (2021a) and CuTe Zhang et al. (2018), where CDW-induced shadow bands are clearly resolved as shown in Figs. 1(i) and 1(k), demonstrating the power of laser-ARPES measurements in magnifying the “hidden” shadow bands. Moreover, the probe laser source with tunable photon energy provides opportunities for overcoming the dipole element effects, which either enhance or suppress the intensity of the bands (see Fig. S1 in Supplemental Material sup ). The four types of materials presented above demonstrate that laser-ARPES measurements can provide opportunities for zooming in the fine electronic structures, and even revealing the previously unresolvable bands of quantum materials near the point. Especially for CuTe, revealing the “hidden” shadow bands helps to understand the CDW state from another aspect (folded bands due to new lattice periodicity), in complementary to the aspect of CDW energy gap Zhang et al. (2018). Therefore, below we further use CuTe as an example to explore the physics of the “hidden” bands, including evidence of band folding and CDW-induced hybridization gap as well as the ultrafast dynamics.
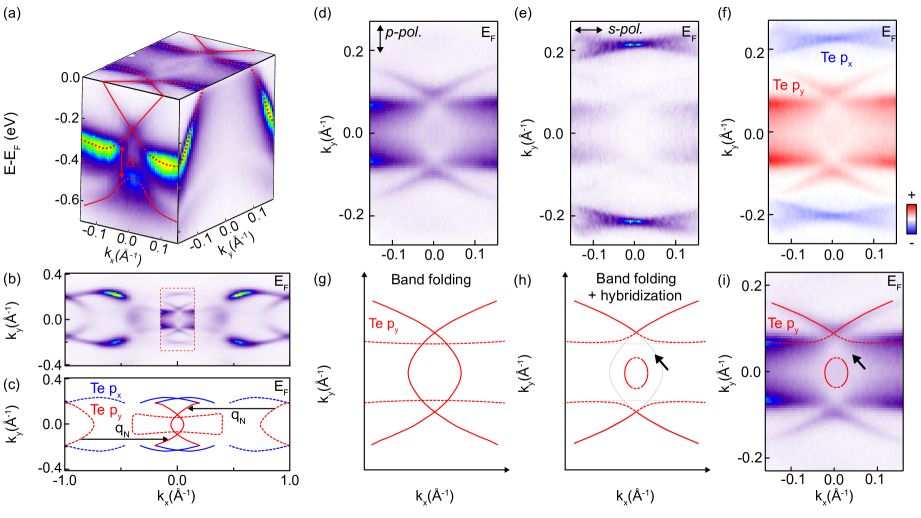
CuTe is a quasi-one-dimensional room-temperature CDW material Stolze et al. (2013), whose CDW band structure has been investigated by synchrotron-based ARPES measurements Zhang et al. (2018), while CDW-induced shadow bands remain elusive. The successful observation of CDW shadow bands by laser-ARPES allows to investigate the CDW phase transition of CuTe from a new perspective, namely, the evolution of the shadow bands. Figure 2(a) shows the full three-dimensional electronic structure of CuTe using laser-ARPES. To further confirm that the observed new bands near the point are from CDW shadow bands, we compare the fine Fermi surface map (marked by red dashed box) with a large-ranged Fermi surface map measured by a high photon energy in Fig. 2(b). As schematically summarized in Fig. 2(c), the CDW nesting vectors Zhang et al. (2018) translates the pockets (dashed curves) originated from Te (blue) and (red) orbitals near the BZ boundary to the point, and the replica pockets (solid curves) match well with the measured Fermi surface by laser-ARPES, thereby suggesting that they are likely shadow bands induced by the CDW order.
Polarization-dependent laser-ARPES measurements are performed to further confirm the symmetry properties of these shadow bands. Figures 2(d) and 2(e) show a comparison of the Fermi surface maps using two different light polarizations: , where the electric field is along direction; and , where the electric field is along direction. Distinct intensity distributions are observed, and the differential (dichroic) intensity spectrum is shown in Fig. 2(f). The polarization-dependent laser-ARPES measurements show that the pockets around (red) and away from (blue) are from Te and respectively (similar to the polarization-dependent ARPES measurements in another orbital system Sugimoto et al. (2015)), which are also consistent with the symmetry properties of the original bands Zhang et al. (2018). However, the simple band folding picture in Fig. 2(g) does not fully match the measured Fermi surface map shown in Fig. 2(i), suggesting there is significant hybridization between the shadow bands (red solid curves) and original bands (red dashed curves), as schematically illustrated in Fig. 2(h). Such hybridization also results in the gap opening in Fig. 2(a).
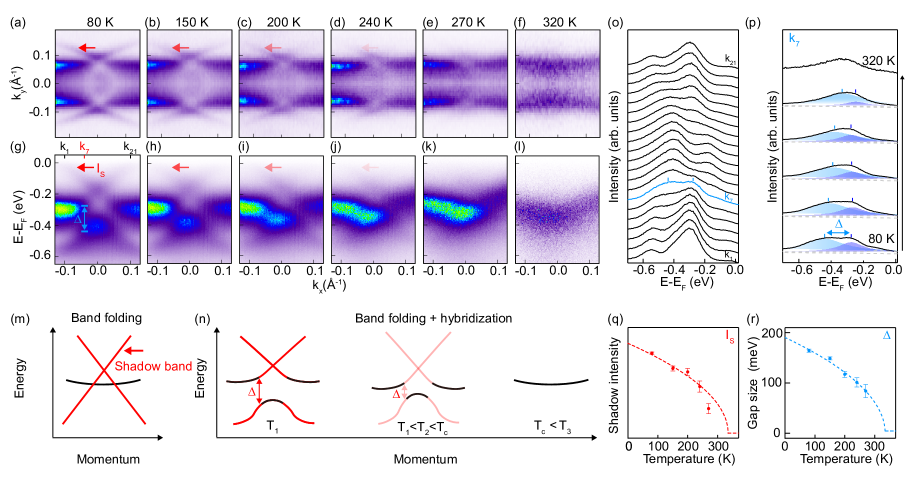
The CDW phase transition can be directly visualized by tracing the evolution of the shadow bands and the hybridization gap with temperature. As shown in Figs. 3(a)–(f), the shadow bands marked by red arrows gradually disappear with increasing temperature, and eventually become undetectable at 320 K, which is near the CDW phase transition temperature. Similar temperature evolution is also observed in the dispersion images shown in Figs. 3(g)–(l). Moreover, the hybridization gap (indicated by the blue arrow in Fig. 3(g)) also decreases gradually with increasing temperature. The electronic structure without hybridization is schematically shown in Fig. 3(m), where hybridization between shadow and origin bands opens up a hybridization gap. With increasing temperature, both the shadow band intensity and the hybridization gap decrease when approaching the CDW phase transition as shown in Fig. 3(n). A quantitative analysis of the shadow band intensity is shown in Supplemental Material Fig. S2 sup , and analysis of the hybridization gap is performed by fitting the energy distribution curves (EDCs) measured at the momentum (the blue curve in Fig. 3(o)) with different temperatures as shown in Fig. 3(p). The evolution of the shadow band intensity (Fig. 3(q)) and the hybridization gap (Fig. 3(r)) is consistent with BCS-type gap equation Chen et al. (2015); Zhang et al. (2018); Wang et al. (2019), suggesting that the weakening of shadow bands and the decreasing of the hybridization gap are both induced by the suppression of the CDW order. The unpredicted band hybridization between the shadow bands and original bands not only opens hybridization gaps but also strongly modifies the “topology” of Fermi surface which should have impact on its physical properties (e.g. transport properties). Such observation demonstrates the important role of band hybridization between shadow bands and original bands in CDW transition, which has been however largely ignored in previous studies. Our new finding suggests that such hybridization must be taken into account for studying the CDW transition in the future. The observation of CDW-induced shadow bands and hybridization gap, made possible by low-energy laser-ARPES measurements, provides new perspectives for the electronic structure modification of CuTe in the CDW phase.
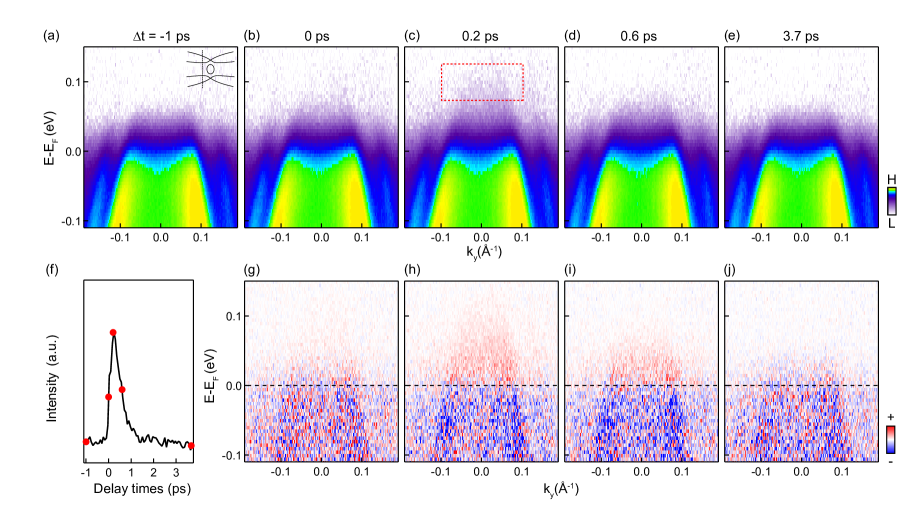
The ultrafast probe laser pulses have another advantage: the capability to measure the ultrafast carrier dynamics by combining a pump beam in TrARPES measurements. Meanwhile, revealing the ultrafast dynamics is important for CDW materials Schmitt et al. (2008); Hellmann et al. (2012); Hedayat et al. (2019); Sayers et al. (2020), because electron-phonon (el-ph) and electron-electron (el-el) scattering can drive the relaxation dynamics. We first investigate the electronic structure evolution of CuTe upon photo-excitation. Figures 4(a)–(e) show TrARPES snapshots of CuTe at different delay times, where the representative delay times are marked in the time trace (integrating red box in Fig. 4(c)) in Fig. 4(f). The photo-excited electronic states can be better revealed in the differential images in Fig. 4(g)–(j), which are obtained by subtracting the dispersion image by data measured at -1 ps. A fast relaxation dynamics is clearly distinguished by comparing data at 0.2 ps (Fig. 4(h)) and 0.6 ps ((Fig. 4(i)), which is quantitatively analyzed in Fig. 5.
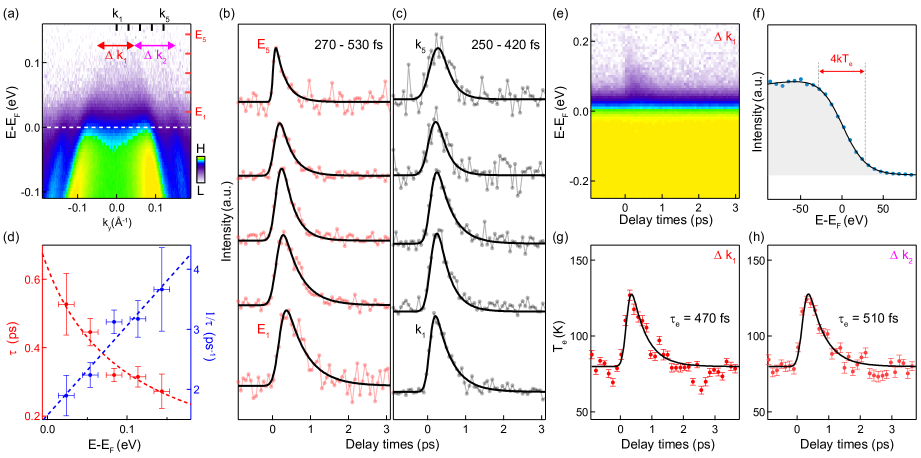
The energy and momentum resolved carrier dynamics is further revealed, which helps us to distinguish the relaxation dynamics. The energy and momentum dependent temporal evolution is shown in Fig. 5(b) and 5(c), which is extracted from energies and momentums marked in Fig. 5(a). For all energies and momentums, the relaxation dynamics lies between 200–600 fs, which are obtained by fitting the temporal evolution of the ARPES intensity Bao et al. (2021c). Here, we further analyze the energy-dependent lifetime (from Fig. 5(b)) and scattering rate , which are plotted in Fig. 5(d). The lifetime is consistent with the recent complimentary reflectivity measurements of the same material Li et al. (2022). Such relaxation time is much faster compared to many quantum materials, for example, Bi2Se3 Sobota et al. (2012a); Wang et al. (2012) and Cd3As2 Bao et al. (2022c), which might indicate strong el-ph coupling (inversely proportional to relaxation times Elsayed-Ali et al. (1987); Bao et al. (2022c)) in CuTe, as theoretical calculations Zhang et al. (2018); Kim et al. (2019); Cudazzo and Wirtz (2021); Campetella et al. (2023) and transport measurement Kuo et al. (2020) indicated. We note that the el-ph coupling induced kink feature is not resolvable in our measurements, which is not surprising considering that the phonon energy is quite low, meV, smaller than the energy resolution of meV (see Fig. S3 for energy resolution in Supplemental Material sup ). In addition to the carrier dynamics, the photo-excited thermodynamics can also be revealed. Figure 5(e) shows the continuous evolution of EDCs as a function of delay times by integrating momentum range in Fig. 5(a), where the transient electronic temperature is extracted by fitting the EDCs with a Fermi-Dirac distribution, as shown in Fig. 5(f). The evolution of the electronic temperature shows a relaxation time of 470 70 fs as shown in Fig. 5(g) near point ( in Fig. 5(a)) and a relaxation time of 510 60 fs as shown in Fig. 5(h) away from point ( in Fig. 5(a)), which are both 500 fs. First, compared to the characteristic time scale, which is 10–100 fs for el-el scattering and is 100–1000 fs for el-ph scattering Hellmann et al. (2012), we can imply that photo-carriers of CuTe relax through el-ph scattering. Second, relaxation time scale of CuTe is comparable to many CDW materials, for example, TbTe3 Schmitt et al. (2008), 1T-TaS2 Perfetti et al. (2006); Bao et al. (2023), 1T-TiSe2 Hedayat et al. (2019) and 1T-TaSe2 Sayers et al. (2020) (all of them relax with time scale of few hundreds of femtoseconds). While those CDW materials relax through el-ph scattering, we indicate that the relaxation dynamics of CuTe is driven by el-ph scattering. We would like to note that el-el scattering (supported by calculation Zhang et al. (2018)) cannot be fully ruled out since the time scale of tens of femtoseconds might not be distinguished.
In summary, by using laser-ARPES with low photon energy, a significantly improved momentum resolution is achieved, allowing to successfully reveal the fine electronic structures near the point for various quantum materials. Using CuTe as an example, the CDW phase transition is revealed from the view of “hidden” shadow bands. Interestingly, the unpredicted CDW band hybridization strongly modifies the electronic structure and Fermi surface, which suggests that such hybridization must be taken into account for the physics of the CDW transition. Moreover, the ultrafast non-equilibrium carrier dynamics are captured by time-resolved ARPES, revealing the relaxation dynamics through el-ph scattering. Our work demonstrates the power of low energy laser-ARPES in zooming in the fine electronic structures and ultrafast dynamics near the BZ center, which can be extended to a wide range of quantum materials.
Acknowledgements.
ACKNOWLEDGMENTS
This work is supported by the National Key RD Program of China (No. 2021YFE0107900, 2020YFA0308800, 2021YFA1400100), the National Natural Science Foundation of China (Grant No. 12234011, 92250305, 52388201, 11725418 and 11427903). C.B. is supported by a project funded by China Postdoctoral Science Foundation (No. 2022M721886 and No. BX20230187) and the Shuimu Tsinghua Scholar Program.
.1 Conflict of interest
The authors have no conflicts to disclose.
References
- Damascelli et al. (2003) A. Damascelli, Z. Hussain, and Z.-X. Shen, Rev. Mod. Phys. 75, 473 (2003).
- Sobota et al. (2021) J. A. Sobota, Y. He, and Z.-X. Shen, Rev. Mod. Phys. 93, 025006 (2021).
- Zhang et al. (2022) H. Zhang, T. Pincelli, C. Jozwiak, T. Kondo, R. Ernstorfer, T. Sato, and S. Zhou, Nat. Rev. Methods Primers 2, 54 (2022).
- Koralek et al. (2006) J. D. Koralek, J. F. Douglas, N. C. Plumb, Z. Sun, A. V. Fedorov, M. M. Murnane, H. C. Kapteyn, S. T. Cundiff, Y. Aiura, K. Oka, et al., Phys. Rev. Lett. 96, 017005 (2006).
- Kiss et al. (2008) T. Kiss, T. Shimojima, K. Ishizaka, A. Chainani, T. Togashi, T. Kanai, X.-Y. Wang, C.-T. Chen, S. Watanabe, and S. Shin, Rev. Sci. Instrum. 79, 023106 (2008).
- Liu et al. (2008) G. Liu, G. Wang, Y. Zhu, H. Zhang, G. Zhang, X. Wang, Y. Zhou, W. Zhang, H. Liu, L. Zhao, et al., Rev. Sci. Instrum. 79, 023105 (2008).
- Meng et al. (2009) J. Meng, G. Liu, W. Zhang, L. Zhao, H. Liu, X. Jia, D. Mu, S. Liu, X. Dong, J. Zhang, et al., Nature 462, 335 (2009).
- Deng et al. (2016) K. Deng, G. Wan, P. Deng, K. Zhang, S. Ding, E. Wang, M. Yan, H. Huang, H. Zhang, Z. Xu, et al., Nat. Phys. 12, 1105 (2016).
- Tamai et al. (2016) A. Tamai, Q. S. Wu, I. Cucchi, F. Y. Bruno, S. Riccò, T. K. Kim, M. Hoesch, C. Barreteau, E. Giannini, C. Besnard, et al., Phys. Rev. X 6, 031021 (2016).
- Bruno et al. (2016) F. Y. Bruno, A. Tamai, Q. S. Wu, I. Cucchi, C. Barreteau, A. De la Torre, S. McKeownWalker, S. Riccò, Z. Wang, T. K. Kim, et al., Phys. Rev. B 94, 121112(R) (2016).
- Bareille et al. (2018) C. Bareille, S. Suzuki, M. Nakayama, K. Kuroda, A. H. Nevidomskyy, Y. Matsumoto, S. Nakatsuji, T. Kondo, and S. Shin, Phys. Rev. B 97, 045112 (2018).
- Lin et al. (2021) C. Lin, M. Ochi, R. Noguchi, K. Kuroda, M. Sakoda, A. Nomura, M. Tsubota, P. Zhang, C. Bareille, K. Kurokawa, et al., Nat. Mater. 20, 1093 (2021).
- Kunisada et al. (2020) S. Kunisada, S. Isono, Y. Kohama, S. Sakai, C. Bareille, S. Sakuragi, R. Noguchi, K. Kurokawa, K. Kuroda, Y. Ishida, et al., Science 369, 833 (2020).
- Boschini et al. (2024) F. Boschini, M. Zonno, and A. Damascelli, Rev. Mod. Phys. 96, 015003 (2024).
- Perfetti et al. (2007) L. Perfetti, P. A. Loukakos, M. Lisowski, U. Bovensiepen, H. Eisaki, and M. Wolf, Phys. Rev. Lett. 99, 197001 (2007).
- Schmitt et al. (2008) F. Schmitt, P. S. Kirchmann, U. Bovensiepen, R. G. Moore, L. Rettig, M. Krenz, J.-H. Chu, N. Ru, L. Perfetti, D. H. Lu, et al., Science 321, 1649 (2008).
- Sobota et al. (2012a) J. A. Sobota, S. Yang, J. G. Analytis, Y. L. Chen, I. R. Fisher, P. S. Kirchmann, and Z.-X. Shen, Phys. Rev. Lett. 108, 117403 (2012a).
- Hellmann et al. (2012) S. Hellmann, T. Rohwer, M. Kalläne, K. Hanff, C. Sohrt, A. Stange, A. Carr, M. Murnane, H. Kapteyn, L. Kipp, et al., Nat. Commun. 3, 1069 (2012).
- Gerber et al. (2017) S. Gerber, S.-L. Yang, D. Zhu, H. Soifer, J. A. Sobota, S. Rebec, J. J. Lee, T. Jia, B. Moritz, C. Jia, et al., Science 357, 71 (2017).
- Yang et al. (2019) S.-L. Yang, J. A. Sobota, Y. He, D. Leuenberger, H. Soifer, H. Eisaki, P. S. Kirchmann, and Z.-X. Shen, Phys. Rev. Lett. 122, 176403 (2019).
- Bao et al. (2022a) C. Bao, P. Tang, D. Sun, and S. Zhou, Nat. Rev. Phys. 4, 33 (2022a).
- Ulstrup et al. (2016) S. Ulstrup, A. G. Čabo, J. A. Miwa, J. M. Riley, S. S. Grønborg, J. C. Johannsen, C. Cacho, O. Alexander, R. T. Chapman, E. Springate, et al., ACS Nano 10, 6315 (2016).
- Stolze et al. (2013) K. Stolze, A. Isaeva, F. Nitsche, U. Burkhardt, H. Lichte, D. Wolf, and T. Doert, Angew. Chem. Int. Ed. 52, 862 (2013).
- Zhang et al. (2018) K. Zhang, X. Liu, H. Zhang, K. Deng, M. Yan, W. Yao, M. Zheng, E. F. Schwier, K. Shimada, J. D. Denlinger, et al., Phys. Rev. Lett. 121, 206402 (2018).
- Kwon et al. (2024) S. Kwon, H. Jung, S. Lee, G. Y. Cho, K. Kong, C. Won, S.-W. Cheong, and H. W. Yeom, Nat. Commun. 15, 984 (2024).
- Bao et al. (2021a) C. Bao, H. Zhang, Q. Li, S. Zhou, H. Zhang, K. Deng, K. Zhang, L. Luo, W. Yao, C. Chen, et al., Commun. Phys. 4, 229 (2021a).
- Bao et al. (2021b) C. Bao, H. Zhang, T. Zhang, X. Wu, L. Luo, S. Zhou, Q. Li, Y. Hou, W. Yao, L. Liu, et al., Phys. Rev. Lett. 126, 206804 (2021b).
- Bao et al. (2022b) C. Bao, H. Zhang, X. Wu, S. Zhou, Q. Li, P. Yu, J. Li, W. Duan, and S. Zhou, Phys. Rev. B 105, L161106 (2022b).
- Zhang et al. (2021) H. Zhang, C. Bao, M. Schüler, S. Zhou, Q. Li, L. Luo, W. Yao, Z. Wang, T. P. Devereaux, and S. Zhou, Natl. Sci. Rev. 9, nwab175 (2021).
- Mun et al. (2012) E. Mun, H. Ko, G. J. Miller, G. D. Samolyuk, S. L. Bud’ko, and P. C. Canfield, Phys. Rev. B 85, 035135 (2012).
- Wu et al. (2016) Y. Wu, L.-L. Wang, E. Mun, D. D. Johnson, D. Mou, L. Huang, Y. Lee, S. L. Bud’ko, P. C. Canfield, and A. Kaminski, Nat. Phys. 12, 667 (2016).
- Qian et al. (2014) T. Qian, H. Miao, Z. Wang, X. Shi, Y. Huang, P. Zhang, N. Xu, L. Zeng, J. Ma, P. Richard, et al., New J. Phys. 16, 123038 (2014).
- Kim et al. (2015) K. Kim, S. Kim, K.-T. Ko, H. Lee, J.-H. Park, J. J. Yang, S.-W. Cheong, and B. I. Min, Phys. Rev. Lett. 114, 136401 (2015).
- (34) See the Supplemental Material for additional information about ARPES measurements, sample growth, electronic structure of CuTe using tunable laser-ARPES, temperature dependence of the shadow band intensity, time and energy resolution of the system and searching for CDW energy gap using laser ARPES. The Supplemental Material also contains Refs. [35–37].
- Zhong et al. (2022) H. Zhong, C. Bao, T. Lin, S. Zhou, and S. Zhou, Rev. Sci. Instrum. 93, 113910 (2022).
- Bao et al. (2022c) C. Bao, H. Zhong, S. Zhou, R. Feng, Y. Wang, and S. Zhou, Rev. Sci. Instrum. 93, 013902 (2022c).
- Fero et al. (2014) A. Fero, C. Smallwood, G. Affeldt, and A. Lanzara, J. Electron Spectros. and Relat. Phenomena 195, 237 (2014).
- Sugimoto et al. (2015) T. Sugimoto, D. Ootsuki, C. Morice, E. Artacho, S. S. Saxena, E. F. Schwier, M. Zheng, Y. Kojima, H. Iwasawa, K. Shimada, et al., Phys. Rev. B 92, 041113(R) (2015).
- Chen et al. (2015) P. Chen, Y.-H. Chan, X.-Y. Fang, Y. Zhang, M.-Y. Chou, S.-K. Mo, Z. Hussain, A.-V. Fedorov, and T.-C. Chiang, Nat. Commun. 6, 8943 (2015).
- Wang et al. (2019) Y. Wang, J. Ren, J. Li, Y. Wang, H. Peng, P. Yu, W. Duan, and S. Zhou, Phys. Rev. B 100, 241404(R) (2019).
- Hedayat et al. (2019) H. Hedayat, C. J. Sayers, D. Bugini, C. Dallera, D. Wolverson, T. Batten, S. Karbassi, S. Friedemann, G. Cerullo, J. van Wezel, et al., Phys. Rev. Res. 1, 023029 (2019).
- Sayers et al. (2020) C. J. Sayers, H. Hedayat, A. Ceraso, F. Museur, M. Cattelan, L. S. Hart, L. S. Farrar, S. Dal Conte, G. Cerullo, C. Dallera, et al., Phys. Rev. B 102, 161105(R) (2020).
- Obergfell and Demsar (2020) M. Obergfell and J. Demsar, Phys. Rev. Lett. 124, 037401 (2020).
- Kolomenskii et al. (2013) A. A. Kolomenskii, R. Mueller, J. Wood, J. Strohaber, and H. A. Schuessler, Appl. Opt. 52, 7352 (2013).
- Majchrzak et al. (2021) P. Majchrzak, S. Pakdel, D. Biswas, A. J. H. Jones, K. Volckaert, I. Marković, F. Andreatta, R. Sankar, C. Jozwiak, E. Rotenberg, et al., Phys. Rev. B 103, L241108 (2021).
- Bao et al. (2021c) C. Bao, L. Luo, H. Zhang, S. Zhou, Z. Ren, and S. Zhou, Rev. Sci. Instrum. 92, 033904 (2021c).
- Li et al. (2022) R. S. Li, L. Yue, Q. Wu, S. X. Xu, Q. M. Liu, Z. X. Wang, T. C. Hu, X. Y. Zhou, L. Y. Shi, S. J. Zhang, et al., Phys. Rev. B 105, 115102 (2022).
- Wang et al. (2012) Y. H. Wang, D. Hsieh, E. J. Sie, H. Steinberg, D. R. Gardner, Y. S. Lee, P. Jarillo-Herrero, and N. Gedik, Phys. Rev. Lett. 109, 127401 (2012).
- Bao et al. (2022c) C. Bao, Q. Li, S. Xu, S. Zhou, X.-Y. Zeng, H. Zhong, Q. Gao, L. Luo, D. Sun, T.-L. Xia, et al., Nano Lett. 22, 1138 (2022c).
- Elsayed-Ali et al. (1987) H. E. Elsayed-Ali, T. B. Norris, M. A. Pessot, and G. A. Mourou, Phys. Rev. Lett. 58, 1212 (1987).
- Kim et al. (2019) S. Kim, B. Kim, and K. Kim, Phys. Rev. B 100, 054112 (2019).
- Cudazzo and Wirtz (2021) P. Cudazzo and L. Wirtz, Phys. Rev. B 104, 125101 (2021).
- Campetella et al. (2023) M. Campetella, G. Marini, J. S. Zhou, and M. Calandra, Phys. Rev. B 108, 024304 (2023).
- Kuo et al. (2020) C. N. Kuo, R. Y. Huang, Y. K. Kuo, and C. S. Lue, Phys. Rev. B 102, 155137 (2020).
- Perfetti et al. (2006) L. Perfetti, P. A. Loukakos, M. Lisowski, U. Bovensiepen, H. Berger, S. Biermann, P. S. Cornaglia, A. Georges, and M. Wolf, Phys. Rev. Lett. 97, 067402 (2006).
- Bao et al. (2023) C. Bao, H. Zhong, F. Wang, T. Lin, H. Zhang, Z. Sun, W. Duan, and S. Zhou, Phys. Rev. B 107, L121103 (2023).