3D Building Reconstruction from Monocular Remote Sensing Images
with Multi-level Supervisions
Abstract
3D building reconstruction from monocular remote sensing images is an important and challenging research problem that has received increasing attention in recent years, owing to its low cost of data acquisition and availability for large-scale applications. However, existing methods rely on expensive 3D-annotated samples for fully-supervised training, restricting their application to large-scale cross-city scenarios. In this work, we propose MLS-BRN, a multi-level supervised building reconstruction network that can flexibly utilize training samples with different annotation levels to achieve better reconstruction results in an end-to-end manner. To alleviate the demand on full 3D supervision, we design two new modules, Pseudo Building Bbox Calculator and Roof-Offset guided Footprint Extractor, as well as new tasks and training strategies for different types of samples. Experimental results on several public and new datasets demonstrate that our proposed MLS-BRN achieves competitive performance using much fewer 3D-annotated samples, and significantly improves the footprint extraction and 3D reconstruction performance compared with current state-of-the-art. The code and datasets of this work will be released at https://github.com/opendatalab/MLS-BRN.git.
1 Introduction
3D building reconstruction is a fundamental task for large-scale city modeling and has received increasing attention in recent studies. Among these studies, monocular 3D building reconstruction has become a promising and economic solution for large-scale real-world applications, owing to its lower data acquisition cost and larger data coverage compared to multi-view stereo imagery and LiDAR data [38, 8]. Meanwhile, the limited information of monocular images as well as the diversity of building structures also result in great challenges for large-scale 3D building reconstruction.
Inspired by the progress of supervised monocular depth estimation methods, deep neural networks have been broadly applied to monocular 3D building reconstruction studies. Most studies utilize building footprints or other types of semantic labels as prior information to facilitate building height estimation from near-nadir images [19, 28, 36, 45, 29]. Off-nadir images, by contrast, constitute a larger proportion of the remote sensing images and provide additional useful information for building height estimation, which have demonstrated significant potential in several recent studies [4, 5, 41, 23, 39]. Some studies designed geocentric pose estimation task considering the parallax effect of building roof and footprint [4, 5], aiming at estimating the height values instead of reconstruct a 3D model. Other studies leveraged the relation between different components of a building instance (e.g. roof, footprint, and facade) as well as the offset between roof and footprint, which has proven to be an effective solution for 3D building reconstruction and accurate extraction of building footprints [23, 39].
In general, existing monocular building reconstruction methods are designed for fully-supervised learning, requiring a large number of fully-annotated 3D labels for network training. However, due to the expensive annotation cost, the available datasets for 3D building reconstruction are still very insufficient, restricting existing 3D reconstruction methods to single city or single dataset scenarios. By contrast, owing to the low annotation cost and the increase of open map data, public building footprints have an extremely large coverage and quantity. Additionally, existing building datasets provide different levels of annotations, such as footprint only, footprint and pixel-wise height [4], footprint and offset vector [23, 39], etc. The large-scale 2D footprints and different levels of annotated datasets can provide new opportunities for enlarging 3D building reconstruction application scenarios and reducing the annotation cost if they are effectively utilized.
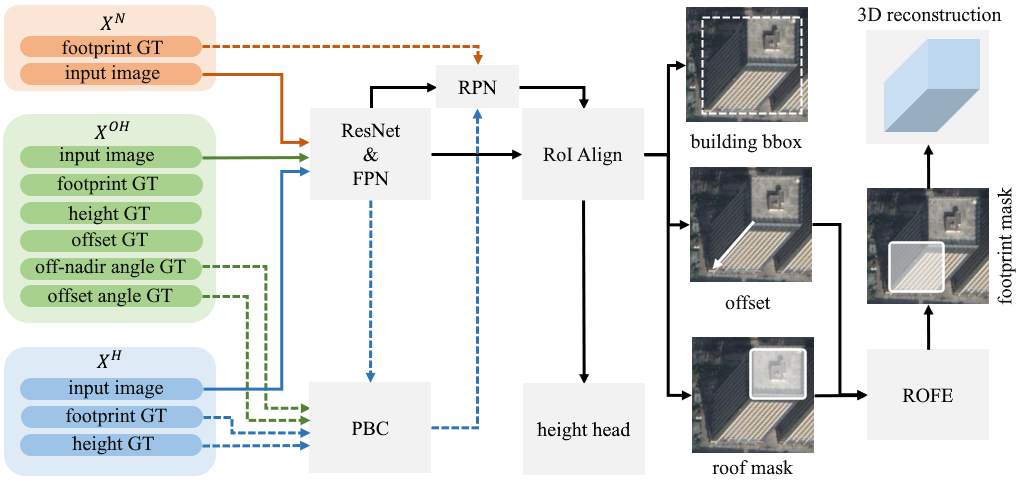
In this work, we propose MLS-BRN, a Multi-Level Supervised Building Reconstruction Network based on monocular remote sensing images, which is a unified and flexible framework that is capable of utilizing the training samples with different annotation levels. To alleviate the demand on 3D annotations and enhance the building reconstruction performance, we design new tasks regarding the meta information of off-nadir images and two new modules, i.e., Pseudo Building Bbox Calculator and Roof-Offset guided Footprint Extractor, as well as a new training strategy based on different types of samples. Experimental results on several public and new datasets demonstrate that our method achieves competitive performance when only using a small proportion of 3D-annotated samples, and significantly improves the building segmentation and height estimation performance compared with current state-of-the-art. Our main contributions are summarized as follows:
-
•
We design MLS-BRN, a multi-level supervised building reconstruction network, which consists of new tasks and modules to enhance the relation between different components of a building instance and alleviate the demand on 3D annotations.
-
•
We propose a multi-level training strategy that enables the training of MLS-BRN with different supervision levels to further improve the 3D reconstruction performance.
-
•
We extend the monocular building reconstruction datasets to more cities. Comprehensive experiments under different settings demonstrate the potential of MLS-BRN in large-scale cross-city scenarios.
2 Related work
2.1 Building footprint extraction
Building footprint extraction is an important prerequisite for monocular 3D building reconstruction. Various instance and semantic segmentation networks have been broadly applied to building extraction tasks. Many studies utilize multi-task segmentation network to improve the building segmentation performance. For instance, Yuan [43] proposed the signed distance representation for building footprint extraction, achieving better performance compared with the single-task fully-connected network. Similarly, in [28], a modified signed distance function was introduced and jointly learned with other tasks for predicting building footprint outlines and heights. To improve the geometry shapes of building extraction results, several methods directly predicted the vertices of a building polygon based on Recurrent Neural Network or Graph Neural Network [26, 44, 47], or combined the pixel-based multi-task segmentation network with a graph-based polygon refinement network using a rule-based module [24]. In addition, some recent studies converted building footprint extraction into roof segmentation and roof-to-footprint offset estimation tasks, which achieved promising performance for building footprint extraction, especially for high-rise buildings in off-nadir images [23, 39].
In summary, most existing methods directly extract the building footprints and perform worse for high-rise buildings in off-nadir images. Offset-based methods can effectively alleviate this problem, but the expensive offset annotation efforts and the post-processing process are still inevitable. On the contrary, our work proposes a multi-level supervised solution that is capable of leveraging different types of samples to reduce the demand for offset annotation, achieving promising footprint extraction results in an end-to-end manner.
2.2 Monocular 3D building reconstruction
Inspired by the progress of monocular depth estimation, deep neural networks have been widely used for monocular building height estimation in recent studies [10, 41, 22]. Most of these studies are designed for height estimation from near-nadir images, in which the building roof and footprint are almost overlapped. Some methods used an encoder-decoder network to regress the height values [29], or used a generative adversarial network to simulate a height map [11]. Moreover, the semantic labels have been utilized as effective priors in many existing methods considering the limited information provided from the near-nadir images for height estimation. Some studies designed a multi-task network for joint footprint extraction and height estimation [36, 45, 10], while others exploit the semantic labels as prior information for height estimation [19]. In actual scenarios, off-nadir images constitute a large proportion of the remote sensing images, in which the parallax effect of roof and footprint results in more challenges for extracting footprints but provides additional information for height estimation as well. Some recent studies [4, 5] design methods to learn the geocentric pose of buildings in off-nadir images for monocular height estimation [34], while others leverage the offset between building roof and footprint and the relation between different components to reconstruct a 3D building model [23, 39].
In summary, the monocular building reconstruction methods in existing studies require expensive and fully-annotated 3D labels for supervised learning. Our proposed method, by contrast, is a unified and flexible framework for 3D building reconstruction with different supervision levels, which effectively reduces the demand for the large-scale 3D annotations.
2.3 Monocular 3D reconstruction with fewer labels
In monocular 3D reconstruction in the general computer vision domain, several methods have been proposed for reducing the 3D annotation demand via weakly-supervised or semi-supervised learning [3, 31, 13, 20, 17]. In Yang et al. [42], a unified framework combining two types of supervisions was proposed, i.e., a small number of camera pose annotations and a large number of unlabeled images. In Neverova et al. [33], an intermediate representation containing important topological and structural information of hand was introduced to enable the weakly-supervised training for hand pose estimation. Concurrently, Gwak et al. [12] effectually leveraged a weak supervision type, i.e., foreground mask, as a substitute for costly 3D CAD annotations, which incorporates a raytrace pooling layer to enable perspective projection and backpropagation.
In contrast to the aforementioned studies, our proposed method leverages prior knowledge about the 3D structure of a building instance and the monocular remote sensing image, including the relation between roof, footprint, height, offset angle, and off-nadir angle, enabling multi-level supervised 3D reconstruction with fewer annotation efforts.
3 Methods
3.1 Problem statement
Given an off-nadir remote sensing image that includes buildings , the objective of monocular 3D building reconstruction is to identify all the footprints and roofs corresponding to . The difficulty is that the footprints of buildings may be partially visible from an off-nadir viewing angle. Thus, previous studies, including [23] and [39], typically solve this issue by training a deep neural network with samples annotated with both and roof-to-footprint offsets .
However, the cost of annotating remote sensing images is still high, particularly for offset annotations. Therefore, we suggest addressing this issue by training a deep model that effectively uses samples containing both and annotations, alongside samples only annotated with .
To facilitate training with offset-unknown samples, two tasks are included; one for predicting the off-nadir angle and the other for the offset angle . Additionally, an instance-wise footprint segmentation task is included to predict the footprint conditioned on the predicted roof and offset. Finally, a task for predicting real-world height is introduced to enhance the comprehension of the correlation between footprint and roof placement. In summary, four additional tasks are added to the original three tasks in LOFT-FOA [39]: (1) off-nadir angle prediction task; (2) offset angle prediction task; (3) footprint segmentation task; (4) real-world height prediction task.
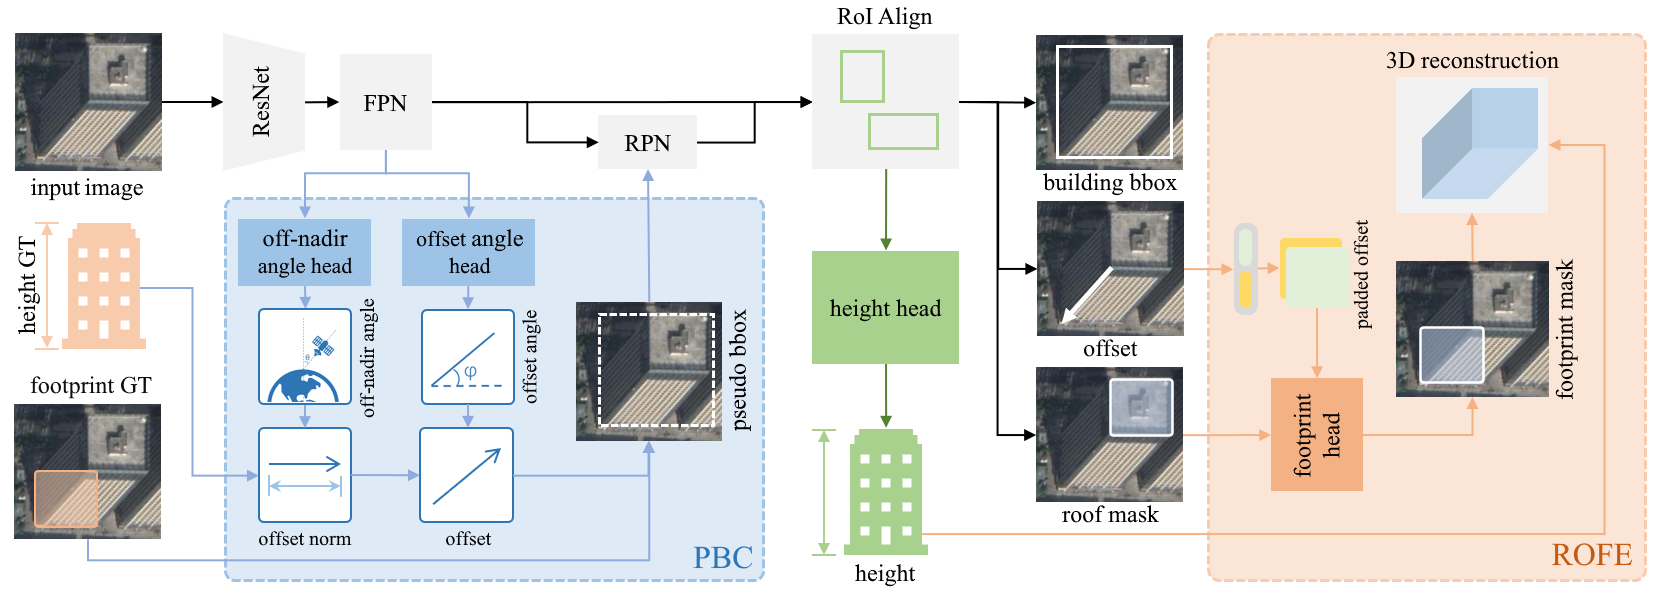
3.2 Network structure
Fig. 2 illustrates the proposed architecture of our MLS-BRN. To facilitate multi-level supervised learning, two novel modules are introduced, namely the Pseudo Building Bbox Calculator (PBC) and the Roof-Offset guided Footprint Extractor (ROFE). The PBC module provides pseudo building boxes to determine the positivity/negativity of the region proposals from the RPN module when offset-unknown (i.e. building bbox-unknown) samples are processed in the MLS-BRN. The ROFE module has two significant functions. Firstly, it provides a more straightforward method to supervise the building footprint segmentation task. Secondly, it offers an indirect method of supervising offset prediction and roof segmentation for offset-unknown samples as they pass through the MLS-BRN. Additionally, a building height prediction task has been included in order to predict the real-world building height.
3.2.1 Pseudo Building Bbox Calculator (PBC)
Samples without the ground truth for building bounding box cannot be utilized by previous models, like LOFT-FOA [39]. To address this issue, we propose a module that predicts pseudo building bounding boxes to substitute -. For a provided off-nadir remote sensing image and one building contained by , we can describe the connection between the image-wise off-nadir angle , the offset angle , the factor for scaling real-world height to pixel scale , and the building’s height and offset using the following equation:
| (1) | ||||
where is the norm of the offset, is the unit normal vector of . The PBC module uses an off-nadir angle head to predict an image-wise off-nadir angle and an offset angle head to predict an image-wise offset angle . Then, following LABEL:eq:v, they are combined with the instance-wise building height ground truth , and scale factor to compute the pseudo offset . Finally, is translated to get the pseudo building bbox guided by . - will play the role of - during the training of the building bbox-unknown samples. From the perspective of weak supervision, the PBC module extracts the image-wise angle information, i.e. the offset angle and the off-nadir angle, and uses it to supervise the instance-wise task. Note that for building height-unknown samples, the pseudo bounding boxes are calculated by directly enlarge the footprint boxes.
3.2.2 Roof-Offset guided Footprint Extractor (ROFE)
Previous works calculate the footprint mask in the inference stage by translating the inferred roof guided by the inferred offset. The ROFE module, however, predicts the footprint mask directly. It trains a convolutional network to learn the translation process, using the inferred roof mask and offset as inputs. For offset-aware (i.e. roof-aware) samples, this end-to-end training process adds more supervision on the offset head and the roof head. And for offset-unknown samples, which cannot contribute to the training of the offset head and the roof head due to lack of ground truth, ROFE provides an indirect way to supervise these two heads.
3.3 Network training
In this section, we first introduce the loss functions in our MLS-BRN. Then we introduce our three levels of training samples graded by their level of supervision and their training strategies. The total hybrid loss is presented at the end of this section.
3.3.1 Loss definition
The LOFT-FOA [39] is trained by minimising Eq. 2, where , , are the same as those in Mask R-CNN [15], i.e., the losses for the RPN, R-CNN, and mask head, respectively; is the loss for the offset head, which is a standard smooth L1 Loss.
| (2) |
The MLS-BRN model keeps the four losses the same as LOFT-FOA [39] and introduces new losses to train the newly added modules. The footprint mask loss of the ROFE module is the same as , which is a standard cross entropy loss (Eq. 3).
| (3) |
The loss of the offset angle head of the PBC module is calculated according to Eq. 4, in which denotes the offset angle loss; denotes the predicted unit normal vector of the offset.
| (4) | ||||
The nadir angle head of the PBC module is trained following Eq. 5, where is the off-nadir angle loss; is the predicted tangent of the off-nadir angle.
| (5) |
The height head loss of our MLS-BRN is calculated by Eq. 6, in which denotes the height loss; denotes the predicted building height.
| (6) |
3.3.2 Multi-level training strategy
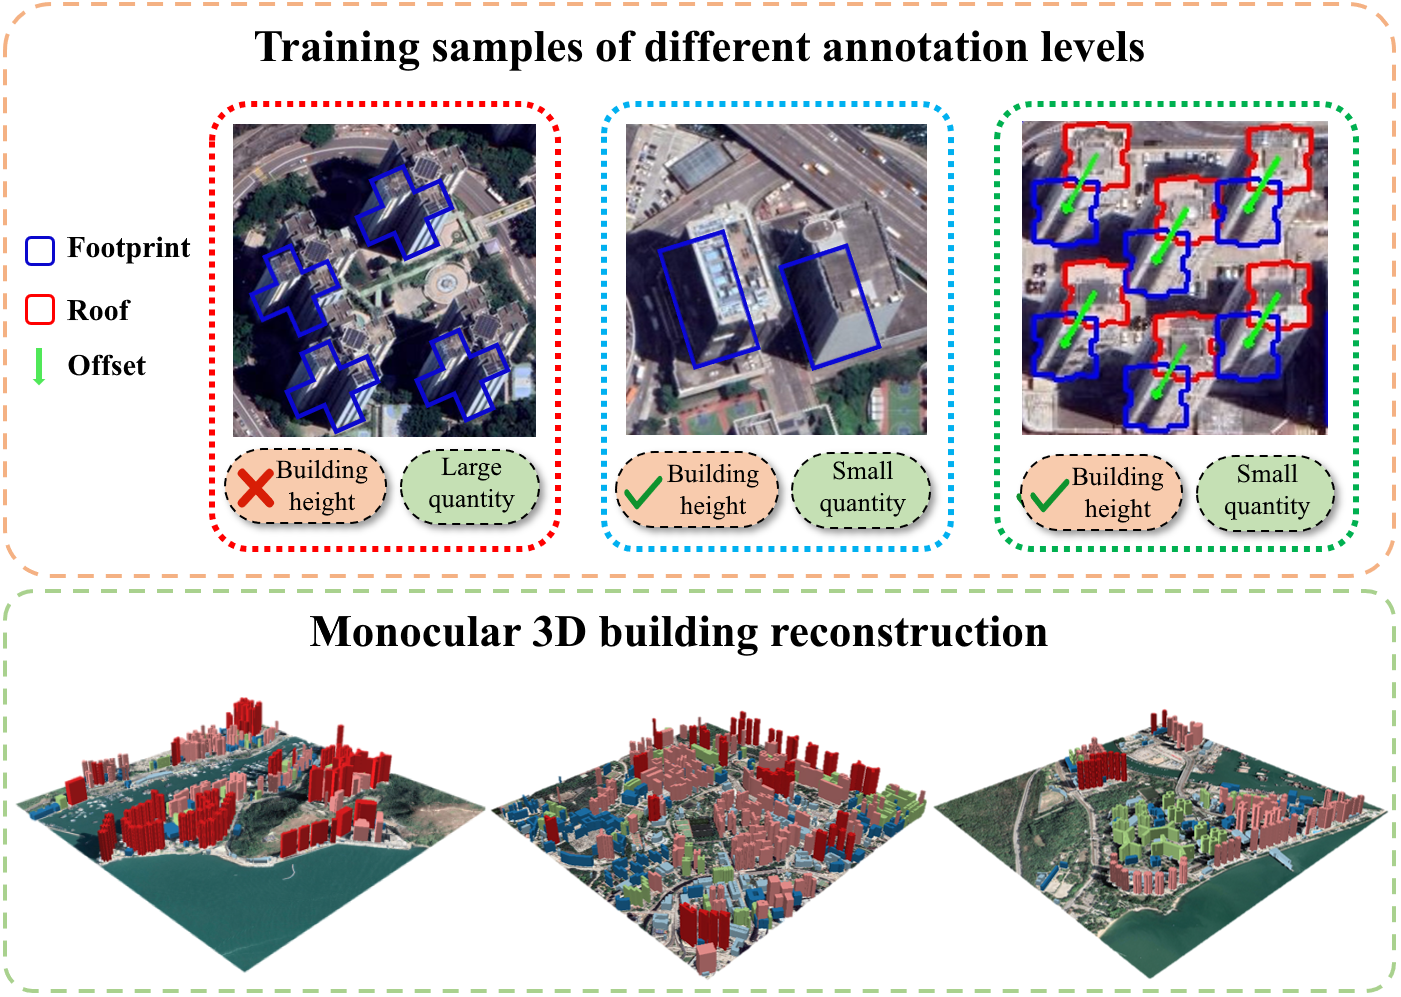
In our proposed unified framework, all the training samples can be graded into three levels according to their level of supervision (Fig. 1):
-
•
Level 1 samples: samples with only instance-wise footprint annotation, which are denoted by . means no additional supervision.
-
•
Level 2 samples: samples with instance-wise footprint and building height annotation, which are denoted by .
-
•
Level 3 samples: samples with instance-wise footprint, offset, and building height annotation, which are denoted by .
Different levels of samples are supervised by different training strategies. As defined in Eq. 7, the loss function for is only based on .
| (7) |
The loss function for is defined in Eq. 8. In , the is activated since the PBC module can predict a high-quality pseudo building bbox, which is good enough to supervise the RPN module.
| (8) | ||||
The loss function for is defined in Eq. 9. Compared with the original , adds four more losses: , , , . The and are used for training the two angle heads of the PBC module.
| (9) | ||||
The final hybrid loss is defined as the total loss of the three levels of training samples according to Eq. 10.
| (10) |
3.4 Implementation details
As mentioned in Fig. 2, we use ResNet-50 [14] with FPN [27] pre-trained on the ImageNet as the backbone. All the models are trained with a batch size of 4 using NVIDIA 3090 GPUs. To align with LOFT-FOA [39], we train 24 epochs for all the models, with the learning rate starting from 0.01 and decaying by a factor of 0.1 at the and epochs. The SGD algorithm with a weight decay of 0.0001 and a momentum of 0.9 is used for all experiments. LOFT-FOA [39] is used as the basic architecture of the MLS-BRN model, and all the hyperparameters that occur in both LOFT-FOA [39] and MLS-BRN are the same, except for the learning rate mentioned above. All models are built in PyTorch.
In Eq. 4, we set to balance the two loss items. In Eq. 8, we set to keep the loss weight of ROFE the same as the roof mask head, and set since the absolute building height loss value is relatively small. In Eq. 9, we set to keep them the same as LOFT-FOA [39], and set to balance the effects of the magnitude of these two losses.
4 Experiments
4.1 Datasets
In our experiments, we employ multi-supervised datasets for training our methods: (1) BONAI [39] provides building footprint segmentation, offset, and height annotations, which contains 3,000 and 300 images for train-val and test respectively; (2) OmniCity-view3 [25] originally provides satellite images with annotations for footprint segmentation and building height. We add additional offset annotations for 17,092 and 4,929 images from train-val and test sets respectively; (3) Additionally, we release a new dataset named HK, which includes 500 and 119 satellite images specifically captured from Hong Kong for train-val and test sets, along with annotations for footprint segmentation, offset and height.
As detailed in Sec. 3, all our training samples are graded into three levels: samples from , , and . To create different levels of training samples, we extract samples from the datasets mentioned above, reorganizing their annotations as necessary. We randomly choose 30% of the samples from the BONAI dataset [39] as a smaller dataset, which we call . We randomly drop the offset annotations of 70% of the samples in the BONAI dataset [39], regard the entire BONAI [39] dataset as a + dataset, and name it . Similarly, the original BONAI dataset [39] is regarded as a large and is named . We use to designate the OmniCity-view3 dataset [25]. Naturally, the abbreviations , , and have the similar meaning with , , and respectively. Moreover, we use to refer to the combination of BONAI [39] and HK. It is important to note that in , 30% of BONAI’s [39] samples are type while the remaining 70% are type. Additionally, 30% of HK’s samples belong to type and the remaining 70% belong to type.
4.2 Performance comparison
In this section, we evaluate our method’s performance in footprint segmentation, offset prediction, and height prediction against several competitive methods for the single-level supervised learning scenario. In a Multi-level supervised learning scenario, we mainly compare our method with LOFT-FOA [39]. Additionally, we present our method’s offset and off-nadir angles prediction performance. More results will be provided in the supplementary materials.
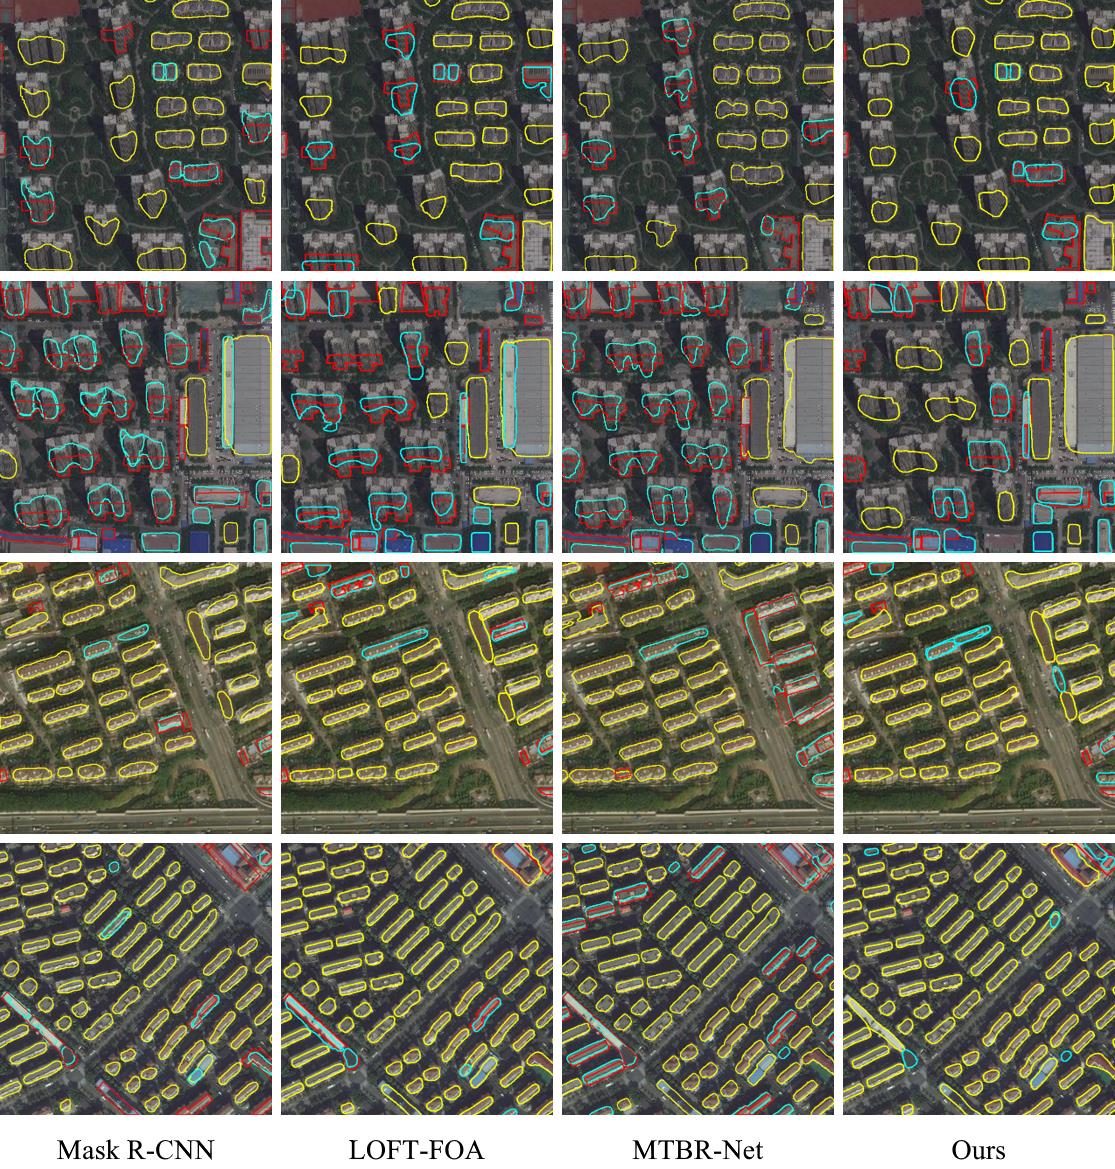
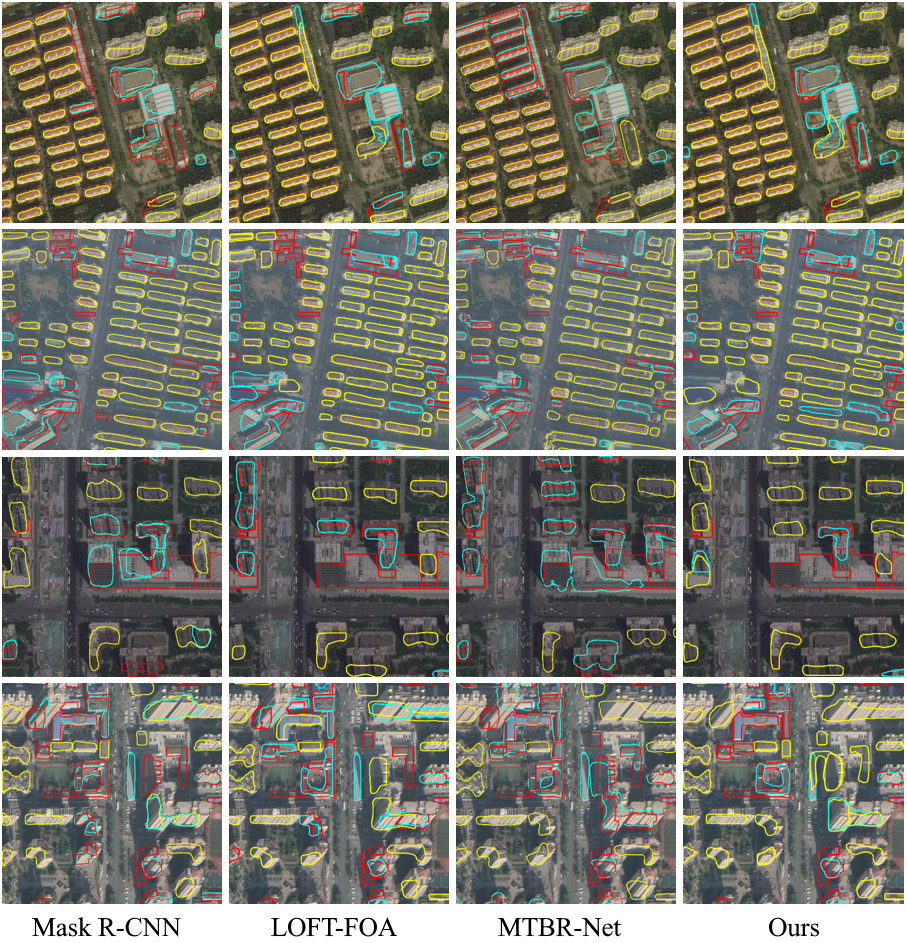
Single-level supervised learning. The performance of footprint segmentation and offset prediction for different methods trained on and are listed in Tab. 1 and Tab. 2, respectively. Additionally, Fig. 3 provides a qualitative comparison of footprint segmentation results on the BONAI [39] test set. Note that all the experimental results in this section are obtained using samples, and the results obtained using and samples will be analysed in the following paragraph. For the footprint segmentation task, experimental results tested on demonstrate that our method improves the F1-score by 5.42% - 8.30% compared with the instance segmentation methods that directly extract the building footprints. Furthermore, our method enhances the F1-score by 2.05% - 2.76% relative to MTBR-Net [23] and LOFT-FOA [39], which are specifically designed for extracting off-nadir building footprints based on predicted roof and offset, tested on . Regarding the offset prediction task, our experimental findings indicate that our approach betters the EPE by 0.18 - 0.93 in comparison to MTBR-Net [23] and LOFT-FOA [39] tested on . The results show that the direct supervision of the footprint segmentation, the constraint on the building height, and the encouragement of the angular feature extraction can help to achieve better performance in the footprint segmentation and offset prediction tasks in the single-level supervised learning scenario.
| method | F1 | Precision | Recall | EPE |
|---|---|---|---|---|
| PANet [21] | 58.06 | 59.26 | 56.91 | - |
| HRNetv2 [37] | 60.81 | 61.20 | 60.42 | - |
| M R-CNN [15] | 58.12 | 59.26 | 57.03 | - |
| CM R-CNN [1] | 60.94 | 67.09 | 55.83 | - |
| MTBR-Net [23] | 63.60 | 64.34 | 62.87 | 5.69 |
| LOFT-FOA [39] | 64.31 | 63.37 | 65.29 | 4.94 |
| Ours | 66.36 | 65.90 | 66.83 | 4.76 |
| method | F1 | Precision | Recall | EPE |
|---|---|---|---|---|
| M R-CNN [15] | 69.75 | 69.74 | 69.76 | - |
| LOFT-FOA [39] | 70.46 | 68.77 | 72.23 | 6.08 |
| Ours | 72.25 | 69.57 | 75.14 | 5.38 |
| method | dataset | sample | F1-score | EPE |
|---|---|---|---|---|
| LOFT-FOA [39] | 61.35 | 5.70 | ||
| Ours | + | 65.49 | 5.39 | |
| LOFT-FOA [39] | 64.31 | 4.94 | ||
| Ours | 66.36 | 4.76 | ||
| LOFT-FOA [39] | 67.09 | 6.08 | ||
| Ours | + | 70.53 | 5.92 | |
| LOFT-FOA [39] | 70.46 | 5.38 | ||
| Ours | 72.25 | 5.38 | ||
| LOFT-FOA [39] | 54.96 | 5.78 | ||
| Ours | ++ | 58.57 | 5.60 | |
| LOFT-FOA [39] | 60.85 | 4.74 | ||
| Ours | 60.92 | 4.69 |
Multi-level supervised learning. Tab. 3 displays the footprint segmentation and offset prediction performance of LOFT-FOA [39] and our method when trained and tested on multi-level supervision datasets. Our approach’s experiment outcomes, trained on , and , demonstrate a 4.14%, 3.44% and 3.61% improvement in F1-score compared to LOFT-FOA [39] trained on , and . Additionally, our method’s experimental results, trained on samples from , and exhibit similar performance to LOFT-FOA [39], which is trained on samples from , and . These findings demonstrate the effectiveness of MLS-BRN in combining samples from , and levels to address the building reconstruction task.
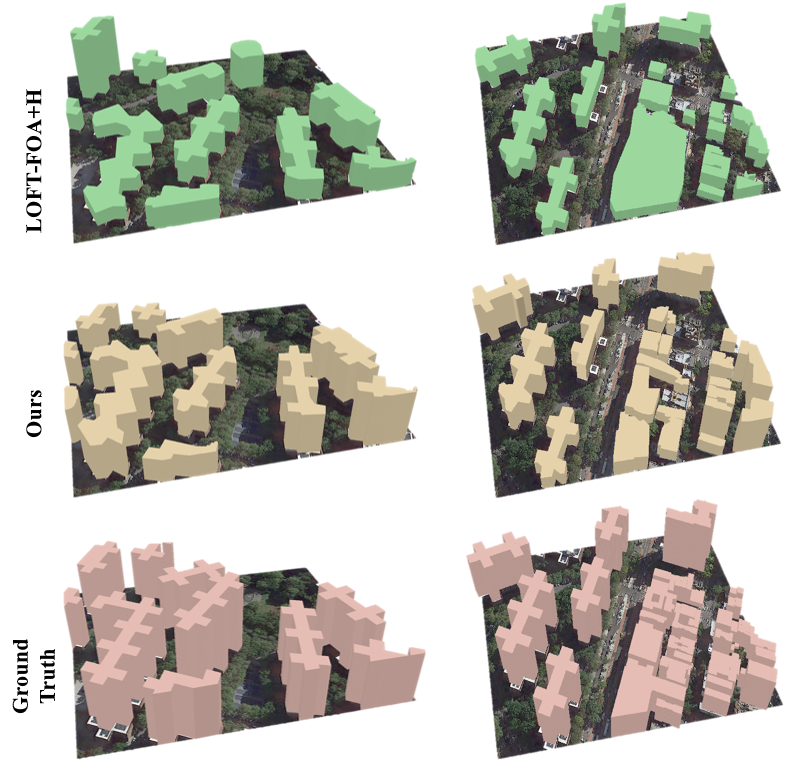
Building height and angles prediction. Tab. 4 displays the results of building height prediction performance. The experimental findings indicate that our method enhances the height MAE by 0.22 - 4.33 and the height RMSE by 0.51 - 7.60 in comparison to SARPN [2], DORN [9], and LOFT-FOA+H. It’s worth noting that SARPN [2], DORN [9] predicts pixel-wise building height, and MSL-BRN predicts instance-wise building height. As far as we know, MSL-BRN is the first-ever method to predict instance-wise real-world building height. Thus, we add a building height head directly to LOFT-FOA [39] (i.e. LOFT-FOA+H) and compare its prediction results with our own method. Fig. 4 presents the qualitative building height prediction results from our method and LOFT-FOA+H. Regarding the angle prediction tasks, when trained on , the PBC module results in an MAE of 9.92 for offset angle prediction and an MAE of 1.22 for off-nadir angle prediction. The performance increase demonstrates the efficacy of the PBC, ROFE, and the building height prediction module in a single-level supervised learning scenario.
| method | height MAE | height RMSE |
|---|---|---|
| SARPN [2] | 15.23 | 28.69 |
| DORN [9] | 13.40 | 27.03 |
| LOFT-FOA+H | 11.12 | 21.60 |
| Ours | 10.90 | 21.09 |
| method | F1-score | Precision | Recall | EPE |
|---|---|---|---|---|
| baseline | 61.35 | 61.84 | 61.65 | 5.70 |
| +PBC | 62.32 | 62.28 | 62.35 | 5.53 |
| +ROFE | 62.87 | 63.89 | 62.15 | 5.63 |
| +PBC+ROFE | 65.40 | 66.74 | 64.12 | 5.49 |
4.3 Ablation study
In this section, we examine the impact of the principal new components of our method: (1) the PBC module; (2) the ROFE module; and (3) the building height head. Additionally, we will analyze the outcome of the data ablation experiment in the multi-level supervised learning setting.
Module ablation. The outcomes acquired by implementing the aforementioned modules successively on are detailed in Tab. 5. The table provides information on F1-score for footprint segmentation and EPE for offset prediction. LOFT-FOA [39] is trained on and serves as the baseline. The second row (+PBC) illustrates the results obtained by applying the PBC module to LOFT-FOA [39]. The results indicate that incorporating the two-angle prediction tasks enhances the F1-score of the footprint extraction by 0.97%. It should be noted that the added offset-unknown 70% samples in , which lacks angle ground truth, does not contribute to PBC’s training. The third row (+ROFE) displays the outcomes achieved by applying the ROFE module to LOFT-FOA [39]. Results demonstrate that, compared with the baseline, prediction of the footprint segmentation guided by predicted offset and roof, coupled with additional 70% offset-unknown samples from , leads to a 1.52% improvement in the F1-score. The fourth row (+PBC+ROFE) indicates that the simultaneous inclusion of the PBC and ROFE modules can improve the F1-score of the footprint extraction by 4.05%. The aforementioned results show that PBC and ROFE modules can help to enhance the accuracy of footprint segmentation and offset prediction.
Data ablation. The outcomes of our approach trained on various dataset combinations concerning F1-score for footprint segmentation, and EPE for offset prediction are shown in Tab. 6. The first line () displays the results of training LOFT-FOA [39] on 30% of OmniCity-view3 [25] samples (). The second row (+) shows the results of our method trained on a mix of 30% of OmniCity-view3 [25] samples () and 30% of the OmniCity-view3 samples. The results demonstrate a 3.28% improvement in F1-score for footprint extraction compared to LOFT-FOA [39] trained solely on . The third row (++) presents the outcomes of our methodology, trained on a mix of 30% of OmniCity-view3 [25] samples, 30% of OmniCity-view3 [25] samples, and the rest 40% of OmniCity-view3 [25] samples. The results demonstrate a 0.44% increase in F1-score compared to our method trained on +, indicating the effectiveness of including samples. The reason for training LOFT-FOA [39] instead of our method on (first row) is to evaluate the gain in a scenario where and samples are available by using our method.
| data | F1 | Precision | Recall | EPE |
|---|---|---|---|---|
| 67.09 | 63.23 | 71.47 | 6.08 | |
| + | 70.37 | 65.35 | 76.24 | 5.99 |
| ++ | 70.81 | 66.15 | 76.18 | 5.84 |
4.4 3D reconstruction results of different cities
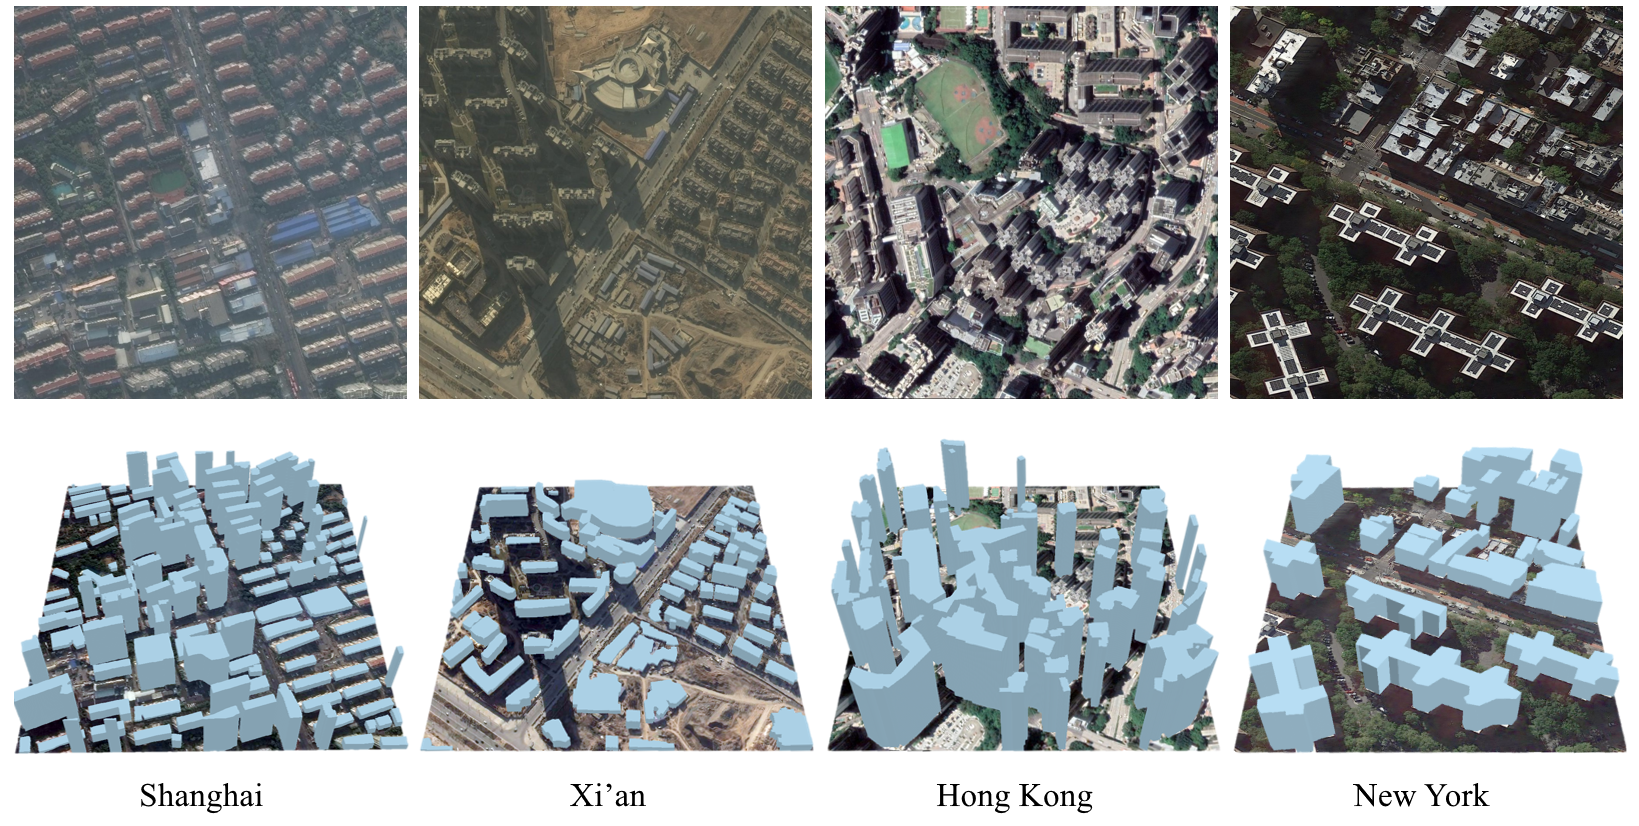
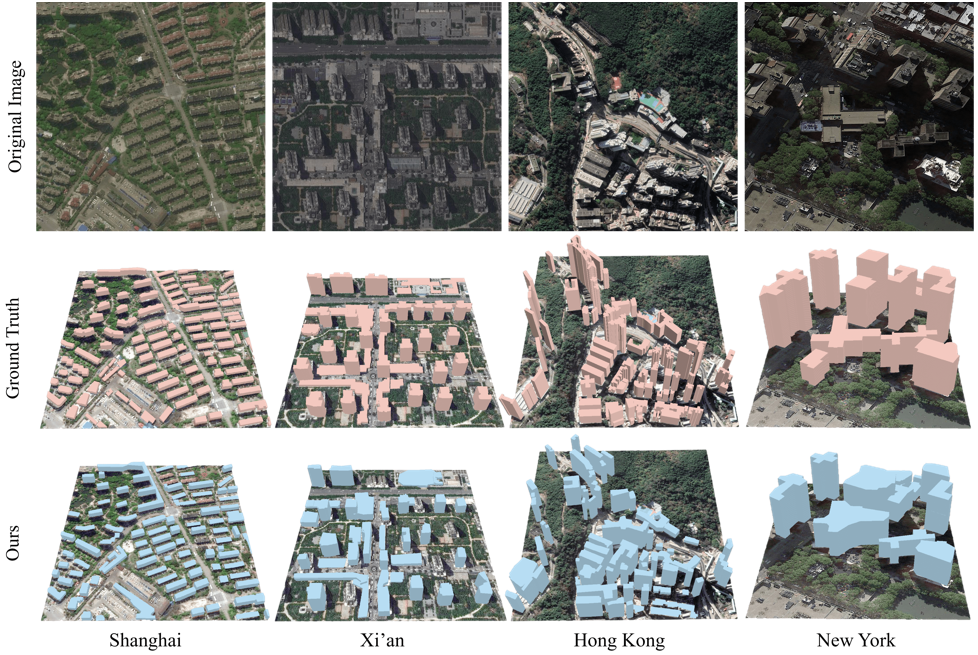
Fig. 5 shows the 3D reconstruction results of four cities (i.e. Shanghai, Xi’an, Hong Kong, and New York) obtained from our method. The results demonstrate the effectiveness of our method on 3D building reconstruction across different cities. Note that we use the method in [46] to regularize the predicted building footprint masks.
5 Conclusion
In this paper, we have presented a new method for multi-level supervised building reconstruction from monocular remote sensing images, which is capable of reconstructing the accurate 3D building models using samples of different annotation levels. Qualitative and quantitative evaluations confirm that our method achieves competitive performance and significantly enhances the 3D building reconstruction capability in comparison to the current state-of-the-art across diverse experimental settings. The effect of the Pseudo Building Bbox Calculator and the Roof-Offset guided Footprint Extractor, as well as the annotation levels of the samples were also analyzed in the ablation study. Furthermore, we expanded the monocular building reconstruction datasets to encompass additional cities. We believe that our approach offers efficient and cost-effective solutions for 3D building reconstruction in complex real-world scenes. In our future work, we would like to investigate more effective strategies to improve the 3D building reconstruction performance whilst exploring more adaptable and practical techniques for large-scale city modeling.
Acknowledgements. This project was funded in part by National Natural Science Foundation of China (Grant No. 42201358 and No. 62325111) and Shanghai Artificial Intelligence Laboratory.
Supplementary Material
In this supplementary material, we first provide additional details of our proposed MLS-BRN model (Appendix A). Then we provide additional details of our newly released datasets, as well as the sample diversity used in our study (Appendix B). Last, we provide additional experimental results of building footprint segmentation, offset angle prediction, and 3D building reconstruction (Appendix C).
Appendix A Additional details of methods
A.1 Additional training details
In our proposed model, different levels of samples are supervised with different training strategies. Consequently, the ground truth of different levels of samples is utilized differently (Fig. 6). The PBC module employs the building footprint and height ground truth of to compute the pseudo building bboxes, while the building footprint and height ground truth of are not used by PBC since their building bbox ground truth is already known. However, PBC uses the off-nadir angle and offset angle ground truth of for supervising the training of the two angle heads. Furthermore, PBC cannot calculate the pseudo building bboxes for since they have no building height ground truth. Instead, the pseudo building bboxes of are calculated by enlarging the building footprint ground truth by a certain percentage.
A.2 Additional implementation details
In our proposed model, the feature map sent to PBC for calculating the pseudo building bbox is the largest layer from FPN (i.e. the layer with the size of 256 256). The off-nadir angle head of PBC is composed of 4 Conv layers and 3 FC layers, while the off-nadir angle head of PBC is composed of 8 Conv layers and 6 FC layers.
A.3 Additional details of 3D model reconstruction
We apply the method outlined in [46] to regularize the predicted building footprint mask obtained from our MLS-BRN. Subsequently, we use the Douglas–Peucker algorithm [7] to simplify the regularized polygons by reducing extraneous vertices. Furthermore, the raster polygons are converted to vector data format for visualization. Lastly, the vectorized polygons are combined with the predicted building height to complete the 3D building reconstruction.
Appendix B Additional details of datasets
B.1 Details of existing building datasets
Tab. 7 lists some popular building footprint extraction and 3D reconstruction datasets (with offset or height annotations). The public building footprint extraction datasets far exceed the 3D reconstruction datasets in terms of both the number of images and the number of building instances. Our MLS-BRN demonstrates the great potential of leveraging large-scale footprint segmentation datasets to improve 3D building reconstruction performance and reduce the need for 3D annotations.
| Dataset | #Images | #Instances | Off-Nadir | Foot. | Offset | Height |
|---|---|---|---|---|---|---|
| Microsoft [30] | - | 1,240M | ✓ | |||
| Open Bld. [35] | - | 1,800M | ✓ | |||
| CrowdAI [32] | 340K | 2,915K | ✓ | |||
| WHU [18] | 8.2K | 120K | ✓ | |||
| SpaceNet [6] | 24.6K | 303K | ✓ | |||
| MVOI [40] | 60K | 127K | ✓ | ✓ | ||
| OmniCity [25] | 75K | 2,573K | ✓ | ✓ | ✓ | |
| DFC19 [4] | 3.2K | 500K | ✓ | ✓ | ✓ | ✓ |
| ATL-SN4 [4] | 8K | 1,100K | ✓ | ✓ | ✓ | ✓ |
| BONAI [39] | 3.3K | 269K | ✓ | ✓ | ✓ | ✓ |
| ISPRS 3D [16] | 0.033K | - | ✓ | ✓ | ✓ | ✓ |
B.2 Details of samples of each city
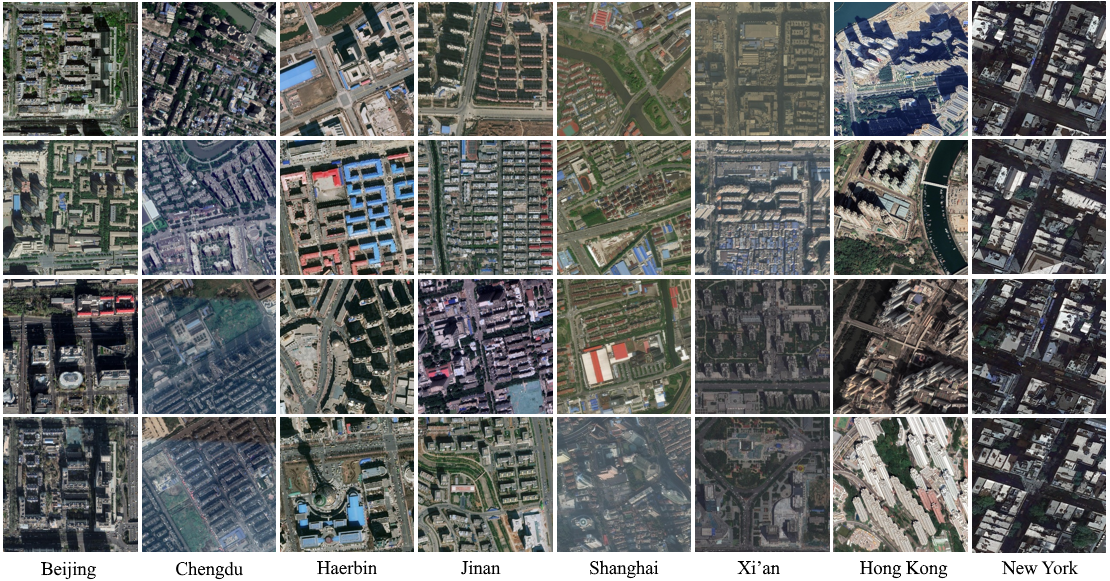
In Fig. 7, we provide some examples of the remote sensing image samples used in our datasets, which demonstrate a high diversity of each city in terms of the off-nadir angle, offset angle, as well as the building density, areas, height, etc.
B.3 Additional details of newly released dataset
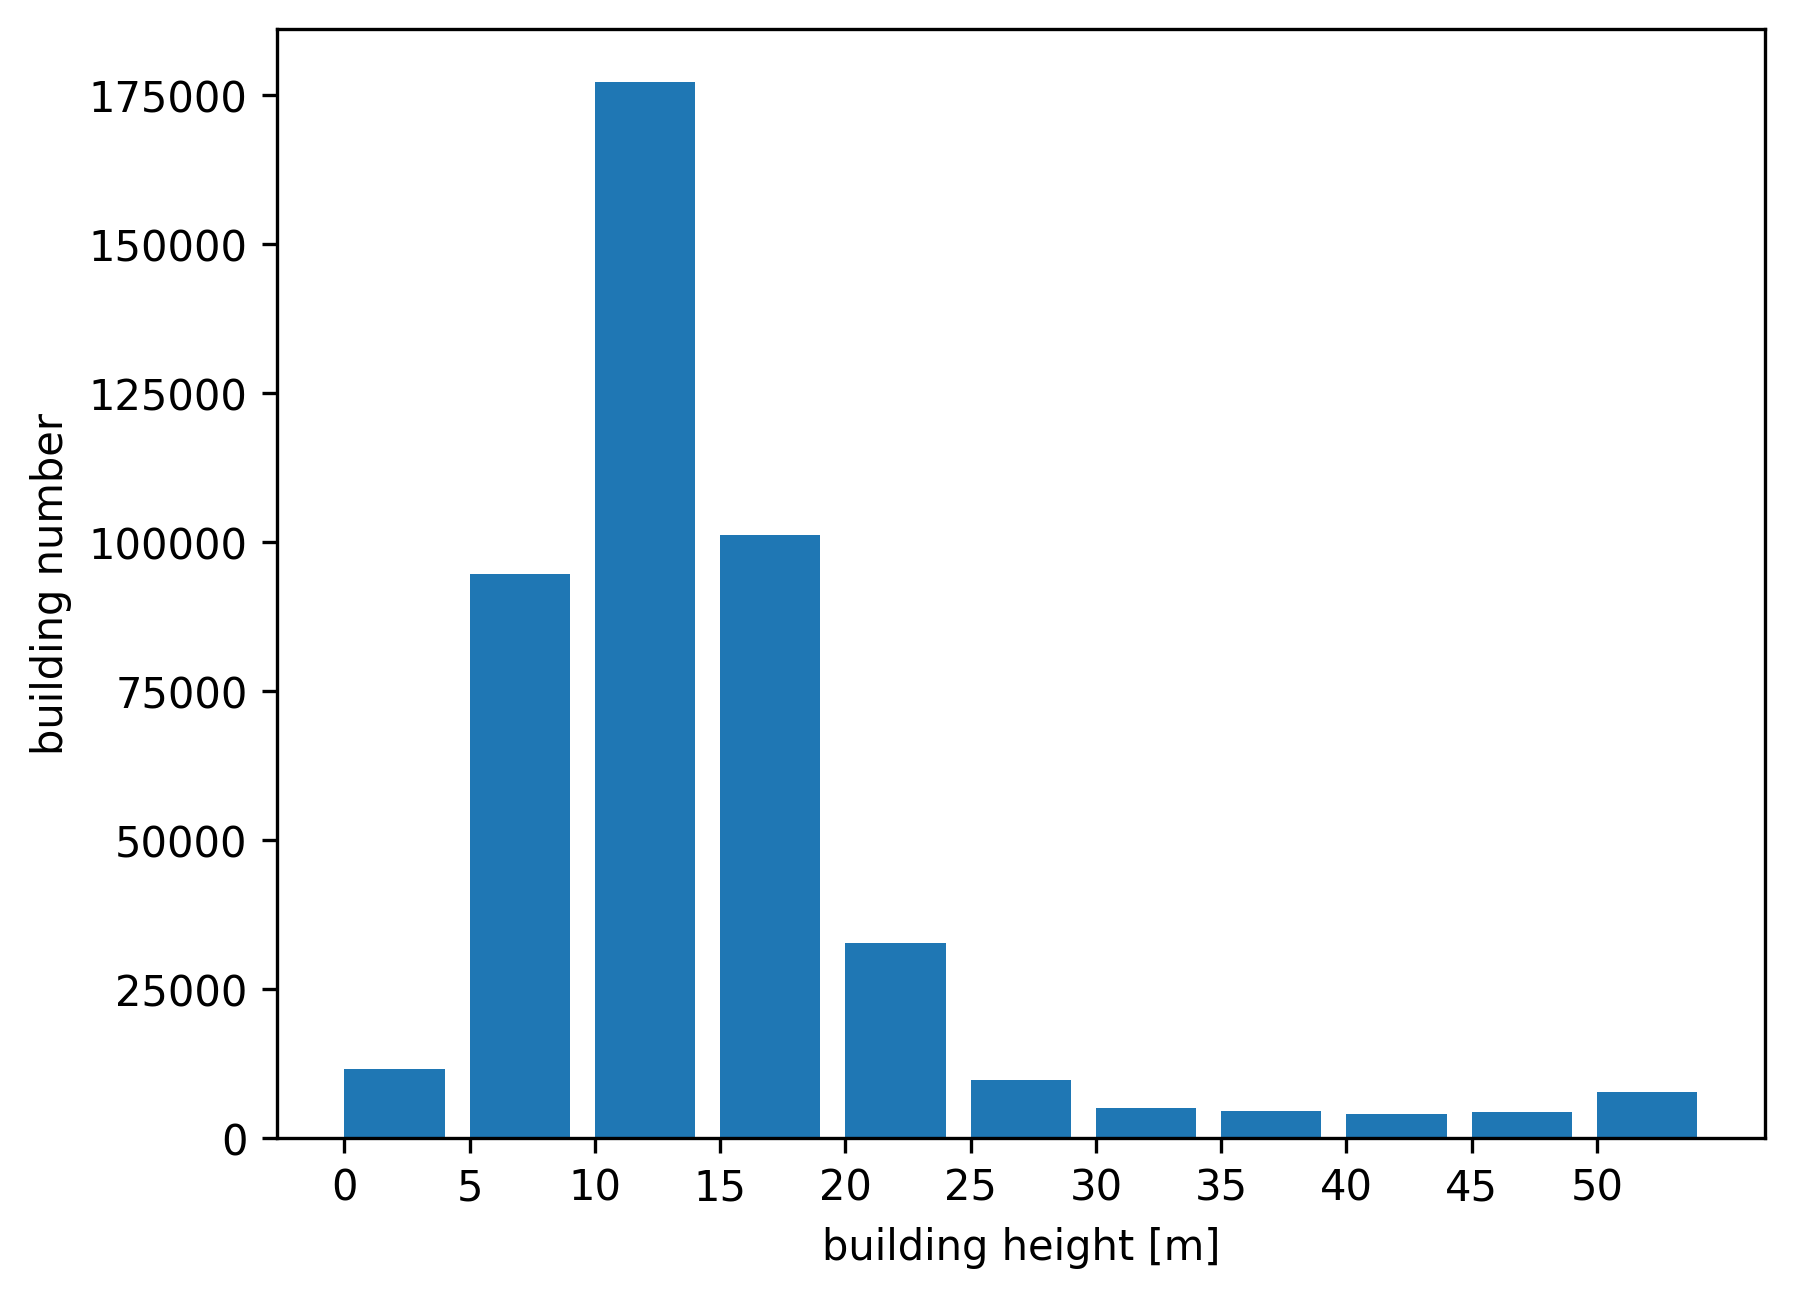
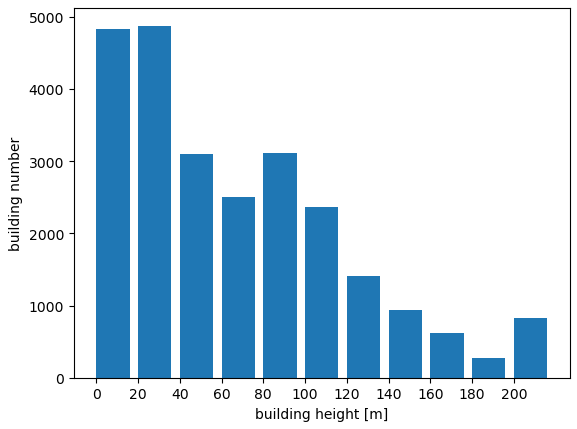
In this study, we provide additional offset annotations for the view3 subset of OmniCity (denoted by OmniCity-view3) since this subset contains images with the largest off-nadir angles. Specifically, we annotate roof-to-footprint offsets for 17,092 and 4,929 images from trainval and test sets, respectively. Fig. 8 demonstrates the building height distribution of OmniCity-view3 dataset. We also release a new dataset collected from Hong Kong (denoted by HK dataset), containing 500 remote sensing images for the trainval set and 119 images for the test set, all of which are annotated with building footprint, roof-to-footprint offset, and building height. The remote sensing images are cropped to 1024 1024 and contain 24,851 annotated buildings in total. Fig. 9 demonstrates the building height distribution of HK dataset.
Appendix C Additional experimental results
C.1 Ablation study on multi-level sample division
Tab. 8 displays the footprint segmentation and offset prediction performance of our method trained on datasets with different proportions of and samples. The performance of LOFT-FOA [39] trained only on the samples are also listed for better demonstrating the performance gains from introducing different percentages of samples. The results show that the building footprint segmentation performance difference between LOFT-FOA [39] and our method is getting smaller with the increase in the proportion of samples. In the main paper, we opt for the ratio of 30%:70% since the building footprint performance of our method, trained on , surpasses that of LOFT-FOA [39] trained on .
| dataset | Model | F1 | Precision | Recall | EPE |
|---|---|---|---|---|---|
| LOFT-FOA | 53.91 | 53.28 | 54.55 | 7.42 | |
| Ours | 63.18 | 65.05 | 61.42 | 6.14 | |
| LOFT-FOA | 59.65 | 59.05 | 60.27 | 5.79 | |
| Ours | 64.47 | 67.71 | 61.52 | 5.49 | |
| LOFT-FOA | 61.35 | 61.84 | 61.65 | 5.70 | |
| Ours | 65.50 | 66.94 | 64.11 | 5.39 | |
| LOFT-FOA | 63.17 | 62.79 | 63.56 | 5.26 | |
| Ours | 65.78 | 66.16 | 65.40 | 5.22 | |
| LOFT-FOA | 64.31 | 63.37 | 65.29 | 4.94 | |
| Ours | 66.36 | 65.90 | 66.83 | 4.76 |
C.2 Additional results on footprint segmentation
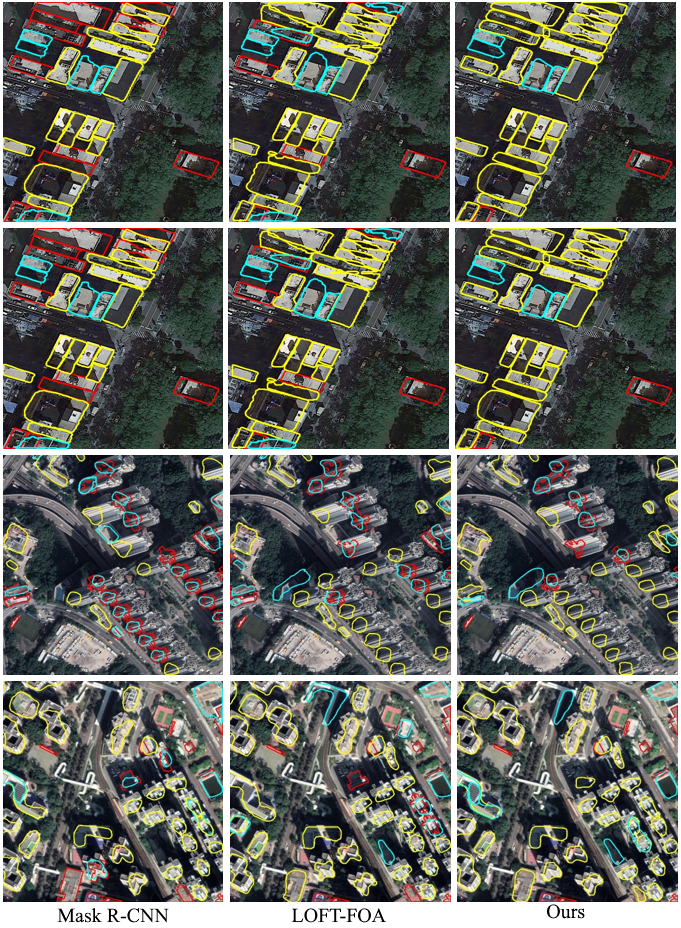
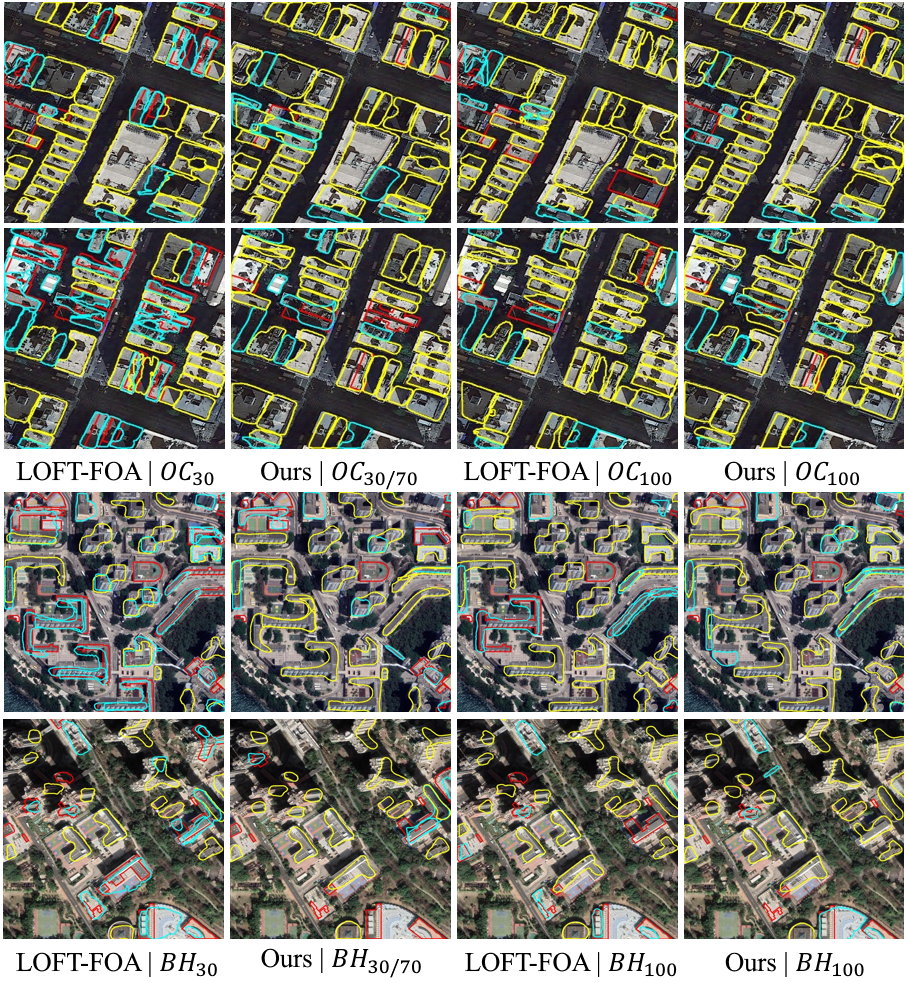
Fig. 10 and Fig. 11 demonstrate the additional building footprint segmentation results of four different cities (i.e. Shanghai, Xi’an, New York, and Hong Kong) from different models trained on solely samples. Fig. 12 display the building footprint segmentation results of two different cities (i.e. New York and Hong Kong) from LOFT-FOA [39] and our method trained on datasets containing and samples.
C.3 Additional offset angle prediction results
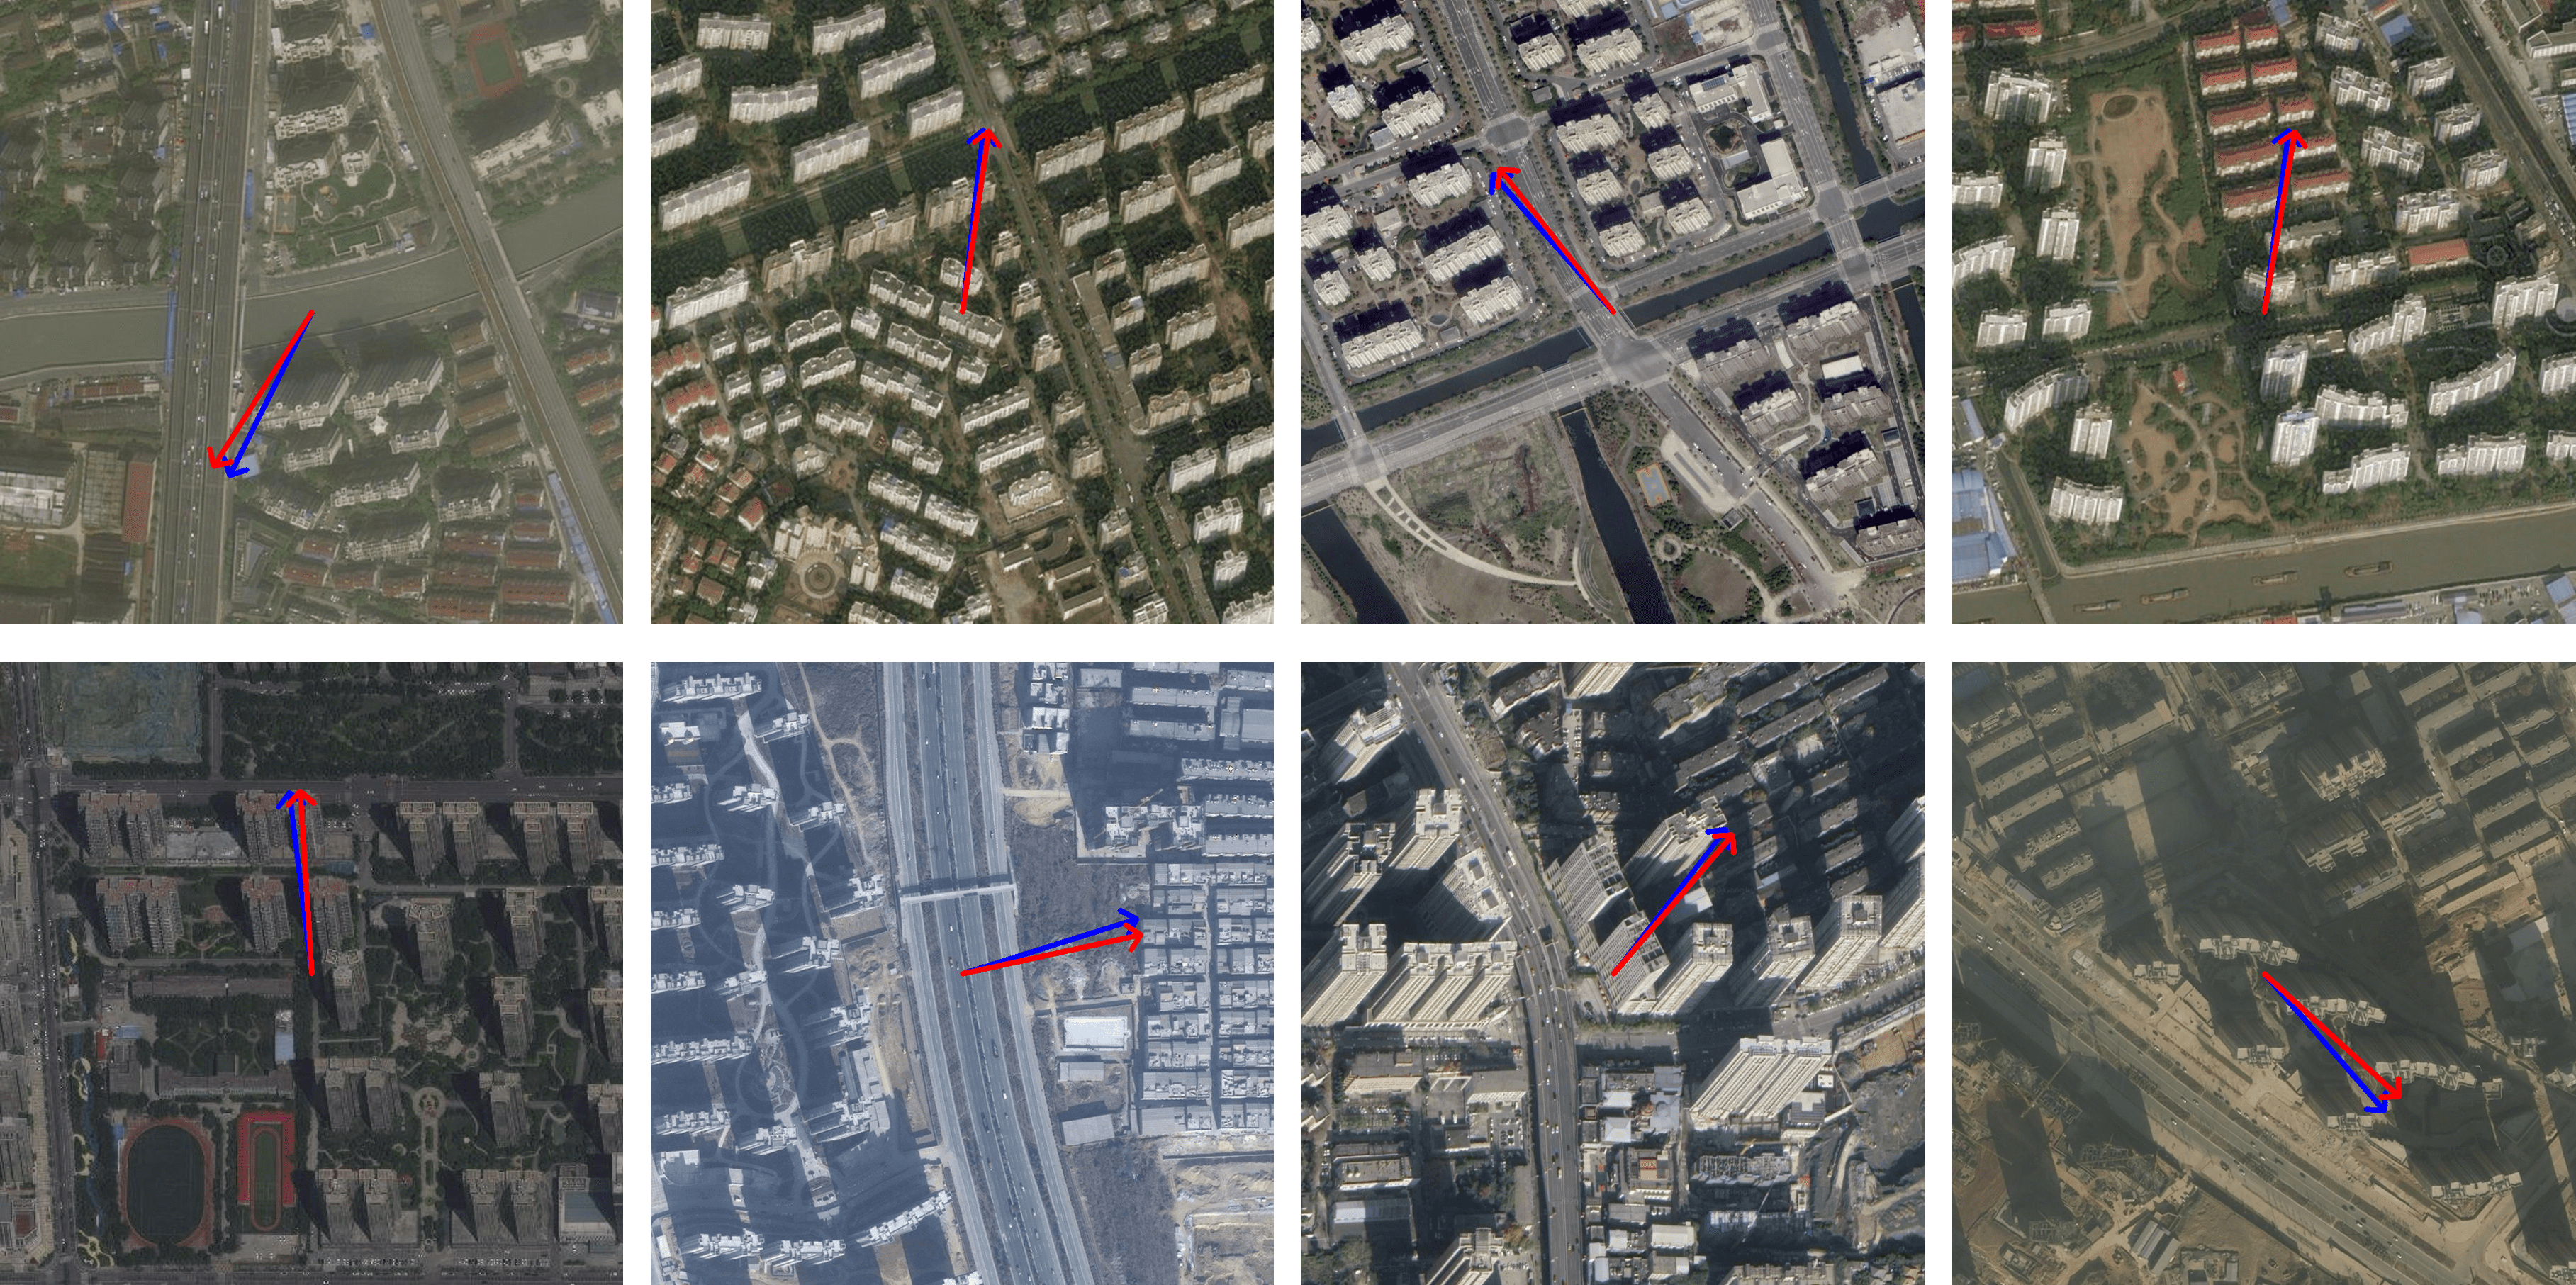
Fig. 13 demonstrates the offset angle prediction results of our method. To aid comprehension, a vector is used to represent the offset angle, with the vector direction pointing from the footprint to the roof. For example, a vector pointing horizontally to the right denotes a 0 degree angle, whereas a vector pointing downwards vertically denotes a 90 degree angle.
C.4 Failure case analysis
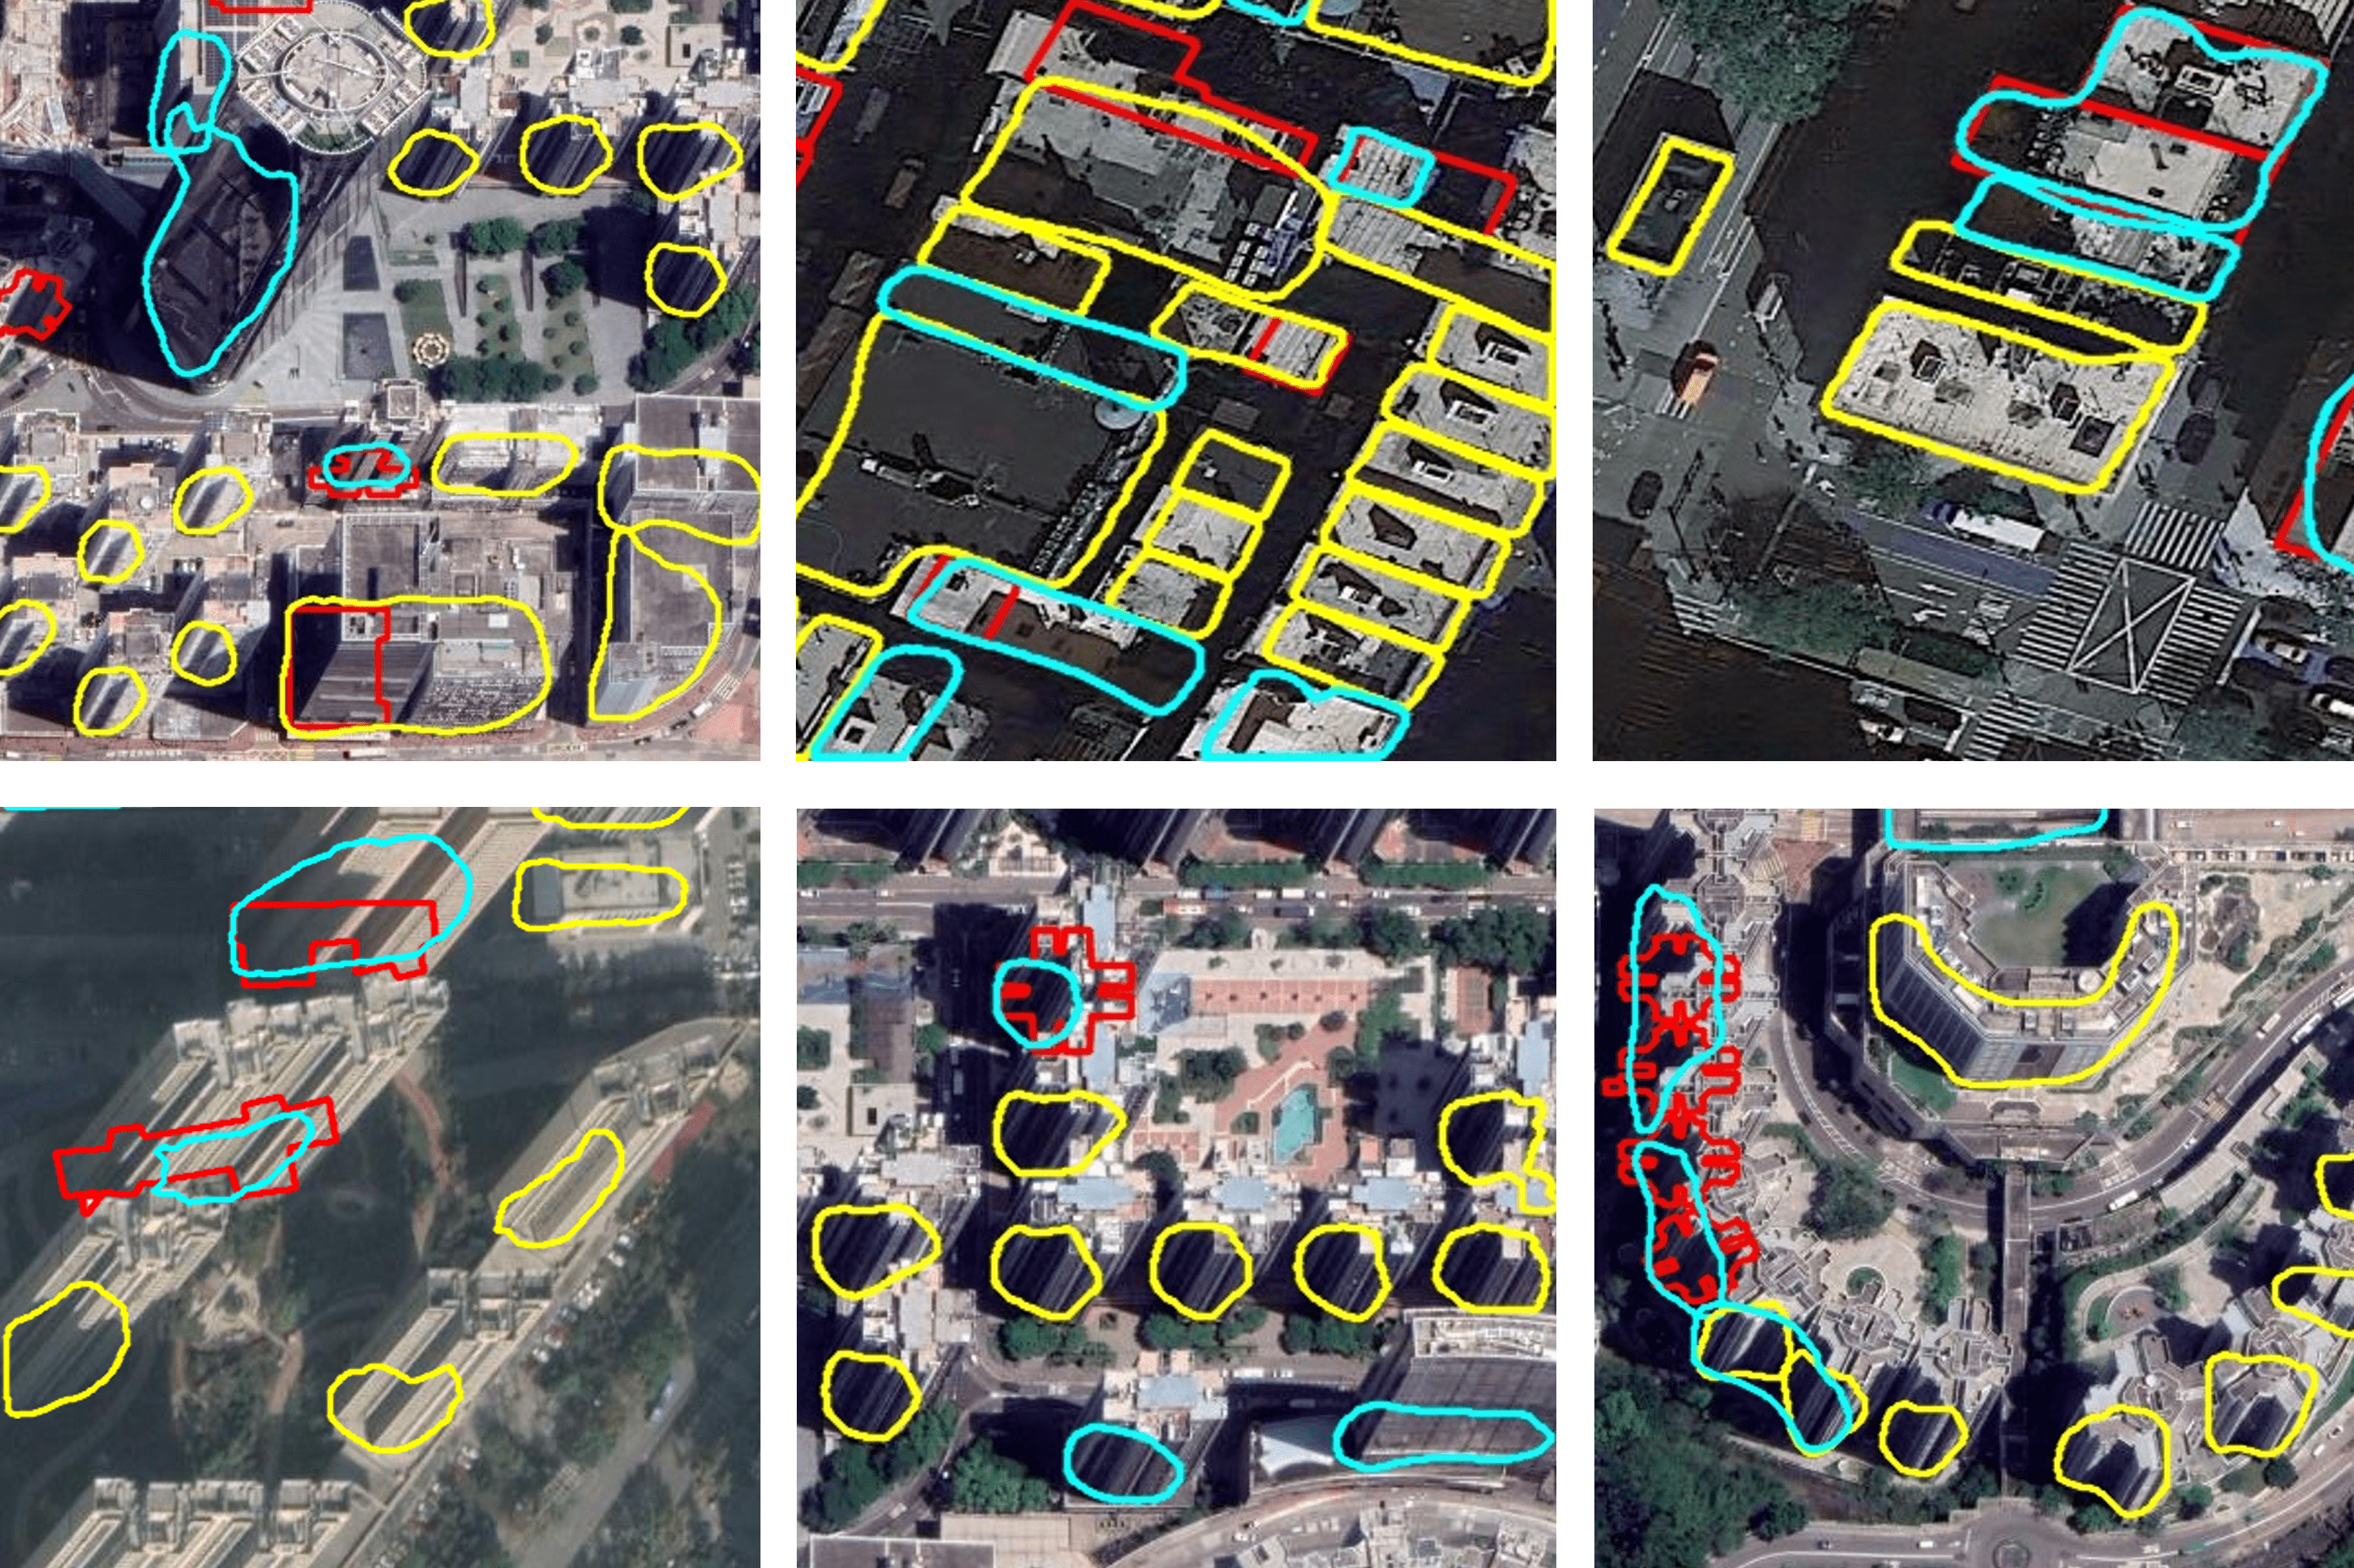
Fig. 14 displays some typical failure cases obtained from our method. The most common failure cases include: (1) the mixing up of the building roof and facade (the first column); (2) inaccurate segmentation of a complex building roof (the second column); and (3) the misinterpretation of multiple roofs as one roof, or vice versa (the third column).
C.5 Additional 3D building reconstruction results
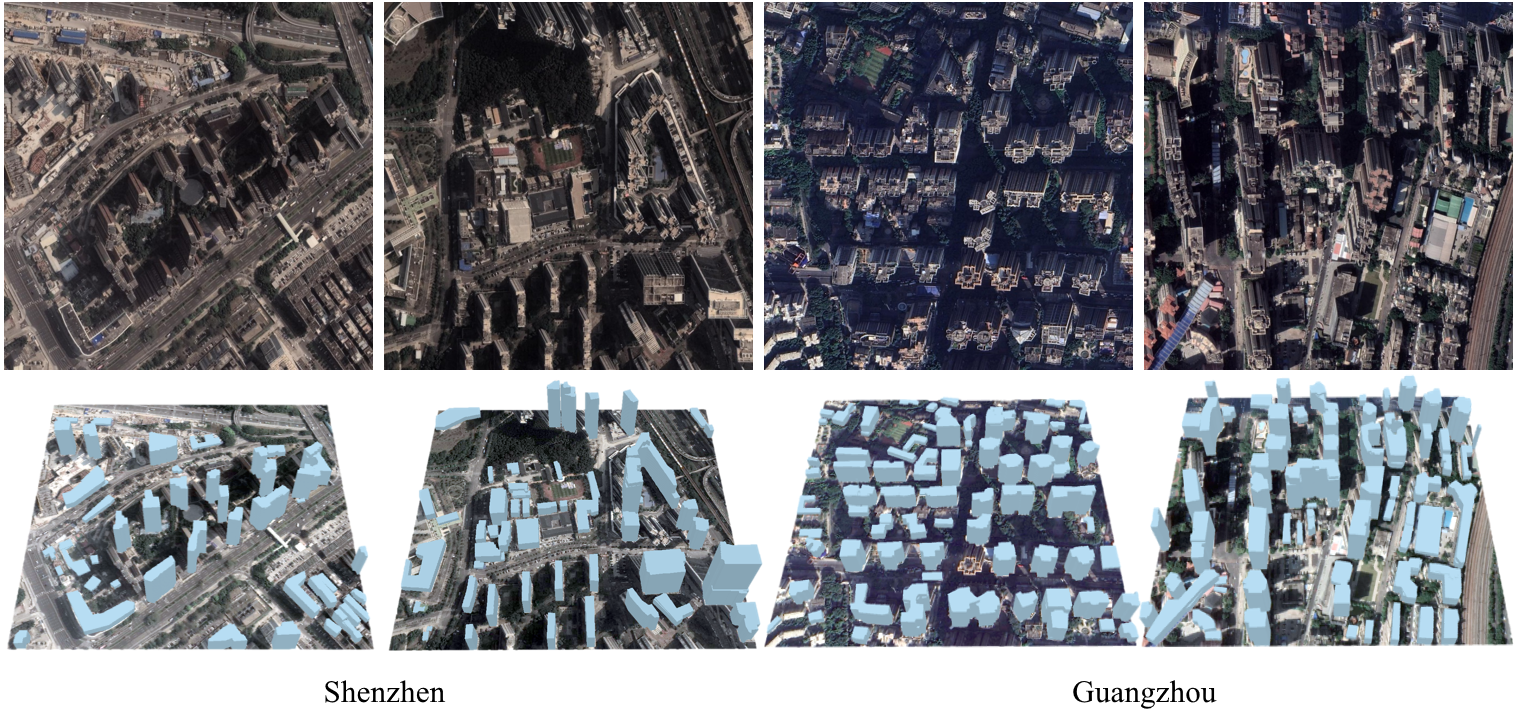
Fig. 15 shows additional 3D reconstruction results of four different cities from our method, alongside their corresponding ground truth. Moreover, in order to demonstrate the generalization performance of our method in new regions, Fig. 16 shows the 3D reconstruction results of two new cities, i.e., Shenzhen and Guangzhou. The results indicate that our model has a good generalization performance in terms of 3D building reconstruction tasks.
References
- Chen et al. [2019a] Kai Chen, Jiangmiao Pang, Jiaqi Wang, Yu Xiong, Xiaoxiao Li, Shuyang Sun, Wansen Feng, Ziwei Liu, Jianping Shi, Wanli Ouyang, et al. Hybrid task cascade for instance segmentation. In IEEE/CVF Conference on Computer Vision and Pattern Recognition (CVPR), pages 4974–4983, 2019a.
- Chen et al. [2019b] Xiaotian Chen, Xuejin Chen, and Zheng-Jun Zha. Structure-aware residual pyramid network for monocular depth estimation. In Proceedings of the 28th International Joint Conference on Artificial Intelligence, pages 694–700, 2019b.
- Chen et al. [2019c] Yujin Chen, Zhigang Tu, Liuhao Ge, Dejun Zhang, Ruizhi Chen, and Junsong Yuan. So-handnet: Self-organizing network for 3d hand pose estimation with semi-supervised learning. In Proceedings of the IEEE/CVF International Conference on Computer Vision, pages 6961–6970, 2019c.
- Christie et al. [2020] Gordon Christie, Rodrigo Rene Rai Munoz Abujder, Kevin Foster, Shea Hagstrom, Gregory D Hager, and Myron Z Brown. Learning geocentric object pose in oblique monocular images. In Proceedings of the IEEE/CVF Conference on Computer Vision and Pattern Recognition (CVPR), pages 14512–14520, 2020.
- Christie et al. [2021] Gordon Christie, Kevin Foster, Shea Hagstrom, Gregory D Hager, and Myron Z Brown. Single view geocentric pose in the wild. In Proceedings of the IEEE/CVF Conference on Computer Vision and Pattern Recognition, pages 1162–1171, 2021.
- Demir et al. [2018] Ilke Demir, Krzysztof Koperski, David Lindenbaum, Guan Pang, Jing Huang, Saikat Basu, Forest Hughes, Devis Tuia, and Ramesh Raskar. Deepglobe 2018: A challenge to parse the earth through satellite images. In 2018 IEEE/CVF Conference on Computer Vision and Pattern Recognition Workshops (CVPRW), 2018.
- Douglas and Peucker [1973] David H Douglas and Thomas K Peucker. Algorithms for the reduction of the number of points required to represent a digitized line or its caricature. Cartographica: the international journal for geographic information and geovisualization, 10(2):112–122, 1973.
- Duan and Lafarge [2016] Liuyun Duan and Florent Lafarge. Towards large-scale city reconstruction from satellites. In European Conference on Computer Vision (ECCV), 2016.
- Fu et al. [2018] Huan Fu, Mingming Gong, Chaohui Wang, Kayhan Batmanghelich, and Dacheng Tao. Deep ordinal regression network for monocular depth estimation. In Proceedings of the IEEE conference on computer vision and pattern recognition, pages 2002–2011, 2018.
- Gao et al. [2023] Zhi Gao, Wenbo Sun, Yao Lu, Yichen Zhang, Weiwei Song, Yongjun Zhang, and Ruifang Zhai. Joint learning of semantic segmentation and height estimation for remote sensing image leveraging contrastive learning. IEEE Transactions on Geoscience and Remote Sensing, 2023.
- Ghamisi and Yokoya [2018] Pedram Ghamisi and Naoto Yokoya. Img2dsm: Height simulation from single imagery using conditional generative adversarial net. IEEE Geoence & Remote Sensing Letters, pages 1–5, 2018.
- Gwak et al. [2017] JunYoung Gwak, Christopher B Choy, Manmohan Chandraker, Animesh Garg, and Silvio Savarese. Weakly supervised 3d reconstruction with adversarial constraint. In 2017 International Conference on 3D Vision (3DV), pages 263–272. IEEE, 2017.
- Han et al. [2021] Junwei Han, Yang Yang, Dingwen Zhang, Dong Huang, Dong Xu, and Fernando De La Torre. Weakly-supervised learning of category-specific 3d object shapes. IEEE Transactions on Pattern Analysis and Machine Intelligence, 43(4):1423–1437, 2021.
- He et al. [2016] Kaiming He, Xiangyu Zhang, Shaoqing Ren, and Jian Sun. Deep residual learning for image recognition. In Proceedings of the IEEE conference on computer vision and pattern recognition, pages 770–778, 2016.
- He et al. [2017] Kaiming He, Georgia Gkioxari, Piotr Dollár, and Ross Girshick. Mask r-cnn. In Proceedings of the IEEE international conference on computer vision (CVPR), pages 2961–2969, 2017.
- ISPRS [2022] ISPRS. ISPRS 3D Semantic Labeling Contest. https://www.isprs.org/education/benchmarks/UrbanSemLab/3d-semantic-labeling.aspx, 2022.
- Ji et al. [2019a] Rongrong Ji, Ke Li, Yan Wang, Xiaoshuai Sun, Feng Guo, Xiaowei Guo, Yongjian Wu, Feiyue Huang, and Jiebo Luo. Semi-supervised adversarial monocular depth estimation. IEEE transactions on pattern analysis and machine intelligence, 42(10):2410–2422, 2019a.
- Ji et al. [2019b] Shunping Ji, Yanyun Shen, Meng Lu, and Yongjun Zhang. Building instance change detection from large-scale aerial images using convolutional neural networks and simulated samples. Remote Sensing, 11(11):1343, 2019b.
- Kunwar [2019] Saket Kunwar. U-net ensemble for semantic and height estimation using coarse-map initialization. In IGARSS 2019-2019 IEEE International Geoscience and Remote Sensing Symposium, pages 4959–4962. IEEE, 2019.
- Li et al. [2023a] Chunlu Li, Andreas Morel-Forster, Thomas Vetter, Bernhard Egger, and Adam Kortylewski. Robust model-based face reconstruction through weakly-supervised outlier segmentation. In Proceedings of the IEEE/CVF Conference on Computer Vision and Pattern Recognition, pages 372–381, 2023a.
- Li et al. [2020] Muxingzi Li, Florent Lafarge, and Renaud Marlet. Approximating shapes in images with low-complexity polygons. In IEEE/CVF Conference on Computer Vision and Pattern Recognition (CVPR), 2020.
- Li et al. [2023b] Qingyu Li, Lichao Mou, Yuansheng Hua, Yilei Shi, Sining Chen, Yao Sun, and Xiao Xiang Zhu. 3dcentripetalnet: Building height retrieval from monocular remote sensing imagery. International Journal of Applied Earth Observation and Geoinformation, 120:103311, 2023b.
- Li et al. [2021a] Weijia Li, Lingxuan Meng, Jinwang Wang, Conghui He, Gui-Song Xia, and Dahua Lin. 3d building reconstruction from monocular remote sensing images. In Proceedings of the IEEE/CVF International Conference on Computer Vision, pages 12548–12557, 2021a.
- Li et al. [2021b] Weijia Li, Wenqian Zhao, Huaping Zhong, Conghui He, and Dahua Lin. Joint semantic-‐geometric learning for polygonal building segmentation. In AAAI, 2021b.
- Li et al. [2023c] Weijia Li, Yawen Lai, Linning Xu, Yuanbo Xiangli, Jinhua Yu, Conghui He, Gui-Song Xia, and Dahua Lin. Omnicity: Omnipotent city understanding with multi-level and multi-view images. In Proceedings of the IEEE/CVF Conference on Computer Vision and Pattern Recognition, pages 17397–17407, 2023c.
- Li et al. [2019] Zuoyue Li, Jan Dirk Wegner, and Aurélien Lucchi. Topological map extraction from overhead images. In Proceedings of the IEEE International Conference on Computer Vision (CVPR), pages 1715–1724, 2019.
- Lin et al. [2017] Tsung-Yi Lin, Piotr Dollár, Ross Girshick, Kaiming He, Bharath Hariharan, and Serge Belongie. Feature pyramid networks for object detection. In Proceedings of the IEEE conference on computer vision and pattern recognition (CVPR), pages 2117–2125, 2017.
- Mahmud et al. [2020] Jisan Mahmud, True Price, Akash Bapat, and Jan Michael Frahm. Boundary-aware 3d building reconstruction from a single overhead image. In IEEE/CVF Conference on Computer Vision and Pattern Recognition (CVPR), 2020.
- Mao et al. [2023] Yongqiang Mao, Kaiqiang Chen, Liangjin Zhao, Wei Chen, Deke Tang, Wenjie Liu, Zhirui Wang, Wenhui Diao, Xian Sun, and Kun Fu. Elevation estimation-driven building 3d reconstruction from single-view remote sensing imagery. IEEE Transactions on Geoscience and Remote Sensing, 2023.
- Microsoft [2023] Microsoft. Microsoft Global Building Footprints. https://github.com/microsoft/GlobalMLBuildingFootprints, 2023.
- Mitra et al. [2020] Rahul Mitra, Nitesh B Gundavarapu, Abhishek Sharma, and Arjun Jain. Multiview-consistent semi-supervised learning for 3d human pose estimation. In Proceedings of the IEEE/CVF Conference on Computer Vision and Pattern Recognition, pages 6907–6916, 2020.
- Mohanty [2018] Sharada Prasanna Mohanty. Crowdai dataset: the mapping challenge. https://www.aicrowd.com/challenges/. 2018.
- Neverova et al. [2017] Natalia Neverova, Christian Wolf, Florian Nebout, and Graham W Taylor. Hand pose estimation through semi-supervised and weakly-supervised learning. Computer Vision and Image Understanding, 164:56–67, 2017.
- Ronneberger et al. [2015] Olaf Ronneberger, Philipp Fischer, and Thomas Brox. U-net: Convolutional networks for biomedical image segmentation. In International Conference on Medical image computing and computer-assisted intervention, pages 234–241. Springer, 2015.
- Sirko et al. [2021] Wojciech Sirko, Sergii Kashubin, Marvin Ritter, Abigail Annkah, Yasser Salah Eddine Bouchareb, Yann Dauphin, Daniel Keysers, Maxim Neumann, Moustapha Cisse, and John Quinn. Continental-scale building detection from high resolution satellite imagery. arXiv preprint arXiv:2107.12283, 2021.
- Srivastava et al. [2017] Shivangi Srivastava, Michele Volpi, and Devis Tuia. Joint height estimation and semantic labeling of monocular aerial images with cnns. In Igarss IEEE International Geoscience & Remote Sensing Symposium, 2017.
- Sun et al. [2019] Ke Sun, Yang Zhao, Borui Jiang, Tianheng Cheng, Bin Xiao, Dong Liu, Yadong Mu, Xinggang Wang, Wenyu Liu, and Jingdong Wang. High-resolution representations for labeling pixels and regions. arXiv preprint arXiv:1904.04514, 2019.
- Verma et al. [2006] Vivek Verma, Rakesh Kumar, and Stephen Hsu. 3d building detection and modeling from aerial lidar data. In IEEE/CVF Conference on Computer Vision and Pattern Recognition (CVPR), 2006.
- Wang et al. [2022] Jinwang Wang, Lingxuan Meng, Weijia Li, Wen Yang, Lei Yu, and Gui-Song Xia. Learning to extract building footprints from off-nadir aerial images. IEEE Transactions on Pattern Analysis and Machine Intelligence, 45(1):1294–1301, 2022.
- Weir et al. [2019] Nicholas Weir, David Lindenbaum, Alexei Bastidas, Adam Van Etten, Sean McPherson, Jacob Shermeyer, Varun Kumar, and Hanlin Tang. Spacenet mvoi: a multi-view overhead imagery dataset. In Proceedings of the IEEE/CVF International Conference on Computer Vision (ICCV), pages 992–1001, 2019.
- Xiong et al. [2023] Zhitong Xiong, Wei Huang, Jingtao Hu, and Xiao Xiang Zhu. The benchmark: Transferable representation learning for monocular height estimation. IEEE Transactions on Geoscience and Remote Sensing, 2023.
- Yang et al. [2018] Guandao Yang, Yin Cui, Serge Belongie, and Bharath Hariharan. Learning single-view 3d reconstruction with limited pose supervision. In Proceedings of the European Conference on Computer Vision (ECCV), pages 86–101, 2018.
- Yuan [2017] Jiangye Yuan. Learning building extraction in aerial scenes with convolutional networks. IEEE transactions on pattern analysis and machine intelligence, 40(11):2793–2798, 2017.
- Zhao et al. [2021] Wufan Zhao, Claudio Persello, and Alfred Stein. Building outline delineation: From aerial images to polygons with an improved end-to-end learning framework. ISPRS journal of photogrammetry and remote sensing, 175:119–131, 2021.
- Zheng et al. [2019] Zhuo Zheng, Yanfei Zhong, and Junjue Wang. Pop-net: Encoder-dual decoder for semantic segmentation and single-view height estimation. In IGARSS 2019-2019 IEEE International Geoscience and Remote Sensing Symposium, pages 4963–4966. IEEE, 2019.
- Zorzi et al. [2021] Stefano Zorzi, Ksenia Bittner, and Friedrich Fraundorfer. Machine-learned regularization and polygonization of building segmentation masks. In 2020 25th International Conference on Pattern Recognition (ICPR), pages 3098–3105. IEEE, 2021.
- Zorzi et al. [2022] Stefano Zorzi, Shabab Bazrafkan, Stefan Habenschuss, and Friedrich Fraundorfer. Polyworld: Polygonal building extraction with graph neural networks in satellite images. In Proceedings of the IEEE/CVF Conference on Computer Vision and Pattern Recognition, pages 1848–1857, 2022.