abbreviationnohypertrue \newabbreviationcuoreCUORECryogenic Underground Observatory for Rare Events
With or without ? Hunting for the seed of the matter-antimatter asymmetry
D. Q. Adams1, C. Alduino1, K. Alfonso2, F. T. Avignone III1, O. Azzolini3, G. Bari4, F. Bellini5,6, G. Benato7,8, M. Beretta9, M. Biassoni10, A. Branca11,10, C. Brofferio11,10, C. Bucci8, J. Camilleri2, A. Caminata12, A. Campani13,12, J. Cao14, S. Capelli11,10, C. Capelli15, L. Cappelli8, L. Cardani6, P. Carniti11,10, N. Casali6, E. Celi7,8, D. Chiesa11,10, M. Clemenza10, O. Cremonesi10, R. J. Creswick1, A. D’Addabbo8, I. Dafinei6, F. Del Corso16,4, S. Dell’Oro11,10, S. Di Domizio13,12, S. Di Lorenzo8, T. Dixon17, V. Dompè5,6, D. Q. Fang14, G. Fantini5,6, M. Faverzani11,10, E. Ferri10, F. Ferroni7,6, E. Fiorini11,10,†, M. A. Franceschi18, S. J. Freedman15,9,†, S.H. Fu14,8, B. K. Fujikawa15, S. Ghislandi7,8, A. Giachero11,10, M. Girola11, L. Gironi11,10, A. Giuliani17, P. Gorla8, C. Gotti10, P.V. Guillaumon8,‡, T. D. Gutierrez19, K. Han20, E. V. Hansen9, K. M. Heeger21, D.L. Helis7,8, H. Z. Huang22, G. Keppel3, Yu. G. Kolomensky9,15, R. Kowalski23, R. Liu21, L. Ma14,22, Y. G. Ma14, L. Marini7,8, R. H. Maruyama21, D. Mayer24, Y. Mei15, M. N. Moore21, T. Napolitano18, M. Nastasi11,10, C. Nones25, E. B. Norman26, A. Nucciotti11,10, I. Nutini10, T. O’Donnell2, M. Olmi8, B.T. Oregui23, J. L. Ouellet24, S. Pagan21, C. E. Pagliarone8,27, L. Pagnanini7,8, M. Pallavicini13,12, L. Pattavina11,10,8, M. Pavan11,10, G. Pessina10, V. Pettinacci6, C. Pira3, S. Pirro8, I. Ponce21, E. G. Pottebaum21, S. Pozzi10,11, E. Previtali11,10, A. Puiu8, S. Quitadamo7,8, A. Ressa5,6, C. Rosenfeld1, B. Schmidt25, V. Sharma2, V. Singh9, M. Sisti10, D. Speller23, P.T. Surukuchi28, L. Taffarello29, C. Tomei6, J.A Torres21, K. J. Vetter9,15, M. Vignati5,6, S. L. Wagaarachchi9,15, B. Welliver9,15, J. Wilson1, K. Wilson1, L. A. Winslow24, S. Zimmermann30, and S. Zucchelli16,4
1 Department of Physics and Astronomy, University of South Carolina, Columbia, SC 29208, USA
2 Center for Neutrino Physics, Virginia Polytechnic Institute and State University, Blacksburg, Virginia 24061, USA
3 INFN – Laboratori Nazionali di Legnaro, Legnaro (Padova) I-35020, Italy
4 INFN – Sezione di Bologna, Bologna I-40127, Italy
5 Dipartimento di Fisica, Sapienza Università di Roma, Roma I-00185, Italy
6 INFN – Sezione di Roma, Roma I-00185, Italy
7 Gran Sasso Science Institute, L’Aquila I-67100, Italy
8 INFN – Laboratori Nazionali del Gran Sasso, Assergi (L’Aquila) I-67100, Italy
9 Department of Physics, University of California, Berkeley, CA 94720, USA
10 INFN – Sezione di Milano Bicocca, Milano I-20126, Italy
11 Dipartimento di Fisica, Università di Milano-Bicocca, Milano I-20126, Italy
12 INFN – Sezione di Genova, Genova I-16146, Italy
13 Dipartimento di Fisica, Università di Genova, Genova I-16146, Italy
14 Key Laboratory of Nuclear Physics and Ion-beam Application (MOE), Institute of Modern Physics, Fudan University, Shanghai 200433, China
15 Nuclear Science Division, Lawrence Berkeley National Laboratory, Berkeley, CA 94720, USA
16 Dipartimento di Fisica e Astronomia, Alma Mater Studiorum – Università di Bologna, Bologna I-40127, Italy
17 Université Paris-Saclay, CNRS/IN2P3, IJCLab, 91405 Orsay, France
18 INFN – Laboratori Nazionali di Frascati, Frascati (Roma) I-00044, Italy
19 Physics Department, California Polytechnic State University, San Luis Obispo, CA 93407, USA
20 INPAC and School of Physics and Astronomy, Shanghai Jiao Tong University; Shanghai Laboratory for Particle Physics and Cosmology, Shanghai 200240, China
21 Wright Laboratory, Department of Physics, Yale University, New Haven, CT 06520, USA
22 Department of Physics and Astronomy, University of California, Los Angeles, CA 90095, USA
23 Department of Physics and Astronomy, The Johns Hopkins University, 3400 North Charles Street Baltimore, MD, 21211
24 Massachusetts Institute of Technology, Cambridge, MA 02139, USA
25 IRFU, CEA, Université Paris-Saclay, F-91191 Gif-sur-Yvette, France
26 Department of Nuclear Engineering, University of California, Berkeley, CA 94720, USA
27 Dipartimento di Ingegneria Civile e Meccanica, Università degli Studi di Cassino e del Lazio Meridionale, Cassino I-03043, Italy
28 Department of Physics and Astronomy, University of Pittsburgh, Pittsburgh, PA 15260, USA
29 INFN – Sezione di Padova, Padova I-35131, Italy
30 Engineering Division, Lawrence Berkeley National Laboratory, Berkeley, CA 94720, USA
† Deceased
‡ Presently at: Instituto de Física, Universidade de São Paulo, São Paulo 05508-090, Brazil
(CUORE collaboration111 cuore-spokesperson@lngs.infn.it)
The matter-antimatter asymmetry underlines the incompleteness of the current understanding of particle physics. Neutrinoless double-beta () decay may help explain this asymmetry, while unveiling the Majorana nature of the neutrino. The CUORE experiment searches for decay of 130Te using a tonne-scale cryogenic calorimeter operated at milli-kelvin temperatures. We report no evidence for decay and place a lower limit on the half-life of T1/2 3.8 1025 years (90% C.I.) with over 2 tonneyear TeO2 exposure. The tools and techniques developed for this result and the 5 year stable operation of nearly 1000 detectors demonstrate the infrastructure for a next-generation experiment capable of searching for decay across multiple isotopes.
The abundance of matter in the universe is in stark disagreement with our current understanding of the laws of nature. Cosmological models assume that matter and antimatter should have been created in equal amounts. At the same time, both are bound to interact and leave only energy when they come into contact with each other. As a result, the universe should be composed of either equal amounts of matter and antimatter or none at all. Our observations, however, contradict this hypothesis indicating a fundamental asymmetry in the properties of matter and antimatter [1]. Neutrinos, the least understood of the fundamental particles, may help resolve this impasse if they turn out to be Majorana fermions—indistinguishable from their own antiparticles [2]. Double-beta () decay [3] is a rare nuclear process in which two neutrons convert into two protons with the emission of two electrons and two antineutrinos: . If the neutrino is its own antiparticle, the process could leave matter as the only by-product: . This version of the decay, so-called neutrinoless double-beta () decay [4], may help explain the matter-antimatter asymmetry. Moreover, an observed absence of neutrinos from the double-beta decay products would not only confirm the Majorana nature of the neutrino, but also help constrain the mass of this elusive particle and imply that the lepton number is not a conserved quantity in nature. Currently, only decay has been observed with half-life measurements in the range of yr [5, 6, 7, 8, 9]. Neutrinoless double-beta decay would potentially occur in the same isotopes that exhibit decay [10]. Experiments searching for this rare process are designed to measure a monoenergetic peak at the Q-value of the decay () and aim to maximize the experimental sensitivity by increasing their measurement time and the mass of the double-beta () decay source under observation. When the background near is non-negligible, experiments must minimize it, while optimizing the detector energy resolution [11].
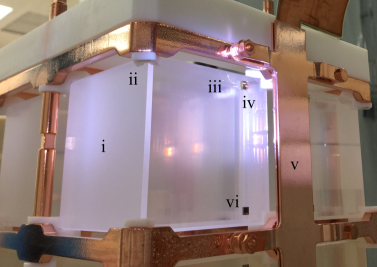
The use of cryogenic calorimeters for decay searches was first proposed by Fiorini and Niinikoski in 1984 [12]. In the following decades, the detection technique demonstrated excellent energy resolution (0.1% in the MeV range), radiopurity control, and scalability to large masses (1 tonne) [13, 14]. In this application, the calorimeter components consist of an absorber material primarily composed of a decay source, a sensor to measure the temperature of the absorber, and a weak thermal coupling of the absorber to a heat sink. An example of a cryogenic calorimeter is shown in Fig. 1.
When energy is released in the absorber, its temperature rise is proportional to the energy deposition and inversely proportional to its heat capacity. Since the heat sink serves to restore the detector to a base temperature, over time the energy deposition is represented by a pulse in the sensor readout. To have a measurable temperature rise, the absorber material is kept at very low temperatures (T10 mK), where the heat capacity (C) is reduced. Diamagnetic and dielectric materials are preferred since their lattice-specific heat capacity, which follows the Debye law C(T) T3, is the only contribution, but the choice is otherwise flexible. The flexibility in the choice of the decay emitter (i.e., 48Ca, 76Ge, 82Se, 100Mo, 116Cd, and 130Te) is a key strength of the cryogenic calorimeter technique. So far, 130Te [15], 82Se [16], and 100Mo [17, 18] have been used in high sensitivity searches for decay with cryogenic calorimeter experiments, leading to some of the most stringent half-life limits on this process. If decay is observed, measuring the process across multiple isotopes would be crucial to understanding the new physics involved [19]. Thus, the cryogenic calorimeter technique offers a wide pathway toward this long-term objective.
The CUORE experiment
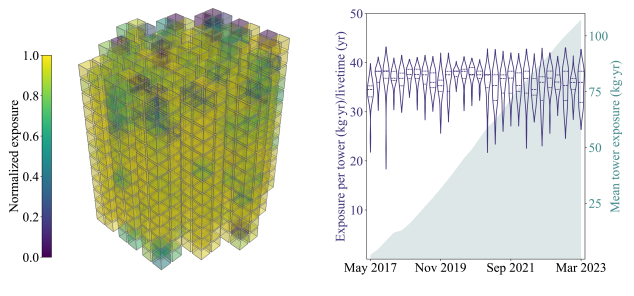
The CUORE (Cryogenic Underground Observatory for Rare Events) experiment [15] primarily searches for decay of 130Te at the Laboratori Nazionali del Gran Sasso (LNGS) in Italy. The CUORE detector consists of a close-packed array of 988 5 5 5 cm3 TeO2 crystal calorimeters with an active mass of 742 kg (206 kg 130Te). The crystals are mounted in copper frames that form 19 towers. The towers are hosted in the CUORE cryostat, a custom multistage cryogen-free dilution refrigerator that cools the detector to 10 mK and maintains it in a stable, low-noise environment [20]. An illustration of the relative positions of the CUORE crystals is shown in Fig. 2.
CUORE chose 130Te as the decay emitter because of its relatively high natural isotopic abundance of 34%, which in turn allowed us to use tellurium with natural isotopic composition. This enables CUORE to search for decay and other rare processes in multiple isotopes of tellurium [21, 22, 23, 24]. The decay emitter is also favorable because of its relatively high of 2527.5 keV [25], which is above most environmental gamma-ray backgrounds. CUORE is further protected by several means from backgrounds that could obscure the decay signal. The Gran Sasso mountains above LNGS provide natural shielding from cosmic rays, decreasing the muon flux by 6 orders of magnitude compared to sea level [26]. Multiple shields located outside and inside the cryostat provide nearly 4 coverage of the detector against environmental gamma background and neutrons [27, 20] with the inner cryostat shield mostly comprised of 210Pb-depleted ancient lead recovered from a Roman shipwreck [28]. We addressed the largest source of background—i.e., degraded alpha particles originating from the trace radioactive contamination of the copper frame structures [29]—using effective cleaning procedures and strict radiopurity controls on the crystals and nearby structures [30, 31, 32].
CUORE was designed to have each of the 988 calorimeters operate independently. In the CUORE calorimeter (Fig. 1), the TeO2 crystal acts as the absorber and an affixed neutron transmutation doped (NTD) Ge thermistor [33] acts as the temperature sensor. Polytetrafluoroethylene (PTFE) spacers between the crystal and copper frame and gold wires, used for electrical connection of the NTD, provide weak thermal coupling [34]. The copper frame structure acts as the heat sink since it is in thermal contact with the cryostat mixing chamber, which sets the base temperature [20]. To correct our measurement against possible drifts in the operating temperature, a silicon heater is also affixed to the crystal and used to induce periodic, monoenergetic pulses [35, 36]. We measure energy depositions by applying an optimized constant bias current to the thermistor so that the voltage measured across it acts as a proxy for the temperature of the calorimeter [37]. Due to the combination of the thermal capacities and conductances of our calorimeter components, we measure slow pulses (i.e., 50 ms rise time, 1 s relaxation time) from the thermistor readout [38]. Our continuous datastream is formed by passing the voltage though a room-temperature pre-amplifier and an anti-aliasing filter, and digitizing at 1 kHz [39, 40].
Data collection, analysis pipeline, and event selection
CUORE began collecting data in 2017 and made major strides toward stable detector operations during the early stages of data taking [14]. Currently, the procedure to optimize all calorimeters is largely automated [41] and routine cryogenic maintenance is minimal. Since 2019, CUORE has been collecting data at 90% duty cycle with an exposure rate of 50 kgyr TeO2 per month [42] as we continued to build upon our expertise of the unique and complex system. Due to the unprecedented stable operation of the cryogenic infrastructure, we collected over 2 tonneyr TeO2 exposure between 2017 and mid-2023. During this period, we were able to maintain steady exposure accumulation and operate the detector at different base temperatures.
CUORE data are organized into periods of data taking called datasets. Each dataset begins and ends with 1 week of calibration measurements, during which 232Th or 232Th60Co radioactive sources are deployed along strings around the detector. The high-intensity, characteristic gamma rays of well-known energies emitted by the radioactive sources are used to calibrate the voltage measurements in the entire dataset. Between the calibration measurements, we acquire 1.5 month-long physics data, which contribute to our reported TeO2 exposure. The duration of the dataset maximizes physics data collection while ensuring that the calibration is consistent for all calorimeters and compatible with the detector conditions.
To search for the potential decay signal peak at , we identify pulses in the calorimeter readout that likely correspond to particle energy depositions and reconstruct their energies to build a spectrum. We processed 28 datasets and after removing calorimeters performing below standard, our data processing framework reconstructed the energy spectra of an average of 914 calorimeters per dataset. Because of differences in the detector operating conditions and intrinsic characteristics of the calorimeters, data acquisition is performed for each dataset-calorimeter independently. For this reason, our energy reconstruction framework is largely automated and flexible to accommodate the number of calorimeters and their different characteristics [41]. Figure 2 demonstrates the uniformity of the analyzed exposure distribution over all 988 calorimeters, which highlights the effectiveness of our analysis framework and its ability to adapt to each calorimeter. The steady and uniform TeO2 exposure accumulation of CUORE over time is shown in Fig. 2.
The typical response of CUORE calorimeters to particles impinging on the crystals is of order 100 V/MeV. The frequency bandwidth of the corresponding pulses is 0 – 20 Hz, while the noise components extend to higher frequencies as shown in Fig. 6. The main sources of environmental noise that can degrade our detector energy resolution are electrical interference, mechanical vibrations, and microphonic noise [20]. Microphones, low-frequency accelerometers, and a triaxial seismometer have been installed in the proximity of the cryostat over the years to independently measure the vibrational and acoustic noise, covering a frequency range between 0.1 Hz – 1 kHz. For each dataset, a subset of these devices are used in our denoising algorithm [43]; the selection is based on the device availability and signal quality. New to this analysis, our denoising procedure combines the device measurements with the noise extracted from the calorimeter readout to build a multivariate nonlinear offline noise cancellation algorithm. The algorithm predicts the environmental-induced noise and subtracts it from the calorimeter measurement [44].
To identify pulses and classify them as events for the energy reconstruction, we apply a low-threshold trigger, called optimal trigger (OT) [45], to the denoised data. Then, to measure the pulse amplitude more accurately, we filter events with the optimal (matched) filter (OF) [46] that maximizes the signal-to-noise ratio by exploiting the distinct shapes of the stochastic noise and the particle-induced signal power spectra. Since fluctuations in the baseline temperature can affect the pulse amplitude measurement thereby degrading our energy resolution, we use events corresponding to fixed energy depositions (i.e., heater-induced or gamma peak-based) to characterize and correct for this effect. To convert the corrected amplitude measurements to energy, we use calibration data to correlate the peak positions in the amplitude spectrum with the gamma-ray emissions of the deployed radioactive sources [47].
Our segmented detector design enables us to perform coincidence-based event selections. Monte Carlo simulations indicate that 88% of decay events are contained in a single crystal while events induced by crystal surface radioactivity and gamma rays undergoing Compton scattering could deposit energy in multiple crystals. Therefore, we remove events depositing 40 keV in more than one crystal within 5 ms of each other [9]. This time interval is a compromise between the time resolution of our detectors and the rate of random coincidences.
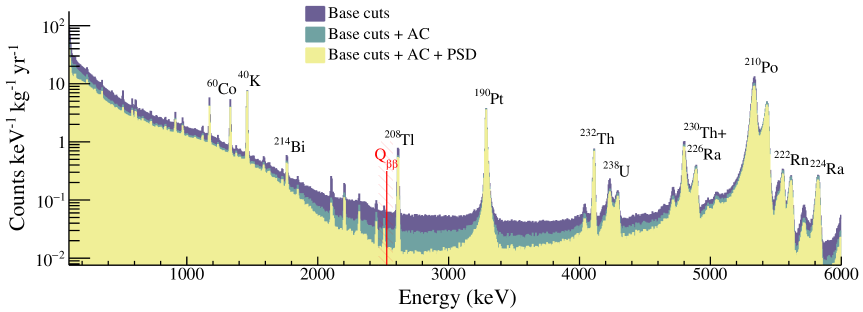
As a way to select reliable decay candidate events, we perform pulse shape discrimination (PSD) to reject pulses with irregular shapes that are likely to result in energy misreconstruction. For each event, we evaluate the Reconstruction Error (RE), a metric from principal component analysis [48], to identify and reject noisy and unphysical events. Figure 7 shows the energy spectrum after applying the aforementioned event selections.
Detector response
After selecting the events to build the spectrum for our decay search, we blind our data by exchanging a random fraction (10) of events between the 2615 keV peak and to produce an artificial signal peak. Using the blinded data, we fit a model that reflects the background in the ROI and the posited peak to an energy region of interest (ROI) of [2465,2575] keV. This procedure leads to an unbiased optimization of the fit.
To determine the detector response of the individual calorimeters in our model, we use gamma peaks in both calibration and physics data [44]. We evaluate the expected shape of a monoenergetic peak at by fitting the high-statistics 2615 keV peak in calibration data (Fig. 8). Combining the fit results from all calorimeters and datasets, we obtain an exposure-weighted harmonic mean FWHM energy resolution of (7.540 0.024) keV at the 2615 keV calibration peak. Figure 3 shows the uniform spread of the FWHM resolution over all calorimeters and datasets included in this analysis, which underlines the efficacy of our analysis infrastructure and long-term reliability of our system.
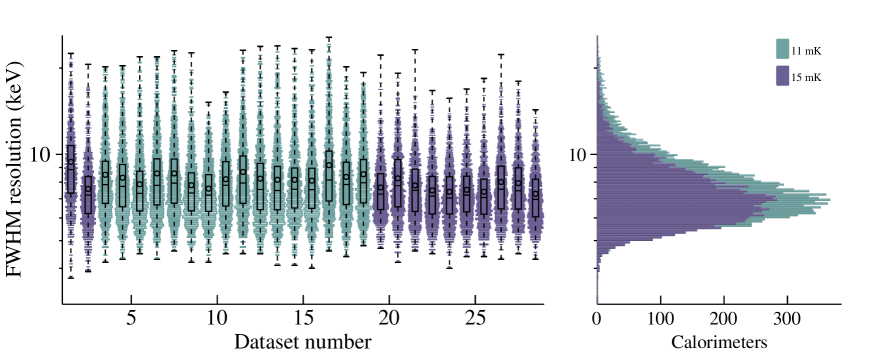
When fitting the peaks in physics data, we maintain the calorimeter-dependence of the detector response by parametrizing the peak resolution and position in terms of the calibration-based fit results [44]. Using the extrapolation of the energy resolution to for each dataset-calorimeter, we report an exposure-weighted harmonic mean FWHM energy resolution of (7.320 0.024) keV, corresponding to 0.3% relative resolution. The calibration bias, defined as the difference between the reconstructed and nominal peak energy, is 0.52 keV at .
Search for decay
After performing all selection cuts, the remaining data correspond to 2039.0 kgyr TeO2 (567.0 kgyr 130Te) exposure. To search for decay, we evaluate the number of events above background at —i.e., 2527.5 keV. We limit our search to the ROI which contains a total of 3504 events. The range is chosen to be wide enough to contain adequate background statistics while excluding unnecessary nuisance radioactive peaks. The background in the ROI includes a peak at 2505.7 keV from the simultaneous absorption of two gamma rays from 60Co and a uniform background predominantly from degraded alpha particles from surface contamination, with a contribution from multi-Compton scattering of 2615 keV gamma rays [9].
We model the spectrum in the ROI as the sum of a peak, a dataset-dependent uniform background, and a time-dependent 60Co sum peak and perform an unbinned Bayesian fit. We use our dataset-calorimeter evaluation of the detector efficiencies and detector response as priors in the fit, where the detection efficiency is evaluated as the product of the containment efficiency, the reconstruction efficiency, the anti-coincidence efficiency, and the pulse shape discrimination efficiency [44]. Their values are summarized in Table 1. Systematic effects are included as additional nuisance parameters [44]. The fit in the ROI is shown in Fig. 4.
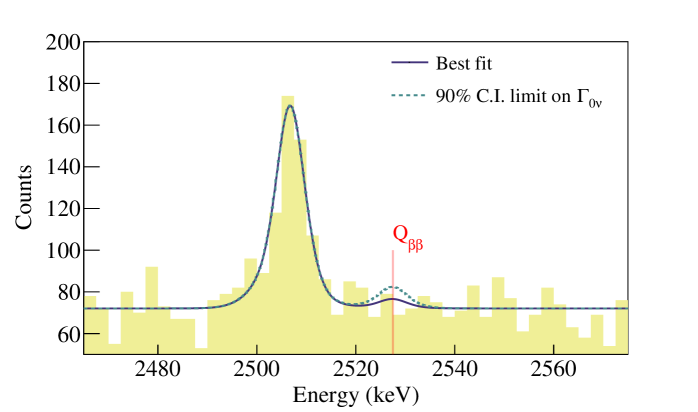
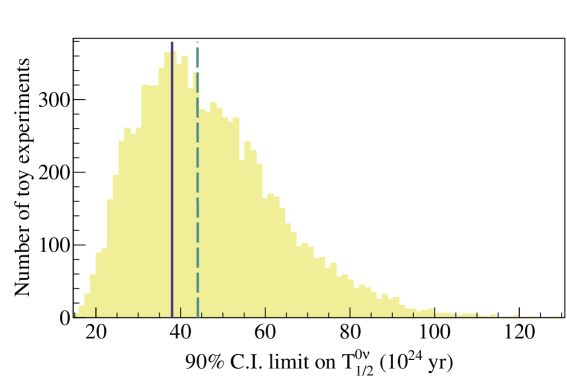
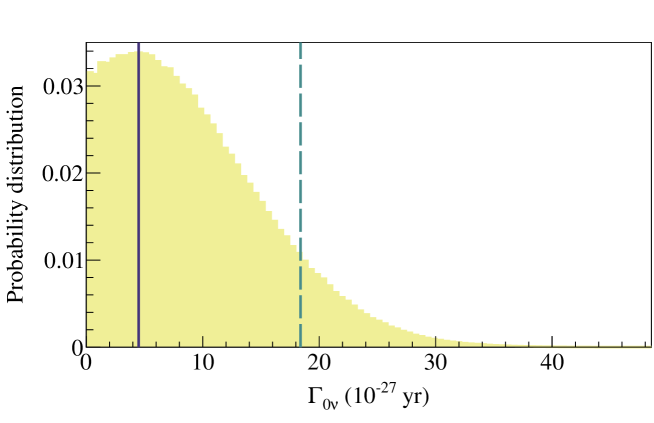
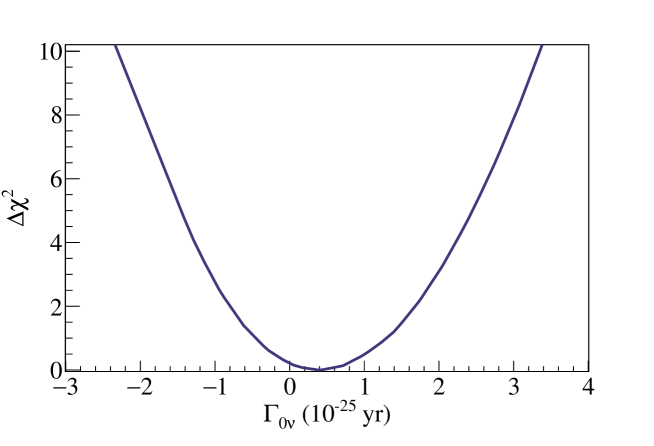
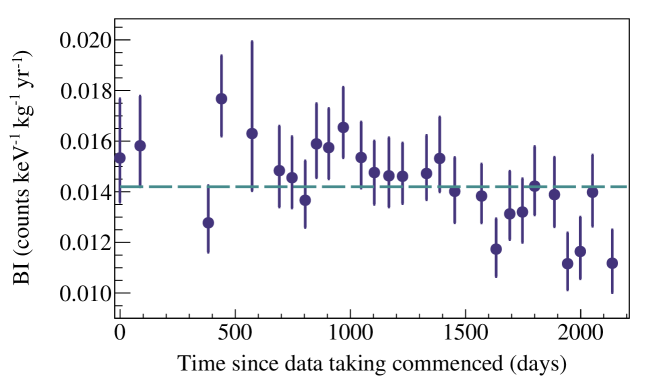
We observe no statistically significant evidence of decay and report a best-fit decay rate of 4.5 (stat.+syst.) 10-27 yr-1 and set a limit on the decay rate of 1.8 10-26 yr-1 at 90% credibility interval (C.I.) corresponding to a decay half-life limit of 3.8 1025 yr (90% C.I.) (Fig. 9). We also perform a frequentist fit and using the Rolke method [49], set a half-life limit of 3.7 1025 yr at 90% confidence level (C.L.) (Fig. 10), which is compatible with the Bayesian fit result. Using the background-only hypothesis to fit the ROI, we obtain a background index (BI) for each dataset (Fig. 11) with an exposure-weighted mean of (1.42 0.02) counts keV-1kg-1yr-1. We use the BIs to extract a median exclusion sensitivity of 4.4 1025 yr (90% C.I.) (Fig. 12) [44]. Compared to this value, the probability of obtaining a stronger limit is 67%.
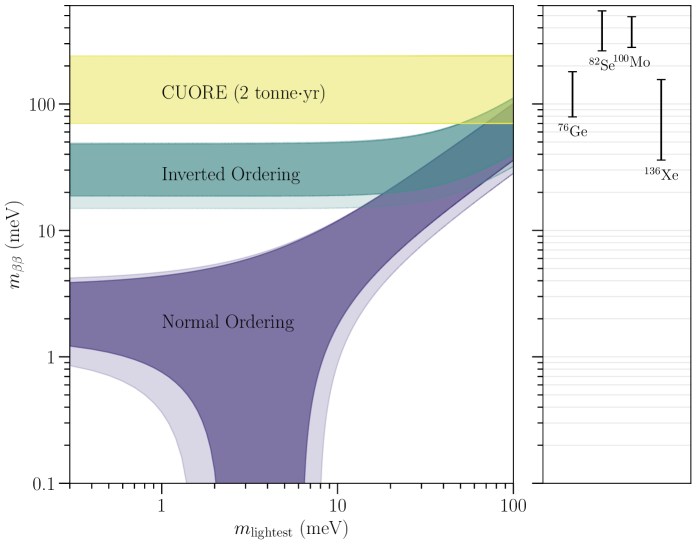
The simplest model that is commonly used to compare decay search results across isotopes is the light-neutrino exchange model [11] from which we extract an effective Majorana neutrino mass (). Thus, we place a limit of 70 – 240 meV, where the spread comes from the range of different nuclear model parameters currently available in the literature [50, 51, 52, 53, 54, 55, 56, 57, 58]. The CUORE limit, along with the most stringent constraints obtained with other isotopes are shown in Fig. 5.
Impact
CUORE has demonstrated over 5 years stable operation of an array of 988 cryogenic calorimeters and will continue taking data until reaching 3 tonneyr (1 tonneyr) analyzed TeO2 Te exposure. With our current analyzed exposure of 2039.0 kgyr, we have demonstrated an efficient analysis framework for processing the continuous data stream of 1000 cryogenic calorimeters reaching 4 years total livetime. Furthermore, the limit we extracted is the most stringent on the decay half-life of 130Te. The instrumentation and the analysis infrastructure developed in this work not only enables a world-leading decay search, but also establishes large-volume cryogenic calorimetry as a unique path for a future multi-isotope decay search program.
After CUORE reaches its target exposure, the experiment will begin phase II and pivot its primary focus to low-energy processes. This phase is motivated by the knowledge gained from our new denoising algorithm, which indicates the sources of noise and their impact on our detector performance. With our current denoising and OT algorithms, our detector energy thresholds reach values as low as a few keV. This, in combination with its ultra-low background and large detector mass, enables us to search for dark matter interactions via solar axions or WIMP scattering, supernova neutrinos, and other rare low-energy processes with CUORE [61]. To increase the experimental reach of phase II, we will perform an upgrade of the cryogenic infrastructure. This includes new pulse tubes (PTs) with higher cooling power which would allow us to reduce the number of required PTs on the cryostat. The resulting configuration would decrease the amount of vibrations injected in the system and thereby lower the detector energy thresholds. Data taking for phase II is planned to begin in 2026.
CUORE phase II will be followed by the commissioning of CUPID (CUORE Upgrade with Particle IDentification) [62], a next-generation experiment that will search for decay in 100Mo. The CUPID detector is designed to improve upon our sensitivity by a factor of 5, deeply probing the inverted mass ordering parameter space assuming the light-neutrino exchange model. If CUPID discovers decay, it would confirm the Majorana nature of the neutrino and compel precise measurements of decay across multiple isotopes making cryogenic calorimeters all the more relevant. Since CUPID will use the same detection technique and will be hosted in the CUORE cryogenic facility, the experiment will inherit a well-understood system and have working knowledge of the cryostat operations, background, and noise from CUORE. As the first experiment of its scale to demonstrate the success of this detection technique, CUORE has laid the groundwork not only for CUPID, but all future large-array cryogenic-calorimeter-based experiments.
References
- [1] A. D. Sakharov. Violation of CP Invariance, C asymmetry, and baryon asymmetry of the universe. Pisma Zh. Eksp. Teor. Fiz., 5:32–35, 1967.
- [2] E. Majorana. Theory of the Symmetry of Electrons and Positrons (in Italian). Nuovo Cim., 14:171–184, 1937.
- [3] M. Goeppert-Mayer. Double Beta-Disintegration. Phys. Rev., 48:512–516, 1935.
- [4] W. H. Furry. On Transition Probabilities in Double Beta-Disintegration. Phys. Rev., 56:1184–1193, 1939.
- [5] R. L. Workman et al. Review of Particle Physics. PTEP, 2022:083C01, 2022.
- [6] C. Augier, A. S. Barabash, F. Bellini, G. Benato, and et al. Measurement of the Decay Rate and Spectral Shape of from the CUPID-Mo Experiment. Phys. Rev. Lett., 131:162501, Oct 2023.
- [7] C. Augier et al. Measurement of the 2 Decay Rate and Spectral Shape of Mo100 from the CUPID-Mo Experiment. Phys. Rev. Lett., 131(16):162501, 2023.
- [8] O. Azzolini et al. Measurement of the 2 Decay Half-Life of 82Se with the Global CUPID-0 Background Model. Phys. Rev. Lett., 131(22):222501, 2023.
- [9] D. Q. Adams, C. Alduino, K. Alfonso, F. T. Avignone, and et al. Erratum: Measurement of the Decay Half-Life of with CUORE [Phys. Rev. Lett. 126, 171801 (2021)]. Phys. Rev. Lett., 131:249902, Dec 2023.
- [10] Michelle J. Dolinski, Alan W.P. Poon, and Werner Rodejohann. Neutrinoless Double-Beta Decay: Status and Prospects. Ann. Rev. Nucl. Part. Sci., 69(1):219–251, 2019.
- [11] Matteo Agostini, Giovanni Benato, Jason A. Detwiler, Javier Menéndez, and Francesco Vissani. Toward the discovery of matter creation with neutrinoless decay. Rev. Mod. Phys., 95(2):025002, 2023.
- [12] E. Fiorini and T. O. Niinikoski. Low temperature calorimetry for rare decays. Nucl. Instrum. Meth. A, 224:83, 1984.
- [13] Chiara Brofferio and Stefano Dell’Oro. Contributed review: The saga of neutrinoless double beta decay search with TeO2 thermal detectors. Rev. Sci. Instrum., 89(12):121502, 2018.
- [14] D. Q. Adams et al. CUORE opens the door to tonne-scale cryogenics experiments. Prog. Part. Nucl. Phys., 122:103902, 2022.
- [15] D. Q. Adams et al. Search for Majorana neutrinos exploiting millikelvin cryogenics with CUORE. Nature, 604(7904):53–58, 2022.
- [16] O. Azzolini et al. Final Result on the Neutrinoless Double Beta Decay of 82Se with CUPID-0. Phys. Rev. Lett., 129(11):111801, 2022.
- [17] C. Augier, A. S. Barabash, F. Bellini, and G. et al. Benato. Final results on the decay half-life limit of mo from the cupid-mo experiment. Eur. Phys. J. C, 82(11):1033, 2022.
- [18] V. Alenkov, H. W. Bae, J. Beyer, and R. S. et al. Boiko. First results from the AMoRE-Pilot neutrinoless double beta decay experiment. Eur. Phys. J. C, 79(9), SEP 2019.
- [19] O. Cremonesi and M. Pavan. Challenges in Double Beta Decay. Adv. High Energy Phys., 2014:951432, 2013.
- [20] C. Alduino et al. The CUORE cryostat: An infrastructure for rare event searches at millikelvin temperatures. Cryogenics, 102:9–21, 2019.
- [21] D. Q. Adams et al. Measurement of the decay half-life of with CUORE. Phys. Rev. Lett., 126(17):171801, 2021. [Erratum: Phys. Rev. Lett. 131, 249902 (2023)].
- [22] D. Q. Adams et al. Search for double-beta decay of to the states of with CUORE. Eur. Phys. J. C, 81(7):567, 2021.
- [23] D. Q. Adams, C. Alduino, K. Alfonso, and F. T. et al. Avignone. Search for neutrinoless ec decay of with cuore. Phys. Rev. C, 105:065504, Jun 2022.
- [24] D. Q. Adams, C. Alduino, K. Alfonso, F. T. Avignone, and et al. New direct limit on neutrinoless double beta decay half-life of with cuore. Phys. Rev. Lett., 129:222501, Nov 2022.
- [25] S. Rahaman, V. V. Elomaa, T. Eronen, J. Hakala, A. Jokinen, A. Kankainen, J. Rissanen, J. Suhonen, C. Weber, and J. yst. Double-beta decay Q values of 116Cd and 130Te. Phys. Lett. B, 703:412–416, 2011.
- [26] G. Bellini et al. Cosmic-muon flux and annual modulation in Borexino at 3800 m water-equivalent depth. J. Cosmol. Astropart. Phys., 05:015, 2012.
- [27] H. Wulandari, J. Jochum, W. Rau, and F. von Feilitzsch. Neutron flux at the Gran Sasso underground laboratory revisited. Astropart. Phys., 22:313–322, 2004.
- [28] L. Pattavina, J. W. Beeman, M. Clemenza, O. Cremonesi, E. Fiorini, L. Pagnanini, S. Pirro, C. Rusconi, and K. Schäffner. Radiopurity of an archeological roman lead cryogenic detector. Eur. Phys. J. A, 55:127, 2019.
- [29] D. Q. Adams et al. Data-driven background model for the cuore experiment. 2024. Paper in preparation.
- [30] F. Alessandria et al. Validation of techniques to mitigate copper surface contamination in CUORE. Astropart. Phys., 45:13–22, 2013.
- [31] E. Buccheri, M. Capodiferro, S. Morganti, F. Orio, A. Pelosi, and V. Pettinacci. An assembly line for the construction of ultra-radio-pure detectors. Nucl. Instrum. Meth. A, 768:130–140, 2014.
- [32] G. Benato et al. Radon mitigation during the installation of the CUORE 0 decay detector. J. Instrum., 13(01):P01010, 2018.
- [33] E. E. Haller, N. P. Palaio, M. Rodder, W. L. Hansen, and E. Kreysa. NTD Germanium: A Novel Material for Low Temperature Bolometers, pages 21–36. Springer US, Boston, MA, 1984.
- [34] C. Alduino et al. CUORE-0 detector: design, construction and operation. J. Instrum., 11(07):P07009, 2016.
- [35] E. Andreotti, C. Brofferio, L. Foggetta, A. Giuliani, B. Margesin, C. Nones, M. Pedretti, C. Rusconi, C. Salvioni, and M. Tenconi. Production, characterization, and selection of the heating elements for the response stabilization of the CUORE bolometers. Nucl. Instrum. Meth. A, 664:161–170, 2012.
- [36] K. Alfonso, L. Cassina, A. Giachero, C. Gotti, G. Pessina, and P. Carniti. A high precision pulse generation and stabilization system for bolometric experiments. J. Instrum., 13(02):P02029, 2018.
- [37] C. Arnaboldi, P. Carniti, L. Cassina, C. Gotti, X. Liu, M. Maino, G. Pessina, C. Rosenfeld, and B.X. Zhu. A front-end electronic system for large arrays of bolometers. J. Instrum., 13(02):P02026, 2018.
- [38] A. Alessandrello, C. Brofferio, D.V. Camin, O. Cremonesi, A. Giuliani, M. Pavan, G. Pessina, and E. Previtali. An electrothermal model for large mass bolometric detectors. IEEE Transactions on Nuclear Science, 40(4):649–656, 1993.
- [39] C. Arnaboldi, M. Cariello, S. Di Domizio, A. Giachero, and G. Pessina. A programmable multichannel antialiasing filter for the cuore experiment. Nuclear Instruments and Methods in Physics Research Section A: Accelerators, Spectrometers, Detectors and Associated Equipment, 617(1):327–328, 2010. 11th Pisa Meeting on Advanced Detectors.
- [40] S. Di Domizio, A. Branca, A. Caminata, L. Canonica, S. Copello, A. Giachero, E. Guardincerri, L. Marini, M. Pallavicini, and M. Vignati. A data acquisition and control system for large mass bolometer arrays. J. Instrum., 13(12):P12003, 2018.
- [41] Krystal Alfonso, Carlo Bucci, Lucia Canonica, Paolo Carniti, Sergio Di Domizio, Andrea Giachero, Claudio Gotti, Laura Marini, Irene Nutini, and Gianluigi Pessina. An automated system to define the optimal operating settings of cryogenic calorimeters. Nucl. Instrum. Meth. A, 1008:165451, 2021.
- [42] D. Q. Adams et al. Improved Limit on Neutrinoless Double-Beta Decay in 130Te with CUORE. Phys. Rev. Lett., 124(12):122501, 2020.
- [43] Kenneth J. Vetter et al. Improving the performance of cryogenic calorimeters with nonlinear multivariate noise cancellation algorithms. Eur. Phys. J. C, 84(3):243, 2024.
- [44] See supplementary materials.
- [45] S. Di Domizio, F. Orio, and M. Vignati. Lowering the energy threshold of large-mass bolometric detectors. J. Instrum., 6:P02007, 2011.
- [46] E. Gatti and P. F. Manfredi. Processing the signals from solid state detectors in elementary particle physics. Riv. Nuovo Cim., 9:1–146, 1986.
- [47] C. Alduino et al. First Results from CUORE: A Search for Lepton Number Violation via Decay of . Phys. Rev. Lett., 120(13):132501, 2018.
- [48] R. Huang et al. Pulse shape discrimination in CUPID-Mo using principal component analysis. J. Instrum., 16(03):P03032, Mar 2021.
- [49] Wolfgang A. Rolke and Angel M. López. Confidence intervals and upper bounds for small signals in the presence of background noise. Nucl. Instrum. Methods Phys. Res. A: Accel. Spectrom. Detect. Assoc. Equip., 458(3):745–758, 2001.
- [50] Nuria López Vaquero, Tomás R. Rodríguez, and J. Luis Egido. Shape and pairing fluctuations effects on neutrinoless double beta decay nuclear matrix elements. Phys. Rev. Lett., 111(14):142501, 2013.
- [51] Juhani Hyvärinen and Jouni Suhonen. Nuclear matrix elements for decays with light or heavy Majorana-neutrino exchange. Phys. Rev., C91(2):024613, 2015.
- [52] Mihai Horoi and Andrei Neacsu. Shell model predictions for double- decay. Phys. Rev. C, 93:024308, Feb 2016.
- [53] L. S. Song, J. M. Yao, P. Ring, and J. Meng. Nuclear matrix element of neutrinoless double- decay: Relativity and short-range correlations. Phys. Rev. C, 95:024305, Feb 2017.
- [54] J Menéndez. Neutrinoless decay mediated by the exchange of light and heavy neutrinos: the role of nuclear structure correlations. Journal of Physics G: Nuclear and Particle Physics, 45(1):014003, dec 2017.
- [55] Dong-Liang Fang, Amand Faessler, and Fedor Šimkovic. -decay nuclear matrix element for light and heavy neutrino mass mechanisms from deformed quasiparticle random-phase approximation calculations for , and with isospin restoration. Phys. Rev. C, 97:045503, Apr 2018.
- [56] Fedor Šimkovic, Adam Smetana, and Petr Vogel. and nuclear matrix elements evaluated in closure approximation, neutrino potentials and su(4) symmetry. Phys. Rev. C, 98:064325, Dec 2018.
- [57] L. Coraggio, A. Gargano, N. Itaco, R. Mancino, and F. Nowacki. Calculation of the neutrinoless double- decay matrix element within the realistic shell model. Phys. Rev. C, 101:044315, Apr 2020.
- [58] Frank F. Deppisch, Lukas Graf, Francesco Iachello, and Jenni Kotila. Analysis of light neutrino exchange and short-range mechanisms in decay. Phys. Rev. D, 102:095016, Nov 2020.
- [59] M. Agostini et al. Final Results of GERDA on the Search for Neutrinoless Double- Decay. Phys. Rev. Lett., 125:252502, Dec 2020.
- [60] S. Abe et al. Search for the Majorana Nature of Neutrinos in the Inverted Mass Ordering Region with KamLAND-Zen. Phys. Rev. Lett., 130(5):051801, 2023.
- [61] C. Alduino et al. Low energy analysis techniques for CUORE. Eur. Phys. J. C, 77(12):857, 2017.
- [62] W. R. Armstrong et al. CUPID pre-CDR, 7 2019.
- [63] A. Caldwell, D. Kollár, and K. Kröninger. BAT - The Bayesian analysis toolkit. Computer Physics Communications, 180:2197–2209, Nov 2009.
- [64] S. Agostinelli et al. GEANT4–a simulation toolkit. Nucl. Instrum. Meth. A, 506:250–303, 2003.
- [65] C. Alduino et al. Measurement of the two-neutrino double-beta decay half-life of 130Te with the CUORE-0 experiment. Eur. Phys. J. C, 77(1):13, 2017.
- [66] M. Redshaw, B. J. Mount, E.G. Myers, and F. T. Avignone. Masses of Te-130 and Xe-130 and Double--Decay Q Value of Te-130. Phys. Rev. Lett., 102:212502, 2009.
- [67] M. A. Fehr, M. Rehkamper, and A. N. Halliday. Application of MC-ICPMS to the precise determination of tellurium isotope compositions in chondrites, iron meteorites and sulfides. Int. J. Mass Spectrometry, 232:83–94, 2004.
- [68] S. S. Wilks. The Large-Sample Distribution of the Likelihood Ratio for Testing Composite Hypotheses. Annals Math. Statist., 9(1):60–62, 1938.
Acknowledgments
The CUORE Collaboration thanks the directors and staff of the Laboratori Nazionali del Gran Sasso and the technical staff of our laboratories. This work was supported by the Istituto Nazionale di Fisica Nucleare (INFN); the National Science Foundation under Grant Nos. NSF-PHY-0605119, NSF-PHY-0500337, NSF-PHY-0855314, NSF-PHY-0902171, NSF-PHY-0969852, NSF-PHY-1307204, NSF-PHY-1314881, NSF-PHY-1401832, and NSF-PHY-1913374; Yale University, Johns Hopkins University, and University of Pittsburgh. This material is also based upon work supported by the US Department of Energy (DOE) Office of Science under Contract Nos. DE-AC02-05CH11231 and DE-AC52-07NA27344; by the DOE Office of Science, Office of Nuclear Physics under Contract Nos. DE-FG02-08ER41551, DE-FG03-00ER41138, DE- SC0012654, DE-SC0020423, DE-SC0019316. This research used resources of the National Energy Research Scientific Computing Center (NERSC). This work makes use of both the DIANA data analysis and APOLLO data acquisition software packages, which were developed by the CUORICINO, CUORE, LUCIFER, and CUPID-0 Collaborations. The authors acknowledge Advanced Research Computing at Virginia Tech for providing computational resources and technical support that have contributed to the results reported within this paper.
Supplementary Materials
Denoising
For this analysis, CUORE uses a nonlinear multivariate noise cancellation algorithm to reduce vibrationally-induced noise that can degrade the detector resolution and energy thresholds [43]. The algorithm is designed to take concurrent measurements of nearby environmental noise and noise from the calorimeter readout as inputs and build a transfer function to use as a filter. By applying the filter to the environmental noise, the algorithm predicts the effects of vibrational noise on our calorimeter data stream. This prediction is subtracted from the actual calorimeter data to obtain our denoised data.
We installed microphones around the croystat in 2017 and expanded the array of auxiliary devices to include three low-frequency accelerometers in 2020. In 2023, we installed a triaxial seismometer and three additional accelerometers. For each dataset, we use a subset of these auxiliary devices, each placed around the cryostat, to measure the environmental noise, while noise from the calorimeter readout is taken as noise events—i.e., random samples of the data stream where no pulse is present. In order to correlate the noise with frequency, we take the discrete Fourier transform of each calorimeter noise event () and each concurrent auxiliary device measurement () and convolve their spectral densities. The algorithm uses both the correlated noise between the different auxiliary devices (Eq. 1) and the correlated noise between each auxiliary device and calorimeter noise (Eq. 2):
| (1) |
| (2) |
For each calorimeter, we then calculate the transfer function () as
| (3) |
and the result of denoising () the calorimeter measurement () as
| (4) |
where the transfer function is only applied to calorimeter measurements taken during the same time period as the noise measurements used to construct . This time frame is chosen to be 24 hours, so the algorithm is guaranteed to be responsive to daily variations in noise sources.
The combination of the aforementioned auxiliary devices is able to measure frequencies between 0.1 Hz – 1 kHz [43], which covers the frequency bandwidth of particle-induced pulses between 0 Hz – 20 Hz. Figure 6 shows the effect of the algorithm on the average noise power spectrum (ANPS) for a single calorimeter, representative of the subgroup of calorimeters most susceptible to high vibrational noise.
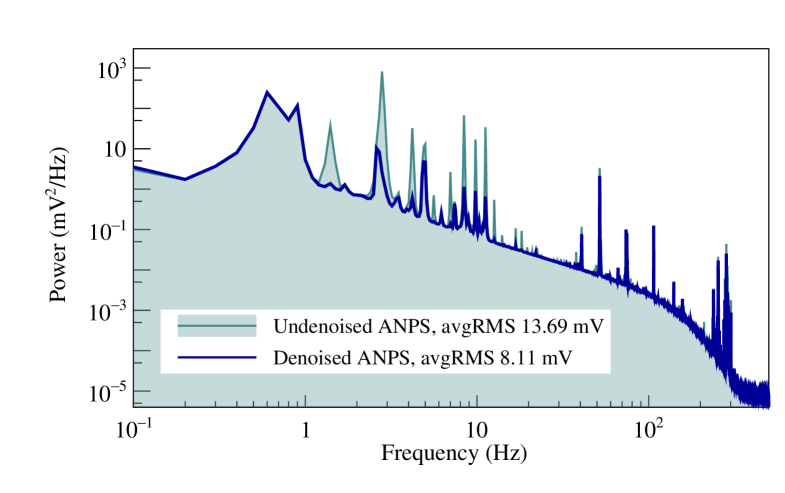
The reduced amplitudes of the peaks at 1.4 Hz and its harmonics after denoising shows the effectiveness of the algorithm on even the noisiest of calorimeters. In the time since we collected the datasets included in this analysis, to study additional sources of noises, we have further expanded our set of auxiliary devices to include electromagnetic interference (EMI) antennas and upgraded the hardware to improve their quality in the frequency regions of interest.
Event selection
Detector response evaluation at
The detector response function of a monoenergetic peak is modeled empirically after the high-statistics 2615 keV 208Tl photopeak in calibration data as the superposition of three Gaussians that share the same width but have different amplitudes and slightly shifted peak positions (Eq. 5). In the model, the parameters tune the amplitudes of the sub-peaks with respect to the main peak, whereas the and parameters tune the positions of the means of the sub-peaks with respect to the main peak.
| (5) |
where is a normalized Gaussian distribution with mean and standard deviation . Thus, the normalized response function of each calorimeter in each dataset is completely defined by 6 parameters: , , , . We include other components to properly model the energy spectrum near 2615 keV: a multi-Compton scatter contribution; an X-ray escape peak, corresponding to a 2615 keV -ray deposit followed by the escape of one of the 27 – 31 keV Te X-rays; an X-ray coincidence peak, corresponding to a 2615 keV ray fully absorbed at the same time as a Te X-ray emitted from a nearby crystal; a coincidence peak at 2687 keV resulting from the simultaneous absorption of 2615 keV and 583 keV rays from 208Tl, followed by escape of a 511 keV annihilation ray; and a uniform background. Due to the lower statistics of these additional components, to constrain their corresponding nuisance parameters, we estimate the response function for each calorimeter in each dataset with a simultaneous, unbinned extended maximum likelihood fit performed on each tower in the energy range [2530,2720] keV. The result of the fit with a breakdown of the fit model is shown in Fig. 8.
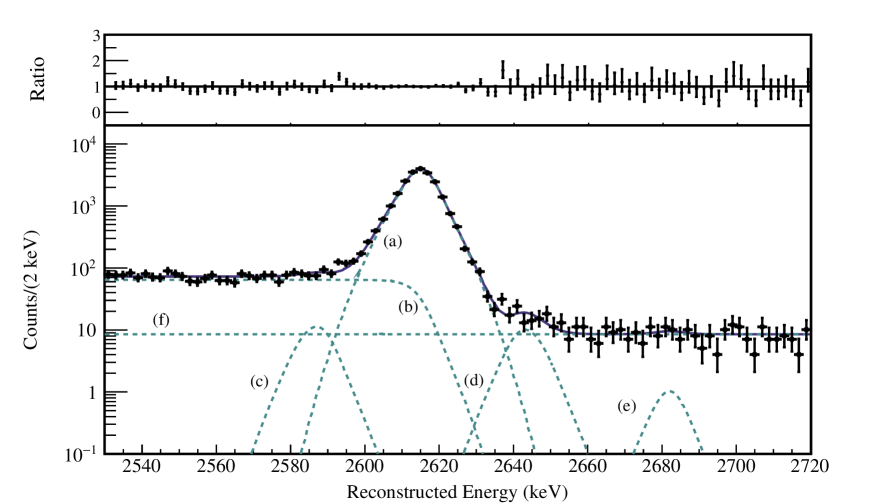
Compared to our previous analysis [15], we improved the procedure to fit the lateral sub-peaks by allowing the amplitude and mean ranges to vary after the first fit iteration and omitting any of the lateral sub-peaks in subsequent fit iterations if the relative amplitude was below a set threshold. This means that the photopeak was not constrained to be a triple-Gaussian for every calorimeter, but could also be described with a single- or double-Gaussian. This helped reduce the number of fit parameters as well as the number of iterations required to reach convergence, expediting the whole process.
Since we rely on physics data for our decay search, we fit our calibration-based peak-shape model to the most prominent gamma peaks in physics data using the extracted model parameters above and determine their energy resolutions and positions. For each peak-dataset, we perform the fit simultaneously over all calorimeters in the dataset to ensure adequate statistics. We parametrize the energy resolution and peak position in terms of the calibration-based, calorimeter-dependent detector response parameters, and , where identifies the calorimeter. The resolution is modeled as where identifies a peak of a particular energy, represents the baseline resolution measured from noise events from physics data or calibration data, and is a dataset-dependent global parameter common to all calorimeters. Compared to the model used in our previous analyses, the one described here better captures the actual energy-dependent scaling terms by introducing the intrinsic resolution terms, . The peak position is parameterized as where identifies a peak of a particular energy and is a dataset-dependent global parameter common to all calorimeters. In order to determine the detector response at , we model both and the calibration bias, , defined as the difference between the reconstructed and nominal peak energy, as functions of energy, with being described by a phenomenological function that asymptotes to a quadratic polynomial around (paper in preparation), and likewise being parametrized by a quadratic polynomial.
Statistical analysis for decay search
In order to search for an excess of events at , we perform an unbinned Bayesian fit in the ROI using BAT [63]. For each calorimeter and dataset, we model the spectrum in the ROI as the superposition of a signal (), a 60Co background peak (), and a flat background (), and the expectation value of the number of events in the ROI as . The signal 60Co background peak is modeled for each active calorimeter, individually, as , where has the same form as Eq. 5, but with the mean and variance projected to (2505.7 keV). An additional constraint on the rate of 60Co is placed at the dataset-level to ensure that the decay follows its known half-life. In order to minimize the computational cost of the search with a large number of parameters, we split the 28 datasets randomly into two approximately equal partitions, carry out the search separately, and combine the posteriors as shown in Fig. 9.
We use the unbinned extended likelihood
| (6) |
where the product runs over all datasets (DS) within a given partition and all active calorimeters (C). The total number of measured events in the ROI () is denoted by , the reconstructed energy for event is given by , and the model parameters are given by . By extracting the best-fit value for , we are able to place a limit on the decay signal rate (). The conversion from to for a given calorimeter accounts for its exposure, efficiency, and the total number of 130Te atoms contained. We also perform a background-only fit without the decay signal () to extract the background rate. The distribution of background indices for all datasets included in this analysis is shown in Fig. 11.
Systematics are included as nuisance parameters in the decay search. The posteriors from the fits characterizing the detector performance-related systematics (i.e., efficiencies, energy bias, and resolution scaling) are included as priors in the decay analysis. Efficiencies fall into three broad categories: containment efficiency, reconstruction efficiency, and event selection efficiency. Containment efficiency—characterizing the percentage of decay events that deposit their total energy within a crystal—is evaluated using Geant4 [64] Monte-Carlo simulations [65]. Reconstruction efficiencies encompass all relevant efficiencies at the single pulse level including the ability to trigger, reconstruct correct energies, and contain a single pulse within a window. Configurable injected heater pulses are good proxies for physical pulses and are used to evaluate the reconstruction efficiencies for each dataset-calorimeter. Selection efficiency includes anti-coincidence and pulse shape discrimination (PSD) efficiencies which express the probability of retaining signal-like events after applying the single-crystal cut and PSD cut, respectively. These are evaluated numerically at the dataset level by using known radioactive decay peaks [15]. A list of all the relevant parameters for the current analysis is provided in Table 1. We evaluate all efficiencies using a Bayesian counting analysis and combine them to obtain a probability density function for the total analysis efficiency, which is passed as a prior to the decay fit. For detector response parameters, we perform the fit of the dataset-level scaling factors for the resolution and calibration bias, and , with a Bayesian approach using BAT to obtain posterior probability distributions, which are treated as priors in the decay fit. A summary of the systematics as well as their sources and priors is shown in Table 2.
| Number of datasets | 28 |
|---|---|
| TeO2 exposure | 2039.0 kgyr |
| 130Te exposure | 567.0 kgyr |
| FWHM at 2615 keV in calibration data | 7.540(24) keV |
| FWHM at in physics data | 7.320(24) keV |
| Total analysis efficiency (data) | 93.4(18)% |
| Reconstruction efficiency | 95.624(16)% |
| Anti-coincidence efficiency | 99.80(5)% |
| PSD efficiency | 97.9(18)% |
| Containment efficiency (MC) | 88.35(9)% [34] |
| Parameter | Prior | Dependence | Source |
|---|---|---|---|
| Uniform | Global | - | |
| ECo | Uniform | Global | - |
| Uniform | Dataset | - | |
| Background index | Uniform | Dataset | - |
| 130Te | Gaussian | Global | Literature values [66] |
| Isotopic abundance | Gaussian | Global | Literature values [67] |
| Containment efficiency | Gaussian | Global | Monte-Carlo simulation |
| Total analysis efficiency | Multivariate | Dataset | Fit Posteriors |
| Energy bias and resolution | Multivariate | Dataset | Fit Posteriors |
In addition to the Bayesian analysis, we also perform a frequentist fit using the method described in [49]. For the frequentist analysis, we use the same likelihood function used for the Bayesian analysis and combine it with the Lagrange multipliers for the efficiency and detector response parameters. We first compute corresponding to the global maximum of while allowing all the parameters to float. We then scan over a range of s around and generate a distribution of as shown in Fig. 10. Assuming the validity of Wilks’ theorem [68], we extract the confidence interval in at 2.61 which corresponds to the 90% confidence level (C.L.).
Employing the same likelihood function, we also extract the experimental sensitivity. We generate 104 background-only toy Monte-Carlo experiments using the background indices discussed above. A search for the presence of is then performed using Bayesian (frequentist) analysis under the signal+background hypothesis and a 90% C.I. (C.L.) distribution on the half-life of decay is generated as shown, for the Bayesian approach, in Fig. 12. Given the median of the distribution—called the exclusion sensitivity—at 4.4 1025 yr (4.7 1025yr), the probability of obtaining a more stringent limit is given by 67% (67%) using the Bayesian (frequentist) analysis. We also generate decay signal-inclusive toy Monte-Carlo experiments over the range of 1 10-26 – 1 10-25 yr—corresponding to the range of 6.9 1024 – 6.9 1025 yr— and perform a frequentist decay-inclusive fit to extract the median decay discovery sensitivity of 2.7 1025 yr (3 C.L.)—a value 1.8 times weaker than the frequentist exclusion sensitivity.