Numerical study of neutral and charged microgel suspensions:
from single-particle to collective behavior
Abstract
We perform extensive Molecular Dynamics simulations of an ensemble of realistic microgel particles in swollen conditions in a wide range of packing fractions . We compare neutral and charged microgels, where we consider charges distribution adherent to experimental conditions. Through a detailed analysis of single-particle behavior, we are able to identify the different regimes occurring upon increasing concentration: from shrinking to deformation and interpenetration, always connecting our findings to available experimental observations. We then link these single-particle features to the collective behavior of the suspension, finding evidence of a structural reentrance, that has no counterpart in the dynamics. Hence, while the maximum of the radial distribution function displays a non-monotonic behavior with increasing , the dynamics, quantified by the microgels’ mean-squared displacement, always slows down. Key similarities and differences between neutral and charged microgels are identified. Importantly, at high enough we also detect the fusion of the shells of charged microgels, that was previously invoked to explain key experimental findings. This highlights the fact that even for standard poly(N-isopropylacrylamide) microgels, commonly considered as a prototype of soft colloid, charge effects are relevant. Overall, our study establishes a powerful framework to uncover the physics of microgel suspensions under several different conditions. Indeed, it can be readily extended to tackle different regimes, e.g. high temperature, and systems, e.g. complex microgel topologies such as ultra-low-crosslinked ones, where experimental evidence is still limited.
I Introduction
Nowadays, a variety of colloidal particles can be synthesized, with different shape, internal composition and/or mutual interactions [1]. This versatility provides the possibility to control each of these properties at the single-particle level in the ultimate aim to transfer them to the macroscopic scale through a bottom-up approach [2]. However, this last step is not always easy to perform, because it is often difficult to simultaneously obtain detailed information at both microscopic and macroscopic length scales. Thus, there is a fundamental need for investigations able to bridge such scales in order to finally predict the behavior of materials from the features of individual building blocks.
In this context, single-particle resolution experiments come at hand. This type of studies in colloidal suspensions started with confocal microscopy experiments which opened up the possibility of studying static and dynamic behavior of concentrated systems with single particle precision. For example, pioneering works revealed the role of dynamic heterogeneities in hard-sphere colloids close to the glass transition [3] or the occurrence of arrested phase separation in depletion gels [4]. More recently, the spreading of super-resolution microscopy [5] has enhanced the spatial resolution reachable in experiments, providing a new important tool which can be used either to extend the observation timescale for glassy dynamics [6] or to enable the visualization of particles inner structure [7, 8] and functionalization [9].
Among the tunable features of colloidal particles, a very important one is softness [10], which can be defined as the ratio between elastic free energy and thermal energy. Using colloids of polymeric nature, several orders of magnitude in softness can be spanned, ranging from chains to star polymers, microgels and more complex macromolecules. It thus becomes possible to investigate concentrated states well above single particle overlap. Among soft particles, microgels are colloidal-scale polymer networks dispersed in a solvent, that recently emerged as favourite model systems both for fundamental studies [11, 12] and for a variety of applications [13, 14, 15, 16]. Indeed, microgels can be made responsive to external stimuli, among which the easiest one to control is temperature. For example using a thermoresponsive polymer, such as poly(N-isopropylacrylamide) (pNIPAM), a Volume Phase Transition is observed from swollen to collapsed microgels upon increasing temperature. This is an echo of the coil-to-globule transition of the corresponding linear chains, arising as a consequence of the change in polymer-solvent affinity as temperature increases. A recent review has focused on the different experimental techniques nowadays available to quantify softness in microgels [17], highlighting the growing interest in these systems.
Upon increasing concentration, microgels undergo different regimes, where they shrink, deform or interpenetrate, forming ultradense states that have no counterpart in hard-sphere based colloids. To tackle these states, several investigations have been conducted in dense conditions to assess the properties of the overall suspensions, in particular by rheology [18, 19], imaging [20] and Dynamic Light Scattering [21]. To gain information on the single particle behavior, confocal microscopy [22] as well as a variety of neutron scattering techniques [23] has been employed. For example, in the case of responsive microgel particles, that are the focus of this work, a clever contrast-matching (Zero-Average Contrast, ZAC) [24] or selective deuteration of particles [25, 26, 27] were adopted, in order to indirectly determining the changes to their internal structure upon crowding. These measurements are nowadays complemented by a growing number of super-resolution microscopy investigations [28, 7, 29].
Despite the abundance of experimental measurements, simulation works have been so far quite scarce. Most of the works devoted to described microgel collective behavior have been based on simple coarse-grained effective models [30], starting with the widely used Hertzian model. This is a two-body potential calculated for elastic spheres at low deformation, which is known to display a so-called reentrant dynamical behavior with increasing packing fraction [31]: the (self or collective) particle relaxation initially slows down and then becomes faster again upon crowding. This counter-intuitive behavior has not been reported in microgels suspensions [21, 29], although the situation for microgels adsorbed at liquid-liquid interfaces may be interestingly different [32, 33]. This lack of non-monotonic dynamics clearly suggests that the Hertzian potential is too soft to be representative of microgels under dense conditions, as also confirmed by explicit interaction potential calculations [34]. Thus, additional contributions, describing the complex internal stucture of real microgels, should be employed to improve the description. Among the proposed possibilities to go beyond the Hertzian model, we mention the use of the phenomenological multi-Hertzian model [35], the incorporation of isotropic volume changes in the Hamiltonian [36, 37] or the development of more complex toy-models including internal elasticity [38, 39].
A different approach is instead to directly simulate realistic models of microgels at different concentrations, which is of course computationally more challenging. Only a recent study of this kind exists [40], where extensive simulations of microgels were performed with the aim to establish a relationship between the bulk modulus of the individual particles and that of the whole suspension under different density and solvent conditions. However, the performed study lacked a full control on the internal structure of the simulated microgels, consisting of homogeneous chain assemblies. Conversely, we recently developed a realistic microgel model [41], which at the individual level is able to fully capture the typical core-corona structure of PNIPAM microgels, synthesized by precipitation polymerization, that are the ones mostly used in the experiments. We showed that the model is robust to crosslinker concentration [42] and system size [43] variation, hence also microgels with few thousands monomers each are able to reproduce the main features that we aim to incorporate in the simulations. Another important point that was overlooked in Ref. [40] is that pNIPAM microgels always carry an intrinsic charge, due to the presence of ionic initiators in the synthesis. This charge is mostly screened by the counterions under dilute and swollen conditions, but several studies have highlighted the role of counterions-induced osmotic pressure on the behavior of concentrated suspensions [44, 45, 27, 46].
The present work fills the gap by performing extensive Molecular Dynamics (MD) simulations of an ensemble of realistic microgels under swollen conditions in an extended range of packing fractions. For the first time, we report numerical results of suspensions of charged microgels and carefully compare results for neutral and charged systems, highlighting the differences between them. Our study provides an extensive characterization of both individual structural properties and collective behavior as a function of increasing microgel concentration. We are thus able to address the onset and relative interplay of deswelling, faceting and interpenetration under different concentration regimes and find quantitative agreement with available super-resolution experiments. We also calculate individual microgel elasticity and connect it to the behavior of the whole suspension. We then examine in detail how the collective structure and dynamics are affected by crowding, again validating our model against experimental measurements available in the literature, clearly detecting the onset of structural reentrance, but not of a dynamical one. Both phenomena occur independently of the presence of charges, but with important differences in the microgel behavior when the latter are taken into account. Finally, we conclude by reporting a comprehensive picture of all the complex phenomena, both at single-particle and collective level, taking place in concentrated microgel suspensions, offering a clear framework to robustly interpret experimental data.
II Results
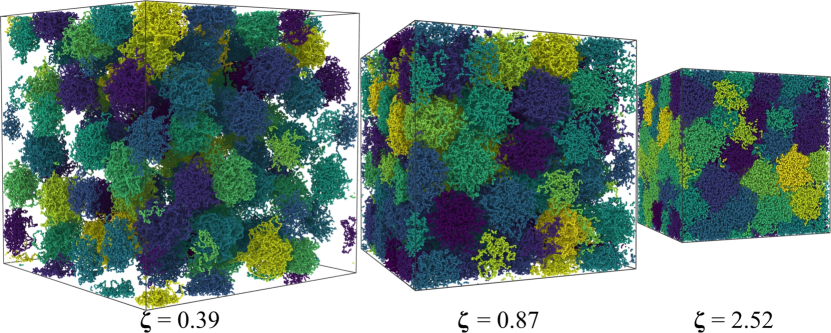
We start by reporting snapshots of the system for neutral microgels at three studied packing fractions : below random close packing, just above it and at a very high one. These are representative of the typical states encountered in the experimental phase diagram of the system: fluids, crystals111Importantly, we stress that crystallization is often difficult to detect in simulations, due to the finite system size or to the long nucleation times, also disfavoured by the polydispersity of the employed microgels, but we will return to this point at the end of the manuscript. and glasses [22], in analogy to hard sphere systems but occurring at much larger volume fractions due to the softness of the interactions. In our simulations, we find that, as soon as the packing fraction increases above random close packing, the microgels get in contact and start to accommodate themselves in order to more efficiently fill the space. This is accomplished through several different mechanisms, involving volume or shape change and, alternatively, interpenetration with other microgels. For charged microgels, similar mechanisms occur, with the main difference that non-negligible electrostatic interactions are found to play a role at all , including low ones.
II.1 Individual microgel size and structure
We initially focus on reporting the behavior of individual microgels, particularly by looking at the concentration dependence of their size and at the evolution of the internal single-particle structure quantified by the form factors (see Methods). This is a useful starting point that allows us to directly connect with small-angle neutron scattering experiments performed on hydrogenated microgels dispersed in a sea of deuterated ones [26, 27].
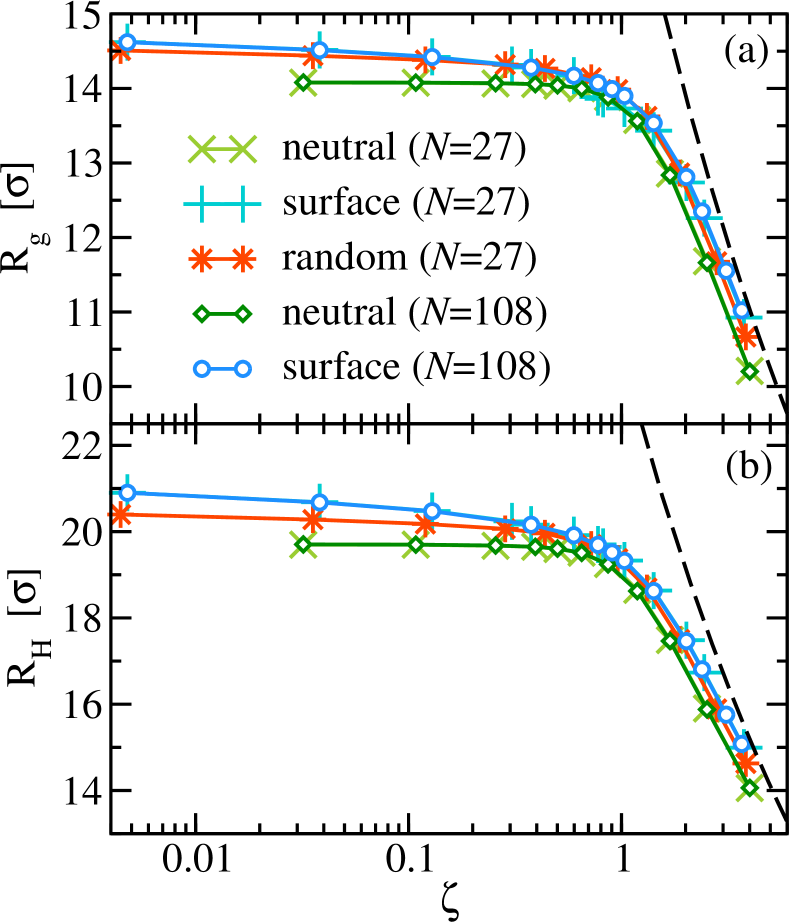
To have an estimate of the microgels size as a function of packing fraction , we calculate the gyration radius and estimate the hydrodynamic radius , both reported in Fig. 2 for neutral and charged microgels. In the figure, we also compare data obtained with a different number of microgels ( and ) and for two different charge distributions: a random one, where charges are evenly located throughout the whole microgel, and a surface one, where they are positioned on the microgel external surface [45], intended as more representative of the location of the ionic initiators after pNIPAM-based microgel synthesis.
We start by discussing results at low- for neutral microgels, where both and are found to be constant up to particle contact, corresponding to random close packing (). This clearly indicates no particle deswelling at low packing fractions, contrarily to what happens in charged microgels, irrespective of charges distribution. In this case, both observables slightly decrease already at small concentrations. Hence, although this is a minor effect of the order of 5% of the overall size of the particles, the shrinking is clearly detectable in the presence of changes, due to a variation of the screening conditions induced by counterions with increasing microgels concentration [44]. Conversely, experimental works have reported contradictory results on this point: in some cases [24, 26] a flat behavior of the particle size is reported, similarly to the neutral simulations. In particular, Ref. [24] investigates microgels in the presence of added salt, which is likely to be more similar to the neutral case examined here. Other studies instead clearly report deswelling even at low [27] as for ionic ones. In addition, a recent work on co-polymerized microgels containing pNIPAM [48] has detected quite a significant shrinking happening well below particle contact.
Focusing on larger values of , we observe a much more significant shrinking in all cases. Above contact, this is compatible with isotropic shrinking, i.e. as . The dependence on for both and indicates that, despite corresponding to quite different measures of the sizes of the microgels, they undergo a similar behavior as packing fraction increases. This is confirmed by the data obtained for different system sizes ( and ), which clearly show no dependence at all for the individual microgel size at all studied . In addition, we notice that the random case is always intermediate between neutral and surface ones, hence from now on our more extended analysis will only focus on the latter two cases.
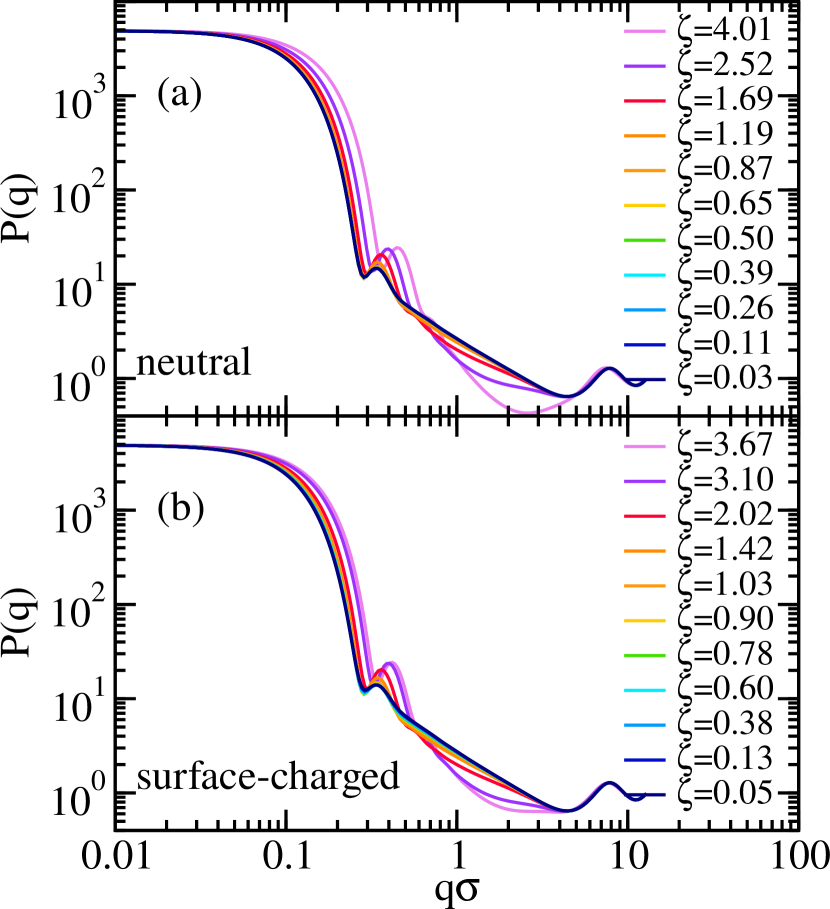
In order to make a more direct connection with experiments, we next calculate the average form factors of the individual microgels as a function of , reported in Fig. 3 for neutral and surface-charged microgels. In both cases, remains rather unchanged with increasing up to effective packing fractions close to 1. For larger , the first peak starts to move to larger values and to increase in height, with noticeable changes in the slope of data after the first peak. In this respect, the form factors start to resemble those of more collapsed microgels, possibly also deformed, as we will see later on.
To compare our results with available SAXS or SANS experiments, we fit the form factors with the extended fuzzy sphere model (Eq. IV.1), as described in Methods. In this way, we extract an estimate of the total radius , as well as of the core radius and of the fuzzy shell half-width . All of these observables are reported as a function of in Fig. 4. The fitting procedure has been repeated for simulations of systems with both and microgels and again we find that the results are very similar for both sizes, so that we can consider our simulation size appropriate for this kind of study.
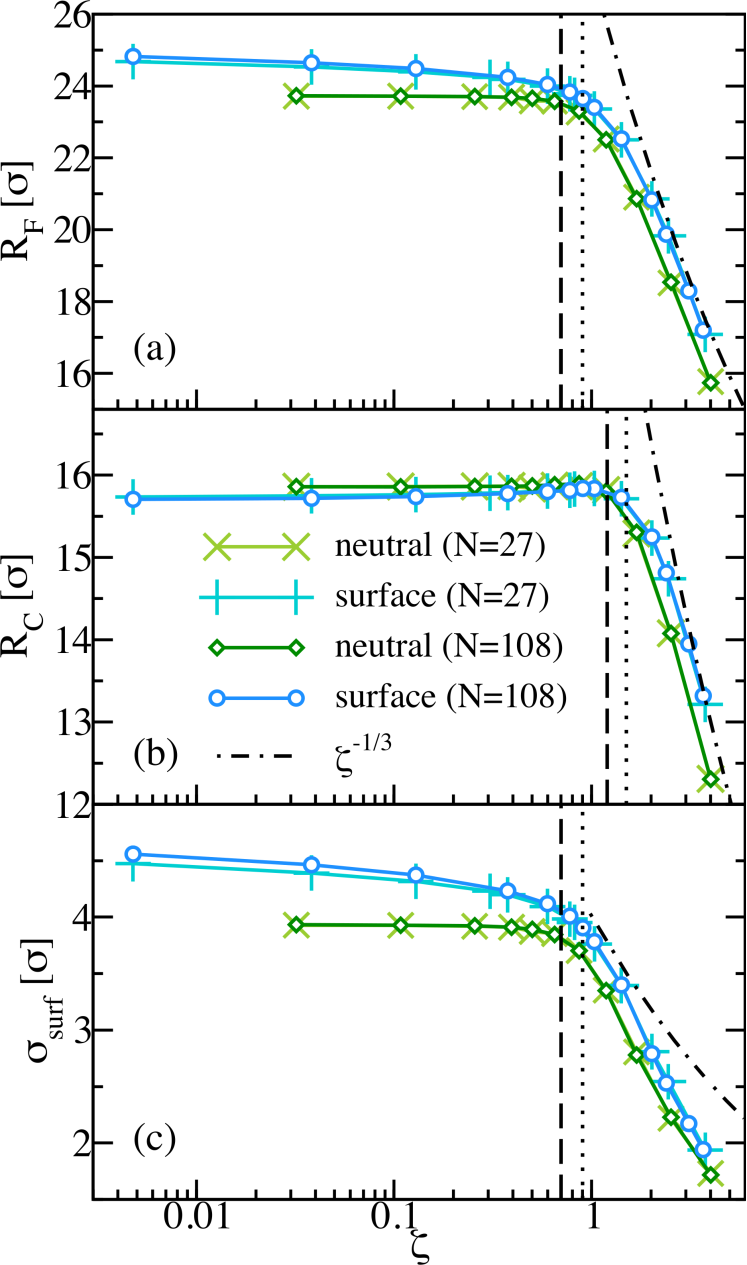
Panel (a) shows results for , which is completely constant below particle contact for neutral microgels, in agreement with the findings of Fig. 2, while a small decrease is observed for charged ones. In both systems, a more pronounced shrinking starts to occur above particle contact, which happens at slightly higher packing fractions for charged microgels. The observed deswelling is again compatible with isotropic shrinking, similarly to what observed for and . Panel (b) displays the size of the core separately, where the core radius is shown to remain constant up to much larger values of , exceeding particle contact, for both neutral and charged microgels. Then, isotropic shrinking of the cores is found to occur only for . Instead, the external shell, whose extension in quantified by , starts decreasing earlier, just above contact. Evidently, the initial decrease of the microgel size around particle contact is only determined by the shrinking of the shell. Only later, the cores come into play. This is also reflected in the behavior of , which is not found to be compatible with an exponent at all , but only in its initial shrinking trend. Later on, when isotropic core shrinking happens, the shell is found to decrease even more, with a behavior roughly compatible with an exponent of . This may be due to the softer character of the corona, that at extremely large packing fractions becomes completely deformed and collapses onto the core.
II.2 Individual microgel deformation
Having evaluated the individual particle size as a function of , quantifying the isotropic deswelling that takes place with increasing concentration, we now focus on the assessment of particle deformation. To this aim, we evaluate the deformation parameter , defined in Eq. 11, that is an adimensional function of microgel volume and surface that is equal to 1 for a sphere and lower for other geometries. This quantity is the 3D analogue of the ratio used in super-resolution experiments of Ref. [28]. First of all, we calculated for each microgel considering all beads, as reported in Fig. 5, and with this procedure find the counterintuitive result that the microgels appear to be more anisotropic at low than at high . This is due to the presence of the dangling chains around the microgel, which provide an important contribution to the volume when the microgels are isolated, thus making them fluctuate a lot in shape and being instantaneously (but not on average) rather anisotropic. Instead, when they get in contact with each other, the external chains deform very easily and hence the microgels retain a more spherical shape. This is signalled by the increase of , which, however, is always found to be much smaller than 1. This picture contradicts the standard expectations, as well as experimental observations [20, 29], on particle deformation of concentrated microgels at high , due to the fact that such external chains cannot be easily detected in experiments, given their very low density. The role of dangling chains is a matter of debate [49, 50], not being easily quantifiable in experiments, while they can be visualized in simulation studies like the present one. Turning back to the deformation assessment, the important insight that we obtained from these results is that the dangling chains contribution should not be considered to compare with microscopy experiments and, for this reason, we neglect the outer chains in the calculation of the deformation parameter, considering only on a subset of the beads that are more representative of the size of each microgel. To find such an estimate, we rely on the knowledge obtained by the form factors and use the length , corresponding to the core radius plus half of the fuzzy shell width, as a threshold length above which we discard the most external and very low density beads, to calculate the microgel volume. We stress that we use the value of estimated in dilute conditions, keeping it constant at all , in order to be able to meaningfully detect the deformation of the coronas, that are gradually collapsing onto the core with increasing packing fraction.
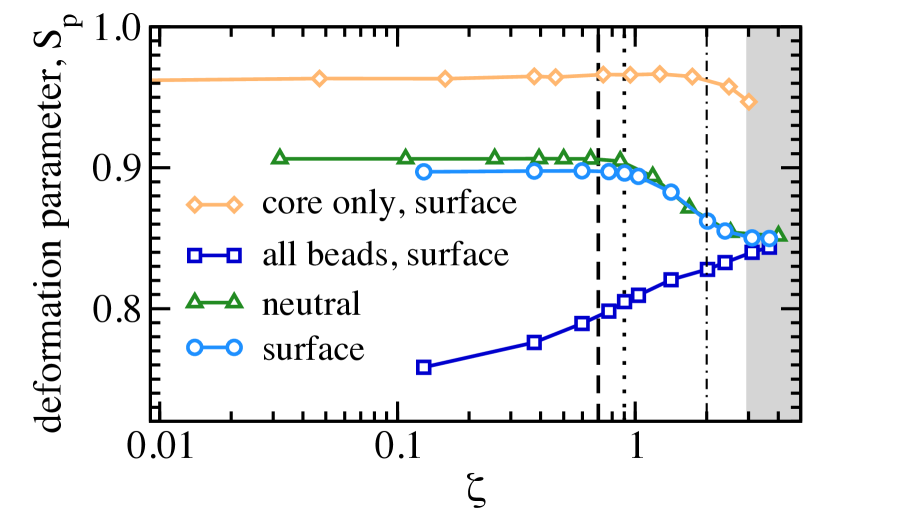
Within , we then calculate and find that its behavior qualitatively reproduces the experimental one, whose value is initially close to the spherical limit and stays constant. Then, roughly at contact ( for neutral and for surface-charged microgels) or slightly above it, the anisotropy parameter starts to decrease quite rapidly in an almost linear fashion, reaching a plateau for . The behavior of is very similar for both neutral and charged microgels. These results are once more in remarkable agreement with super-resolution experiments by Conley and coworkers [28], who also found three regimes for their 2D deformation data: a low- plateau up to , a linear decrease and then a high- plateau for . Similar behavior was also observed by Bouhid et al upon imaging concentrated microgels [20]. Instead, the simulation results reported by Nikolov et al [40] were not able to identify the third high- regime reported in the present work as well as in experiments. This was perhaps due to the fact that these authors used a different variable to quantify anisotropy, namely the ratio between surface and volume, which cannot not reach a plateau at high packing fractions. Indeed, this quantity was then found to display a minimum for that should correspond to the onset of deformation, but did not saturate at high [40]. Therefore, we conclude that (or its 2D analogue used in Ref. [28]) is a more appropriate quantity to monitor individual particle deformation and capture the different experimental behaviors.
Having set a threshold for determining particle deformation, we can then repeat the calculation considering only the core beads, to get an assessment of the core deformation. This is also reported in Fig. 5 for the surface microgels only, due to the similarity between the two sets of data. We find that core deformation is practically absent everywhere, except for a very minor increase, signalled by a decrease of the relative , for . Hence, we can conclude that this phenomenology is almost absent, at least for the studied crosslinker concentration.
II.3 Microgel overlaps, faceting and effective packing fraction
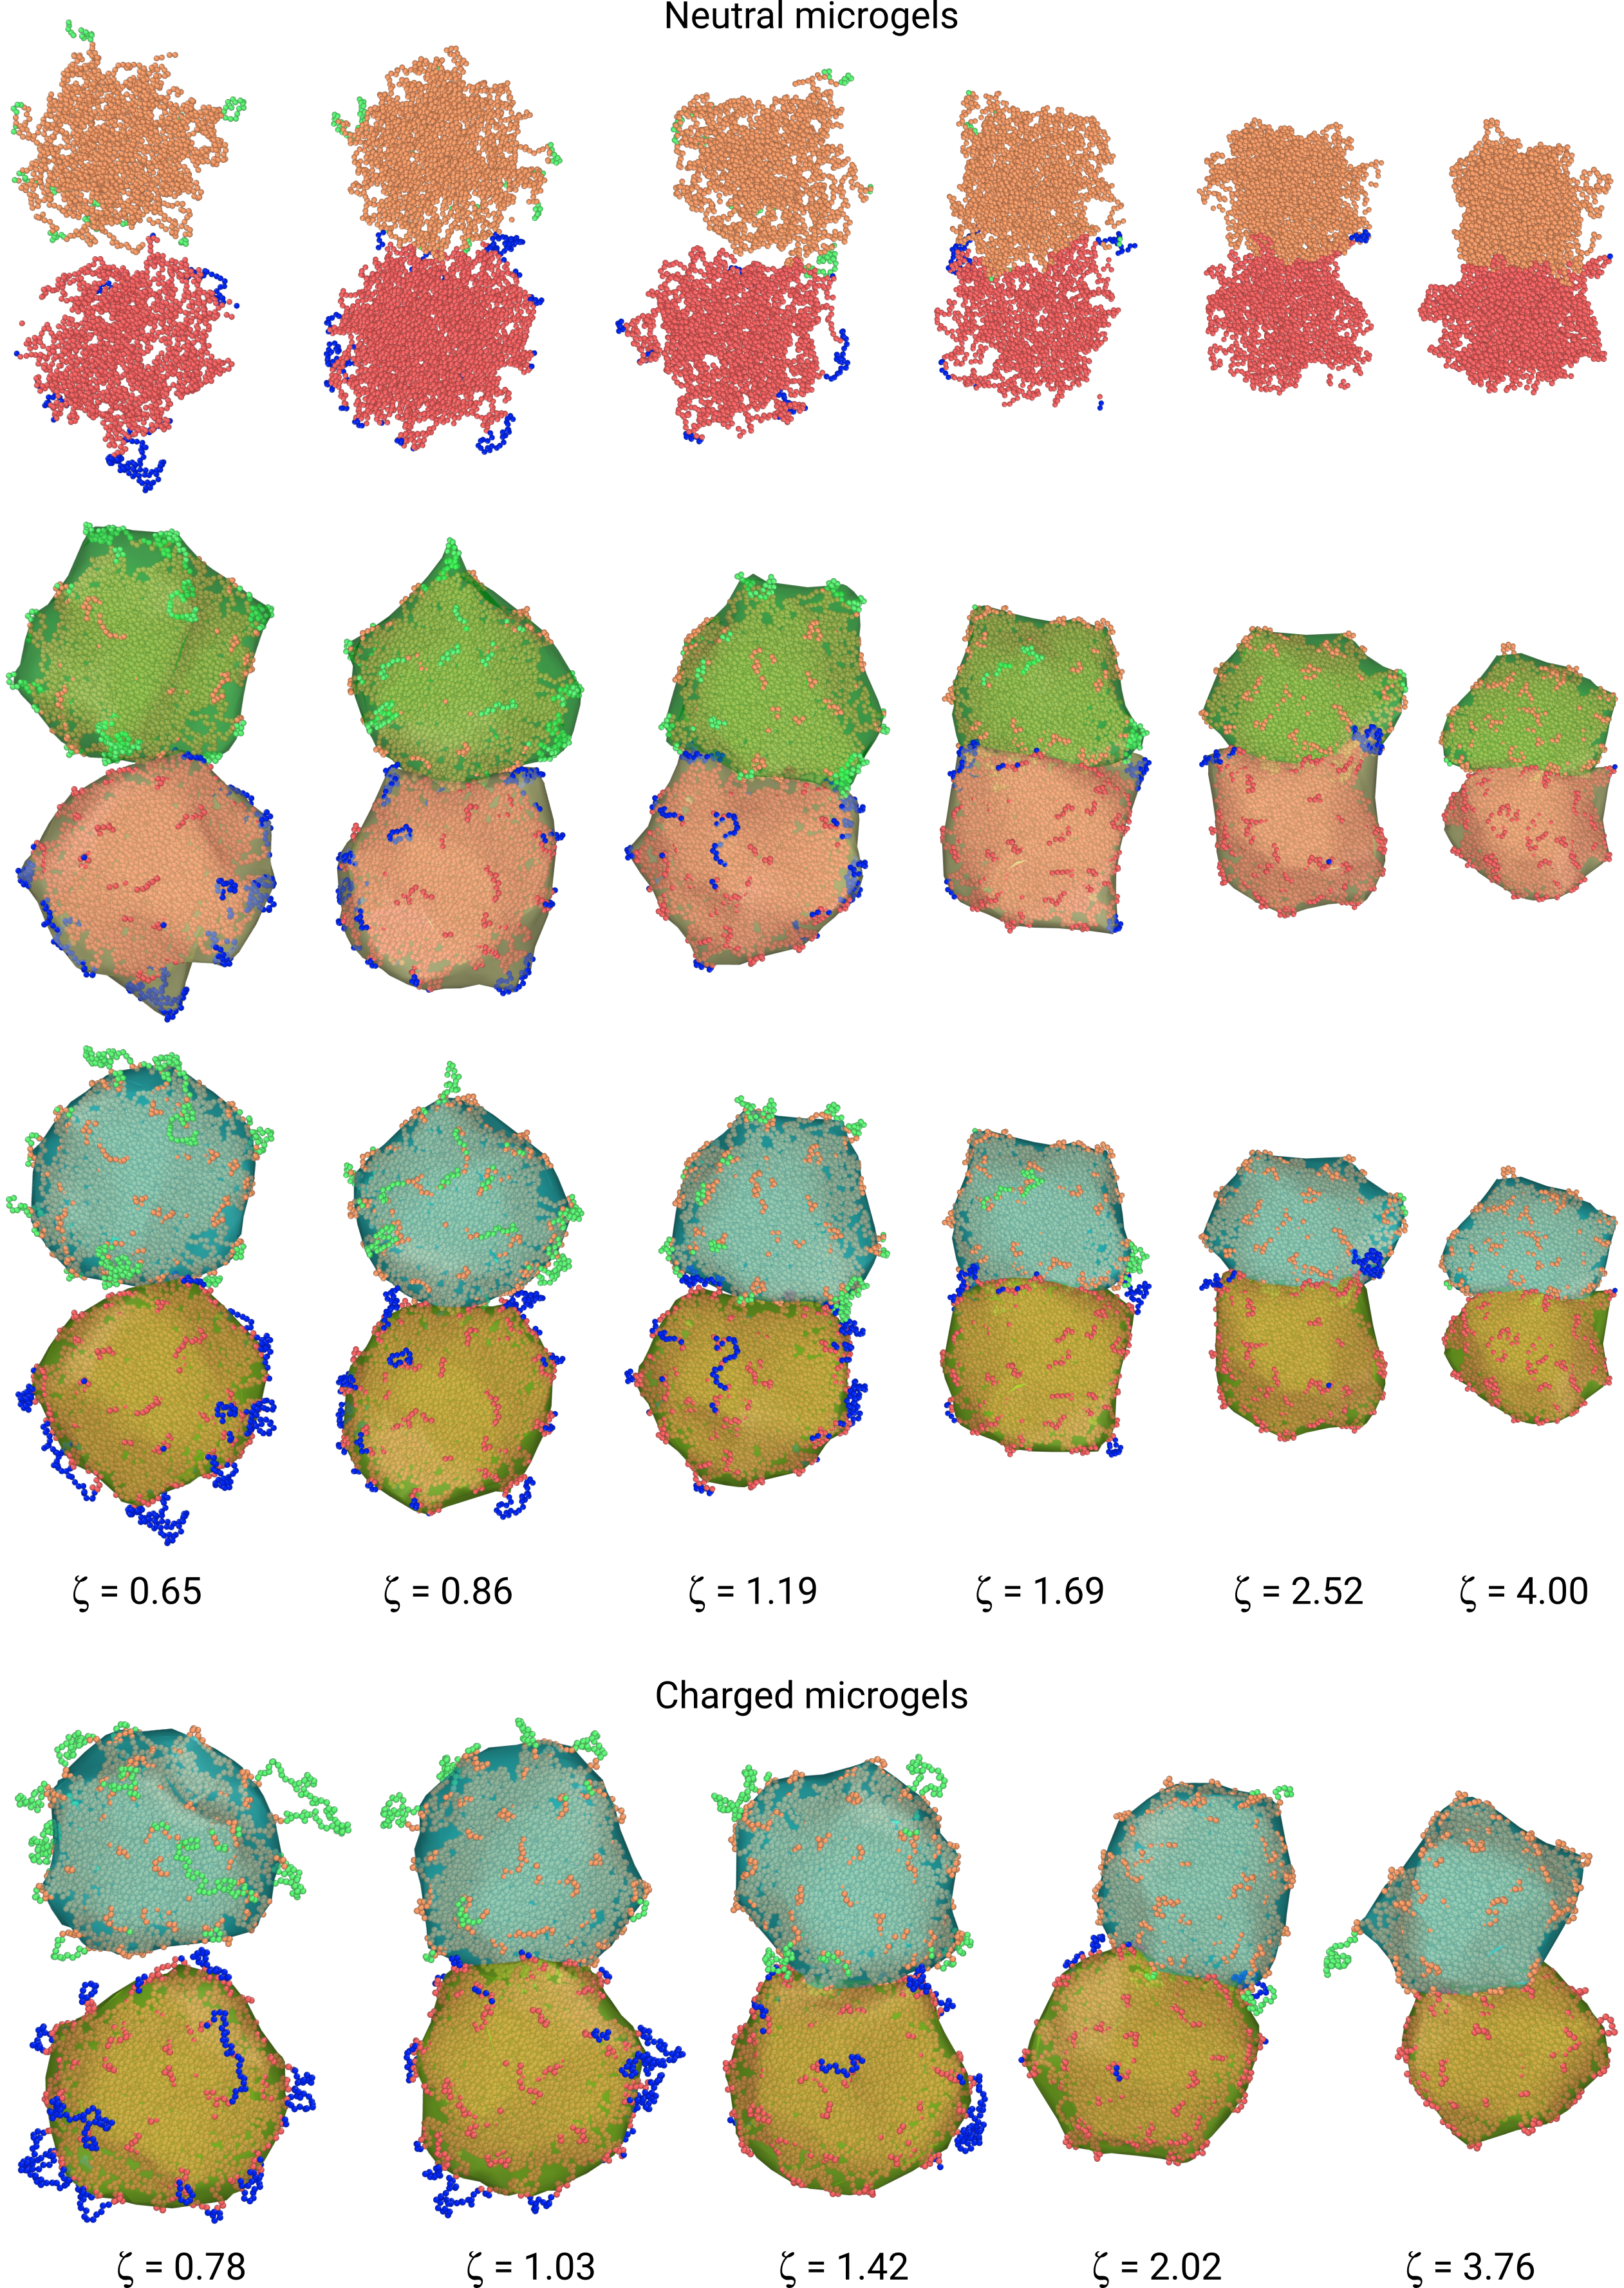
It is now instructive to look directly at the microgels to visually assess the progressive changes as increases. To this aim, we report in Fig. 6 representative pairs of neighbour microgels at several different packing fractions. We start discussing the neutral case for just below contact (leftmost panels), where the microgels are not yet touching. In the top row, we report the full monomer representation, highlighting in a different color the dangling chains that we do not include in the deformation analysis discussed above, i.e. those that are found at a distance from the microgel center of mass greater than . As it can be seen in Fig. 6, these are very peripheral chains that protrude outside the microgel, therefore yielding deviations from the spherical shape at low . To better visualize this, in the second row we show the surface mesh of the microgels, calculating it over all beads including such outer chains, which highlights the asphericity of the surface close to these protrusions. This explains the high anisotropy parameter observed when considering all the beads in Fig. 5. Instead, when we exclude them from the calculation of the surface mesh, it is evident that the rest of the microgel is much more compact and overall spherical-like at low , as illustrated in the third row of Fig. 6. Hence, we can now look at what happens with increasing : clearly, above contact the microgels start to shrink, maintaining their spherical-like shape and only later, for , they start to facet. At this point, looking closely on the snapshots in the first row, it appears that along the sides where they are in close contact with their neighbours, they also start to interpenetrate, but this mechanism is never completely dominant. This may also be due to relatively large crosslinking ratio and small size of the investigated microgels, so that it will be interesting to compare this behavior with that of microgels having or below in the future.
Turning to examine the surface-charged snapshots in the last row of Fig. 6, it is clear that they remain overall larger in size at all studied packing fractions. The outer chains, as expected, are much more extended in this case, which further disfavour interpenetration. Indeed, such chains are more likely found to be within the interstitial space as also visible in the snapshots. However, the degree of deformation of the microgels qualitatively appears to be similar to neutral case, in agreement with the behavior of in Fig. 5.

We now summarize the above results by reporting the evolution of the effective packing fraction, usually denoted as , as a function of the nominal packing fraction . While the latter is obtained from the individual particle size in the dilute limit, the former is obtained by using , i.e., the hydrodynamic size at each state point, thus providing a better estimate of the volume effectively occupied by the particles. The parameter is more widely used, since it is more easily accessible in experiments, while at large concentrations can be only determined by some clever estimation, as for example variational contrast scattering experiments [24]. Fig. 7(a) reports as a function of , confirming that coincides with at low densities, but its slope decreases with increasing , in agreement with previous works [51, 52, 40]. The deviation between effective and nominal packing fraction occurs right at particle contact for neutral microgels, but slightly earlier for charged ones due to the anticipate shrinkage of their corona, as an effect of the ongoing long-ranged electrostatic interactions. However, for both systems, we find that rapidly exceeds 1.0, probably approaching a limiting value () at very large . This suggests that, under very concentrated conditions, particles start to overlap, as also visualized in the snapshots, so that the packing fraction evaluated from individual microgels becomes an overestimation of the total packing fraction of the system.
To address this point, we next evaluate the overlap packing fraction . As explained in Methods, this is calculated as the fraction of volume occupied by more than a single microgel over the total one. With these calculations, we find that particle interpenetration starts at for neutral and for charged microgels. This is highlighted in the inset of Fig. 7(b), which displays the onset of the overlap in logarithmic scale. Clearly, for the amount of overlap is still well below 1% of the total for neutral microgels, and even less for surface-charged ones. These findings are again consistent with the fact that deswelling happens well before interpenetration takes place, in agreement with recent super-resolution microscopy experiments [29]. Indeed, this study also reported that microgels first start to shrink at contact, while only later, roughly for , particle interpenetration becomes detectable. In addition, our simulations also reveal that once overlaps appear, they grow quite significantly, so that reaches values close to 0.3 for large . The present results are also in agreement with neutron scattering experiments performed in ZAC, which detected the onset of interpenetration distinctly above contact [24]. Importantly, in our simulations we are also able to distinguish between the types of overlaps that we observe. To this aim, we quantify the packing fraction of multiple overlaps, i.e. those occurring between more then two microgels in the same volume portion, also shown in Fig. 7(b). They are illustrated in Fig. 7(c) and (d), respectively, for three-body (typically along edges of facets) and many-body (typically at vertices of facets) overlaps. The contribution of such events to the total overlap volume fraction seems to be quite negligible. This suggests that interpenetration mostly occurs among two microgels in the explored range of packing fractions.

Finally, the effect of interpenetration can also be clearly seen by plotting the difference between the true individual microgels packing fraction and the overlap one, in Fig. 7(e). The removal of the overlap contribution, that is of course double-counted in the calculation of assuming multiple overlaps give a negligible contribution, allows us to retain a clear plateau value for large . This should ideally tend to 1, but we actually find an overestimation of about 10%, due to the intrinsic difference between the geometric volume (used to calculate the overlap packing fraction) and the hydrodynamic one (used to calculate and ). These two estimates are often used interchangeably, especially for soft particles, for which several definitions of volume can be thought, not generally identical to each other. To remediate this problem, we then simply calculate the total packing fraction of the system as the total volume occupied by all microgel beads (based on the same mesh construction algorithm) divided by the volume of the box, also shown in Fig. 7(e) and we correctly recover that it goes to for large packing fractions. However, for small values of , this no longer lies on the bisector, due to the difference with the hydrodynamic volume. Nonetheless, these calculations shed light on the way microgels occupy the space with increasing and of the different mechanisms coming into play in the different regimes. Interestingly, the final saturation of the effective packing fraction roughly coincides with the end of the deformation in Fig. 5, so that in this final regime microgels have filled all the available space, reaching their maximum possible deformation. Hence, at even higher , they just continue to further isotropically shrink (at fixed shape) and interpenetrate.
To summarize, both the present numerical analysis and the super-resolution experiments confirm that isotropic shrinking is the first effect taking place upon increasing , occurring above particle contact. In a second step, interpenetration, mostly in the form of two-body interactions, and deformation enter into play almost simultaneously. Finally, at very large , deformation stops and the physics of the suspension is completely dominated by further microgel shrinking and by the large amount of overlaps between the particles, also sometimes loosely referred as entanglements.
II.4 Bulk modulus of the individual microgels and of the suspensions
Next, we turn to examine the elastic properties of the microgel suspension and connect it to those of the individual microgels. This is something that has already been discussed in the literature, both in experiments [53] and in the recent simulations of Nikolov and coworkers [40], so it is useful to add here the results for our realistic microgels also in the presence of charges.
We start by reporting the bulk modulus of the individual microgels as a function of in Fig. 8(a). This is evaluated in two ways: (i) from the volume fluctuations, similar to previous works [54, 34] and (ii) from isotropic compression of the microgels, as also done earlier both in bulk [34] and at interfaces [55, 17]. The two methods should yield the same results, but this is true only in a limited range of packing fractions, namely . Above this packing fractions, when microgels start to deform and interpenetrate, the results obtained with the two methods are remarkably different. In particular, the estimates from volume fluctuations for both neutral and surface-charged microgels seem to saturate at finite, low value of . Instead, the data calculated via the compression for neutral microgels show a much more pronounced increase of , which exceeds the other estimate by more than one order of magnitude. Comparing to previous data, experiments carried out in Ref. [53] through osmotic compression of the microgels show a behavior of that is much more similar to data from compression. This suggests that the fluctuations route, amounting to spontaneous volume changes, does not probe the same fluctuations as those found when a physical compression, similar to the experimental one, is employed. Indeed, this method is based on the fluctuation-dissipation theorem and is strictly valid for homogeneous closed systems only. Instead, in the present work, we applied to soft particles whose volume is not univocally defined, with different regions having different densities and reasonably different elastic properties [56], and counterions and other microgels’ beads in the same volume are not taken into account.
Next, we evaluate the suspensions bulk modulus , that is shown in Fig. 8(b). Again, we employ two different methods: directly from the system pressure , as and from box volume fluctuations in NPT simulations. We find, as expected, that the two methods yield identical results at all studied , showing a variation of of many orders of magnitude as a function of . Interestingly, we find that at low , surface-charged microgel suspensions are stiffer with respect to isotropic compression, but for this trend is reversed and the neutral microgels become slightly more stiff, due to their larger degree of interpenetration at same . However, the qualitative behavior of the two systems is overall rather similar.
Finally, we report the ratio as a function of in Fig. 8(c). Using obtained from volume fluctuations, we find that the ratio continues to increase at large . Looking at and separately, this is an evident consequence of the fact that saturates at large , while continues to increase. This would counterintuitively suggest a decoupling between the suspension elastic properties and the individual microgels’ ones. However, in experiments there is always an osmotic exchange at play, which makes this way of calculating to be different from available measurements at large . Indeed, it was observed [53] that the ratio at first grows and then saturates for at a constant value, that is found to be . So, initially at low , the suspension is just a fluid of microgels without detectable elasticity, but when microgels get into contact they develop an elastic response as a whole that has a bulk modulus very similar to that of the underlying microgels themselves. This is precisely what we obtain when plotting the ratio , when the latter is calculated from the compression route. For a matter of computational costs, we only show this for neutral microgels, but we have no reason to expect a different behavior for the surface-charged case. We also remark that Nikolov and coworkers [40] also found a similar behavior, suggesting a universal trend for this observable.
II.5 Radial distribution functions
Having discussed the single-particles properties in detail, as well as the influence of crowding by neighbouring particles on the internal structure of individual microgels, we now turn to examine the collective properties of the whole suspension. To this aim we analyze two key observables, representative of static and dynamic behavior, that are often discussed in experiments, particularly by microscopy ones.
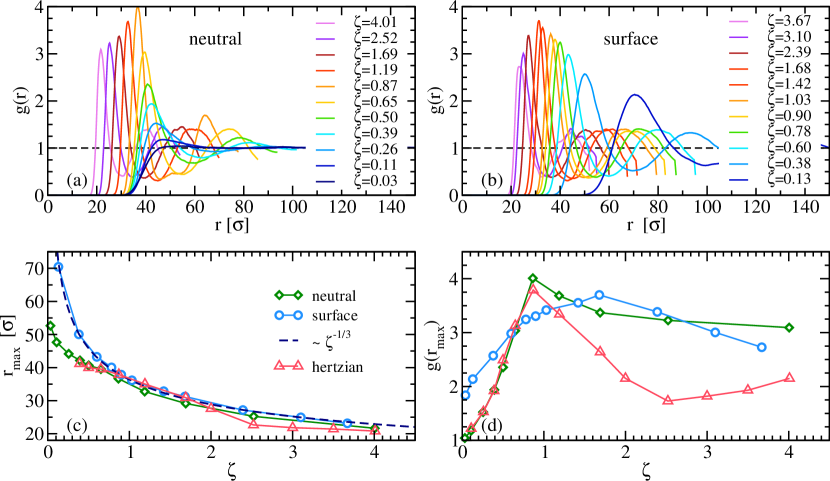
We start by considering the radial distribution function of the centers of mass of microgels. This is reported as a function of in Fig 9. Focusing first on neutral microgels (Fig 9(a)), we observe that the position of the first peak , shown in Fig. 9(c), moves to smaller and smaller distances. In this second regime, it follows the expected trend , denoting an isotropic filling of the available volume as increases. This behavior starts right above contact and is thus consistent with the isotropic shrinking of the particle radii, observed in Fig. 2. Focusing on the height of the peak , reported in Fig. 9(d), we find that it rapidly increases at low , going through a maximum close to particle contact and then decreases again, almost reaching a plateau value at very large . Such a reentrant feature of the maximum of the has been previously observed in confocal microscopy experiments [57, 22] and also in their counterparts obtained by the study of the form factors [26]. We further compare the data with those obtained by simulations of a simple Hertzian model, where . Similarly to previous analysis carried out in Refs. [58, 35, 34], the Hertzian diameter is set equal to the hydrodynamic radius of the microgel for and the packing fraction is determined accordingly. We then use the Hertzian strength , which depends on the Young modulus of the microgels, as a fit parameter and find that to match the data at low . This value is then fixed throughout for all increasing packing fractions. By this procedure, we find that the Hertzian model is able to quantitatively describe numerical data obtained by monomer-resolved simulations up to , above which it strongly departs from them, significantly underestimating the peak height at larger packing fractions. Interestingly, the Hertzian model further shows a minimum in at intermediate (), later followed by another increase of the peak height at ever larger packing fractions (see Fig. 9(d)). This second increase of is not observed in monomer-resolved simulations, which instead display a much less pronounced decrease at large , with values always larger than those predicted by . These results confirm what found in earlier works where the effective potential between two microgels was shown to deviate from the Hertzian model at intermediate packing fractions [34]. One possible way to overcome this limitation without resorting to monomer-resolved simulations is the use of a modified model, which takes into account the increasing internal elasticity of particles, such as for example the multi-Hertzian potential [35].
We now turn to the data for the surface charged microgels, shown in Fig 9(b), and find that the radial distributions overall display very similar features to their neutral counterpart. Importantly, also for charged microgels a reentrant behavior of the peak height is obtained, confirming experimental results [57, 22]. Since the presence of charges is inevitable in pNIPAM microgel experiments, our results show that these are not crucial to the observation of these features, which therefore stems from the intrinsic softness of the particles. However, the decrease of occurs in the case of surface-charged microgels at a significantly larger value of . Despite the qualitative similarity between the two sets of data, we note that the position of the peak for surface-charged microgels, also shown in Fig. 9(c), follows the isotropic scaling at all packing fractions, starting from the dilute limit. This is different from the behavior of the neutral case, again matching the observations made for the individual particle radii and suggesting a deswelling at all for the charged system.
The agreement of the basic features of the with what found in experiments again indicates the realistic descriptive abilities of the present model. Although we cannot quantitatively compare with available experiments due to the difficulty in properly determining the surface charges, we stress the similarity in the radial distribution functions of the present neutral microgels to those reported by Paloli and coworkers [22]. In these experiments, fewer initiators () than the ones used in the present work for surface-charged microgels were employed. In addition, as discussed in Ref. [45], the initiator charges resulting from the synthesis should be located mostly on the surface but also partially within the interior of the microgels. This may be the reason why such experimental data seems to adhere more closely to neutral simulation results. Instead, for the case of exclusively surface-charged microgels examined here with , an important role of charges and counterion effects emerges already at very low , as manifested by the homogeneous decrease of the nearest-neighbour distance. The larger deformability of the swollen charged coronas is also responsible for the occurrence of a broader change in ) with respect to purely neutral systems. While we hope to be able to perform a quantitative comparison with experiments in the near future, we believe it is important to have a confirmation that a reentrant behavior of is obtained both for purely neutral and for the surface-charged microgels studied here. We remark that the charge content considered in the present work is a relatively high one, comparing what available in the literature, and it is all located on the surface. Hence, this study-case may likely represent an upper limiting case for an experimental realization of pNIPAM microgels.
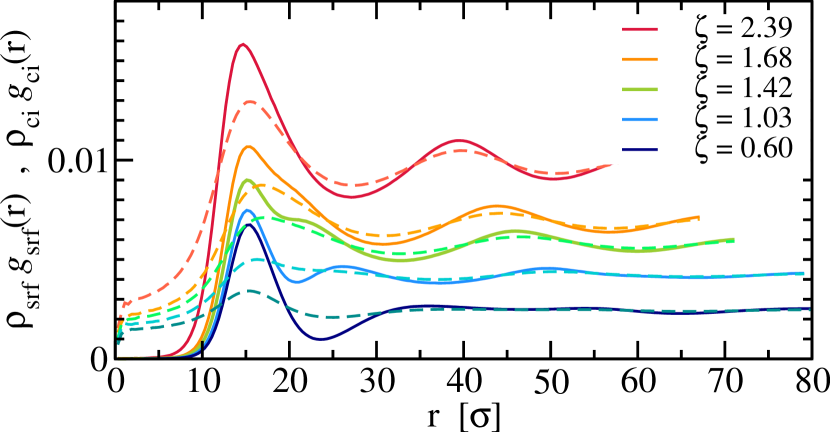
To better examine the effect of charges, we also report the average radial density of charged beads and counterions as a function of the distance from the center of mass, in Fig. 10. For small values of we clearly distinguish a first peak in , localized at the position of the microgel charged shell. This is intersected by the counterions distribution , that is approximately located at the double layer of the microgels, and then followed by a second peak, which represents the average location of the external surface of the first neighbours. In this regime the mutual repulsion between the surfaces makes them stiffer, with respect to the neutral system at same . A structural change of the charged distribution functions is then detected close to the packing fraction at which the reentrance of occurs: as visible from data in Fig. 10, for , the fusion among the first and second peak of clearly takes place. Thus, in this regime of packing fractions, the charged double layer disappears and the charged surfaces of neighbouring particles start to overlap, finally superimposing onto each other. At even higher , we then mainly distinguish two kinds of regions in the system by the charged radial distributions: denser and more positive cores, full of counterions, and the network of surface contact regions, that is instead more negative due to microgel charges. Importantly, a similar structural change was also detected in experimental studies, which highlighted the role of counterions screening and of their osmotic pressure on the swelling behaviour of pNIPAM microgels [59]. Also, the properties of the counterion clouds of individual microgels have been shown to undergo dramatic changes when they start to overlap [44], in full agreement with the present work.
II.6 Slow dynamics and crystallization
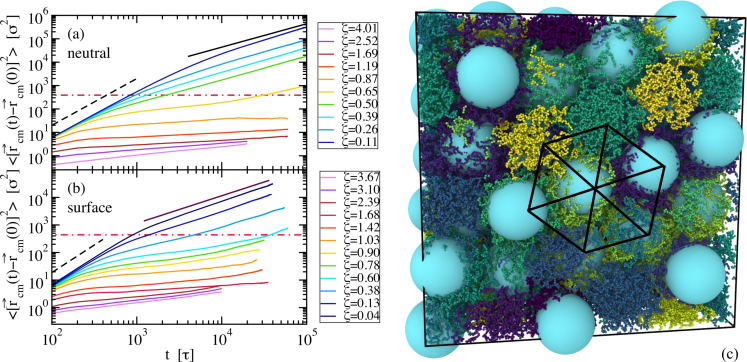
Next, we monitor the dynamics and report the mean-squared displacement (MSD) of the microgels centers of mass as function of time in Fig. 11.
In panel (a) we see that neutral microgels are able to reach a fully diffusive regime at long times for packing fractions below particle contact. Then, as soon as they start shrinking, overlapping and deforming, their dynamics becomes extremely slow. This is indicated by the fact that microgels are no longer able to displace lengths larger than their average hydrodynamic radius (horizontal line in the figure) within the simulated time window. Actually, the long-time slope of the MSD curves is rather flat, suggesting that for , the system reaches a glassy regime.
A similar behavior occurs for surface-charged microgels, shown in panel (b), which actually become slower at even smaller , due to the strong additional electrostatic interactions. Due to the large computational costs, we are not able to better characterize these high-density glassy states, nor to properly calculate the self-diffusion coefficient close to arrest in order to compare with available experimental data [21].
We note that the observed behavior is qualitatively similar to that of the MSD measured with super-resolution microscopy [28], where the plateau of the MSD was found to dramatically decrease with increasing . However, we warn the reader that our system at these high packing fractions is to consider out-of-equilibrium and a true aging analysis should be performed, that is beyond current computational feasibility. In order to have a meaningful way to compare data at different packing fractions, we prepared the different state points following a similar protocol, without increasing the equilibration time with increasing , so that data in Fig. 11 are compared at the same waiting time. Despite the fact that we cannot be quantitative on the dynamics and on its -dependence, particularly to compare with the presence of a second regime at high as proposed by Philippe and coworkers [21], we can still put forward the robust observation that the MSDs are found to decrease monotonically with increasing , at any studied packing fractions, thus excluding a reentrant behavior of the dynamics in bulk microgel suspensions. Hence, despite a non-monotonicity of the main peak of the , observed here both for neutral and charged microgels in agreement with experiments, the dynamics of the present simulations does not speed up again at high , once more deviating from the predictions of the Hertzian model and confirming experimental observations.
Finally, we point out that in both studied systems, neutral and charged ones, we detected the onset of (at least partial) crystallization of the suspension at very high -values. Due to the underlying polydispersity of the employed microgels and to the small size of the sample, this was not signaled by a sharp decrease of the energy (for which the bonded FENE contribution is always dominant), but is somehow visible from the splitting of the second peak of [22] in some of the samples. For some systems where this was observed, we ran longer simulations in order to be able to visualize the crystal. One representative example is provided in the snapshot reported in Fig. 11(c), where it can be seen that the centers of mass of the microgels are found to occupy a cubic lattice. Again, these findings indicate the realistic nature of our simulations, which display all the main features observed in experiments, including the onset of crystallization [22]. Of course, after crystallization, the main structural observables are different, including a rapid increase in the peaks of the . However, since these simulations require very long equilibration times, we keep this at the level of a phenomenological observation, not being allowed to be more quantitative on the issue at present. Specific studies devoted to eventually investigate crystallization by appropriate numerical methods should then be performed in the future to elucidate this point.

III Discussion
In this work we reported extensive simulations of suspensions of realistic microgels at varying packing fractions in the swollen regime. This model system is of high interest for the physics of glass transition, because, at temperatures below the Volume Phase Transition, microgels are considered to be the prototype model of soft colloids. Therefore, their study at low temperatures allows to unveil important characteristics of the glass transition of soft particles in general. For a long time, in this regime, microgels have been thought to behave simply as Hertzian spheres, but several recent works have shown how such a pair potential is only adequate at low enough packing fractions, where particles do not strongly interact with each other. However, as soon as one reaches random close packing, which can be vastly exceeded in soft particles, an interesting region can be explored, where particles can change size, shape and interpenetrate, thus changing the rheological response of the suspension as a whole. Under these conditions, more complex descriptions are needed. To this aim, novel microscopic insights have been provided recently by the advancement of super-resolution techniques, which have shed light on several aspects of concentrated microgel suspensions with single-particle resolution [28, 29, 12]. At a more global level, neutron studies with selective deuteration are also emerging as key experiments to unveil single microgel behavior under crowded environments [26].
Complementary to these approaches, there is a strong need to perform state-of-the-art numerical simulations, which allow to follow the microgels at the microscopic level, both individually and collectively. In the present work, we were able to simulate up to 108 microgels, each made of about 5000 beads, which, following previous works, have been shown to possess an underlying structure similar to microgels synthesized in experiments [43]. Indeed, this is roughly the minimal size for which a meaningful core-corona topology, such as the one determined by experiments [60], can be achieved. The computational effort was even greater in the presence of charges, that we added to a fraction of beads similar to that of recent experiments [45], together with the corresponding counterions. This aspect is often overlooked, due to the apparently negligible amount of charges present, that is due to the initiators of the polymerization reaction used in the synthesis, usually thought to be effectively screened by associated counterions. However, more and more recent studies [44, 59, 45, 27] pointed out that some features observed in experiments cannot be explained without accounting for electrostatic effects even for standard (e.g. non-copolymerized) pNIPAM microgels. In particular, at large packing fractions, the osmotic contribution of counterions and the overlap between charged surface of different microgels have been often invoked in the literature. Hence, one of the main aims of the present study, that was never tackled before, was to perform a careful comparison between the behavior of neutral and charged microgel suspensions up to very high concentrations.
First of all, we clarified the different regimes taking place upon increasing packing fraction . These are graphically summarized in Fig. 12. We start to discuss the case of neutral microgels, which is instructive to be looked from the theoretical point of view, From a theoretical viewpoint, it is instructive to begin by looking at the case of neutral microgels, despite it cannot still be realized experimentally. In Fig. 12, we highlight the different mechanisms that take place while increasing . For packing fractions below random close packing, when microgels are not in contact (), no single particle shrinking is observed and the suspension is fluid-like retaining diffusive behavior at long time. In this regime, the Hertzian model is able to quantitavely describe data, confirming previous works [22, 34]. As soon as microgels get in contact with each other, their shells start to be compressed and undergo isotropic shrinking. At the same time, microgel deformation starts and the peak of the undergo the so-called structural reentrance (Fig. 9). Here, inter-particle interactions become stronger, deviating from the Hertzian model, and the system becomes glassy without ever encountering a further speed-up at higher , i.e. no dynamic reentrance is observed. By further increasing roughly above 1.2, also core shrinking starts to be observed (see Fig. 4). At this point, overlaps between neighbouring microgels become evident, mostly in the form of two-body interpenetration. Finally, for , the maximum deformation of microgels is reached, as signalled by the deformation parameter ending on a plateau in Fig. 5, and a homogeneous filling of the space is obtained, since the the effective packing fraction saturates to the maximum possible value. In this final regime, we also find that the suspension bulk modulus is dominated by the single particle’s one in agreement with previous works [53, 40].
For surface-charged microgels, several important differences arise. First of all, shrinking occurs immediately, starting from low , due to the dominant role of electrostatic interactions of charged coronas. This effect also anticipates the onset of glassy behavior, which occurs even before contact, stabilized by the electrostatic repulsion. Interestingly, this also causes microgels to come in contact at larger values of , as visible from the snapshots in Fig. 1. Hence, particle deformation starts at a higher packing fraction with respect to the neutral case, i.e. . Similarly, the shrinking of cores takes place only later, happening for where then interpenetration also starts. At this point, the structural reentrance still takes place, but much later than for neutral microgels, suggesting a qualitatively different behavior. Indeed, while for the latter the non-monotonicity of approximately happens when particles get in contact, it occurs only much later (in the interpenetration regime) for charged ones. This is the signature of a more complex mechanism underlying the shrinking of charged microgels, that is manifested in the behavior of the radial distribution functions of charged monomers and counterions (Fig 10). Clearly, we find a strong indication that the charged shells of neighboring microgels merge in this range of packing fractions, as previously suugested [44, 59] to explain experimental results. However, we stress that the present study represents the first microscopic description of such interesting feature arising in charged microgels. Finally, also for charged microgels, there is a crossover at a high-density regime for where particles reach the maximum deformation. Interestingly, this happens without detectable onset of core deformation at the studied crosslinker concentration. We also note that, although we do not provide calculations of from compression for surface-charged microgels, since it needs a different framework to properly treat the presence of counterions in a spherical cell, the similarity of the results for calculated from fluctuations and of to the neutral case makes us believe that a similar constant behavior of would also be reached at high .
Overall, comparing Fig. 12 to the final summarizing figure shown by Conley and coworkers in the conclusions of their paper, we find remarkable agreement between their data and the present simulations. First of all, we identify the same sequence of different regimes: shrinking, followed by deformation, then by interpenetration, until finally deformation stops. Second, the estimates of the packing fraction at which these mechanisms take place match almost quantitatively. Apart from super-resolution data, the present work is also in agreement with several other available measurements on many different aspects, offering for the first time a complete view of the range of single-particle and collective behavior that take place in concentrated microgel suspensions, also highlighting the influence of charges on the various regimes.
In addition, the present study sheds new light on issues that are still debated in the literature, such as the reentrance of statics and dynamical observables. We demonstrated that it is possible to clearly observe the former, without necessarily having the latter. This implies that microgels can accommodate at increasing packing fractions, findings new ways of interacting which yield a different structuaral organization of their nearest neighbours. This is however not accompanied by the increase of available volume leading to a speed-up of the dynamics put forward by simple coarse-grained models, such as the Hertzian one. Instead, particles do reaccomodate, but in doing so they get more and more arrested, also due to the underlying interpenetration mechanism and related entanglements that increase the friction among them. Importantly, the mechanism of structural reentrance, albeit always present, is different in the presence of charges, due to the significant interactions between charged coronas which undergo a clear fusion in the interpenetration regime. It would be interesting to also detect this effect in experiments for example by selective labeling of the ionic groups.
In conclusion, the present results, being able to uncover all the many detailed specificities of microgel suspensions in swollen conditions, confirm the realistic nature of the employed microgel model and offer the ideal framework to start tackling the rest of the phase diagram, where several questions still remain open and experimental observations are still scarce. In particular, there is a strong need to explore the temperature behavior where attractive interactions start to play a role, and also the different features that can arise by changing the topology of the microgels, e.g. working with ultra-low-crosslinked or hollow ones. These investigations will be the subject of future work.
IV Methods
We performed Molecular Dynamics (MD) simulations with microgels in a box with periodic boundary conditions. Each microgel is modelled as a connected network of beads, with a disordered topology, according to a recently proposed coarse-grained model [41, 43]. To monitor size effects we also performed selected simulations with microgels. In all cases, beads interact with the Kremer-Grest potential, amounting to a steric repulsion plus a bond contribution between bonded neighbours. The first term is modeled by the Weeks-Chandler-Andersen (WCA) potential:
| (1) |
where is the energy unit, identifies the distance between two monomers and is the diameter of the monomer, that is the unit length of the simulation. The bonding term is implemented through the Finitely Extensible Non-linear Elastic (FENE) potential:
| (2) |
where is the maximum bond distance and is a stiffness parameter determining the rigidity of the bond.
We consider microgels with a crosslinker molar fraction . Individual microgels are assembled using the procedure put forward in Ref. [43] and we use 27 independent topologies (replicated by 4 for the simulations) in order to reproduce the intrinsic polydispersity of microgel suspensions.
The presence of charged initiator molecules in the polymer network is taken into account in the model by having a fraction of network beads with a negative charge and interacting via the Coulomb potential [45]:
| (3) |
where and are the charges of the beads and is the reduced unit of charge, embedding the vacuum and relative dielectric constants, and . We consider with charges and we analyse two different charge distributions as done in Ref. [45]: (i) a random charge distribution, wherein charges are assigned to monomers, randomly picked among non-crosslinker beads, and (ii) a surface charge distribution, wherein the same amount of charged beads are randomly spread only in the microgel external corona. This amounts to randomly consider non-crosslinking beads whose average position from the centre of mass is found at a distance larger than the gyration radius of the corresponding neutral microgel. To preserve the overall electro-neutrality, we also insert an equivalent number of positive counterions with charge , which sterically interact among each other and with microgel beads through the WCA potential. Their diameter is set to to avoid spurious effects from excluded volume [61].
The equations of motion are integrated through a stochastic algorithm for the canonical sampling [62] (constant NVT ensemble) with an integration time-step , where is the reduced time unit and is the mass of the monomer bead. All simulations are performed with the LAMMPS package [63, 64, 65] at fixed temperature . Long-range Coulomb interactions are computed with the particle-particle-particle-mesh method [66]. Simulations are conducted for an equilibration time of ( timesteps), followed by a production run of ( timesteps) for systems with , ( timesteps) for charged systems with and ( timesteps) for neutral systems with . We simulated the described systems for various values of the total simulation box volume , to assess the effect of the concentration of microgels on collective and single-particle properties.
IV.1 Calculated observables
We calculate the radial size of individual microgels through different quantities. An estimate of the overall extension of the core of the particles is given by the average radius of gyration:
| (4) |
where are the number of beads of the microgels in the system, is the position of the -th monomer of the -th microgel, whose centre of mass is , and represents the ensemble average. This quantity represents the standard deviation of the radial density profile of microgels:
| (5) |
Another way to estimate the radius of particles is the hydrodynamic radius, which also accounts for their most exterior and low density region. To estimate in simulations, we adopt the method recently put forward in Ref. [45], where
| (6) |
and , , are the principal semiaxes of the gyration tensor of the surface mesh enclosing the microgel. This is estimated with the Ovito python package [67] using the Alpha-Shape method [68], that is based on a Delaunay tassellation of the space occupied by microgels beads, then individuating filled and empty regions according to whether the radius of a circumscribing sphere is greater or smaller than a probing radius , which in our case is a value that ensures the absence of inner holes at diluted conditions.
The (nominal) packing fraction is thus defined as,
| (7) |
where is the hydrodynamic radius of the particles under most dilute conditions. This definition of the packing fraction is simply proportional to the number concentration and is usually used to report in experimental measurements, since it is easy to determine. However, due to the deformability of microgels, we also evaluate the effective volume fraction , that is calculated by taking into account the actual hydrodynamic size of the particles at each state point:
| (8) |
To probe the individual structure of microgels at different packing fractions, we calculate their form factors as
| (9) |
averaged over all microgels in the simulations. In order to compare with experiments, we then fit with a modified fuzzy sphere model model [43],
where the last modified Lorentzian term takes into account the network structure at large [69], based on the assumption that spatial correlations decay according to , where is the fractal dimension of the correlated domains and being the length over which concentration fluctuations are spatially correlated. In this way we obtain an estimate of the average core radius and of the average total radius , where denotes the extension of the corona.
To assess the structural changes occurring on single microgels upon increasing packing fraction, we additionally carried out calculations to evaluate variations of their shape as well as to distinguish these from the interpenetration of most external chains. To define a parameter that quantifies the deviation of microgels’ shape from the spherical one, we construct the surface mesh through the aforementioned method, but we only consider the monomer beads that are found to be inside a certain radius, which we calculate as . Here and are obtained from the fit of the form factor in dilute conditions. In such a way, we can better define the surface of the particle to more accurately estimate its instantaneous shape by considering almost all its monomers except for the most external ones, which belong to the fluctuating outer chains and have a huge effect on the definition of the surface mesh. We justify our choice by considering that these dangling chains cannot be really detected in experimental systems through imaging techniques due to the very low contrast with the solvent [24, 29]. Following the method used in Ref. [28] to calculate the shape parameter, we thus use an analogue 3D quantity:
| (11) |
where is the enclosing surface of each microgel. We note that according to this definition for a sphere. Our somehow arbitrary choice of was then validated a posteriori by the results shown in Fig. 5, where one can clearly see that if we consider all the microgel beads in our analysis, we counter-intuitively observe a decrease of the deformation parameter, unlike what the experiments show. On the other hand, if only the core beads are considered, deformation starts to be observed only after the system becomes homogeneous, while for our choice of we are correctly able to observe the intermediate regime in which the particles deform before faceting.
Having defined a surface with an enclosed volume for each microgel, we can then calculate the total overlap between different ones, which quantifies their overall degree of interpenetration. This is finally obtained as the fraction of total volume occupied by more than a single microgel:
| , | (12) | ||||
where indicates the instantaneous volume of each surface mesh. We use as an estimate of the average amount of interpenetration of the system.
To evaluate the bulk modulus of individual microgels, we perform two different calculations. First, we evaluate spontaneous volume fluctuations of the microgels in the concentrated suspensions, averaging the results among all the microgels. In this way,
| (13) |
where is calculated as before through the surface mesh of the microgels. Second, we run compression simulations by imposing a harmonic force on the microgel, with for . Here, R is the radius of spherical confinement, is the distance of each monomer of the microgel from the center of the sphere and . For each considered value of , we run five independent simulations of different microgel topologies and average results over them. We then calculate again with Eq. 13 but within this constrained simulation and map the considered to the nominal packing fraction by matching results to the fluctuations ones at low where the two are identical. This method only works at not too small when we are in the linear regime. In addition, we have used it only for neutral microgels, because of the problem to treat the counterions in the charged case.
The suspension bulk modulus is evaluated from the numerical derivative of the equation of state of our NVT simulations, i.e. . In order to reduce statistical noise in the derivative, we also took the equilibrated configurations from the NVT simulations and simulated them at their equilibrium pressure. With these additional simulations, we could then directly estimate from the box fluctuations, analogously to Eq. 13. In this way, we verified that the two approaches are identical and cleaned the statistical noise occurring at low .
To study the collective structure of the microgel suspension, we then calculate the radial distribution function of microgels centers of mass. In addition, we also calculate the radial pair distribution functions for charged monomers and for counterions both with respect to centers of mass, that are reported multiplied by their (identical) number densities , which by definition represent their average radial density as a function of the distance from the center of mass of a given microgel.
The dynamics of the system is monitored through the calculation of the mean squared displacement of microgels’ centre of mass:
| (14) |
where indicates an average along the same trajectory.
Acknowledgments
We thank F. Camerin and L. Rovigatti for extensive discussions and methodologies developed throughout the years to simulate realistic microgels. We gratefully acknowledge CINECA ISCRA for HPC resources. EZ acknowledges financial support from EU MSCA Doctoral Network QLUSTER, Grant Agreement 101072964 and from ICSC Centro Nazionale di Ricerca in High Performance Computing, Big Data and Quantum Computing, funded by European Union, NextGenerationEU - PNRR, Missione 4 Componente 2 Investimento 1.4.
References
- Glotzer and Solomon [2007] S. C. Glotzer and M. J. Solomon, Anisotropy of building blocks and their assembly into complex structures, Nature materials 6, 557 (2007).
- Zhang [2003] S. Zhang, Building from the bottom up, Materials Today 6, 20 (2003).
- Weeks et al. [2000] E. R. Weeks, J. C. Crocker, A. C. Levitt, A. Schofield, and D. A. Weitz, Three-dimensional direct imaging of structural relaxation near the colloidal glass transition, Science 287, 627 (2000).
- Lu et al. [2008] P. J. Lu, E. Zaccarelli, F. Ciulla, A. B. Schofield, F. Sciortino, and D. A. Weitz, Gelation of particles with short-range attraction, Nature 453, 499 (2008).
- Voets and Scheffold [2024] I. Voets and F. Scheffold, Super-resolution microscopy in colloid science, in Super-Resolution Microscopy for Material Science (CRC Press, 2024) pp. 171–180.
- Hallett et al. [2018] J. E. Hallett, F. Turci, and C. P. Royall, Local structure in deeply supercooled liquids exhibits growing lengthscales and dynamical correlations, Nature communications 9, 3272 (2018).
- Bergmann et al. [2018] S. Bergmann, O. Wrede, T. Huser, and T. Hellweg, Super-resolution optical microscopy resolves network morphology of smart colloidal microgels, Physical Chemistry Chemical Physics 20, 5074 (2018).
- Otto et al. [2020] P. Otto, S. Bergmann, A. Sandmeyer, M. Dirksen, O. Wrede, T. Hellweg, and T. Huser, Resolving the internal morphology of core–shell microgels with super-resolution fluorescence microscopy, Nanoscale Advances 2, 323 (2020).
- Pujals et al. [2019] S. Pujals, N. Feiner-Gracia, P. Delcanale, I. Voets, and L. Albertazzi, Super-resolution microscopy as a powerful tool to study complex synthetic materials, Nature Reviews Chemistry 3, 68 (2019).
- Vlassopoulos and Cloitre [2014] D. Vlassopoulos and M. Cloitre, Tunable rheology of dense soft deformable colloids, Current opinion in colloid & interface science 19, 561 (2014).
- Yunker et al. [2014] P. J. Yunker, K. Chen, M. D. Gratale, M. A. Lohr, T. Still, and A. Yodh, Physics in ordered and disordered colloidal matter composed of poly (n-isopropylacrylamide) microgel particles, Reports on Progress in Physics 77, 056601 (2014).
- Scheffold [2020] F. Scheffold, Pathways and challenges towards a complete characterization of microgels, Nature Communications 11, 4315 (2020).
- Karg et al. [2019] M. Karg, A. Pich, T. Hellweg, T. Hoare, L. A. Lyon, J. Crassous, D. Suzuki, R. A. Gumerov, S. Schneider, I. I. Potemkin, et al., Nanogels and microgels: From model colloids to applications, recent developments, and future trends, Langmuir 35, 6231 (2019).
- Farooqi et al. [2017] Z. Farooqi, S. Khan, and R. Begum, Temperature-responsive hybrid microgels for catalytic applications: a review, Materials Science and Technology 33, 129 (2017).
- Kittel et al. [2022] Y. Kittel, A. J. Kuehne, and L. De Laporte, Translating therapeutic microgels into clinical applications, Advanced Healthcare Materials 11, 2101989 (2022).
- Agrawal and Agrawal [2018] G. Agrawal and R. Agrawal, Functional microgels: recent advances in their biomedical applications, Small 14, 1801724 (2018).
- Scotti et al. [2022] A. Scotti, M. F. Schulte, C. G. Lopez, J. J. Crassous, S. Bochenek, and W. Richtering, How softness matters in soft nanogels and nanogel assemblies, Chemical Reviews 122, 11675 (2022).
- Scheffold et al. [2010] F. Scheffold, P. Díaz-Leyva, M. Reufer, N. B. Braham, I. Lynch, and J. L. Harden, Brushlike interactions between thermoresponsive microgel particles, Physical review letters 104, 128304 (2010).
- Pellet and Cloitre [2016] C. Pellet and M. Cloitre, The glass and jamming transitions of soft polyelectrolyte microgel suspensions, Soft matter 12, 3710 (2016).
- Bouhid de Aguiar et al. [2017] I. Bouhid de Aguiar, T. Van de Laar, M. Meireles, A. Bouchoux, J. Sprakel, and K. Schroën, Deswelling and deformation of microgels in concentrated packings, Scientific reports 7, 10223 (2017).
- Philippe et al. [2018] A.-M. Philippe, D. Truzzolillo, J. Galvan-Myoshi, P. Dieudonné-George, V. Trappe, L. Berthier, and L. Cipelletti, Glass transition of soft colloids, Physical Review E 97, 040601 (2018).
- Paloli et al. [2013] D. Paloli, P. S. Mohanty, J. J. Crassous, E. Zaccarelli, and P. Schurtenberger, Fluid–solid transitions in soft-repulsive colloids, Soft Matter 9, 3000 (2013).
- Cors et al. [2018] M. Cors, L. Wiehemeier, Y. Hertle, A. Feoktystov, F. Cousin, T. Hellweg, and J. Oberdisse, Determination of internal density profiles of smart acrylamide-based microgels by small-angle neutron scattering: A multishell reverse monte carlo approach, Langmuir 34, 15403 (2018).
- Mohanty et al. [2017] P. S. Mohanty, S. Nöjd, K. van Gruijthuijsen, J. J. Crassous, M. Obiols-Rabasa, R. Schweins, A. Stradner, and P. Schurtenberger, Interpenetration of polymeric microgels at ultrahigh densities, Scientific Reports 7, 1487 (2017).
- Keerl et al. [2009] M. Keerl, J. S. Pedersen, and W. Richtering, Temperature sensitive copolymer microgels with nanophase separated structure, Journal of the American Chemical Society 131, 3093 (2009).
- Scotti et al. [2019] A. Scotti, A. R. Denton, M. Brugnoni, J. E. Houston, R. Schweins, I. I. Potemkin, and W. Richtering, Deswelling of microgels in crowded suspensions depends on cross-link density and architecture, Macromolecules 52, 3995 (2019).
- Zhou et al. [2023a] B. Zhou, U. Gasser, and A. Fernandez-Nieves, Measuring the counterion cloud of soft microgels using sans with contrast variation, Nature Communications 14, 3827 (2023a).
- Conley et al. [2017] G. M. Conley, P. Aebischer, S. Nöjd, P. Schurtenberger, and F. Scheffold, Jamming and overpacking fuzzy microgels: Deformation, interpenetration, and compression, Science advances 3, e1700969 (2017).
- Conley et al. [2019] G. M. Conley, C. Zhang, P. Aebischer, J. L. Harden, and F. Scheffold, Relationship between rheology and structure of interpenetrating, deforming and compressing microgels, Nature communications 10, 2436 (2019).
- Rovigatti et al. [2019a] L. Rovigatti, N. Gnan, L. Tavagnacco, A. J. Moreno, and E. Zaccarelli, Numerical modelling of non-ionic microgels: an overview, Soft matter 15, 1108 (2019a).
- Berthier et al. [2010] L. Berthier, A. J. Moreno, and G. Szamel, Increasing the density melts ultrasoft colloidal glasses, Physical Review E 82, 060501 (2010).
- Camerin et al. [2020] F. Camerin, N. Gnan, J. Ruiz-Franco, A. Ninarello, L. Rovigatti, and E. Zaccarelli, Microgels at interfaces behave as 2d elastic particles featuring reentrant dynamics, Physical Review X 10, 031012 (2020).
- Schmidt et al. [2023] M. M. Schmidt, J. Ruiz-Franco, S. Bochenek, F. Camerin, E. Zaccarelli, and A. Scotti, Interfacial fluid rheology of soft particles, Physical Review Letters 131, 258202 (2023).
- Rovigatti et al. [2019b] L. Rovigatti, N. Gnan, A. Ninarello, and E. Zaccarelli, Connecting elasticity and effective interactions of neutral microgels: The validity of the hertzian model, Macromolecules 52, 4895 (2019b).
- Bergman et al. [2018] M. J. Bergman, N. Gnan, M. Obiols-Rabasa, J.-M. Meijer, L. Rovigatti, E. Zaccarelli, and P. Schurtenberger, A new look at effective interactions between microgel particles, Nature communications 9, 5039 (2018).
- Urich and Denton [2016] M. Urich and A. R. Denton, Swelling, structure, and phase stability of compressible microgels, Soft matter 12, 9086 (2016).
- Baul and Dzubiella [2021] U. Baul and J. Dzubiella, Structure and dynamics of responsive colloids with dynamical polydispersity, Journal of Physics: Condensed Matter 33, 174002 (2021).
- Gnan et al. [2021] N. Gnan, F. Camerin, G. Del Monte, A. Ninarello, and E. Zaccarelli, Dynamical properties of different models of elastic polymer rings: Confirming the link between deformation and fragility, The Journal of Chemical Physics 154 (2021).
- Boattini et al. [2020] E. Boattini, N. Bezem, S. N. Punnathanam, F. Smallenburg, and L. Filion, Modeling of many-body interactions between elastic spheres through symmetry functions, The Journal of Chemical Physics 153 (2020).
- Nikolov et al. [2020] S. V. Nikolov, A. Fernandez-Nieves, and A. Alexeev, Behavior and mechanics of dense microgel suspensions, Proceedings of the National Academy of Sciences 117, 27096 (2020).
- Gnan et al. [2017] N. Gnan, L. Rovigatti, M. Bergman, and E. Zaccarelli, In silico synthesis of microgel particles, Macromolecules 50, 8777 (2017).
- Hazra et al. [2023] N. Hazra, A. Ninarello, A. Scotti, J. E. Houston, P. Mota-Santiago, E. Zaccarelli, and J. J. Crassous, Structure of responsive microgels down to ultralow cross-linkings, Macromolecules (2023).
- Ninarello et al. [2019] A. Ninarello, J. J. Crassous, D. Paloli, F. Camerin, N. Gnan, L. Rovigatti, P. Schurtenberger, and E. Zaccarelli, Modeling microgels with a controlled structure across the volume phase transition, Macromolecules 52, 7584 (2019).
- Scotti et al. [2016] A. Scotti, U. Gasser, E. S. Herman, M. Pelaez-Fernandez, J. Han, A. Menzel, L. A. Lyon, and A. Fernández-Nieves, The role of ions in the self-healing behavior of soft particle suspensions, Proceedings of the National Academy of Sciences 113, 5576 (2016).
- Del Monte et al. [2021] G. Del Monte, D. Truzzolillo, F. Camerin, A. Ninarello, E. Chauveau, L. Tavagnacco, N. Gnan, L. Rovigatti, S. Sennato, and E. Zaccarelli, Two-step deswelling in the volume phase transition of thermoresponsive microgels, Proceedings of the National Academy of Sciences 118, e2109560118 (2021).
- Zhou et al. [2023b] B. Zhou, U. Gasser, and A. Fernandez-Nieves, Poly (n-isopropylacrylamide) microgel swelling behavior and suspension structure studied with small-angle neutron scattering, Physical Review E 108, 054604 (2023b).
- Note [1] Importantly, we stress that crystallization is often difficult to detect in simulations, due to the finite system size or to the long nucleation times, also disfavoured by the polydispersity of the employed microgels, but we will return to this point at the end of the manuscript.
- Ruiz-Franco et al. [2023] J. Ruiz-Franco, R. Rivas-Barbosa, M. A. Lara-Peña, J. R. Villanueva-Valencia, A. Licea-Claverie, E. Zaccarelli, and M. Laurati, Concentration and temperature dependent interactions and state diagram of dispersions of copolymer microgels, Soft matter 19, 3614 (2023).
- Boon and Schurtenberger [2017] N. Boon and P. Schurtenberger, Swelling of micro-hydrogels with a crosslinker gradient, Physical Chemistry Chemical Physics 19, 23740 (2017).
- Nöjd et al. [2018] S. Nöjd, P. Holmqvist, N. Boon, M. Obiols-Rabasa, P. S. Mohanty, R. Schweins, and P. Schurtenberger, Deswelling behaviour of ionic microgel particles from low to ultra-high densities, Soft Matter 14, 4150 (2018).
- Van Der Scheer et al. [2017] P. Van Der Scheer, T. Van De Laar, J. Van Der Gucht, D. Vlassopoulos, and J. Sprakel, Fragility and strength in nanoparticle glasses, ACS nano 11, 6755 (2017).
- Gnan and Zaccarelli [2019] N. Gnan and E. Zaccarelli, The microscopic role of deformation in the dynamics of soft colloids, Nature Physics 15, 683 (2019).
- Liétor-Santos et al. [2011] J. J. Liétor-Santos, B. Sierra-Martín, and A. Fernández-Nieves, Bulk and shear moduli of compressed microgel suspensions, Physical Review E 84, 060402 (2011).
- Nikolov et al. [2018] S. Nikolov, A. Fernandez-Nieves, and A. Alexeev, Mesoscale modeling of microgel mechanics and kinetics through the swelling transition, Applied Mathematics and Mechanics 39, 47 (2018).
- Vialetto et al. [2021] J. Vialetto, F. Camerin, F. Grillo, S. N. Ramakrishna, L. Rovigatti, E. Zaccarelli, and L. Isa, Effect of internal architecture on the assembly of soft particles at fluid interfaces, ACS nano 15, 13105 (2021).
- Houston et al. [2022] J. E. Houston, L. Fruhner, A. de la Cotte, J. Rojo González, A. V. Petrunin, U. Gasser, R. Schweins, J. Allgaier, W. Richtering, A. Fernandez-Nieves, et al., Resolving the different bulk moduli within individual soft nanogels using small-angle neutron scattering, Science Advances 8, eabn6129 (2022).
- Zhang et al. [2009] Z. Zhang, N. Xu, D. T. Chen, P. Yunker, A. M. Alsayed, K. B. Aptowicz, P. Habdas, A. J. Liu, S. R. Nagel, and A. G. Yodh, Thermal vestige of the zero-temperature jamming transition, Nature 459, 230 (2009).
- Mohanty et al. [2014] P. S. Mohanty, D. Paloli, J. J. Crassous, E. Zaccarelli, and P. Schurtenberger, Effective interactions between soft-repulsive colloids: Experiments, theory, and simulations, The Journal of chemical physics 140 (2014).
- Gasser et al. [2019] U. Gasser, A. Scotti, and A. Fernandez-Nieves, Spontaneous deswelling of microgels controlled by counterion clouds, Physical Review E 99, 042602 (2019).
- Stieger et al. [2004] M. Stieger, W. Richtering, J. S. Pedersen, and P. Lindner, Small-angle neutron scattering study of structural changes in temperature sensitive microgel colloids, The Journal of chemical physics 120, 6197 (2004).
- Del Monte et al. [2019] G. Del Monte, A. Ninarello, F. Camerin, L. Rovigatti, N. Gnan, and E. Zaccarelli, Numerical insights on ionic microgels: Structure and swelling behaviour, Soft Matter 15, 8113 (2019).
- Bussi et al. [2007] G. Bussi, D. Donadio, and M. Parrinello, Canonical sampling through velocity rescaling, The Journal of chemical physics 126, 014101 (2007).
- Thompson et al. [2022] A. P. Thompson, H. M. Aktulga, R. Berger, D. S. Bolintineanu, W. M. Brown, P. S. Crozier, P. J. in ’t Veld, A. Kohlmeyer, S. G. Moore, T. D. Nguyen, R. Shan, M. J. Stevens, J. Tranchida, C. Trott, and S. J. Plimpton, LAMMPS - a flexible simulation tool for particle-based materials modeling at the atomic, meso, and continuum scales, Comp. Phys. Comm. 271, 108171 (2022).
- Brown et al. [2011] W. M. Brown, P. Wang, S. J. Plimpton, and A. N. Tharrington, Implementing molecular dynamics on hybrid high performance computers–short range forces, Computer Physics Communications 182, 898 (2011).
- Brown et al. [2012] W. M. Brown, A. Kohlmeyer, S. J. Plimpton, and A. N. Tharrington, Implementing molecular dynamics on hybrid high performance computers–particle–particle particle-mesh, Computer Physics Communications 183, 449 (2012).
- Deserno and Holm [1998] M. Deserno and C. Holm, How to mesh up ewald sums. i. a theoretical and numerical comparison of various particle mesh routines, The Journal of chemical physics 109, 7678 (1998).
- Stukowski [2009] A. Stukowski, Visualization and analysis of atomistic simulation data with ovito–the open visualization tool, Modelling and simulation in materials science and engineering 18, 015012 (2009).
- Stukowski [2014] A. Stukowski, Computational analysis methods in atomistic modeling of crystals, Jom 66, 399 (2014).
- Shibayama et al. [1992] M. Shibayama, T. Tanaka, and C. C. Han, Small angle neutron scattering study on poly (n-isopropyl acrylamide) gels near their volume-phase transition temperature, The Journal of chemical physics 97, 6829 (1992).