X-lifecycle Learning for Cloud Incident Management using LLMs
Abstract.
Incident management for large cloud services is a complex and tedious process and requires significant amount of manual efforts from on-call engineers (OCEs). OCEs typically leverage data from different stages of the software development lifecycle [SDLC] (e.g., codes, configuration, monitor data, service properties, service dependencies, trouble-shooting documents, etc.) to generate insights for detection, root causing and mitigating of incidents. Recent advancements in large language models [LLMs] (e.g., ChatGPT, GPT-4, Gemini) created opportunities to automatically generate contextual recommendations to the OCEs assisting them to quickly identify and mitigate critical issues. However, existing research typically takes a silo-ed view for solving a certain task in incident management by leveraging data from a single stage of SDLC. In this paper, we demonstrate that augmenting additional contextual data from different stages of SDLC improves the performance of two critically important and practically challenging tasks: (1) automatically generating root cause recommendations for dependency failure related incidents, and (2) identifying ontology of service monitors used for automatically detecting incidents. By leveraging 353 incident and 260 monitor dataset from Microsoft, we demonstrate that augmenting contextual information from different stages of the SDLC improves the performance over State-of-The-Art methods.
1. Introduction
Large-scale cloud service providers such as Microsoft, Google, Amazon, Salesforce run tens of thousands of services continuously in a complex and distributed environment. Despite significant efforts and best practices, cloud incidents (e.g., performance degradation or unplanned interruptions) are inevitable and can be caused from failure or errors from any stage of the software development lifecycle [SDLC] (e.g., code or configuration errors, dependency failures, monitor logic malfunction, hardware issues, etc.). These incidents can be remarkably expensive for the organization in terms of customer dissatisfaction, economical penalties and engineering manpower required to resolve the incident. For instance, during a major event or festival season, the estimated cost for one hour of service downtime for Amazon is approximately US$100 million (Wolfe, 2018).
Artificial Intelligence for IT Operations (AIOPs) has gained popularity where data-driven AI techniques are used to automate parts of the incident life-cycle including incident prioritization (Chen et al., 2020b), similar incident linking (Chen et al., 2020a; Ghosh et al., 2024), and reducing the time to mitigate (TTM) incidents (Chen et al., 2019; Jiang et al., 2020). Motivated by recent advancements in large language models (LLMs) (e.g., ChatGPT (OpenAI, 2023a), GPT-4 (OpenAI, 2023b), Gemini (Google, 2023)), there has been a increasing momentum in harnessing LLMs to automate various aspects of the incident life cycle. These applications span from intelligent monitoring for detection (Ganatra et al., 2023; Srinivas et al., 2024) to automated query recommendations (Jiang et al., 2023) and automated root causing and mitigation (Ahmed et al., 2023; Zhang et al., 2024; Chen et al., 2023) of incidents. The existing research often focuses on leveraging contextual information relevant to individual incidents or services, thereby overlooking the complex interactions and data communication across different stages of the software development life cycle (SDLC). However, in practice, on-call engineers (OCEs) takes into consideration a wide variety of cross-lifecycle (X-lifecycle) contextual information for understanding and resolving incidents. In this work, we identified two such practically important and challenging scenarios:
-
(1)
Root cause analysis for dependency failures: Diagnosing incident typically requires significant manual effort and back-and-forth communication among OCEs. Existing research only leverage incident meta-data (e.g., incident title and summary) for either finetuning LLMs (Ahmed et al., 2023) or directly querying pretrained LLMs with in-context examples (Zhang et al., 2024; Chen et al., 2023). However, for certain categories of incidents such as failures stemming from dependent partner services, we need to consider additional information (e.g., upstream service dependencies and their functionalities) for holistic understanding and reasoning.
-
(2)
Monitor categorization: Automatically learning a structured ontology for monitors is useful for developing data-driven intelligent monitoring systems. (Srinivas et al., 2024) leverage LLMs using only monitor metadata to categorize monitors based on what to monitor (resource class) and which metrics to monitor (SLO class). However, there are no specific templates for the monitor metadata, and it highly depends on the engineer who creates it. As a result, it often includes a lot of software, deployment environment, and service-specific information that may not provide sufficient context on what exactly is being monitored (resource class) and which metrics are being monitored (SLO class). Therefore, additional information on the service and component functionality needs to be captured for additional context.
In this work, we propose to leverage X-lifecycle data (e.g. service architecture, dependencies and functionalities) for enhancing the quality of automated recommendations from LLMs for both root cause analysis of dependency failures and monitor categorization problem. Our goal is to answer the following research questions: (a) RQ1: In a cloud setting with distributed architecture, how does data from different stages of the service lifecycle influence decision making and how can we propose approaches to leverage this data for better decision-making? (b) RQ2: How upstream service dependencies and their service property information help in root cause analysis of dependency failures? (c) RQ3: How does the influence of service architecture and service functionality vary in identifying SLO and resource categories of the monitor?
To answer these questions, we conducted extensive experiments on real-world incident and monitor dataset from Microsoft. For root cause recommendation of dependency failures, we identified 353 (roughly 50% of these are dependency failures) high impact historical incidents from Intelligent Conversation and Communication Cloud (IC3) service which supports the back-end of Teams application, serving more than 250 million users worldwide. We first summarize the root causes and incident summaries to reduce noise and input token length. Motivated by Zhang et al.(Zhang et al., 2024), we create an end-to-end pipeline to retrieve top 5 similar incidents from historical data corpus, which are used as in-context examples. In addition to incident metadata, we curate the upstream service dependencies along with their service properties and functionalities for a given service. Finally, for a given incident originated from a particular service, we generate a prompt with in-context examples and upstream service descriptions and query GPT-4 model to generate the plausible root cause information. Using human evaluation along with lexical and semantic evaluation metrics, we demonstrate that augmenting service properties and upstream dependency information on top of in-context examples can significantly improve the root cause recommendation accuracy over State-of-The-Art (SoTA) finetuned and in-context learning methods.
For monitor categorization, our goal is to classify the automated watchdogs or monitors based on resource and SLO classes. Motivated by Srinivas et al. (Srinivas et al., 2024), we considered 13 resource classes and 9 SLO classes. However, in addition to monitor metadata, we curate the service and component properties which are essential to capture the context of a monitor. Our experimental results on 260 real-world monitors demonstrate that additional service and component details in GPT-4 prompt improves the overall accuracy and F1 score both by 4% over SoTA methods for SLO classification tasks. To that end, our key contributions are as follows:
-
•
This is the first work to demonstrate the promise of using X-lifecycle service information for improving the accuracy of incident management tasks by leveraging real-world dataset from Microsoft.
-
•
For root cause analysis, we demonstrate that leveraging service functionality and upstream dependency information can assist LLMs in better reasoning and improve the quality of the recommendations over the SoTA methods.
-
•
For monitor categorization, we demonstrate that leveraging service and component functionalities can boost the classification accuracy while predicting the resource and SLO classes. The results show a consistent enhancement in SLO class predictions while incorporating additional context from service descriptions.
2. Background
In this section, we provide an overview of incident management lifecycle and highlight the promise of LLMs for automated root cause analysis and monitor categorization.
2.1. Incident Management
Large cloud systems continuously runs tens of thousands of services. Each service stores several important information ranging from service details (e.g., properties, architecture and functionality) to application files (codes, configuration, security certificates), to service dependency data, to troubleshooting guides, and other documentations. Once a service disruption or incident occurs, OCEs carefully refer to these information to properly understand and resolve them. Every production incident within Microsoft typically goes through four stages as shown in Fig. 1.
-
(1)
Detection: To quickly detect the failures impacting a service, engineers setup automated watchdogs that continuously monitors the system’s health. The incidents reported by these monitors are referred as monitor-reported incidents (MRIs). Internal engineers or external customers of a given service can also report incidents, which are referred as customer-reported incidents (CRIs).
-
(2)
Triaging: Once an incident is reported in a centralized incident management (IcM) system, it is routed to the appropriate team of OCEs after an initial investigation. This incident triaging process sometimes can take multiple rounds to reach the correct team of OCEs.
-
(3)
Root cause analysis: After the incident is triaged to a proper team, multiple rounds of back and forth communication takes place between the OCEs inspecting different aspects of the incident. OCEs usually referred to various source of information including trouble shooting guides and similar historical incidents to understand key root causes of the failure.
-
(4)
Mitigation: Once the root cause is identified, OCEs take several sequential actions resolve the problem and recover the service health.
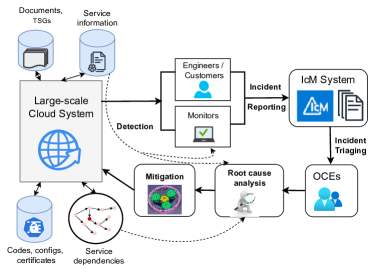
Incident management lifecycle.
2.2. Monitor Management in Cloud Services
Cloud service owners must continuously monitor their services to maintain high availability and reliability. Inadequate monitoring can result in delayed incident detection and negative customer impact (Srinivas et al., 2024). Currently, developers rely on a trial and error approach and their tribal knowledge to create monitors, which is ad-hoc and reactive. This often leads to incomplete coverage, causing production issues or redundancy, resulting in wasted effort and noise. Therefore, to ensure cloud service reliability, a monitor recommendation framework is crucial, and we can use data-driven approaches for this purpose (Srinivas et al., 2024). However, the unstructured nature of monitors poses a challenge in moving towards a data-driven approach. The monitor metadata does not make it obvious which resource characteristics and exact metrics are being monitored (c.f. Fig. 2). Hence, we need a structured approach to tackle this problem, and a structured ontology over the existing monitors is the first step in generating monitor recommendations for a given cloud service. By implementing a structured ontology over the monitor data from existing services, we can identify the resource characteristics and exact metrics being monitored for a given service. This structure over the existing monitors and the properties of those services can be leveraged for a data-driven approach to suggest monitors for a new service with a given set of properties.
Srinivas et al. (Srinivas et al., 2024) presents an empirical study on the existing monitors in Microsoft and defines an ontology over them. The ontology focuses on two dimensions: what to monitor (resource class) and which metrics to monitor (SLO class). The major resource classes include API, Dependency, CPU, Compute cluster, Storage, Ram-memory, Cache-memory, Container, Certificates, IO, Service level, and Paging memory. The major SLO classes include Success Rate, Capacity, Latency, Availability, Throughput, Success Rate-QoS, and Interruption Rate. Interested readers can refer to the citation for the definitions of these classes. The current approach for ontology assignment from the citation relies solely on the monitor metadata. However, as seen in the monitor snapshot Fig. 2, the monitor metadata contains many software and organization-specific tokens. Additional context on the underlying service might be helpful for better assignment.
Metric Name: missedSLA
Service Name: Service A
Alert title: Monitor {Monitor.DisplayName} of
{Monitor.Dimension.scenario} is unhealthy
Alert Conditions: [{“Name”:“missedSLAAlert”,“Severity”:4,
“HealthStatus”:1,“Metadata”:{},“Conditions”:[{}]}]
2.3. Root Cause Analysis of Incidents
Incident root-causing is a complex and challenging process that demands a significant amount of manual effort and domain knowledge about the services involved. Incidents can arise from various failures such as code bugs, configuration errors, dependency failures, hardware failures, and more. Due to the vast number of possibilities, it is non-trivial for OCEs to quickly reach an accurate conclusion. Therefore, root cause analysis is a time-consuming process, and human error can further delay the resolution process, leading to a significant impact on customer satisfaction.
Our primary focus lies on incidents caused by dependency failures from partner services. Fig. 3 illustrates a real incident stemming from service dependency failures, along with their respective title, summary, and root cause information. Recently, LLMs have been leveraged to generate automated root cause recommendations at the time of incident creation, aiming to guide the OCEs in the right direction to accelerate the resolution process.
For generating automated root cause recommendations, Ahmed et al. (Ahmed et al., 2023) proposed fine-tuning a LLM model with historical incident data, while Zhang et al. (Zhang et al., 2024) suggested leveraging pre-trained LLM models with similar in-context examples. However, existing research only utilizes incident metadata (e.g., title and summary), which may not always provide accurate information regarding root causes, as shown in Fig. 3. For instance, in the case of dependency failures, it is crucial to carefully inspect all the upstream dependent service properties to understand the critical points of failures.
Summary: The incident has affected the availability and performance health of the Teams Authentication Availability service, as indicated by the Availability Dashboard. Unfortunately, the initial summary does not provide specific error codes or log details, nor does it mention any external services or tools that might contain relevant information.
Owning Service Name: Teams Auth Service
Root cause: The root cause of the incident was an Azure networking outage, which led to increased latencies and timeouts with Redis connections in the Teams Auth Service.
3. Methodology
In this section, we present our methodology for augmenting LLM prompts with X-lifecycle. contextual information for improving performance of recommendations for two scenarios: (1) Root cause analysis of dependency failure incidents, where service dependencies and their properties play a crucial role; and (2) Monitor classification for resource and SLO classes, where service architecture and functionalities are used to boost the classification accuracy.
3.1. Root Causing for Dependency Failures
3.1.1. Problem Formulation
Large-scale cloud service providers deal with thousands of incidents daily, originating from different services and teams, of varying severity, which are detected manually or by monitors. Even though the OCEs are highly trained and follow a systematic protocol, finding the root cause of an incident is a non-trivial task. It not only requires domain-specific knowledge, but also an overall understanding of the intra and inter-service architecture in order to identify how a service failures can trigger a cascading effect and impact other dependent services. Moreover, after having identified a particular causal link, pinpointing the exact cause of failure is a highly complicated process, requiring the input of multiple teams. In the case of such incidents, minimizing the overall impact time is crucial in order to avoid large-scale customer dissatsfaction and uphold the quality of service.
Due to its practical importance, several research works leverages LLMs for generating automated root causes recommendations either by finetuning an LLM with incident metadata (Ahmed et al., 2023) or by querying a pre-trained LLM with similar in-context historical incident examples(Zhang et al., 2024; Chen et al., 2023). However, in practice, OCEs refer to several other contextual information (e.g., logs, codes, service information, monitor reports, dependency information, etc.) while identifying root causes of an incident.
As there could be several types of root causes, and the contextual data required for proper analysis might differ, we primarily focused on a particular types of incidents which were caused due to dependency failures as it is one of the most frequently encountered causes. For dependency failures, OCEs typically refer to other upstream services dependencies to identify the critical service owners so as to collaboratively solve the problem. An upstream service dependency denotes a relationship between two services, where one service (the dependent service) relies on the other (the upstream service) to fulfil its operational requirements. A failure, or modification in the upstream service could result in an incident occurring in the dependent service due to the propagating effects. To accurately identify an incident as an upstream service dependency failure, the OCEs leverage contextual information, their understanding of the affected service, it’s dependency architecture, upstream service properties and external factors that could potentially cause the incident, along with the incident metadata, for diagnosis.
In order to emulate the strategy of OCEs, we first retrieve top 5 similar incidents that can be used as in-context examples (Zhang et al., 2024). In addition, for a given incident originated from a particular service, we curate all the upstream services and their corresponding service properties, which are then augmented with the in-context examples in the prompt used for querying pre-trained LLM models.
3.1.2. Data Preparation
The data preparation pipeline can be broadly categorized into two parts, (i) Data collection and (ii) Data cleaning and summarization.
(i) Data collection: We begin by collecting incident data for 353 resolved or mitigated incidents (roughly half of them are caused due to dependency failures) occurred between January 1, 2023 to January 10, 2024 from the IC3 service. Each incident metadata contains it title, initial summary written at the time of incident creation, owning service name and the ground truth root causes. For a particular incident, we also fetch all the upstream dependency service identifiers (UpstreamServiceIds) of its owning service from Microsoft’s internal dependency tracking system (DTS) tool. This tool curates several information to link the services including shared subscription information, logs of service communication using domain name system(DNS), shared resource information, etc. The UpstreamServiceIds are then used to fetch the service details from another database that stores the service properties and functionalities. In addition, we created an retrieval augmented generation (RAG) pipeline where historical incident data are stored in a vector database (as proposed by Zhang et al. (Zhang et al., 2024)). We then utilize the FAISS (Johnson et al., 2019) library for efficient similarity search and retrieval of top 5 similar in-context incident examples with their corresponding title, summary and reference root causes.
(ii) Data Cleaning and Summarization: The raw incident summary and root causes that are collected from incident management (IcM) portal contains various noise such as HTML tags, images, tables, stack traces and other non-contextual information, which are not ideal for us due to two reasons: (a) it can be lengthy and cause input token limit exhaustion during LLM inference, and (b) additional noise can hamper the reasoning capabilities of pre-trained LLMs and lead to hallucination. Therefore, we used a two-stage method for effectively remove noise from the data. First, we locally process the data to remove HTML tages, tables, long stack traces and image tags. After the initial processing, we summarize the root causes and initial summary in a concise form with the help of GPT-3.5-turbo 111https://platform.openai.com/docs/models/gpt-3-5-turbo model, where we consider a similar instruction prompt introduced by Zhang et al. (Zhang et al., 2024). In addition, we also leverage GPT-3.5-turbo model to summarize a subset of service descriptions which were verbose and noisy. A sample instruction prompt for service property summarization is illustrated in Fig. 4.
Focus on the following aspects of the service functionality:
* The functionality provided by the service
* References to resources it operates
* Distinguishing features of the service that clearly explains its operation
Your summary should be at most 2-3 sentences and should be in third person.
3.1.3. Methods and Baselines
To critically observe the impact of upstream service information in the root-cause analysis, we develop five strategies for leveraging LLM models 222Except for the finetuned model, we always perform inference with GPT4 model, where the temperature parameter is set to 0 in order to get deterministic results.:
- Historical Incident Summary 5: Retrieved summary - Historical Incident Title 5: Retrieved title - Historical Incident Root Cause 5: Retrieved Root cause – Answering Format: Your output response should strictly be a **Json** file with the following two objectives: Objective1: Infer and explain in detail, the Root cause that could have caused the incident Objective2: Binary classification as follows: If and only if you identify the root cause as an upstream service dependency, return “Yes”. Else, if the incident is **not** caused due to the failure of an upstream service, return “No” – Incident Details:
- Service: Service Name - Functionality: Functionality of the Service - Incident Summary: The summary of the incident - Incident Title: Title of the incident – Upstream Service Dependencies: 1. Upstream Service Name – Description of the Upstream Service n. Upstream Service Name – Description of the Upstream Service
-
(1)
Our method (InC DEP) – Incident Info + In-context Examples + Dependency Details develops a prompt with five distinct parts: Task description, In-context examples, Answering format, Incident details and Upstream service information. An illustration of the prompt is demonstrated in Fig. 5. The Task Description instructs the model to assume the role of an OCE to perform root cause analysis for Azure cloud incidents, followed by describing the concept of Upstream service dependencies and failures. For in-context examples, we retrieve the top 5 similar incidents from historical data corpus using FAISS (Johnson et al., 2019) library, and add their corresponding title, summary and root causes.
The answering format specifies the format in which the model should give the output. We instruct the model to return the answers in a json format with two Objectives: (a) inferring the potential root cause of the incident and (b) based on recommended root cause, classify whether it is a dependency failure. The incident details provides contextual information such as the title, summarized initial summary, owning service name and a summary of its functionality.
Lastly, the upstream service information contains the list of upstream service dependencies of the owning service and their corresponding summarized service properties. Thus, we query a pre-tained GPT-4 model to reason with incident metadata, in-context examples and upstream service properties, to infer the potential root causes of a given incident.
-
(2)
Only Incident Info (NoDEP). For this baseline method, we develop a prompt only with incident metadata (i.e. title, summary and owning service description) and query the GPT-4 model in a zero-shot setting.
-
(3)
Incident Info + Dependency Details (DEP). In this prompting strategy, in addition to the incident metadata, a list of all the Upstream Service Dependencies and their summarized descriptions are also included. The Task Description section also includes statements that introduce the Upstream Service Dependencies section and it’s objective.
-
(4)
Incident Info + In-context Examples (InC NoDEP) (Zhang et al., 2024). For this method, we emulate the prompt strategy proposed by Zhang et al. (Zhang et al., 2024), where along with incident metadata, we also retrieve the top 5 similar in-context incident examples and add their corresponding metadata into prompt. In addition, we provide a summarized description of owning service properties in the prompt.
-
(5)
Finetuning LLM (Ahmed et al., 2023) (FtGPT). Lastly, We finetune a GPT-3 model with last 3 years of historical incidents originated from all the services within Microsoft, where the title, summary and owning tenant name are given as input and the ground truth root causes are provided as reference. The fine-tuned GPT-3 model is expected to learn the semantics of the incident management domain by feeding information regarding all possible types of information and their root causes.
3.1.4. Evaluation metrics
We use both lexical and semantic quantitative metrics to evaluate similarity between actual root cause and the recommendations generated by different models.
Lexical Metrics.
We use three lexical metrics, namely, the smooth sentence BLEU-4 (Bilingual Evaluation Understudy) (Lin and Och, 2004) metric to assess the overlap of n-grams ranging from 1 to 4 between the reference and generated texts. Also, we apply the ROUGE metric (Recall Oriented Understudy for Gisting Evaluation) (Lin, 2004) to compare a candidate document with a set of reference texts. We specifically pick ROUGE-L (Lin, 2004), which accounts for sentence-level structural similarity and finds longest co-occurring in sequence n-grams based on Longest Common Subsequence (LCS) (Hirschberg, 1977) statistics. Furthermore, we incorporate the METEOR (Metric for Evaluation of Translation with Explicit Ordering) (Banerjee and Lavie, 2005) which evaluates the generation quality based on the harmonic mean of unigram precision and recall as well as stemming and synonymy matching as extra features.
Semantic Metrics.
Unlike lexical metrics, which primarily focus on exact word matching, we want to evaluate the preservation of overall semantic meaning in the generated results. To achieve this, we use two semantic metrics that go beyond exact word matches and consider the contextual meaning of words. We use BERTScore (Zhang et al., 2019), which uses the pre-trained contextual embeddings from the BERT (Devlin et al., 2019) model to measure the similarity between candidate and reference sentences based on cosine similarity. Lastly, we integrate NUBIA (NeUral Based Interchangeability Assessor) (Kane et al., 2020), a recent neural-based measure that combines the semantic similarity, logical inference, and sentence legibility from exposing layers of pre-trained language models, including RoBERTa STS (Liu et al., 2019b), RoBERTa MNLI and GPT-2 (Radford et al., 2019).
3.2. Monitor Management
3.2.1. Problem Formulation
Detecting anomalous behavior or early symptoms can significantly reduce the impact on customers and speed up the process of resolving incidents. At Microsoft, production incidents are either detected by automated system watchdogs that continuously monitor service health and telemetry data, or reported by users (internal or external). Although literature highlights the importance of monitoring Service Level Objectives, it is often not clear what exactly to monitor and where to monitor for a given service (Srinivas et al., 2024). Service owners or developers typically use their expertise and domain knowledge to create monitors that ensure the continuous availability of a service. Given that each monitor name differs even if it observes the same signal, making it essential to identify and learn the underlying structure of monitors to move towards an automated approach to monitor recommendation using service properties. In their work, (Srinivas et al., 2024) defines two major dimensions of the monitors: resource classes (what to monitor within a service) and SLO classes (which metrics are most representative of the performance, efficiency, and reliability of a cloud service) to restructure the monitor space. As fine-tuning is resource-intensive and requires significant human effort in generating labels, (Srinivas et al., 2024) learns structure over the space using in-context learning with monitor metadata.
However, learning structure over the monitor space given the monitor metadata is not a trivial task. In addition to the domain-specific knowledge, this task also requires additional context such as the exact nature of the underlying service. Therefore, our aim here is to provide additional context by combining data that exists in silos to structure the monitor space with better accuracy. Our problem here boils down to given the monitor metadata, leverage additional context from various silo databases to identify the resource and SLO classes associated with the monitor.
3.2.2. Data Preparation
The company maintains an internal directory that tracks all services, providing information on the functionality description of each service, as well as the microservices and components within them. Therefore, we curate the following information for each monitor:
-
(1)
Contextual information on the exact functionality of the underlying service
-
(2)
Contextual information on the service architecture, namely, service components and their individual functionality.
We combine the monitor metadata, which includes
monitor name, metric name, service name, alert title (used to create the alert when the thresholds are violated), and the alert conditions, along with the service description and descriptions of components associated with the service. We leverage the contextual information to mine for the monitor structure.
We manually labeled 260 monitors for resource classes and 180 monitors for SLO Classes. This labeled data served as the ground truth for our predictive models.
- Focus on extracting relevant information from the descriptions. - Pay attention to specific features or characteristics indicative of the resource class. - Consider negations or exceptions in descriptions. - Highlight the importance of understanding relationships between different elements.
3.2.3. Methods and Baselines
We use GPT4 model and conduct experiments with various combination of data sources to evaluate their efficacy in generating resources and SLO classes:
-
(1)
Case 1: Baseline experiment only utilizes monitor metadata for prediction.
-
(2)
Case 2: Incorporating monitor data and service descriptions.
-
(3)
Case 3: Combining monitor data, service descriptions, and descriptions of components associated with the service.
-
(4)
Case 4: Employing monitor data and descriptions of components associated with the service.
3.2.4. Evaluation metrics
We assess the performance of contextual information on each of the resource and SLO classes using precision, recall, F1-score, and accuracy metrics. Metrics were calculated for each class within resource and SLO class categories. By evaluating these metrics across different cases, we aim to understand the impact of incorporating additional data on the accuracy and effectiveness of predicting resource and SLO classes.
4. Experimental Results
In this section, we present the performance of our proposed methodology for two earlier mentioned scenarios: (a) How dependent-service description help in improving root cause analysis? and (b) How service architecture and functionality information help in monitor categorization?
4.1. How dependent-service description help in improving root cause analysis?
For this experiment, we used a data corpus with 3 years of incidents and selected 353 recent incidents from IC3 for evaluation, while rest are used for creating vector database for in-context learning and finetuning the GPT model. In terms of classifying whether an incident is caused due to dependency failures, we observe that without dependency information (i.e., NoDEP method), we achieve a F1-score of 0.4, while adding in-context examples (i.e., InC NoDEP method) add more noise and further reduces the F1-score to 0.16. However, adding dependency information in the prompt (i.e., DEP and InC DEP method) can boost the F1-score to 0.58 while classifying dependency failures.
In Tab. 1, we demonstrate the effectiveness of our model in employing both upstream service description as well as in-context description. We conducted a comparison across four prompting strategies along with FinetunedGPT (Ahmed et al., 2023), as outlined in Sec. 3.1.3. From these results, we identify a few interesting observations: (1) Expect for NUBIA scores, the average similarity metrics for finetuned GPT-3 model recommendations are almost always lower than other methods. This can be due to two factors: (a) we finetuned a GPT-3 model as finetuning a GPT-4 model requires significant cost and GPU resources, whereas other methods leverages GPT-4 model for inferencing, and (b) as finetuning considers incidents from all the services, it is prone to hallucinate for these specific dependency failures. (2) Providing only incident description (i.e., NoDEP method) does not help in imparting right contextual information regarding the consequences resulting from its failure, and therefore, performs poorly. Having service description along with incident metadata in prompt (i.e., DEP method) also does not help in improving the quality of root-cause recommendations, rather the performance drops slightly in some cases. (3) Once we include in-context examples in the prompt without dependencies (i.e., InC NoDEP), usually it sightly outperforms DEP, NoDEP and FtGPT method, as similar examples help the model to better reason about current incident and reason about how to write the root cause recommendation. However, once we add the service dependency information along with in-context examples, we observe that the model now has full context about what upstream dependent service might cause the failure along with how to frame the root causes for such failures. Therefore, our method (InC DEP) boost the performance by a huge margin in comparison to other benchmark methods. For lexical metrics, we observe a 5-38% gain (lowest for METEOR; highest for BLEU), while for the semantic metrics NUBIA scores gains by 54.67% over other promting strategies.
| FtGPT (Ahmed et al., 2023) | NoDEP | DEP | InC NoDEP | InC DEP | |
|---|---|---|---|---|---|
| BLEU | 5.64 5.05 | 6.26 2.14 | 6.14 2.55 | 6.86 2.69 | 9.43 4.23 |
| METEOR | 20.14 8.27 | 26.41 6.16 | 26.03 6.58 | 26.54 6.98 | 26.72 8.56 |
| ROUGE | 17.72 9.75 | 16.32 3.66 | 16.03 4.11 | 17.59 4.35 | 21.14 6.34 |
| BERT Score | 85.60 3.04 | 85.83 1.40 | 85.73 1.48 | 86.11 1.47 | 86.65 1.67 |
| NUBIA | 20.63 20.12 | 12.32 17.26 | 11.68 15.12 | 13.17 18.14 | 20.37 21.70 |
Further, to evaluate the overall performance regarding incidents stemming from upstream service failures versus other causes, we segregated the incidents into two distinct categories based on ground truth of incident categories available in IcM. As depicted in Table 2, we demonstrate the performance comparison for different quantitative metrics for incidents caused due to service dependency failures (referred to as SD) vs other categories of incidents (referred to as NoSD). As expected, we observe that the performance of our InC DEP method is significantly better for generating close to ground truth root cause recommendations for dependency failure incidents over other categories of incidents. Moreover, except for METEOR score, we observe that the performance gain generalizes to other categories of incidents as well, as our InC DEP method almost always outperforms other prompting strategies for non-dependency related failures as well.
| FtGPT (Ahmed et al., 2023) | NoDEP | DEP | InC NoDEP | InC DEP | ||||||
|---|---|---|---|---|---|---|---|---|---|---|
| NoSD | SD | NoSD | SD | NoSD | SD | NoSD | SD | NoSD | SD | |
| BLEU | 5.271 | 5.972 | 6.268 | 6.255 | 6.085 | 6.190 | 6.884 | 6.843 | 9.285 | 9.551 |
| METEOR | 19.448 | 20.750 | 26.048 | 26.731 | 25.389 | 26.584 | 25.921 | 27.087 | 25.708 | 27.605 |
| ROUGE | 17.364 | 18.035 | 16.416 | 16.234 | 16.045 | 16.010 | 17.502 | 17.670 | 20.644 | 21.577 |
| BERT Score | 85.671 | 85.523 | 85.790 | 85.865 | 85.578 | 85.858 | 86.017 | 86.199 | 86.508 | 86.772 |
| NUBIA | 23.050 | 18.511 | 13.578 | 11.210 | 12.733 | 10.762 | 15.141 | 11.437 | 22.982 | 18.072 |
Human evaluation.
We also manually evaluated the accuracy of root cause recommendations from different methods against the ground truth root cause information. For this study, we chose 30 recent incidents from our pool of 353 incidents, out of which 20 were caused due to dependency failures. This evaluation involves three of the authors first separately providing correctness score for each of the recommendations in the scale of 1 to 5, where ”5” represents that the recommendation fully captures the semantic of ground truth and ”1” represents that the recommendation is completely irrelevant. Finally, all three evaluators discuss and finalize the scores where there were disagreements. The overall correctness scores from recommendations of different methods are summarized in Tab. 3. Overall, we observe that our method with dependency information and in-context examples significantly outperforming the FinetunedGPT model by 53.89%. Moreover, additional dependency information can further boost the accuracy by 3.6% over the InC NoDEP method.
| FtGPT | NoDEP | DEP | InC NoDEP | InC DEP | |
|---|---|---|---|---|---|
| 1.8 1.1 | 2.27 1.17 | 2.63 1.13 | 2.67 1.24 | 2.77 1.36 | |
| Median | 1 | 2 | 2 | 2 | 2 |
| Mode | 1 | 1 | 2 | 2 | 2 |
4.2. How service architecture and functionality information help in monitor categorization?
Here, we analyze the effect of different contextual information on identifying monitor classes and how this effect varies across resource and monitor classes.
4.2.1. How can service architecture and functionality help improve the accuracy of identifying the SLO categories of monitors?
| precision | recall | f1-score | accuracy | |||||||||||||
|---|---|---|---|---|---|---|---|---|---|---|---|---|---|---|---|---|
| C1 | C2 | C3 | C4 | C1 | C2 | C3 | C4 | C1 | C2 | C3 | C4 | C1 | C2 | C3 | C4 | |
| Availability | 0.48 | 0.48 | 0.47 | 0.45 | 0.85 | 1.00 | 0.88 | 0.88 | 0.59 | 0.65 | 0.61 | 0.60 | 0.85 | 1.00 | 0.88 | 0.88 |
| Capacity | 0.89 | 0.90 | 0.90 | 0.89 | 0.57 | 0.64 | 0.64 | 0.57 | 0.70 | 0.75 | 0.75 | 0.70 | 0.57 | 0.64 | 0.64 | 0.57 |
| Freshness | 1.00 | 1.00 | 0.90 | 1.00 | 0.67 | 0.75 | 0.75 | 0.67 | 0.80 | 0.86 | 0.82 | 0.80 | 0.67 | 0.75 | 0.75 | 0.67 |
| Interruption Rate | 1.00 | 1.00 | 1.00 | 0.50 | 0.23 | 0.31 | 0.15 | 0.08 | 0.38 | 0.47 | 0.27 | 0.13 | 0.23 | 0.31 | 0.15 | 0.07 |
| Latency | 0.82 | 0.88 | 0.82 | 0.73 | 1.00 | 1.00 | 1.00 | 0.83 | 0.90 | 0.94 | 0.90 | 0.78 | 1.00 | 1.00 | 1.00 | 0.82 |
| Others | 0.00 | 0.00 | 0.50 | 0.00 | 0.00 | 0.00 | 0.14 | 0.00 | 0.00 | 0.00 | 0.22 | 0.00 | 0.00 | 0.00 | 0.14 | 0.00 |
| Reliability | 0.87 | 0.96 | 0.88 | 0.90 | 0.94 | 0.92 | 0.90 | 0.92 | 0.90 | 0.94 | 0.89 | 0.91 | 0.94 | 0.92 | 0.90 | 0.92 |
| Success Rate | 0.85 | 0.92 | 0.69 | 0.73 | 0.55 | 0.55 | 0.45 | 0.55 | 0.67 | 0.69 | 0.55 | 0.63 | 0.55 | 0.55 | 0.45 | 0.55 |
| Throughput | 0.87 | 0.87 | 0.86 | 0.81 | 0.93 | 0.93 | 0.86 | 0.93 | 0.90 | 0.90 | 0.86 | 0.87 | 0.93 | 0.93 | 0.86 | 0.93 |
Tab. 4 presents class-wise metrics for individual SLO classes with different contextual information. C1 indicates the baseline results, C2 indicates predictions with service descriptions and monitor metadata, C3 indicates predictions with service descriptions, monitor metadata, and component level descriptions, and C4 presents the predictions with monitor metadata and component level descriptions. For SLO classification, the addition of service description appears to have a particularly positive effect on classes such as Availability and Freshness, where the recall significantly increased. This suggests that the additional information provided by the service description aids in better identifying instances belonging to these classes.
Q1: The Service Level Objective (SLO) tracked by this monitor appears to be related to the freshness of definitions. The monitor name suggests that it is tracking the age of certain definitions, likely related to the services provided . If these definitions exceed 7 days old, an alert is triggered. This could be important in ensuring that the most up-to-date definitions are being used in the service delivery for . Q2: The SLO being tracked by this monitor can be categorized under the generic class of “Freshness”. This is because the monitor is tracking the age of definitions, which is a measure of how current or fresh the definitions are.
Fig. 7 shows the GPT response for prompts with additional in context information. As seen in the figure, the additional service description provides better context for SLO classification. On the other hand, in classes like Interruption Rate and Success Rate, the impact seems less pronounced, indicating that the service description might not provide as much discriminatory information for these classes. Overall, the results indicate that incorporating service description alongside monitor metadata leads to improved prediction performance for certain SLO classes, particularly in terms of recall and F1-score.
We observe that the experimental model shows a slight improvement in accuracy compared to the baseline model, with an increase from 0.75 to 0.79. This indicates that incorporating service description contributes to better overall prediction performance across all SLO Classes. In terms of the macro average of precision, recall, and f1-score, the experimental model also exhibits improvement, albeit modest. The macro average precision, recall, and f1-score increased from 0.78, 0.75, and 0.73 in the baseline model to 0.83, 0.79, and 0.77 respectively, in the experimental model. This indicates that the experimental model performs better, particularly for the classes that are more prevalent in the dataset.While the inclusion of both service and component descriptions in C3 does yield improvements in certain cases such as Others, it does not consistently show remarkable enhancements compared to the baseline. This observation suggests that while the overall functionality of a service can indeed define its service level objectives, individual component descriptions, as utilized in C4, may not always contribute significantly to the predictive performance.
Overall, while the improvements may vary across different evaluation metrics, the experimental model consistently outperforms the baseline model, demonstrating the effectiveness of integrating additional features for enhanced prediction accuracy and reliability.
4.2.2. How can service architecture and functionality help improve the accuracy of identifying the resource categories of monitors?
| precision | recall | f1-score | accuracy | |||||||||||||
|---|---|---|---|---|---|---|---|---|---|---|---|---|---|---|---|---|
| C1 | C2 | C3 | C4 | C1 | C2 | C3 | C4 | C1 | C2 | C3 | C4 | C1 | C2 | C3 | C4 | |
| API | 0.44 | 0.43 | 0.32 | 0.35 | 0.72 | 0.83 | 0.91 | 0.87 | 0.55 | 0.56 | 0.47 | 0.50 | 0.78 | 0.83 | 0.91 | 0.88 |
| Dependency | 0.64 | 0.76 | 0.67 | 0.71 | 0.47 | 0.50 | 0.37 | 0.51 | 0.55 | 0.60 | 0.48 | 0.59 | 0.50 | 0.54 | 0.38 | 0.51 |
| Compute cluster | 0.69 | 0.71 | 0.50 | 0.89 | 0.38 | 0.50 | 0.41 | 0.43 | 0.49 | 0.59 | 0.45 | 0.58 | 0.47 | 0.52 | 0.42 | 0.46 |
| Service level | 0.48 | 0.47 | 0.50 | 0.52 | 0.33 | 0.22 | 0.20 | 0.24 | 0.39 | 0.30 | 0.28 | 0.33 | 0.39 | 0.26 | 0.20 | 0.25 |
| Cache-memory | 0.81 | 0.90 | 0.79 | 0.76 | 0.85 | 0.95 | 0.96 | 0.96 | 0.83 | 0.93 | 0.86 | 0.85 | 1.00 | 1.00 | 0.96 | 1.00 |
| Ram-memory | 1.00 | 1.00 | 1.00 | 1.00 | 0.83 | 1.00 | 0.99 | 0.99 | 0.91 | 1.00 | 0.99 | 1.00 | 0.95 | 1.00 | 0.98 | 1.00 |
| CPU | 0.63 | 0.62 | 0.85 | 0.84 | 0.90 | 1.00 | 0.96 | 0.95 | 0.75 | 0.76 | 0.90 | 0.89 | 1.00 | 1.00 | 0.96 | 1.00 |
| Paging memory | 0.93 | 0.93 | 0.94 | 0.94 | 0.88 | 0.88 | 0.56 | 0.63 | 0.90 | 0.90 | 0.70 | 0.76 | 0.93 | 0.93 | 0.56 | 0.63 |
| Container | 1.00 | 1.00 | 1.00 | 1.00 | 0.63 | 0.57 | 0.64 | 0.62 | 0.77 | 0.73 | 0.78 | 0.76 | 0.67 | 0.59 | 0.64 | 0.63 |
| IO | 0.76 | 0.70 | 0.82 | 0.82 | 0.89 | 0.89 | 0.92 | 0.96 | 0.82 | 0.78 | 0.87 | 0.89 | 0.94 | 0.89 | 0.92 | 0.98 |
| Storage | 0.72 | 0.59 | 0.64 | 0.66 | 0.92 | 0.76 | 0.96 | 0.96 | 0.81 | 0.67 | 0.77 | 0.78 | 0.92 | 0.83 | 0.96 | 0.96 |
| Certificate | 1.00 | 0.96 | 1.00 | 1.00 | 1.00 | 1.00 | 0.97 | 1.00 | 1.00 | 0.98 | 0.98 | 1.00 | 1.00 | 1.00 | 0.97 | 1.00 |
| None-of-the-above | 0.00 | 0.33 | 0.75 | 0.94 | 0.00 | 0.05 | 0.04 | 0.22 | 0.00 | 0.09 | 0.07 | 0.35 | 0.00 | 0.06 | 0.04 | 0.21 |
LABEL:{Tab:Resource_class_prediction} presents class-wise metrics for individual resource classes with different contextual information. C1 indicates the baseline results, C2 indicates predictions with service descriptions and monitor metadata, C3 indicates predictions with service descriptions, monitor metadata, and component level descriptions, and C4 presents the predictions with monitor metadata and component level descriptions. The incorporation of service description has varying impacts across different resource classes, demonstrating the need for a nuanced approach in improving predictive models. While some classes show substantial improvements like Dependency and API, others such as Storage and Service level exhibit limited changes with additional information.
If we look at overall impact on micro, macro and weighted averages, we observe that inclusion of service description in the experimental model is modest. While there are slight improvements in macro-average metrics, there’s also a trade-off in micro-average recall. The weighted-average metrics show a marginal increase in precision and recall.
Incorporating service descriptions has the potential to enhance the interpretability of the model by providing detailed context and enabling more informed decision-making. Striking a balance between leveraging the valuable information from service description and maintaining a manageable level of interpretability is crucial.
We also investigated the effect of including descriptions of components associated with the service, in addition to service descriptions. Our analysis revealed that while the inclusion of component descriptions introduces additional information, it does not lead to substantial improvements in predictive performance compared to model utilizing only service descriptions. For many resource classes, the precision, recall, and f1-score remained relatively stable between the two models. This suggests that the additional information provided by component descriptions did not significantly influence the model’s ability to accurately classify resource classes. In some cases, we observed slight fluctuations in performance metrics between the two models. However, these changes were not substantial enough to indicate a clear advantage in predictive performance for the model incorporating component descriptions.
The monitoring setup involves aggregating monitors at the service level rather than at the component level. As a result, the additional granularity provided by component descriptions may not align closely with the underlying monitoring data, limiting its utility in improving predictions. The information captured by service descriptions may already encompass much of the relevant details about the associated components, leading to redundancy when including component descriptions in the model.
In conclusion, while the inclusion of component descriptions adds supplementary information to the predictive model, our analysis suggests that it does not substantially enhance the model’s predictive performance.
Next, we summarize the insights from the experiments:
-
(1)
Additional contextual information, such as service description, aids in better classification of the SLO and resource classes.
-
(2)
The effect of additional service context is more prominent on SLO classes. This is intuitive, as the overall description helps to provide better context on the service level objectives. As resource classes deal with the underlying resources within each service, low-level granular information, such as service code snippets, may be able to provide relevant context.
-
(3)
Component description does not provide relevant context to the SLO and relevant classes. This is intuitive, as monitors are often used to monitor service level features and guarantees. Therefore, component description might become irrelevant.
It is interesting to note that additional irrelevant information sometimes tends to reduce the performance. Additional contextual information should align with the task to achieve better performance.
5. Lessons Learned and Threats
Does additional contextual data help to boost performance?
The experiment results from the root cause analysis and monitor management experiments clearly indicate enhanced performance with the addition of contextual data. For root cause analysis of dependency failures, including the upstream service information along with the in-context historical examples yield the best results. The recommendations from this prompt are more readable and concise, as confirmed during Human Evaluation. Additionally, summarizing the service descriptions further improved the model output. The experiment results from monitor management suggest that additional contextual data, particularly from service descriptions, can indeed improve performance in monitor classification tasks, with a more significant impact observed for SLO Classes as compared to resource classes.
What additional contextual data are useful?
We can leverage the nature of the task to identify the additional contextual information needed. For instance, it is intuitive that service descriptions can help in better predicting the service level objectives associated with a monitor consistently, while information on the underlying service code might help to better identify the resource characteristics within a service and, consequently, the resource classes. Similarly, for root cause analysis, OCEs usually refer to upstream dependencies and their service property to understand and localize critical failures. For other types of failures, we might need to retrieve additional contextual information such as source codes or logs.
Threats to Validity.
There are several threats to our study. We evaluated the performance on a subset of incidents and monitor data within Microsoft. The performance of predicted root cause accuracy may vary if evaluated on a different dataset from other services within Microsoft. While the semantic and lexical metrics are widely used for evaluation of natural language recommendations, these metrics are computed using pre-trained models. Therefore, the results might vary if we train these metric computation models using incident dataset. Moreover, the human evaluation is done on a small sample of incidents, as it is challenging to scale these time-consuming manual process. For monitor management experiments, as different organizations might follow different configuration and processes, the classification accuracy might vary if evaluated on data from other organization or even other services from Microsoftwhich were not included in our study.
6. Related Work
6.1. LLMs in software engineering
Motivated by recent advancement and success, LLMs have been widely adopted in systems and software engineering domain. Github copilot is a popular example where GPT models are being used for automatic code generation from natural language text. LLMs are also leveraged for solving various other tasks including code generation (Chen et al., 2021; Xu et al., 2022), docstring generation (Chen et al., 2021; Ahmed and Devanbu, 2022), code repair (Fan et al., 2022; Joshi et al., 2023), program analysis and synthesis (Jain et al., 2022; Nijkamp et al., 2022) and software testing (Wang et al., 2023). Jain et al. (Jain et al., 2022) propose to augment LLMs using program analysis and synthesis technique to achieve better performance. LANCE (Mastropaolo et al., 2022) utilizes fine-tuned T5 to automatically generate logs for Java methods. Similarly, VulRepair (Fu et al., 2022) tool utilizes a fine-tuned T5 model to automatically suggest vulnerability fixes. In contrast to these studies, we propose to leverage state-of-the-art LLM models for automating parts of incident management lifecycle by unitizing contextual data from different stages of SDLC.
6.2. Incident Management
Incident management emerges as a popular research area in systems and software engineering due to its practical implication across large cloud systems. Several empirical studies have been conducted to understand and classify production outages, either delving into the types of issues that caused incidents (Alquraan et al., 2018; Gao et al., 2018; Zhang et al., 2021) or issues pertinent to a particular service or system (Yuan et al., 2014; Liu et al., 2019a; Ghosh et al., 2022). Several machine learning models have also been proposed to automate parts of incident management lifecycle, such as triaging (Azad et al., 2022; Chen et al., 2019), incident linking (Chen et al., 2020a; Ghosh et al., 2024), diagnosis (Bansal et al., 2020; Luo et al., 2014), mitigation (Jiang et al., 2020). Ahmed et al. (Ahmed et al., 2023) first proposed to finetune a LLM model for automatically generating the root cause and mitigation recommendations. Chen et al. (Chen et al., 2023) proposed to use in-context examples with retrieval augmented generation (RAG) framework for categorization of root causes for a specific type of service. Zhang et al. (Zhang et al., 2024) recently demonstrate that augmenting in-context examples help in improving the root cause recommendation quality. However, these works only leverage incident metadata for finetuning and retrieval purpose. In contrast, we demonstrate at scale that augmenting additional contextual data such as service and dependency information along with in-context examples can significantly boost the accuracy of recommendations.
6.3. Monitor Management
(Surianarayanan et al., 2019; Montes et al., 2013; Aceto et al., 2013) provide an overview of cloud monitoring and describe the characteristics of a good monitoring system. They discuss the stages of monitoring, including data collection, analysis, and decision-making, and list several commercial and open-source tools available for monitoring, such as VMware Hyperic, Virtualization Manager of SolarWinds, and Azure Monitor. Nair et al. (Nair et al., 2015) presents a hierarchical monitoring framework for Microsoft’s internal distributed data storage and batch computing service, which applies machine learning algorithms for issue detection. (Mogul et al., 2017; Mogul and Wilkes, 2019; Jayathilaka et al., 2015) discusses the challenges of defining SLOs for cloud services and highlights the difficulties cloud providers face in meeting the reliable and adequate performance promises that cloud customers want, especially in the face of arbitrary customer behavior and hidden interactions. (Ding et al., 2019; Ding, 2020) address common misconceptions and practical challenges of defining and managing SLOs, especially implementing effective alerting systems that are cognizant of the desired level of granularity and service dependencies. These works assume that the “what” resource to monitor and “which” metric to monitor are already established, and then develop techniques that can help in faster incident detection or alert refinement. Once the fundamental problem of monitor structure and design is solved, these approaches can be augmented to the proposed framework.
7. Conclusion
In this work, we demonstrate the importance of augmenting the LLM prompt with data from different stages of software development lifecycle while solving two critically important tasks in incident management with real-world dataset from Microsoft: (1) while generating root cause recommendations for dependency failure related incidents, including contextual information such as upstream service dependencies and their properties, can significantly boost the accuracy of recommendations; and (2) while identifying resource and SLO classes for an existing monitor, leveraging service architecture and properties along with monitor metadata improves the classification accuracy. We expect that this work will motivate other studies that leverage LLMs with X-lifecycle data for automating parts of incident management lifecycle.
References
- (1)
- Aceto et al. (2013) Giuseppe Aceto, Alessio Botta, Walter De Donato, and Antonio Pescapè. 2013. Cloud monitoring: A survey. Computer Networks 57, 9 (2013), 2093–2115.
- Ahmed and Devanbu (2022) Toufique Ahmed and Premkumar Devanbu. 2022. Few-shot training LLMs for project-specific code-summarization. In Proceedings of the 37th IEEE/ACM International Conference on Automated Software Engineering. 1–5.
- Ahmed et al. (2023) Toufique Ahmed, Supriyo Ghosh, Chetan Bansal, Thomas Zimmermann, Xuchao Zhang, and Saravan Rajmohan. 2023. Recommending Root-Cause and Mitigation Steps for Cloud Incidents using Large Language Models. In 45th International Conference on Software Engineering.
- Alquraan et al. (2018) Ahmed Alquraan, Hatem Takruri, Mohammed Alfatafta, and Samer Al-Kiswany. 2018. An analysis of network-partitioning failures in cloud systems. In 13th USENIX Symposium on Operating Systems Design and Implementation (OSDI 18). 51–68.
- Azad et al. (2022) Amar Prakash Azad, Supriyo Ghosh, Ajay Gupta, Harshit Kumar, Prateeti Mohapatra, Lena Eckstein, Leonard Posner, and Robert Kern. 2022. Picking Pearl From Seabed: Extracting Artefacts from Noisy Issue Triaging Collaborative Conversations for Hybrid Cloud Services. In Proceedings of the AAAI Conference on Artificial Intelligence, Vol. 36. 12440–12446.
- Banerjee and Lavie (2005) Satanjeev Banerjee and Alon Lavie. 2005. METEOR: An Automatic Metric for MT Evaluation with Improved Correlation with Human Judgments. In Proceedings of the ACL Workshop on Intrinsic and Extrinsic Evaluation Measures for Machine Translation and/or Summarization, Jade Goldstein, Alon Lavie, Chin-Yew Lin, and Clare Voss (Eds.). Association for Computational Linguistics, Ann Arbor, Michigan, 65–72.
- Bansal et al. (2020) Chetan Bansal, Sundararajan Renganathan, Ashima Asudani, Olivier Midy, and Mathru Janakiraman. 2020. DeCaf: diagnosing and triaging performance issues in large-scale cloud services. In Proceedings of the ACM/IEEE 42nd International Conference on Software Engineering: Software Engineering in Practice. 201–210.
- Chen et al. (2019) Junjie Chen, Xiaoting He, Qingwei Lin, Hongyu Zhang, Dan Hao, Feng Gao, Zhangwei Xu, Yingnong Dang, and Dongmei Zhang. 2019. Continuous incident triage for large-scale online service systems. In 2019 34th IEEE/ACM International Conference on Automated Software Engineering (ASE). IEEE, 364–375.
- Chen et al. (2020b) Junjie Chen, Shu Zhang, Xiaoting He, Qingwei Lin, Hongyu Zhang, Dan Hao, Yu Kang, Feng Gao, Zhangwei Xu, Yingnong Dang, et al. 2020b. How incidental are the incidents? characterizing and prioritizing incidents for large-scale online service systems. In Proceedings of the 35th IEEE/ACM International Conference on Automated Software Engineering. 373–384.
- Chen et al. (2021) Mark Chen, Jerry Tworek, Heewoo Jun, Qiming Yuan, Henrique Ponde de Oliveira Pinto, Jared Kaplan, Harri Edwards, Yuri Burda, Nicholas Joseph, Greg Brockman, et al. 2021. Evaluating large language models trained on code. arXiv preprint arXiv:2107.03374 (2021).
- Chen et al. (2023) Yinfang Chen, Huaibing Xie, Minghua Ma, Yu Kang, Xin Gao, Liu Shi, Yunjie Cao, Xuedong Gao, Hao Fan, Ming WEN, Jun Zeng, Supriyo Ghosh, Xuchao Zhang, Chaoyun Zhang, Qingwei Lin, Saravan Rajmohan, and Dongmei Zhang. 2023. Empowering Practical Root Cause Analysis by Large Language Models for Cloud Incidents. arXiv preprint arXiv:2305.15778 (2023).
- Chen et al. (2020a) Yujun Chen, Xian Yang, Hang Dong, Xiaoting He, Hongyu Zhang, Qingwei Lin, Junjie Chen, Pu Zhao, Yu Kang, Feng Gao, et al. 2020a. Identifying linked incidents in large-scale online service systems. In Proceedings of the 28th ACM joint meeting on European software engineering conference and symposium on the foundations of software engineering. 304–314.
- Devlin et al. (2019) Jacob Devlin, Ming-Wei Chang, Kenton Lee, and Kristina Toutanova. 2019. BERT: Pre-training of Deep Bidirectional Transformers for Language Understanding. In Proceedings of the 2019 Conference of the North American Chapter of the Association for Computational Linguistics: Human Language Technologies, Volume 1 (Long and Short Papers). Association for Computational Linguistics, 4171–4186. https://doi.org/10.18653/v1/N19-1423
- Ding (2020) Jianru Ding. 2020. Characterizing Service Level Objectives for Cloud Services: Motivation of Short-Term Cache Allocation Performance Modeling. Ph. D. Dissertation. The Ohio State University.
- Ding et al. (2019) Jianru Ding, Ruiqi Cao, Indrajeet Saravanan, Nathaniel Morris, and Christopher Stewart. 2019. Characterizing service level objectives for cloud services: Realities and myths. In 2019 IEEE International Conference on Autonomic Computing (ICAC). IEEE, 200–206.
- Fan et al. (2022) Zhiyu Fan, Xiang Gao, Abhik Roychoudhury, and Shin Hwei Tan. 2022. Improving automatically generated code from Codex via Automated Program Repair. arXiv preprint arXiv:2205.10583 (2022).
- Fu et al. (2022) Michael Fu, Chakkrit Tantithamthavorn, Trung Le, Van Nguyen, and Dinh Phung. 2022. VulRepair: a T5-based automated software vulnerability repair. In Proceedings of the 30th ACM Joint European Software Engineering Conference and Symposium on the Foundations of Software Engineering. 935–947.
- Ganatra et al. (2023) Vaibhav Ganatra, Anjaly Parayil, Supriyo Ghosh, Yu Kang, Minghua Ma, Chetan Bansal, Suman Nath, and Jonathan Mace. 2023. Detection Is Better Than Cure: A Cloud Incidents Perspective. In Proceedings of the 31st ACM Joint European Software Engineering Conference and Symposium on the Foundations of Software Engineering. 1891–1902.
- Gao et al. (2018) Yu Gao, Wensheng Dou, Feng Qin, Chushu Gao, Dong Wang, Jun Wei, Ruirui Huang, Li Zhou, and Yongming Wu. 2018. An empirical study on crash recovery bugs in large-scale distributed systems. In Proceedings of the 2018 26th ACM joint meeting on european software engineering conference and symposium on the foundations of software engineering. 539–550.
- Ghosh et al. (2024) Supriyo Ghosh, Karish Grover, Jimmy Wong, Chetan Bansal, Rakesh Namineni, Mohit Verma, and Saravan Rajmohan. 2024. Dependency Aware Incident Linking in Large Cloud Systems. In Proceedings of The Web Conference (WWW).
- Ghosh et al. (2022) Supriyo Ghosh, Manish Shetty, Chetan Bansal, and Suman Nath. 2022. How to fight production incidents? an empirical study on a large-scale cloud service. In Proceedings of the 13th Symposium on Cloud Computing. 126–141.
- Google (2023) Gemini Team Google. 2023. Gemini: A Family of Highly Capable Multimodal Models. arXiv preprint arXiv:2312.11805 (2023).
- Hirschberg (1977) Daniel S. Hirschberg. 1977. Algorithms for the Longest Common Subsequence Problem. J. ACM 24 (oct 1977), 664–675. https://doi.org/10.1145/322033.322044
- Jain et al. (2022) Naman Jain, Skanda Vaidyanath, Arun Iyer, Nagarajan Natarajan, Suresh Parthasarathy, Sriram Rajamani, and Rahul Sharma. 2022. Jigsaw: Large language models meet program synthesis. In Proceedings of the 44th International Conference on Software Engineering. 1219–1231.
- Jayathilaka et al. (2015) Hiranya Jayathilaka, Chandra Krintz, and Rich Wolski. 2015. Response time service level agreements for cloud-hosted web applications. In Proceedings of the Sixth ACM Symposium on Cloud Computing. 315–328.
- Jiang et al. (2020) Jiajun Jiang, Weihai Lu, Junjie Chen, Qingwei Lin, Pu Zhao, Yu Kang, Hongyu Zhang, Yingfei Xiong, Feng Gao, Zhangwei Xu, et al. 2020. How to mitigate the incident? an effective troubleshooting guide recommendation technique for online service systems. In Proceedings of the 28th ACM Joint Meeting on European Software Engineering Conference and Symposium on the Foundations of Software Engineering. 1410–1420.
- Jiang et al. (2023) Yuxuan Jiang, Chaoyun Zhang, Shilin He, Zhihao Yang, Minghua Ma, Si Qin, Yu Kang, Yingnong Dang, Saravan Rajmohan, Qingwei Lin, et al. 2023. Xpert: Empowering Incident Management with Query Recommendations via Large Language Models. arXiv preprint arXiv:2312.11988 (2023).
- Johnson et al. (2019) Jeff Johnson, Matthijs Douze, and Hervé Jégou. 2019. Billion-scale similarity search with gpus. IEEE Transactions on Big Data 7, 3 (2019), 535–547.
- Joshi et al. (2023) Harshit Joshi, José Cambronero Sanchez, Sumit Gulwani, Vu Le, Gust Verbruggen, and Ivan Radiček. 2023. Repair is nearly generation: Multilingual program repair with llms. In Proceedings of the AAAI Conference on Artificial Intelligence, Vol. 37. 5131–5140.
- Kane et al. (2020) Hassan Kane, Muhammed Yusuf Kocyigit, Ali Abdalla, Pelkins Ajanoh, and Mohamed Coulibali. 2020. NUBIA: NeUral Based Interchangeability Assessor for Text Generation. In Proceedings of the 1st Workshop on Evaluating NLG Evaluation. Association for Computational Linguistics, 28–37.
- Lin (2004) Chin-Yew Lin. 2004. ROUGE: A Package for Automatic Evaluation of Summaries. In Text Summarization Branches Out. Association for Computational Linguistics, 74–81.
- Lin and Och (2004) Chin-Yew Lin and Franz Josef Och. 2004. ORANGE: a Method for Evaluating Automatic Evaluation Metrics for Machine Translation. In COLING 2004: Proceedings of the 20th International Conference on Computational Linguistics. COLING, 501–507.
- Liu et al. (2019a) Haopeng Liu, Shan Lu, Madan Musuvathi, and Suman Nath. 2019a. What bugs cause production cloud incidents?. In Proceedings of the Workshop on Hot Topics in Operating Systems. 155–162.
- Liu et al. (2019b) Yinhan Liu, Myle Ott, Naman Goyal, Jingfei Du, Mandar Joshi, Danqi Chen, Omer Levy, Mike Lewis, Luke Zettlemoyer, and Veselin Stoyanov. 2019b. RoBERTa: A Robustly Optimized BERT Pretraining Approach. ArXiv abs/1907.11692 (2019). https://api.semanticscholar.org/CorpusID:198953378
- Luo et al. (2014) Chen Luo, Jian-Guang Lou, Qingwei Lin, Qiang Fu, Rui Ding, Dongmei Zhang, and Zhe Wang. 2014. Correlating events with time series for incident diagnosis. In Proceedings of the 20th ACM SIGKDD international conference on Knowledge discovery and data mining. 1583–1592.
- Mastropaolo et al. (2022) Antonio Mastropaolo, Luca Pascarella, and Gabriele Bavota. 2022. Using deep learning to generate complete log statements. In Proceedings of the 44th International Conference on Software Engineering. 2279–2290.
- Mogul et al. (2017) Jeffrey C Mogul, Rebecca Isaacs, and Brent Welch. 2017. Thinking about availability in large service infrastructures. In Proceedings of the 16th Workshop on Hot Topics in Operating Systems. 12–17.
- Mogul and Wilkes (2019) Jeffrey C Mogul and John Wilkes. 2019. Nines are not enough: Meaningful metrics for clouds. In Proceedings of the Workshop on Hot Topics in Operating Systems. 136–141.
- Montes et al. (2013) Jesús Montes, Alberto Sánchez, Bunjamin Memishi, María S Pérez, and Gabriel Antoniu. 2013. GMonE: A complete approach to cloud monitoring. Future Generation Computer Systems 29, 8 (2013), 2026–2040.
- Nair et al. (2015) Vinod Nair, Ameya Raul, Shwetabh Khanduja, Vikas Bahirwani, Qihong Shao, Sundararajan Sellamanickam, Sathiya Keerthi, Steve Herbert, and Sudheer Dhulipalla. 2015. Learning a hierarchical monitoring system for detecting and diagnosing service issues. In Proceedings of the 21th ACM SIGKDD international conference on knowledge discovery and data mining. 2029–2038.
- Nijkamp et al. (2022) Erik Nijkamp, Bo Pang, Hiroaki Hayashi, Lifu Tu, Huan Wang, Yingbo Zhou, Silvio Savarese, and Caiming Xiong. 2022. Codegen: An open large language model for code with multi-turn program synthesis. arXiv preprint arXiv:2203.13474 (2022).
- OpenAI (2023a) OpenAI. 2023a. ChatGPT (Feb 13 version) [Large language model]. https://chat.openai.com.
- OpenAI (2023b) OpenAI. 2023b. GPT-4 Technical Report. arXiv preprint arXiv:2303.08774. https://api.semanticscholar.org/CorpusID:257532815
- Radford et al. (2019) Alec Radford, Jeff Wu, Rewon Child, David Luan, Dario Amodei, and Ilya Sutskever. 2019. Language Models are Unsupervised Multitask Learners. https://api.semanticscholar.org/CorpusID:160025533
- Srinivas et al. (2024) Pooja Srinivas, Fiza Husain, Anjaly Parayil, Ayush Choure, Chetan Bansal, and Saravan Rajmohan. 2024. Intelligent Monitoring Framework for Cloud Services: A Data-Driven Approach. In Proceedings of the 46th IEEE/ACM International Conference on Software Engineering.
- Surianarayanan et al. (2019) Chellammal Surianarayanan, Pethuru Raj Chelliah, Chellammal Surianarayanan, and Pethuru Raj Chelliah. 2019. Cloud Monitoring. Essentials of Cloud Computing: A Holistic Perspective (2019), 241–254.
- Wang et al. (2023) Junjie Wang, Yuchao Huang, Chunyang Chen, Zhe Liu, Song Wang, and Qing Wang. 2023. Software testing with large language model: Survey, landscape, and vision. arXiv preprint arXiv:2307.07221 (2023).
- Wolfe (2018) Sean Wolfe. 2018. Amazon’s one hour of downtime on Prime Day may have cost it up to $100 million in lost sales. https://www.businessinsider.com/amazon-prime-day-website-issues-cost-it-millions-in-lost-sales-2018-7
- Xu et al. (2022) Frank F Xu, Uri Alon, Graham Neubig, and Vincent Josua Hellendoorn. 2022. A systematic evaluation of large language models of code. In Proceedings of the 6th ACM SIGPLAN International Symposium on Machine Programming. 1–10.
- Yuan et al. (2014) Ding Yuan, Yu Luo, Xin Zhuang, Guilherme Renna Rodrigues, Xu Zhao, Yongle Zhang, Pranay U Jain, and Michael Stumm. 2014. Simple Testing Can Prevent Most Critical Failures: An Analysis of Production Failures in Distributed Data-Intensive Systems. In 11th USENIX Symposium on Operating Systems Design and Implementation (OSDI 14). 249–265.
- Zhang et al. (2019) Tianyi Zhang, Varsha Kishore, Felix Wu, Kilian Weinberger, and Yoav Artzi. 2019. BERTScore: Evaluating Text Generation with BERT. arXiv preprint arXiv:1904.09675 (04 2019).
- Zhang et al. (2024) Xuchao Zhang, Supriyo Ghosh, Chetan Bansal, Rujia Wang, Minghua Ma, Yu Kang, and Saravan Rajmohan. 2024. Automated Root Causing of Cloud Incidents using In-Context Learning with GPT-4. arXiv preprint arXiv:2401.13810 (2024).
- Zhang et al. (2021) Yongle Zhang, Junwen Yang, Zhuqi Jin, Utsav Sethi, Kirk Rodrigues, Shan Lu, and Ding Yuan. 2021. Understanding and detecting software upgrade failures in distributed systems. In Proceedings of the ACM SIGOPS 28th Symposium on Operating Systems Principles. 116–131.