First detection in space of the high-energy isomer of cyanomethanimine: \ceH2CNCN
Abstract
We report the first detection in the interstellar medium of -cyanomethanimine (\ceH2CNCN), the stable dimer of \ceHCN of highest energy, and the most complex organic molecule identified in space containing the prebiotically relevant \ceNCN backbone. We have identified a plethora of -type rotational transitions with and that belong to this species towards the Galactic Center G+0.693-0.027 molecular cloud, the only interstellar source showing the three cyanomethanimine isomers (including the - and - isomers of -cyanomethanimine, \ceHNCHCN). We have derived a total column density for \ceH2CNCN of (2.90.1), which translates into a total molecular abundance with respect to \ceH2 of (2.10.3). We have also revisited the previous detection of - and -\ceHNCHCN, and found a total -cyanomethanimine abundance ratio of 31.81.8 and a -\ceHNCHCN ratio of 4.50.2. While the latter can be explained on the basis of thermodynamic equilibrium, chemical kinetics are more likely responsible for the observed -cyanomethanimine abundance ratio, where the gas-phase reaction between methanimine (\ceCH2NH) and the cyanogen radical (\ceCN) arises as the primary formation route.
1 Introduction
How life originated on Earth is one of the key open questions still lingering in the astrobiological community. One of the most accepted hypothesis is the so-called RNA-world (Gilbert, 1986), which suggests that this macromolecule may have performed both the metabolic and genetic functions that in present-day living organisms are carried out by proteins and DNA, respectively. Although the chemical processes forming the first RNA molecules remain unknown, numerous prebiotic chemistry experiments have shown that RNA building blocks, the ribonucleotides, can be synthesised from much simpler molecules (Powner et al. 2009; Patel et al. 2015; Becker et al. 2016, 2019), with nitriles (organic species with the \ce-C+N functional group) playing a dominant role (e.g., Balucani 2009; Menor Salván et al. 2020). The clearest example is found on their simplest representative, hydrogen cyanide (\ceHCN), which has been proven to be an essential ingredient in initiating many prebiotic synthesis mechanisms (e.g., Oró & Kimball 1961; Ferris & Hagan 1984; Santalucia et al. 2022; Sandström & Rahm 2023). Among them, \ceHCN oligomerization reactions are specially relevant, as these are evidenced to be the major routes forming the two purine nucleobases assembling both RNA and DNA chains: adenine (\ceH5C5N5; Chakrabarti & Chakrabarti 2000; Jung & Choe 2013), and guanine (\ceH5C5N5O; Sanchez et al. 1968; Choe 2018). Since \ceHCN is ubiquitous in the interstellar medium (ISM), these processes might similarly occur through interstellar chemistry, making the study of the molecular complexity in the ISM an essential task to gain a deeper insight into this “vital” question.
A crucial step triggering the \ceHCN oligomers cascade concerns the initial formation of \ceHCN dimers (\ceH2C2N2). The formation of such species from two separate \ceHCN molecules did not appear to be efficient under the typical temperatures of the ISM (10100 K) due to the large activation energy barrier involved (36000 K; Smith et al. 2001; Yim & Choe 2012). However, the successful detections in the ISM of the two most stable \ceHCN dimers, the - and - isomers of -cyanomethanimine (\ceHNCHCN; Zaleski et al. 2013 and Rivilla et al. 2019, respectively), triggered the study of alternative chemical pathways (e.g., Vazart et al. 2015; Shivani et al. 2017; Shingledecker et al. 2020; García de la Concepción et al. 2021).
In this regard, the exhaustive characterisation of new \ceHCN dimers in the ISM would substantially contribute to a better understanding on how these compounds could be formed in the interstellar environment. From the entire catalog of possible \ceHCN dimers, only a single additional isomer has shown superior stability compared to two isolated \ceHCN molecules (Evans et al., 1991). That is -cyanomethanimine (\ceH2CNCN), a higher-energy member within this family (3570130 K above the -isomer, which is the global minimum; Puzzarini 2015), whose identification in the ISM has so far remained elusive. This species is of prime astrobiological interest since, besides being a \ceHCN dimer, it contains the \ceNCN backbone, a fundamental structure of purine nucleobases which is only present in a handful of simpler interstellar molecules: cyanamide (\ceNH2CN; Turner et al. 1975), carbodiimide (\ceHNCNH; McGuire et al. 2012), isocyanogen (\ceCNCN; Agúndez et al. 2018) and the cyanomidyl radical (\ceHNCN; Rivilla et al. 2021a). Furthermore, recent experiments conducted by Vasconcelos et al. (2020) have proposed an alternative route for adenine formation within interstellar dust grain ices that relies on \ceH2CNCN as the primary precursor, so its detection in the ISM would increase the chances of adenine being formed under the extreme interstellar conditions.
In this work, we present the first detection of several rotational lines of -cyanomethanimine in the ISM towards the Galactic Center G+0.693-0.027 molecular cloud (hereafter G+0.693), the same source which also host the unique detection of both -cyanomethanimine isomers. This cloud, which belongs to the Sgr B2 complex, emerges as one of the most promising candidates for the search of complex organic molecules (COMs; Herbst et al. 2020). Its chemistry is believed to be affected by low-velocity shocks likely driven by large-scale cloud-cloud collisions, sputtering molecules that are formed in the surface of dust grains into the gas-phase (Martín et al., 2008; Zeng et al., 2020). These particular conditions have endowed it with an unprecedented chemical richness, portrayed in the more than 130 molecular species that have been already identified towards it, many of them of high prebiotic interest (e.g., Zeng et al. 2019, 2021, 2023; Rivilla et al. 2019, 2022a, 2023; Jiménez-Serra et al. 2020, 2022; Rodríguez-Almeida et al. 2021a, b).
This paper is organised as follows. In Sect. 2 we present the observational data, while in Sect. 3 we report the detection of -cyanomethanimine towards G+0.693, and revisit the analysis of the two isomers of -cyanomethanimine. In Sect. 4 we discuss the origin of their observed relative isomeric ratios by means of their main formation and destruction chemical routes. Finally, in Sect. 5 we outline our conclusions.
2 OBSERVATIONS
| Molecule | FWHM | (a) | |||
|---|---|---|---|---|---|
| K | |||||
| \ceH2CNCN | |||||
| -\ceHNCHCN | |||||
| -\ceHNCHCN |
Note. — The FWHM estimates were firstly determined by only fitting the most unblended lines of these species, while the remaining three parameters were obtained through the complete LTE modelling in which these FWHM values were fixed (see Sects. 3.1 and 3.2). Their uncertainties correspond to standard deviations.
(a) Fractional abundances with respect to \ceH2. To compute them, we used as derived by Martín et al. (2008), while assuming an uncertainty of 15 of its value.
We have analysed data from the recently enhanced high-sensitivity spectral survey of G+0.693 (Rivilla et al., 2023; Sanz-Novo et al., 2023). New ultradeep observational runs were performed using the Yebes 40 m (Guadalajara, Spain; project 21A014, PI: Rivilla) and IRAM 30 m (Granada, Spain; project 123-22, PI: Jiménez-Serra) radio telescopes, which have remarkably reduced the rms of the spectra in comparison with previous works (e.g., Rivilla et al. 2020a, 2021b, 2021a, 2022a; Zeng et al. 2020; Rodríguez-Almeida et al. 2021a; Colzi et al. 2022). The observations were centered at , and were conducted using position switching mode, being the off position located at an offset of , . This particular reference position was selected because it does not show significant emission from abundant molecules such as \ceCS and \ceHC3N. The line intensity of the spectra was directly measured in antenna temperature () units, as the molecular emission towards G+0.693 is extended over the beam (e.g., Brünken et al. 2010; Jones et al. 2012; Li et al. 2020; Zheng et al. 2024).
For the Yebes 40 m observations, the Nanocosmos Q-band (7 mm) HEMT receiver was used to cover the whole Q-band frequency range (31.0750.42 GHz), providing a raw frequency resolution of 38 kHz (Tercero et al., 2021). On the other hand, the new IRAM 30 m observations set was gathered by combining the broadband heterodyne Eight MIxer Receiver (EMIR) and the Fast Fourier Transform Spectrometer FTS200, providing a raw channel width of 195 kHz along the three spectral ranges covered: 83.20115.41, 132.28140.39 and 142.00173.81 GHz. In both cases, the spectra were ultimately smoothed to achieve a final resolution of 256 kHz (1.52.5 km s-1) for the Yebes 40 m data and of 615 kHz (1.12.2 km s-1) for the IRAM 30 m observations, which is more than enough to resolve G+0.693 molecular line profiles that present typical line widths of 1525 km s-1. The rms of the spectra ranges from 0.250.9 mK across the frequency range observed with the Yebes 40 m radio telescope, and between 0.52.5 mK and 1.01.6 mK for the IRAM 30 m datasets at 3 mm and 2 mm, respectively. The half power beam width (HPBW) of the Yebes 40 m telescope varies from 55′′ at 31 GHz down to 35′′ at 50 GHz, while the HPBW of the IRAM 30 m radio telescope ranges from 29′′ down to 14′′ along the frequency range observed with it. We refer to Rivilla et al. (2023) and Sanz-Novo et al. (2023) for further details on both the observations and the data reduction process. Data belonging to the spectral ranges unrelated to this new set of observations come from our previous IRAM 30 m survey (Rivilla et al., 2021b, a, 2022a).
3 ANALYSIS AND RESULTS
The identification of the three \ceC2H2N2 isomers molecular lines and their fitting has been performed using the version from 2023 November 15 of the Spectral Line Identification and Modelling (SLIM) tool within the MADCUBA package (Martín et al., 2019). For each of these species, we incorporated the spectroscopic data available within the Cologne Database for Molecular Spectroscopy catalog (CDMS, Endres et al. 2016). We just considered the rotational transitions without taking into account the complex hyperfine structure arising from the presence of two \ce^14N nuclei, since it is not resolved at the observed spectral resolution (e.g., the maximum separation between the two \ceH2CNCN hyperfine components that reproduce the bulk of the emission of its most intense unblended transition at 41.81 GHz shown in Fig. 1 is 6.2 kHz or, equivalently, 0.04 km s-1; a difference that further collapses for those transitions at higher frequencies). Nonetheless, we did also carry out the analysis of the three isomers including the entries with hyperfine structure lines, not observing substantial modification in the results obtained.
The modelling of the line profiles of the \ceC2H2N2 isomers has been conducted assuming local thermodynamic equilibrium (LTE) conditions, since collisional coefficients for these species have not yet been calculated. The SLIM code operates under this assumption, and generates a synthetic spectra to be compared with the observed one. To derive the physical parameters describing the molecular emission, we used the automatic fitting routine SLIM-AUTOFIT, which provides the best non-linear least-squares LTE fit to the data using the Levenberg-Marquardt algorithm. The free parameters fitting the spectra are the total column density of the molecule (), the excitation temperature (), the local standard of rest velocity (), and the full width at half maximum (FWHM).
We have performed the LTE line fitting of the species of interest in this work by considering the already modelled emission of the more than 130 molecular species previously identified towards G+0.693 (Requena-Torres et al., 2006, 2008; Rivilla et al., 2018, 2019, 2020b, 2021b, 2021a, 2022b, 2022c, 2022a, 2023; Zeng et al., 2018, 2020, 2021, 2023; Bizzocchi et al., 2020; Jiménez-Serra et al., 2020, 2022; Rodríguez-Almeida et al., 2021a, b; Colzi et al., 2022; Alberton et al., 2023; Fatima et al., 2023; Massalkhi et al., 2023; San Andrés et al., 2023; Sanz-Novo et al., 2023). In the forthcoming sections, we provide the details on the analysis for each cyanomethanimine species, whose results are summarised in Table 1.
3.1 Detection of \ceH2CNCN
| Frequency | Transition(a) | rms | S/N(b) | Blending(c) | ||||||
|---|---|---|---|---|---|---|---|---|---|---|
| (GHz) | (′′) | () | (K) | (mK) | () | |||||
| 31\@alignment@align.3664834(10) | 3_0,3-2_0,2 | -5\@alignment@align.469 | 3.0 | 0\@alignment@align.5 | 179(15) | 53(5) | Blended with U | |||
| 32\@alignment@align.0353082(10) | 3_1,2-2_1,1 | -5\@alignment@align.505 | 5.9 | 0\@alignment@align.5 | 113(13) | 34(4) | Unblended | |||
| 40\@alignment@align.9516386(13) | 4_1,4-3_1,3 | -5\@alignment@align.183 | 7.7 | 0\@alignment@align.5 | 165(15) | 56(5) | Unblended | |||
| 41\@alignment@align.8100713(12) | 4_0,4-3_0,3 | -5\@alignment@align.133 | 5.0 | 0\@alignment@align.5 | 253(19) | 87(7) | Unblended | |||
| 41\@alignment@align.8372354(12) | 4_2,3-3_2,2 | -5\@alignment@align.444 | 16.2 | 0\@alignment@align.5 | 46(11) | 16(4) | Unblended | |||
| 42\@alignment@align.7104885(13) | 4_1,3-3_1,2 | -5\@alignment@align.147 | 7.9 | 0\@alignment@align.5 | 168(15) | 58(6) | Blended: -\ceCH3NHCHO and U | |||
| 74\@alignment@align.7161692(19) | 7_1,6-6_1,5 | -4\@alignment@align.468 | 17.1 | 2\@alignment@align.4 | 180(60) | 10(3) | Blended: -\ceC2H5CHO and \ceC2H3NH2 | |||
| 81\@alignment@align.8614891(21) | 8_1,8-7_1,7 | -4\@alignment@align.344 | 20.5 | 2\@alignment@align.4 | 151(60) | 9(3) | Blended: \ceCH3COCH3 | |||
| 83\@alignment@align.4576038(20) | 8_0,8-7_0,7 | -4\@alignment@align.317 | 18.0 | 1\@alignment@align.6 | 213(40) | 19(4) | Blended with U | |||
| 85\@alignment@align.3755815(21) | 8_1,7-7_1,6 | -4\@alignment@align.309 | 21.2 | 1\@alignment@align.6 | 144(40) | 13(3) | Unblended⋆ | |||
| 92\@alignment@align.0779012(21) | 9_1,9-8_1,8 | -4\@alignment@align.204 | 24.9 | 0\@alignment@align.9 | 112(22) | 19(4) | Blended with U | |||
| 96\@alignment@align.0290895(21) | 9_1,8-8_1,7 | -4\@alignment@align.169 | 25.8 | 1\@alignment@align.5 | 104(35) | 11(4) | Blended: -\ce(CH2OH)2 and \ceCH3COCH3 | |||
| 104\@alignment@align.171562(10) | 10_0,10-9_0,9 | -4\@alignment@align.057 | 27.5 | 1\@alignment@align.8 | 104(42) | 9(4) | Slightly blended: -\ceHNCHCN | |||
| 106\@alignment@align.675828(10) | 10_1,9-9_1,8 | -4\@alignment@align.045 | 31.0 | 1\@alignment@align.8 | 69(41) | 6(3) | Blended: -\ceC2H5OH | |||
| \@alignment@align | ||||||||||
Note. — For each transition, we provide its rest frequency in units of GHz, its associated quantum numbers, the base 10 logarithm of its integrated intensity at a fixed temperature of 300 K in units of (), the energy in K of the upper level involved in the transition (), the noise measured in mK within line-free spectral ranges close to it (rms), the integrated intensity over the line width as derived from the fit in (), and the detection level (in terms of the signal-to-noise or S/N ratio). The numbers in brackets represent the uncertainty associated to the last digits. The last column accounts for the possible contamination of other molecular species.
(a) Rotational transitions are labelled following the common notation for asymmetric tops: , where refers to the total angular momentum of the molecule while point to its projections along the and principal axes.
(b) The S/N is calculated from the integrated intensity over the line width () and noise level , where is the spectral resolution of the spectra in velocity units and the FWHM is estimated from the LTE line fitting.
(c) The term “unblended” alludes to those transitions which exhibit no contamination of other molecular species, while a star symbol () is added when scarce line blending accounting for less than 5% of the targeted line total integrated intensity is present. “U” refers to blending with an unknown (not yet identified) species.
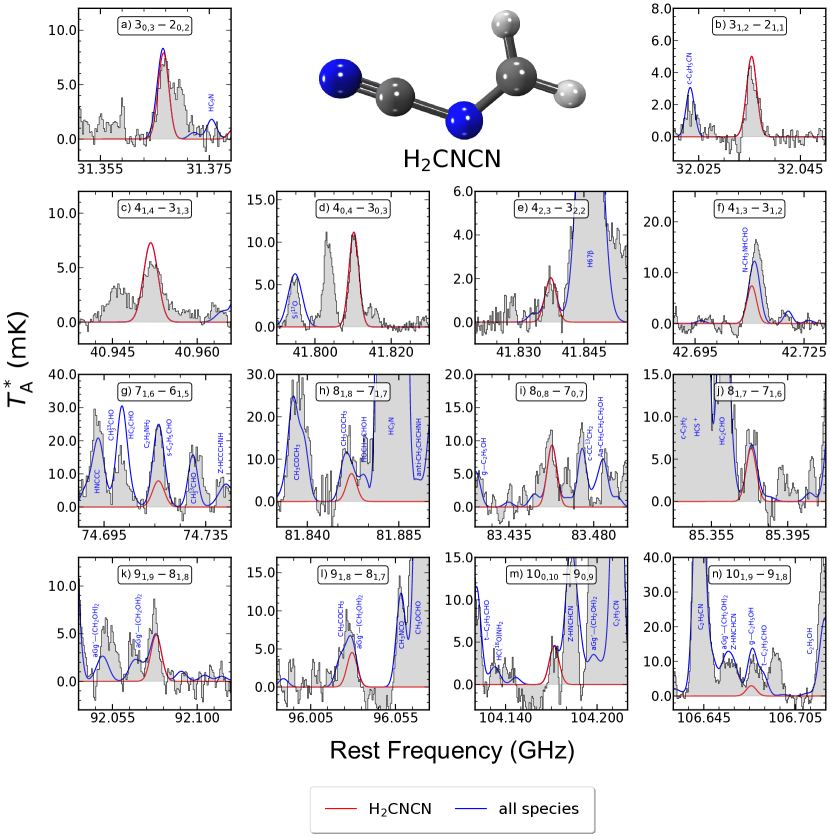
-cyanomethanimine (\ceH2CNCN) is a planar asymmetric-top molecule with a large total dipole moment of 4.84 D (Bak et al., 1978; Bak & Svanholt, 1980). To perform its search towards G+0.693, we used the spectroscopic entry 054514 (February 2014) from the CDMS catalog, which incorporates the rotational spectroscopy from Bak & Svanholt (1980), Winnewisser et al. (1984) and Stolze et al. (1989) experimental works. We have identified a plethora of distinct -type rotational transitions belonging to this species, which cover an energy level range between up to and correspond to different ladders. This delineates nearly the entirety of the most prominent rotational spectroscopic features attributed to the -branch -type lines, rendering this detection exceptionally robust. Fig. 1 shows all of the transitions we have selected to perform the LTE fit for \ceH2CNCN, which are all those among targeted that are either unblended or present certain blending with other molecular species, but in which case the combined profiles closely match the observed spectrum. The rest of \ceH2CNCN lines covered by the observations are too faint to be detected or exhibit more significant blending with the emission from other molecular species (either unidentified or already modelled towards G+0.693), in all these cases being their predicted emission also consistent with the observed spectrum (see Fig. 8 of Appendix A). The spectroscopic information of the transitions displayed in Fig. 1 is given in Table 2. All of them have been identified within a signal-to-noise ratio (S/N) in integrated intensity larger than 6 (see Table 2).
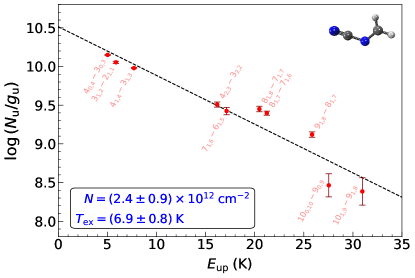
To achieve the best LTE modelling for \ceH2CNCN, we followed a two-step methodology. First, we fitted only the most unblended transitions (depicted in panels b), d), e) and j) of Fig. 1), which provided the most accurate estimate for the FWHM. To do so, we ran AUTOFIT leaving the four parameters free and obtained a FWHM of 21.91.4 km s-1, which we subsequently kept fixed in the second step. Then, we fitted all of the transitions shown in Fig. 1 and ran AUTOFIT again but now leaving only the other three parameters free. We obtained km s-1, K and (see Table 1). The derived \ceH2CNCN column density translates into a total molecular abundance with respect to \ceH2 of (2.10.3), assuming (Martín et al., 2008) with an associated uncertainty of to its value.
We have also performed a complementary rotational diagram analysis (Goldsmith & Langer, 1999) for \ceH2CNCN, which is implemented in MADCUBA and incorporates two distinctive functionalities that provide a greater versatility in constrast with the method conventionally used. On one hand, MADCUBA rotational diagram accounts for opacity effects. Moreover, a very recent update allows to consider the predicted emission from all of the molecular species previously detected in the source. This is done by subtracting the predicted line profiles of the blending species from the observed data to generate an “unblended” spectral data set, from which the rotational diagram for the species of interest can be derived following the same procedure that would apply for unblended lines. Fig. 2 shows the rotational diagram we obtained for \ceH2CNCN. To compute it, we used all of the transitions shown in Fig. 1 but excluded those that exhibit blending with yet unidentified species (see Table 2), and employed their associated velocity integrated intensity over the line width as calculated by MADCUBA. This analysis yields and K, which are in perfect agreement with SLIM-AUTOFIT estimates.
3.2 Analysis of - and -\ceHNCHCN
Both the -,-isomers of the -cyanomethanimine species (\ceHNCHCN) were previously detected towards G+0.693 by Rivilla et al. (2019), albeit on the basis of a less sensitive IRAM 30 m spectral survey with a narrower spectral coverage (85109 GHz). In this regard, the presence of new high-sensitivity Yebes 40 m observations at frequencies 3050 GHz, along with the significant enhancement of the spectral sensitivity at also higher frequencies, has prompted us to revisit the detection of these isomers towards G+0.693.
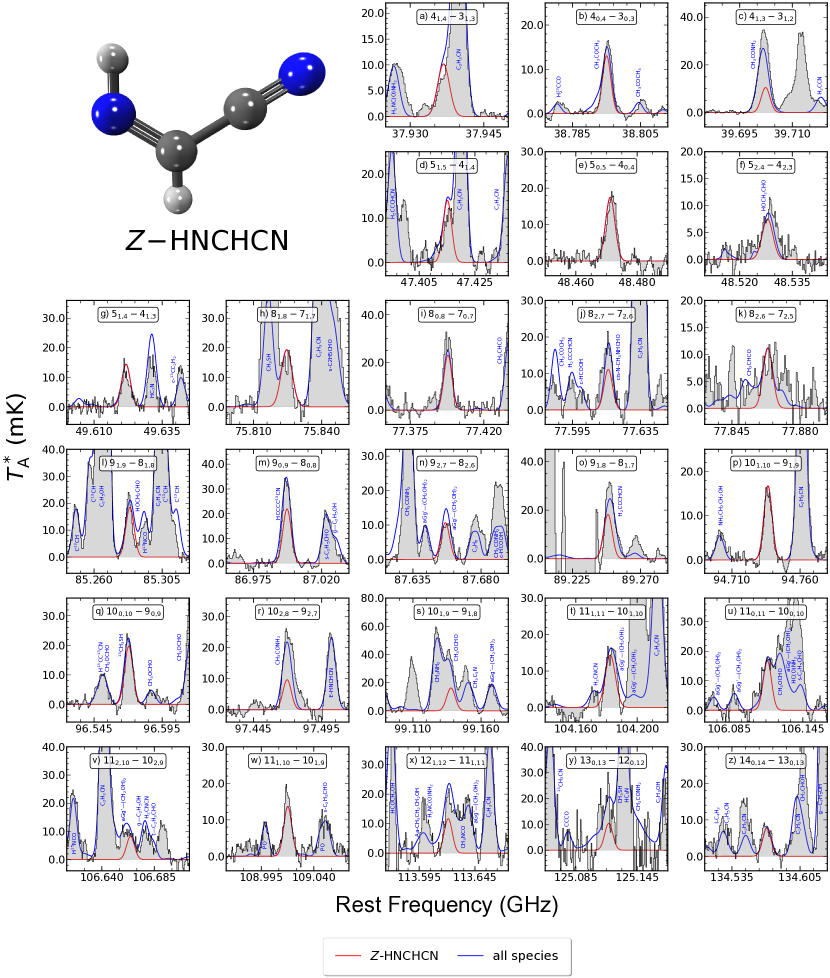
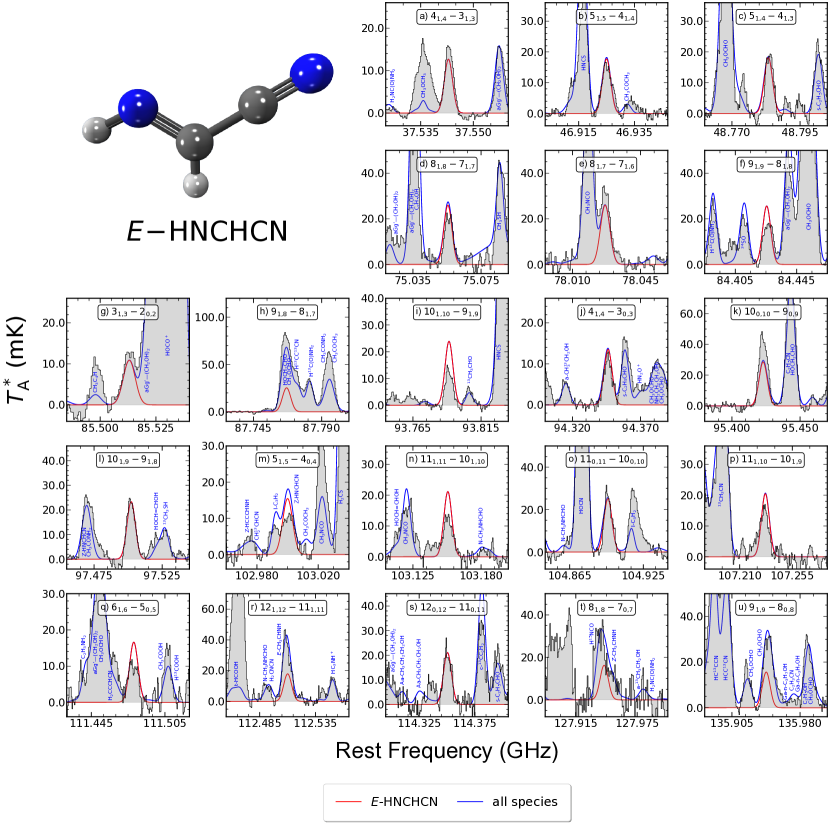
To perform the new analysis of these two species, we employed the same spectroscopic entries from the CDMS catalog that Rivilla et al. (2019) also used: 054512 for -\ceHNCHCN and 054513 for -\ceHNCHCN (both dated November 2018), which contain the rotational transitions measured by Takano et al. (1990), Zaleski et al. (2013) and Melosso et al. (2018). We have almost tripled the number - and -\ceHNCHCN unblended or partially blended lines detected towards G+0.693 with a S/N ratio in integrated intensity above 6, which are shown in Figs. 3 and 4, respectively. For both isomers, these lines correspond to different ladders of -type rotational transitions sweeping a wider range of energy levels (550 K) than those previously covered by Rivilla et al. (2019) (2134 K), and starting from up to . Moreover, we have also targeted for the first time some -type transitions belonging to -\ceHNCHCN [see panels g), j), m), q), t) and u) within Fig. 4], facilitated by the relatively high dipole moment component, albeit smaller compared to its counterpart (2.51 D versus 3.25 D, respectively; Takano et al. 1990). The spectroscopic information of all these transitions is gathered in Table 3 within Appendix B, which highlights how some of the lines that Rivilla et al. (2019) targeted as “unblended” actually exhibit slight blending from other species. Furthermore, we have now detected all of them with a nearly three times greater S/N ratio in integrated intensity.
We have carried out the LTE line fitting for the - and -\ceHNCHCN isomers by using all of the transitions depicted in Figs. 3 and 4, respectively. As already explained for \ceH2CNCN (see Sect. 3.1), we followed a similar two-step approach in both cases, whose results are summarized in Table 1. In the case of -\ceHNCHCN, we first constrained its FWHM by fitting the unblended lines shown in panels e), g), p) and z) of Fig. 3 while leaving the four parameters unfixed, obtaining a FWHM of 22.30.8 km s-1. As for -\ceHNCHCN, we derived a similar FWHM of 22.10.6 km s-1 by fitting the seven unblended transitions displayed in panels b-d), j), l), o) and s) within Fig. 4. In the second step, we repeated the fit but including the rest of transitions shown in Fig. 3 for -\ceHNCHCN and Fig. 4 for the -isomer, while keeping the FWHM fixed to the former values, respectively. We obtained , K, km s-1 for -\ceHNCHCN, whereas , K and km s-1 for -\ceHNCHCN. The column density derived for each isomer results into a molecular abundance with respect to \ceH2 of (5.50.9) for -\ceHNCHCN and of (1.20.2) for -\ceHNCHCN, which were calculated following the same approach as explained in Sect. 3.1.
As for -cyanomethanimine, we have also performed a rotational diagram analysis for both the - and -isomers of -cyanomethanimine, which we show in Fig. 5. In line with the methodology we followed for \ceH2CNCN (see Sect. 3.1), we constructed this diagram by using all of the unblended and partially blended rotational transitions which are shown in Figs. 3 and 4 for - and -\ceHNCHCN respectively, while incorporating their associated velocity integrated intensity. As done for \ceH2CNCN, we did not include those transitions that are blended with species that have not yet been identified (see Table 3 within Appendix B). The results derived from this complementary analysis are and K for -\ceHNCHCN, and and K for -\ceHNCHCN, being in both cases consistent with SLIM-AUTOFIT outcomes.
The substantial increase in the number of detected lines, along with their improved signal-to-noise ratio and broader energy distribution, has resulted into a more accurate characterization of the physical parameters describing the emission from these two isomers. Our enhanced fit now sets a higher but consistently similar for both isomers of almost twice the value derived by Rivilla et al. (2019) for -\ceHNCHCN (82 K), which was the only one they could explicitly obtain from the lower sensitivity data. The notable difference in the , linked to the more precise scrutiny of the molecular line blending from other species, leaves its imprint in the column density estimates as well, which are now set to be 23 times lower in comparison with Rivilla et al. (2019) findings. Similarly, we have also computed a rather lower -\ceHNCHCN abundance ratio towards G+0.693 of 4.50.2, which remains consistent within uncertainty with the former estimate (6.12.4). Nonetheless, we emphasise the comparably refined accuracy concerning this new result, which highlights the direct impact that a full spectroscopic coverage exerts on determining the physical parameters.
3.3 The -cyanomethanimine abundance ratio towards G+0.693
Based on the new column density estimates derived for both the - and -\ceHNCHCN isomers (see Table 1), we have computed a total column density for -cyanomethanimine towards G+0.693 of (9.20.3), which results in a total molecular abundance with respect to \ceH2 of (6.81.0). This value, although 3 times lower than that previously derived by Rivilla et al. (2019), is of the same order of the abundances of other complex nitriles detected towards this cloud, such as \ceCH3CN, \ceC2H3CN or \ceC2H5CN (Zeng et al., 2018). This indicates that -cyanomethanimine might indeed be a relatively abundant species in the ISM, which could favor its detection towards other astronomical sources.
Nevertheless, this scenario significantly shifts for the -cyanomethanimine species (\ceH2CNCN), which exhibits a remarkably lower molecular abundance with respect to \ceH2 of (2.10.3). In fact, \ceH2CNCN emerges as one of the least abundant species detected thus far towards G+0.693, being 23 times lower in abundance in comparison to other even more complex nitrogen-bearing species already identified in this cloud (Rivilla et al., 2022a). This disparity becomes even sharper with respect to both -cyanomethanimine isomers, for which we have computed -\ceHNCHCN/\ceH2CNCN isomeric ratios of 25.91.6 and 5.80.3, respectively. Consequently, we have derived a -cyanomethanimine abundance ratio of 31.81.8 towards G+0.693.
At this point, it is worth mentioning that while the - and -\ceHNCHCN isomers exhibit quite similar of 14 K, we have derived a much lower value of 8 K for \ceH2CNCN (see Table 1). Although we have already demonstrated the reliability of our results regarding the LTE fitting of these species, we have also evaluated the possibility of a of 14 K for \ceH2CNCN. In this scenario, we have obtained a poorer fit and a reduction of 25% in its estimated column density, which results into an even lower molecular abundance and hence a greater -cyanomethanimine ratio. In any case, our observational results set the -isomer being over one order of magnitude less abundant compared to the more stable -cyanomethanimine species, which suggests that its detection towards other sources could become a much more challenging task.
4 Discussion
4.1 High-energy isomers in the ISM
In astrochemistry, there is still a prevalent belief that the search for high-energy isomers in the ISM is bound to failure, since these isomers are expected to exhibit molecular abundances which could be several orders of magnitude lower than their most stable analogues. This idea is rooted on the so-called minimum energy principle (MEP), which states a strong correlation between the observed abundances of the different members that compose a given isomeric family and their relative energies, with the most stable member expected to exhibit the highest abundance (Lattelais et al., 2009). In this respect, the cyanomethanimines family analysed in this work would seem to adhere to this principle. However, the detection of -cyanomethanimine towards G+0.693 cast doubts on the reliability of the MEP as a predictive tool for assessing high-energy isomers traceability in the ISM, as discussed below.
According to the original formulation of the MEP by Lattelais et al. (2009), the abundance ratios between structural isomers (denoting those molecular species sharing the same generic formula but whose constituent atoms are arranged differently) must be governed by thermodynamic equilibrium, scaling with 111Rigorously, the relative population under thermodynamic equilibrium should be described in terms of the Gibbs free energy associated with their isomerization reaction (). However, the thermal correction of the free energy is not usually provided for many interstellar isomers, and in particular for -cyanomethanimine. Therefore, to compare it with the isomeric ratios derived from the observations, we used the expression using their relative energies instead (), which was demonstrated to be also reliable for the -cyanomethanimine stereoisomers (García de la Concepción et al. 2021)., where is their electronic energy difference and indicates the kinetic temperature of the gas. This points to their relative abundances being determined by isomerization mechanisms, which would prevail over other processes. Nevertheless, this is far from being the case of -cyanomethanimine. With an estimated of 3570130 K (Puzzarini, 2015) with respect to the most stable -\ceHNCHCN isomer, its abundance based on thermodynamical considerations is predicted to be more than 10 orders of magnitude lower in comparison to -cyanomethanimine at the of G+0.693 (70140; Zeng et al. 2018), nearly 9 orders of magnitude below to what has actually been observed. Therefore, it ought to be explained in terms of kinetics instead, being the most plausible explanation for this probably related to the very distinct molecular structures of the - and -cyanomethanimine species, which makes their unimolecular isomerization impossible under ISM conditions since it must involve a reaction intermediate far superior in energy to both species.
On top of that, the - and -cyanomethanimine isomers do not emerge as the unique exception to the MEP, since recent detections in the ISM of many other isomeric families has also raised serious doubts about its general applicability regarding structural isomers. Some of these findings have demonstrated that high-energy structural isomers can share similar abundances to their more stable counterparts, as it is the case of the \ceH2CN and \ceH2NC isomers (Cabezas et al., 2021; Agúndez et al., 2023; San Andrés et al., 2023) and the two most stable isomers within the \ceC3H4O family (-propenal, \ceCH2CHCHO, and methyl ketene, \ceCH3CHCO; Bermúdez et al. 2018; Fuentetaja et al. 2023), or even higher, as noted for the \ceC3H2O, \ceC2H4O2 and \ceC2H5N2O isomeric families (see, e.g., Loomis et al. 2015 and Shingledecker et al. 2019; Mininni et al. 2020; Rivilla et al. 2023, respectively). Therefore, it is clear that the MEP cannot be taken as a strict rule to argue about the actual detectability of high-energy structural isomers in the ISM.
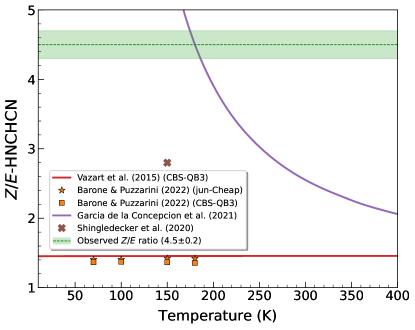
In this regard, the MEP only appears to primarily apply for some stereoisomers (also referred as spatial isomers, i.e., those species that possess identical constitutions but differ in the three dimensional orientation of their bonding atoms), where the - and -\ceHNCHCN isomeric pair of -cyanomethanimine emerge as the nearest example. In fact, the energy difference of these two isomers is 30972 K (Takano et al., 1990), which based on the gas kinetic temperatures of the G+0.693 cloud of 70140 K (Zeng et al., 2018), results in an abundance ratio fairly consistent with that observed by Rivilla et al. (2019) and reported in this work. Although the energy barrier associated to their isomerization is huge (15.95 kK; Takano et al. 1990), García de la Concepción et al. (2021) demonstrated that this process can take place, even at the low temperatures of G+0.693, when quantum tunneling is considered using a small curvature approximation (Skodje et al., 1981), and predicted a -\ceHNCHCN abundance ratio at 150 K which mimicked Rivilla et al. (2019) observational value (6.12.4). Our revised estimate for this ratio of 4.50.2 would correspond to a of 180 K (see Fig. 6), slightly higher than those typically associated to this source, but still in good agreement with the thermodynamic equilibrium prediction. Furthermore, as Fig. 6 shows, this mechanism emerges as the only plausible explanation for this ratio, as none of the formerly suggested chemical pathways are capable of describing the observations (Vazart et al., 2015; Shingledecker et al., 2020; Barone & Puzzarini, 2022).
Besides both -cyanomethanimine isomers, the list of stereoisomers that also support the MEP rule is rather scarce, where the and conformers of -propanol (-\ceC3H7OH; Jiménez-Serra et al. 2020), the and conformers of ethyl formate (\ceCH3CH2(O)CHO; Rivilla et al. 2017), and the and conformers of thioformic acid (\ceHC(O)SH; García de la Concepción et al. 2022) are some of the clearest examples. However, there is also growing evidence that thermodynamics cannot account for the observed abundance ratios of many other stereoisomers, such as the - and - conformers of carbonic acid (\ceHOCOOH; Sanz-Novo et al. 2023), the and conformers of methyl formate (\ceCH3OCHO; Neill et al. 2012), and the and conformers of formic acid (\ceHCOOH; García de la Concepción et al. 2022). We note that all of the stereoisomers so far detected in the ISM whose abundance ratios match the thermodynamic prediction exhibit energy differences 500 K, which appears to be a doable energetic boundary for quantum tunneling to efficiently enable their isomerization reactions at the low temperatures of the ISM, as García de la Concepción et al. (2021) demonstrated for several imines. On the other hand, the stereoisomers mentioned above that do not follow the thermodynamic ratio exhibit much higher energy differences, which surely prevents their direct isomerization and hence makes their abundance ratios to be shaped by chemical kinetics instead.
All in all, observational evidence increasingly indicates that the MEP lacks predictive capability regarding which species within a specific isomeric family are more readily detectable and, consequently, cannot be generally used as a reliable indicator of isomeric abundances. In this regard, the detection of -cyanomethanimine towards G+0.693 provides robust evidence that high-energy isomers can also be found in the ISM. Therefore, although it is possible that in some cases the detection of such species would deserve deeper integrations, we note that it is equally important and necessary obtaining their spectroscopy to enable their interstellar identification, significantly contributing to provide a full inventory of the molecular complexity of the ISM.
The aforementioned results have also continued to support the prominent role of chemical kinetics, rather than thermodynamics, in establishing the observed abundance ratios between structural isomers. For this reason, we discuss in the following section the possible chemical pathways leading to \ceH2CNCN.
4.2 \ceH2CNCN interstellar chemistry
Over the last decade, several authors have investigated the chemistry of cyanomethanimines under interstellar conditions (Vazart et al., 2015; Shivani et al., 2017; Shingledecker et al., 2020; Zhang et al., 2020). However, biased by the exclusive detection in the ISM of the - and -\ceHNCHCN isomers (Zaleski et al., 2013; Rivilla et al., 2019), many of these works mainly focused on the chemical processes involving these two species. Consequently, the potential chemical pathways yielding to \ceH2CNCN have often been overlooked, resulting in a limited characterization of the chemistry linked to this isomer.
To date, there is just one formation mechanism leading to \ceH2CNCN that has been specifically studied. This route occurs through the gas-phase reaction between the cyanogen radical (\ceCN) and methanimine (\ceCH2NH), which Vazart et al. (2015) initially examined by performing quantum chemical calculations using a composite CBS-QB3 methodology. This reaction leads to the three cyanomethanimine isomers as the main products:
| (1.1) | ||||
| (1.2) |
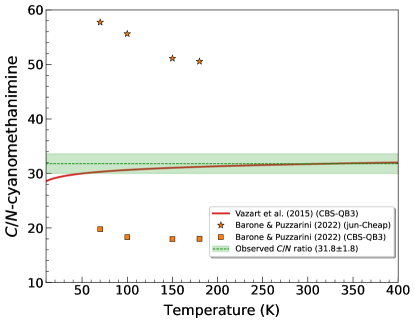
being the -cyanomethanimine isomers formed when the \ceCN radical attacks the carbon atom of methanimine (route 1.1), while -cyanomethanimine is produced from the attack on its N-side (route 1.2). All these processes are exothermic and proceed without an entrance barrier, making this reaction a feasible mechanism forming cyanomethanimines under interstellar conditions. Among the two possible pathways, the one leading to the -\ceHNCHCN isomers is much more thermodynamically favoured, hence arising as the predominant route. Although the kinetic calculations performed by these authors establish a rather low -\ceHNCHCN abundance ratio of 1.5 from this reaction (which is far below the 4.50.2 ratio we observed, see Fig. 6), the prediction for the -cyanomethanimine ratio fits extremely well to the observational value (see Fig. 7). Given that this ratio ought to be described in terms of chemical kinetics (see Sect. 4.1), this result would point to the \ceCN + CH2NH reaction being mainly responsible for - and -cyanomethanimine chemistry in G+0.693. Moreover, its viability is also supported by the high abundance of the parent species (\ceCH2NH and \ceCN) found in this region (see Zeng et al. 2018 and Rivilla et al. 2019, respectively). On top of that, this reaction can also proceed at a very fast pace. With associated rate constants at 150 K of 1010 as derived by Vazart et al. (2015), the observed abundances of the cyanomethanimines would be reproduced through this reaction at timescales smaller than those related to depletion on dust grains due to the cooling of the gas (10; Requena-Torres et al. 2006), even in spite of the low \ceH2 densities of this cloud (10410; Zeng et al. 2020).
Nonetheless, a new theoretical study recently carried out by Puzzarini & Barone (2020) has revealed that the energy of the transition states along the reaction profile calculated by Vazart et al. (2015) could be slightly underestimated, causing their computed branching ratios not to be entirely accurate. In a subsequent study, Barone & Puzzarini (2022) performed improved kinetic calculations using both the CBS-QB3 model as well as the more optimized and recently developed jun-Cheap scheme, outlining a slightly divergent -cyanomethanimine abundance ratio as a function of the temperature with respect to Vazart et al. (2015) results, as shown in Fig. 7. The prediction for the -\ceHNCHCN ratio remains unchanged (see Fig. 6). Nevertheless, the differences encountered in the predicted -cyanomethanimine ratio are merely within a factor of 2 with respect to our observations, so that the gas-phase \ceCN + CH2NH reaction is still considered as the main mechanism likely producing cyanomethanimines in G+0.693. Moreover, its rate constant peaks at 150 K as derived by Barone & Puzzarini (2022), in line with the kinetic temperature of this cloud (70140 K; Zeng et al. 2018). Nonetheless, a more refined study of this process is needed to clarify the small discrepancies detected between the quantum chemical calculations and the astronomical observations.
Besides gas-phase processes, chemical reactions occurring on the icy mantles of interstellar dust grains could also be an important source producing \ceH2CNCN in G+0.693, where grain surface chemistry is believed to play a key role (Rivilla et al., 2020a, 2021b, 2022c, 2023; Molpeceres et al., 2021; San Andrés et al., 2023). However, little research has been done on these process for cyanomethanimine isomers, and especially for \ceH2CNCN. According to recent astrochemical models run by Zhang et al. (2020), the surface analog of the already characterized gas-phase \ceCN + CH2NH reaction could be a second relevant route forming the three cyanomethanimine isomers. However, while it is well established that methanimine (\ceCH2NH) is mainly produced on grains making this reaction feasible (Theule et al., 2011; Suzuki et al., 2016), the hinted extraordinary reactivity that the \ceCN radical exhibits upon contact with \ceH2O molecules (Rimola et al., 2018), one of the major constituents of dust grain ices, would pose a significant barrier to its occurrence. Indeed, as it is also shown in the models of Zhang et al. (2020), the contribution from this reaction to the total abundances of cyanomethanimines seems not to be as significant as that of its gas-phase counterpart, which can easily proceed once \ceCH2NH is desorbed into the gas. Furthermore, the observed abundances for the three cyanomethanimine isomers are reproduced within their models at timescales 10 attending to the \ceCN + CH2NH gas-phase reaction, which strongly supports it as the primary and most efficient formation mechanism. However, the -cyanomethanimine abundance ratio is not consistently explained according to their chemical network, indicating that other chemical processes might also need to be invoked. Moreover, the absence of comprehensive theoretical or experimental investigations examining this particular mechanism on grains forces us to assume the same branching ratio towards the formation of the three isomers in chemical models. Nonetheless, in spite of these shortcomings, it appears more likely that the role of the \ceCN + CH2NH reaction in producing cyanomethanimines is only relevant in the gas-phase.
Another possible surface pathway has been proposed by Vasconcelos et al. (2020), whose experiments irradiating a \ceN2-\ceCH4 icy mixture with cosmic rays produced the three isomers of cyanomethanimine. However, it remains unclear whether the presence of additional molecules in the ice, such as \ceH2O, \ceCO or \ceCO2, can alter the chemistry observed in these irradiation experiments. Intuitively, and because \ceH2O, \ceCO and \ceCO2 are the main constituents of interstellar ices (see, e.g., Boogert et al. 2015; McClure et al. 2023), the free path of the radicals derived from \ceCH4 and \ceN2 radiolysis is likely to encounter reaction partners of this ternary, reducing the amount of cyanomethanimines being produced and hence rendering this specific route probably not dominant.
Shivani et al. (2017) also proposed that both the - and -\ceHNCHCN isomers could be formed in the grains through two consecutive hydrogenations of the cyanogen species (\ceNCCN), which is expected to be abundant in G+0.693 (Rivilla et al., 2019). However, the astrochemical model performed later by Shingledecker et al. (2020) showed that this route has a minor impact in the formation of -cyanomethanimine in G+0.693. By analogy, it could be proposed that the hydrogenation of the high-energy metastable isomer of \ceNCCN, the isocyanogen species (\ceCNCN), could be another possible route remaining to be added in \ceH2CNCN solid-phase chemical network. Nonetheless, this alternative route is currently hampered by the poor knowledge on how this precursor could be synthesised through interstellar chemistry, for which the only pathway so far studied (\ceCN + HNC \ceCNCN + H) has been shown to have high energy barriers when leading to \ceCNCN (Petrie & Osamura, 2004). Furthermore, this species exhibits a low abundance in the ISM (10-10 with respect to \ceH2), with only one reported detection so far (Agúndez et al., 2018). Indeed, using our spectral survey and assuming a of 10 K and a FWHM of 22.0 km s-1, we have just derived an upper limit for its molecular abundance towards G+0.693 of 210-11, which is lower than the abundance of \ceH2CNCN itself. Consequently, all evidence points to this route not being a promising alternative for boosting \ceH2CNCN abundance, as happened for the - and -\ceHNCHCN isomers through the analogue reaction triggered by \ceNCCN.
In summary, none of the chemical pathways proposed to date for grain surface chemistry seem capable of substantially increasing the abundance of the three cyanomethanimine isomers to adequately match the observational values. In this context, the gas-phase \ceCN + CH2NH reaction stands out as the primary formation route for these species, while the role of surface chemistry would primarily point to enhance the abundance of \ceCH2NH in the gas after ejection, thereby enabling the occurrence of this reaction.
5 Summary and conclusions
We have presented the first detection in the ISM of -cyanomethanimine (\ceH2CNCN), a highly significant species in the prebiotic context as a potential precursor of adenine, one of the fundamental nucleobases constituting RNA and DNA. We have been able to univocally identify more than a dozen of different -type rotational transitions belonging to this species towards the Galactic Center G+0.693-0.027 molecular cloud, through the recently improved ultra-high-sensitivity spectral survey of this source using the Yebes 40 m and IRAM 30 m radio telescopes. We have performed a LTE fit to the observed data, deriving a total column density of (2.90.1) which translates into a molecular abundance with respect to \ceH2 of (2.10.3). This makes it one of the least abundant complex organic molecules so far detected towards this cloud, which demonstrates how the growing efforts in achieving a greater sensitivity on the observational data are pushing the limits of molecular species detectability in space.
The identification of -cyanomethanimine in G+0.693-0.027 adds to the previous detection of its two more stable isomers in this same region: the - and - isomers of -cyanomethanimine (\ceHNCHCN). The expanded spectral coverage provided by the new observations to frequencies below 50 GHz allowed us to reevaluate the identification of these two stereoisomers as well. In both cases, we have almost tripled the number of transitions detected, encompassing a significantly broader range of energy levels. This has led to a more accurate characterization of the physical parameters tracing both isomers emission, which has resulted in a three times lower total column density for -cyanomethanimine of (6.81.0) in comparison to that previously inferred. We have found the -cyanomethanimine abundance ratio to be 31.81.8, which points to -cyanomethanimine being over one order of magnitude less abundant compared to the more stable -cyanomethanimine species. We have computed a -\ceHNCHCN isomeric ratio of 4.50.2 (consistent within uncertainty with the previous estimate of 6.12.4), and derived -\ceHNCHCN/\ceH2CNCN ratios of 25.91.6 and 5.80.3, respectively. The relative abundance between the - and -\ceHNCHCN isomers closely aligns with the prediction based on thermodynamic equilibrium at the kinetic temperature of G+0.693 (70140 K). However, it should also be noted that thermodynamic control between both -cyanomethanimine stereoisomers would only be established if their inter-conversion timescales are shorter than other competitive mechanisms (such as destruction processes), a task pending to be carefully checked in the following mechanistic studies related to these species. On the other hand, the -cyanomethanimine ratio should be described in terms of the chemical reactions involving these species, since the isomerization of -cyanomethanimine from -cyanomethanimine seems to be unattainable at low temperatures. The three cyanomethanimine isomers are mainly formed in the gas through the reaction between methanimine (\ceCH2NH) and the cyanogen radical (\ceCN), which seems to be responsible for the observed -cyanomethanimine abundance ratio.
References
- Agúndez et al. (2018) Agúndez, M., Marcelino, N., & Cernicharo, J. 2018, ApJ, 861, L22, doi: 10.3847/2041-8213/aad089
- Agúndez et al. (2023) Agúndez, M., Roncero, O., Marcelino, N., et al. 2023, A&A, 673, A24, doi: 10.1051/0004-6361/202346279
- Alberton et al. (2023) Alberton, D., Bizzocchi, L., Jiang, N., et al. 2023, A&A, 669, A93, doi: 10.1051/0004-6361/202244618
- Bak et al. (1978) Bak, B., Nielsen, O. J., & Svanholt, H. 1978, Chemical Physics Letters, 59, 330, doi: 10.1016/0009-2614(78)89106-4
- Bak & Svanholt (1980) Bak, B., & Svanholt, H. 1980, Chemical Physics Letters, 75, 528, doi: 10.1016/0009-2614(80)80570-7
- Balucani (2009) Balucani, N. 2009, International Journal of Molecular Sciences, 10, 2304, doi: 10.3390/ijms10052304
- Barone & Puzzarini (2022) Barone, V., & Puzzarini, C. 2022, Frontiers in Astronomy and Space Sciences, 8, 255, doi: 10.3389/fspas.2021.814384
- Becker et al. (2016) Becker, S., Thoma, I., Deutsch, A., et al. 2016, Science, 352, 833, doi: 10.1126/science.aad2808
- Becker et al. (2019) Becker, S., Feldmann, J., Wiedemann, S., et al. 2019, Science, 366, 76, doi: 10.1126/science.aax2747
- Bermúdez et al. (2018) Bermúdez, C., Tercero, B., Motiyenko, R. A., et al. 2018, A&A, 619, A92, doi: 10.1051/0004-6361/201833267
- Bizzocchi et al. (2020) Bizzocchi, L., Prudenzano, D., Rivilla, V. M., et al. 2020, A&A, 640, A98, doi: 10.1051/0004-6361/202038083
- Boogert et al. (2015) Boogert, A. C. A., Gerakines, P. A., & Whittet, D. C. B. 2015, ARA&A, 53, 541, doi: 10.1146/annurev-astro-082214-122348
- Brünken et al. (2010) Brünken, S., Belloche, A., Martín, S., Verheyen, L., & Menten, K. M. 2010, A&A, 516, A109, doi: 10.1051/0004-6361/200912456
- Cabezas et al. (2021) Cabezas, C., Agúndez, M., Marcelino, N., et al. 2021, A&A, 654, A45, doi: 10.1051/0004-6361/202141491
- Chakrabarti & Chakrabarti (2000) Chakrabarti, S., & Chakrabarti, S. K. 2000, A&A, 354, L6, doi: 10.48550/arXiv.astro-ph/0001079
- Choe (2018) Choe, J. C. 2018, Chemical Physics Letters, 708, 71, doi: 10.1016/j.cplett.2018.08.004
- Colzi et al. (2022) Colzi, L., Martín-Pintado, J., Rivilla, V. M., et al. 2022, ApJ, 926, L22, doi: 10.3847/2041-8213/ac52ac
- Endres et al. (2016) Endres, C. P., Schlemmer, S., Schilke, P., Stutzki, J., & Müller, H. S. P. 2016, Journal of Molecular Spectroscopy, 327, 95, doi: 10.1016/j.jms.2016.03.005
- Evans et al. (1991) Evans, R. A., Lorencak, P., Ha, T. K., & Wentrup, C. 1991, Journal of the American Chemical Society, 113, 7261, doi: 10.1021/ja00019a026
- Fatima et al. (2023) Fatima, M., Müller, H. S. P., Zingsheim, O., et al. 2023, A&A, 680, A25, doi: 10.1051/0004-6361/202347112
- Ferris & Hagan (1984) Ferris, J. P., & Hagan, W. J. 1984, Tetrahedron, 40, 1093, doi: https://doi.org/10.1016/S0040-4020(01)99315-9
- Fuentetaja et al. (2023) Fuentetaja, R., Bermúdez, C., Cabezas, C., et al. 2023, A&A, 671, L6, doi: 10.1051/0004-6361/202245732
- García de la Concepción et al. (2021) García de la Concepción, J., Jiménez-Serra, I., Carlos Corchado, J., Rivilla, V. M., & Martín-Pintado, J. 2021, ApJ, 912, L6, doi: 10.3847/2041-8213/abf650
- García de la Concepción et al. (2022) García de la Concepción, J., Colzi, L., Jiménez-Serra, I., et al. 2022, A&A, 658, A150, doi: 10.1051/0004-6361/202142287
- Gilbert (1986) Gilbert, W. 1986, Nature, 319, 618, doi: 10.1038/319618a0
- Goldsmith & Langer (1999) Goldsmith, P. F., & Langer, W. D. 1999, ApJ, 517, 209, doi: 10.1086/307195
- Herbst et al. (2020) Herbst, E., Vidali, G., & Ceccarelli, C. 2020, ACS Earth and Space Chemistry, 4, 488, doi: 10.1021/acsearthspacechem.0c00043
- Jiménez-Serra et al. (2020) Jiménez-Serra, I., Martín-Pintado, J., Rivilla, V. M., et al. 2020, Astrobiology, 20, 1048, doi: 10.1089/ast.2019.2125
- Jiménez-Serra et al. (2022) Jiménez-Serra, I., Rodríguez-Almeida, L. F., Martín-Pintado, J., et al. 2022, A&A, 663, A181, doi: 10.1051/0004-6361/202142699
- Jones et al. (2012) Jones, P. A., Burton, M. G., Cunningham, M. R., et al. 2012, MNRAS, 419, 2961, doi: 10.1111/j.1365-2966.2011.19941.x
- Jung & Choe (2013) Jung, S. H., & Choe, J. C. 2013, Astrobiology, 13, 465, doi: 10.1089/ast.2013.0973
- Lattelais et al. (2009) Lattelais, M., Pauzat, F., Ellinger, Y., & Ceccarelli, C. 2009, ApJ, 696, L133, doi: 10.1088/0004-637X/696/2/L133
- Li et al. (2020) Li, J., Wang, J., Qiao, H., et al. 2020, MNRAS, 492, 556, doi: 10.1093/mnras/stz3337
- Loomis et al. (2015) Loomis, R. A., McGuire, B. A., Shingledecker, C., et al. 2015, ApJ, 799, 34, doi: 10.1088/0004-637X/799/1/34
- Martín et al. (2019) Martín, S., Martín-Pintado, J., Blanco-Sánchez, C., et al. 2019, A&A, 631, A159, doi: 10.1051/0004-6361/201936144
- Martín et al. (2008) Martín, S., Requena-Torres, M. A., Martín-Pintado, J., & Mauersberger, R. 2008, ApJ, 678, 245, doi: 10.1086/533409
- Massalkhi et al. (2023) Massalkhi, S., Jiménez-Serra, I., Martín-Pintado, J., et al. 2023, A&A, 678, A45, doi: 10.1051/0004-6361/202346822
- McClure et al. (2023) McClure, M. K., Rocha, W. R. M., Pontoppidan, K. M., et al. 2023, Nature Astronomy, 7, 431, doi: 10.1038/s41550-022-01875-w
- McGuire et al. (2012) McGuire, B. A., Loomis, R. A., Charness, C. M., et al. 2012, ApJ, 758, L33, doi: 10.1088/2041-8205/758/2/L33
- Melosso et al. (2018) Melosso, M., Melli, A., Puzzarini, C., et al. 2018, A&A, 609, A121, doi: 10.1051/0004-6361/201731972
- Menor Salván et al. (2020) Menor Salván, C., Bouza, M., Fialho, D. M., et al. 2020, ChemBioChem, 21, 3504, doi: https://doi.org/10.1002/cbic.202000510
- Mininni et al. (2020) Mininni, C., Beltrán, M. T., Rivilla, V. M., et al. 2020, A&A, 644, A84, doi: 10.1051/0004-6361/202038966
- Molpeceres et al. (2021) Molpeceres, G., García de la Concepción, J., & Jiménez-Serra, I. 2021, ApJ, 923, 159, doi: 10.3847/1538-4357/ac2ebc
- Neill et al. (2012) Neill, J. L., Muckle, M. T., Zaleski, D. P., et al. 2012, ApJ, 755, 153, doi: 10.1088/0004-637X/755/2/153
- Oró & Kimball (1961) Oró, J., & Kimball, A. 1961, Archives of Biochemistry and Biophysics, 94, 217, doi: https://doi.org/10.1016/0003-9861(61)90033-9
- Patel et al. (2015) Patel, B. H., Percivalle, C., Ritson, D. J., Duffy, C. D., & Sutherland, J. D. 2015, Nature Chemistry, 7, 301, doi: 10.1038/nchem.2202
- Petrie & Osamura (2004) Petrie, S., & Osamura, Y. 2004, Journal of Physical Chemistry A, 108, 3623, doi: 10.1021/jp0378182
- Powner et al. (2009) Powner, M. W., Gerland, B., & Sutherland, J. D. 2009, Nature, 459, 239, doi: 10.1038/nature08013
- Puzzarini (2015) Puzzarini, C. 2015, Journal of Physical Chemistry A, 119, 11614, doi: 10.1021/acs.jpca.5b09489
- Puzzarini & Barone (2020) Puzzarini, C., & Barone, V. 2020, Physical Chemistry Chemical Physics (Incorporating Faraday Transactions), 22, 6507, doi: 10.1039/D0CP00561D
- Requena-Torres et al. (2008) Requena-Torres, M. A., Martín-Pintado, J., Martín, S., & Morris, M. R. 2008, ApJ, 672, 352, doi: 10.1086/523627
- Requena-Torres et al. (2006) Requena-Torres, M. A., Martín-Pintado, J., Rodríguez-Franco, A., et al. 2006, A&A, 455, 971, doi: 10.1051/0004-6361:20065190
- Rimola et al. (2018) Rimola, A., Skouteris, D., Balucani, N., et al. 2018, ACS Earth and Space Chemistry, 2, 720, doi: 10.1021/acsearthspacechem.7b00156
- Rivilla et al. (2017) Rivilla, V. M., Beltrán, M. T., Martín-Pintado, J., et al. 2017, A&A, 599, A26, doi: 10.1051/0004-6361/201628823
- Rivilla et al. (2018) Rivilla, V. M., Jiménez-Serra, I., Zeng, S., et al. 2018, MNRAS, 475, L30, doi: 10.1093/mnrasl/slx208
- Rivilla et al. (2019) Rivilla, V. M., Martín-Pintado, J., Jiménez-Serra, I., et al. 2019, MNRAS, 483, L114, doi: 10.1093/mnrasl/sly228
- Rivilla et al. (2020a) Rivilla, V. M., Drozdovskaya, M. N., Altwegg, K., et al. 2020a, MNRAS, 492, 1180, doi: 10.1093/mnras/stz3336
- Rivilla et al. (2020b) Rivilla, V. M., Martín-Pintado, J., Jiménez-Serra, I., et al. 2020b, ApJ, 899, L28, doi: 10.3847/2041-8213/abac55
- Rivilla et al. (2021a) Rivilla, V. M., Jiménez-Serra, I., García de la Concepción, J., et al. 2021a, MNRAS, 506, L79, doi: 10.1093/mnrasl/slab074
- Rivilla et al. (2021b) Rivilla, V. M., Jiménez-Serra, I., Martín-Pintado, J., et al. 2021b, Proceedings of the National Academy of Science, 118, e2101314118, doi: 10.1073/pnas.2101314118
- Rivilla et al. (2022a) Rivilla, V. M., Jiménez-Serra, I., Martín-Pintado, J., et al. 2022a, Frontiers in Astronomy and Space Sciences, 9, 876870, doi: 10.3389/fspas.2022.876870
- Rivilla et al. (2022b) Rivilla, V. M., Colzi, L., Jiménez-Serra, I., et al. 2022b, ApJ, 929, L11, doi: 10.3847/2041-8213/ac6186
- Rivilla et al. (2022c) Rivilla, V. M., García De La Concepción, J., Jiménez-Serra, I., et al. 2022c, Frontiers in Astronomy and Space Sciences, 9, 829288, doi: 10.3389/fspas.2022.829288
- Rivilla et al. (2023) Rivilla, V. M., Sanz-Novo, M., Jiménez-Serra, I., et al. 2023, ApJ, 953, L20, doi: 10.3847/2041-8213/ace977
- Rodríguez-Almeida et al. (2021a) Rodríguez-Almeida, L. F., Jiménez-Serra, I., Rivilla, V. M., et al. 2021a, ApJ, 912, L11, doi: 10.3847/2041-8213/abf7cb
- Rodríguez-Almeida et al. (2021b) Rodríguez-Almeida, L. F., Rivilla, V. M., Jiménez-Serra, I., et al. 2021b, A&A, 654, L1, doi: 10.1051/0004-6361/202141989
- San Andrés et al. (2023) San Andrés, D., Colzi, L., Rivilla, V. M., et al. 2023, MNRAS, 523, 3239, doi: 10.1093/mnras/stad1385
- Sanchez et al. (1968) Sanchez, R. A., Ferris, J. P., & Orgel, L. E. 1968, Journal of Molecular Biology, 38, 121, doi: https://doi.org/10.1016/0022-2836(68)90132-0
- Sandström & Rahm (2023) Sandström, H., & Rahm, M. 2023, Journal of Physical Chemistry A, 127, 4503, doi: 10.1021/acs.jpca.3c01504
- Santalucia et al. (2022) Santalucia, R., Pazzi, M., Bonino, F., et al. 2022, Physical Chemistry Chemical Physics (Incorporating Faraday Transactions), 24, 7224, doi: 10.1039/D1CP05407D
- Sanz-Novo et al. (2023) Sanz-Novo, M., Rivilla, V. M., Jiménez-Serra, I., et al. 2023, ApJ, 954, 3, doi: 10.3847/1538-4357/ace523
- Shingledecker et al. (2019) Shingledecker, C. N., Álvarez-Barcia, S., Korn, V. H., & Kästner, J. 2019, ApJ, 878, 80, doi: 10.3847/1538-4357/ab1d4a
- Shingledecker et al. (2020) Shingledecker, C. N., Molpeceres, G., Rivilla, V. M., Majumdar, L., & Kästner, J. 2020, ApJ, 897, 158, doi: 10.3847/1538-4357/ab94b5
- Shivani et al. (2017) Shivani, Misra, A., & Tandon, P. 2017, Research in Astronomy and Astrophysics, 17, 1, doi: 10.1088/1674-4527/17/1/1
- Skodje et al. (1981) Skodje, R. T., Truhlar, D. G., & Garrett, B. C. 1981, The Journal of Physical Chemistry, 85, 3019, doi: 10.1021/j150621a001
- Smith et al. (2001) Smith, I. W. M., Talbi, D., & Herbst, E. 2001, A&A, 369, 611, doi: 10.1051/0004-6361:20010126
- Stolze et al. (1989) Stolze, W. H., Sutter, D. H., & Wentrup, C. 1989, Zeitschrift Naturforschung Teil A, 44, 291, doi: 10.1515/zna-1989-0407
- Suzuki et al. (2016) Suzuki, T., Ohishi, M., Hirota, T., et al. 2016, ApJ, 825, 79, doi: 10.3847/0004-637X/825/1/79
- Takano et al. (1990) Takano, S., Sugie, M., Sugawara, K.-i., et al. 1990, Journal of Molecular Spectroscopy, 141, 13, doi: 10.1016/0022-2852(90)90273-S
- Tercero et al. (2021) Tercero, F., López-Pérez, J. A., Gallego, J. D., et al. 2021, A&A, 645, A37, doi: 10.1051/0004-6361/202038701
- Theule et al. (2011) Theule, P., Borget, F., Mispelaer, F., et al. 2011, A&A, 534, A64, doi: 10.1051/0004-6361/201117494
- Turner et al. (1975) Turner, B. E., Liszt, H. S., Kaifu, N., & Kisliakov, A. G. 1975, ApJ, 201, L149, doi: 10.1086/181963
- Vasconcelos et al. (2020) Vasconcelos, F. A., Pilling, S., Agnihotri, A., Rothard, H., & Boduch, P. 2020, Icarus, 351, 113944, doi: 10.1016/j.icarus.2020.113944
- Vazart et al. (2015) Vazart, F., Latouche, C., Skouteris, D., Balucani, N., & Barone, V. 2015, ApJ, 810, 111, doi: 10.1088/0004-637X/810/2/111
- Winnewisser et al. (1984) Winnewisser, M., Winnewisser, B. P., & Wentrup, C. 1984, Journal of Molecular Spectroscopy, 105, 193, doi: 10.1016/0022-2852(84)90111-5
- Yim & Choe (2012) Yim, M. K., & Choe, J. C. 2012, Chemical Physics Letters, 538, 24, doi: 10.1016/j.cplett.2012.04.042
- Zaleski et al. (2013) Zaleski, D. P., Seifert, N. A., Steber, A. L., et al. 2013, ApJ, 765, L10, doi: 10.1088/2041-8205/765/1/L10
- Zeng et al. (2019) Zeng, S., Quénard, D., Jiménez-Serra, I., et al. 2019, MNRAS, 484, L43, doi: 10.1093/mnrasl/slz002
- Zeng et al. (2018) Zeng, S., Jiménez-Serra, I., Rivilla, V. M., et al. 2018, MNRAS, 478, 2962, doi: 10.1093/mnras/sty1174
- Zeng et al. (2020) Zeng, S., Zhang, Q., Jiménez-Serra, I., et al. 2020, MNRAS, 497, 4896, doi: 10.1093/mnras/staa2187
- Zeng et al. (2021) Zeng, S., Jiménez-Serra, I., Rivilla, V. M., et al. 2021, ApJ, 920, L27, doi: 10.3847/2041-8213/ac2c7e
- Zeng et al. (2023) Zeng, S., Rivilla, V. M., Jiménez-Serra, I., et al. 2023, MNRAS, 523, 1448, doi: 10.1093/mnras/stad1478
- Zhang et al. (2020) Zhang, X., Quan, D., Chang, Q., et al. 2020, MNRAS, 497, 609, doi: 10.1093/mnras/staa1979
- Zheng et al. (2024) Zheng, S., Li, J., Wang, J., et al. 2024, ApJ, 961, 58, doi: 10.3847/1538-4357/ad072c
Appendix A \ceH2CNCN transitions excluded from the LTE fit
Besides \ceH2CNCN transitions used to generate the LTE model of this molecule shown in Fig. 1, our observational data also encompasses many other -type rotational lines belonging to this species within the almost entirely targeted = 3 to progressions of the ladders. These remaining transitions are shown in Fig. 8, which just includes the most intense ones among them (with peak intensities down to 1.5 mK and integrated S/N3). As it can be seen, most of these lines are heavily blended with the emission from other species (either unknown or already detected towards G+0.693), while a few others lie in certain segments of the spectrum where the noise level is too high to provide a clear identification. Since it is evident that these transitions do not qualify for the direct detection of this molecule, they were excluded in our analysis. Nevertheless, it is worth emphasising that the predicted emissions for all of them is coherent with the observed spectrum, reaffirming the consistency of the LTE model derived for \ceH2CNCN as presented in Sect. 3.1.

Appendix B -\ceHNCHCN and -\ceHNCHCN spectroscopy
Table 3 gathers the spectroscopic information of the lines belonging to -\ceHNCHCN and -\ceHNCHCN we have detected towards G+0.693 that are unblended or partially blended with the emission of other molecular species. These transitions are shown in Figs. 3 and 4, respectively, and are those we used to perform the LTE line fitting of these two isomers. We provide the most relevant spectroscopic parameters for each transition, which are the rest frequency, quantum numbers, base 10 logarithm of the integrated intensity at 300 K (), energy of the upper level (), the noise level of the spectra evaluated over line-free spectral ranges close to it (rms), the integrated intensity () as calculated from the fit, the detection level (in terms of the integrated S/N ratio) and information regarding line blending. The spectroscopic information has been obtained from the CDMS entries of these isomers, which come from Takano et al. (1990); Zaleski et al. (2013) and Melosso et al. (2018) works.
| Frequency(a) | Transition(b) | rms | S/N(c) | Blending(d) | ||||||
|---|---|---|---|---|---|---|---|---|---|---|
| (GHz) | (′′) | () | (K) | (mK) | () | |||||
| -\ceHNCHCN | ||||||||||
| 37\@alignment@align.93654(7) | -6.3795 | 6\@alignment@align.9 | 0.5 | 236(14)\@alignment@align | 78(5) | Blended: \ceC2H3CN | ||||
| 38\@alignment@align.7947810(4) | -6.3287 | 4\@alignment@align.7 | 0.5 | 302(15)\@alignment@align | 100(5) | Slightly blended: \ceCH3COCH3 | ||||
| 39\@alignment@align.70212(7) | -6.3402 | 7\@alignment@align.1 | 0.5 | 244(14)\@alignment@align | 82(5) | Blended: \ceCH3CONH2 and U | ||||
| 47\@alignment@align.4148090(8) | -6.1065 | 9\@alignment@align.2 | 0.5 | 325(16)\@alignment@align | 119(6) | Blended: \ceC2H3CN | ||||
| 48\@alignment@align.47090(7) | -6.0665 | 7\@alignment@align.0 | 0.5 | 405(18)\@alignment@align | 151(7) | Unblended | ||||
| 48\@alignment@align.5276164(5) | -6.1548 | 16\@alignment@align.5 | 0.5 | 174(12)\@alignment@align | 65(5) | Slightly blended: \ceHOCH2CHO and U | ||||
| 49\@alignment@align.62143(7) | -6.0674 | 9\@alignment@align.5 | 0.5 | 334(16)\@alignment@align | 125(6) | Unblended | ||||
| 75\@alignment@align.8241226(12) | -5.5395 | 18\@alignment@align.7 | 2.4 | 447(60)\@alignment@align | 26(3) | Blended: \ceCH3SH and U | ||||
| 77\@alignment@align.3975188(8) | -5.5120 | 16\@alignment@align.7 | 2.4 | 536(60)\@alignment@align | 31(3) | Unblended⋆ | ||||
| 77\@alignment@align.61551(7) | -5.5512 | 26\@alignment@align.2 | 2.4 | 257(60)\@alignment@align | 15(3) | Blended: --\ceCH3NHCHO | ||||
| 77\@alignment@align.86298(7) | -5.5485 | 26\@alignment@align.3 | 2.4 | 257(60)\@alignment@align | 15(3) | Unblended⋆ | ||||
| 85\@alignment@align.2831815(13) | ∗ | -5.3992 | 22\@alignment@align.8 | 1.6 | 429(40)\@alignment@align | 39(4) | Slightly blended: \ceHOCH2CHO and \ceH^15NCO | |||
| 86\@alignment@align.99658(10) | ∗ | -5.3738 | 20\@alignment@align.9 | 1.6 | 508(41)\@alignment@align | 47(4) | Blended: \ceHCCCC^13CN | |||
| 87\@alignment@align.6558177(9) | -5.4029 | 30\@alignment@align.5 | 1.3 | 247(31)\@alignment@align | 28(4) | Blended: -\ce(CH2OH)2 | ||||
| 89\@alignment@align.24785(10) | ∗ | -5.3610 | 23\@alignment@align.8 | 1.3 | 421(34)\@alignment@align | 49(4) | Blended: \ceH2CCCHCN and U | |||
| 94\@alignment@align.73583(10) | ∗ | -5.2746 | 27\@alignment@align.4 | 0.9 | 388(25)\@alignment@align | 66(4) | Unblended | |||
| 96\@alignment@align.56986(10) | ∗ | -5.2510 | 25\@alignment@align.5 | 1.5 | 455(40)\@alignment@align | 47(4) | Slightly blended: \ce^13CH3SH | |||
| 97\@alignment@align.46902(10) | -5.2744 | 35\@alignment@align.1 | 1.5 | 223(35)\@alignment@align | 23(4) | Blended: \ceCH3CONH2 and U | ||||
| 99\@alignment@align.13721(10) | -5.2367 | 28\@alignment@align.6 | 1.5 | 375(40)\@alignment@align | 39(4) | Blended: \ceCH3NH2 and \ceCH3OCHO | ||||
| 104\@alignment@align.181786(20) | -5.1629 | 32\@alignment@align.4 | 1.8 | 332(43)\@alignment@align | 30(4) | Slightly blended: -\ce(CH2OH)2 | ||||
| 106\@alignment@align.115423(20) | -5.1409 | 30\@alignment@align.6 | 1.8 | 387(44)\@alignment@align | 35(4) | Blended: \ceCH3OCHO | ||||
| 106\@alignment@align.663856(20) | -5.1647 | 40\@alignment@align.2 | 1.8 | 191(42)\@alignment@align | 17(4) | Blended: -\ce(CH2OH)2 | ||||
| 109\@alignment@align.016976(20) | ∗ | -5.1254 | 33\@alignment@align.8 | 2.9 | 316(70)\@alignment@align | 18(4) | Slightly blended with U | |||
| 113\@alignment@align.620315(20) | -5.0620 | 37\@alignment@align.8 | 2.8 | 271(70)\@alignment@align | 16(4) | Blended: -\ceCH3CH2CH2OH and -\ceC2H5SH | ||||
| 125\@alignment@align.1163734(14) | -4.9511 | 42\@alignment@align.2 | 6.6 | 241(153)\@alignment@align | 7(4) | Blended: \ceCH3SH | ||||
| 134\@alignment@align.5699312(15) | -4.8686 | 48\@alignment@align.7 | 1.5 | 177(35)\@alignment@align | 22(4) | Unblended⋆ | ||||
| -\ceHNCHCN | ||||||||||
| 37\@alignment@align.54275(10) | -5.6004 | 7\@alignment@align.3 | 0.5 | 297(13)\@alignment@align | 97(5) | Slightly blended with U | ||||
| 46\@alignment@align.9248305(11) | -5.3274 | 9\@alignment@align.5 | 0.5 | 415(16)\@alignment@align | 152(6) | Unblended⋆ | ||||
| 48\@alignment@align.78317(10) | -5.2940 | 9\@alignment@align.8 | 0.5 | 425(16)\@alignment@align | 159(6) | Unblended⋆ | ||||
| 75\@alignment@align.05519(10) | -4.7600 | 19\@alignment@align.0 | 2.4 | 606(60)\@alignment@align | 35(3) | Unblended⋆ | ||||
| 78\@alignment@align.02648(10) | -4.7272 | 19\@alignment@align.6 | 2.4 | 606(60)\@alignment@align | 36(3) | Blended: \ceCH3NCO and U | ||||
| 84\@alignment@align.42511(10) | ∗ | -4.6196 | 23\@alignment@align.0 | 1.6 | 596(41)\@alignment@align | 54(4) | Unblended | |||
| 85\@alignment@align.512670(16) | -5.3412 | 5\@alignment@align.5 | 1.6 | 256(40)\@alignment@align | 23(3) | Blended: -\ce(CH2OH)2 and U | ||||
| 87\@alignment@align.76650(10) | -4.5869 | 23\@alignment@align.8 | 1.3 | 589(34)\@alignment@align | 67(4) | Blended: \ceHOCH2CHO and \ceCH3OCHO | ||||
| 93\@alignment@align.79107(10) | ∗ | -4.4949 | 27\@alignment@align.5 | 0.9 | 554(26)\@alignment@align | 94(5) | Unblended | |||
| 94\@alignment@align.345774(16) | -5.1964 | 7\@alignment@align.3 | 0.9 | 317(23)\@alignment@align | 54(4) | Unblended⋆ | ||||
| 95\@alignment@align.42252(10) | ∗ | -4.4722 | 25\@alignment@align.2 | 1.5 | 663(40)\@alignment@align | 68(4) | Blended with U | |||
| 97\@alignment@align.50186(10) | ∗ | -4.4625 | 28\@alignment@align.5 | 1.5 | 542(40)\@alignment@align | 57(4) | Unblended | |||
| 102\@alignment@align.999619(16) | -5.0669 | 9\@alignment@align.5 | 1.8 | 362(43)\@alignment@align | 32(4) | Blended: -\ceC3H2 and \ceCH3COCH3 | ||||
| 103\@alignment@align.1527434(22) | -4.3830 | 32\@alignment@align.5 | 1.8 | 489(44)\@alignment@align | 44(4) | Unblended | ||||
| 104\@alignment@align.895725(20) | ∗ | -4.3617 | 30\@alignment@align.3 | 1.8 | 581(45)\@alignment@align | 52(4) | Unblended⋆ | |||
| 107\@alignment@align.231510(20) | -4.3509 | 33\@alignment@align.7 | 1.8 | 473(44)\@alignment@align | 43(4) | Unblended⋆ | ||||
| 111\@alignment@align.479187(16) | -4.9503 | 12\@alignment@align.2 | 2.8 | 389(70)\@alignment@align | 23(4) | Unblended⋆ | ||||
| 112\@alignment@align.509636(20) | -4.2819 | 37\@alignment@align.9 | 2.8 | 413(70)\@alignment@align | 25(4) | Blended: -\ceCH3CHNH | ||||
| 114\@alignment@align.349931(20) | -4.2617 | 35\@alignment@align.7 | 2.8 | 486(70)\@alignment@align | 29(4) | Unblended | ||||
| 127\@alignment@align.942187(15) | -3.8856 | 19\@alignment@align.0 | 6.6 | 383(160)\@alignment@align | 10(4) | Blended: \ceH^15NCO and -\ceCH3CHNH | ||||
| 135\@alignment@align.942373(15) | -3.7881 | 23\@alignment@align.0 | 1.5 | 356(40)\@alignment@align | 44(5) | Blended: \ceCH3OCHO | ||||
| \@alignment@align | ||||||||||
Note. — (a) The numbers in brackets represent the experimental uncertainty associated to the last digits, as measured by Takano et al. (1990), Zaleski et al. (2013) and Melosso et al. (2018).
(b) Rotational transitions marked with an asterisk symbol (*) refer to those previously targeted by Rivilla et al. (2019) and which these authors used to perform the LTE modelling of these species. All of the transitions are also labelled following the same notation indicated in Table 2.
(c) The S/N is calculated from the integrated intensity over the line width () and noise level , where is the spectral resolution of the spectra in velocity units and the FWHM is estimated from the LTE line fitting. The numbers in brackets represent the combined standard uncertainty associated to the last digits.
(d) The term “unblended” denotes those transitions which exhibit no contamination from other molecular species, while a star symbol () is added when scarce line blending accounting for less than 5% of the line total integrated intensity is present. “U” hints at blending with an unknown (not yet identified) species.