A spectral investigation of criticality and crossover effects in two and three dimensions: Short timescales with small systems in minute random matrices
Abstract
Random matrix theory, particularly using matrices akin to the Wishart ensemble, has proven successful in elucidating the thermodynamic characteristics of critical behavior in spin systems across varying interaction ranges. This paper explores the applicability of such methods in investigating critical phenomena and the crossover to tricritical points within the Blume-Capel model. Through an analysis of eigenvalue mean, dispersion, and extrema statistics, we demonstrate the efficacy of these spectral techniques in characterizing critical points in both two and three dimensions. Crucially, we propose a significant modification to this spectral approach, which emerges as a versatile tool for studying critical phenomena. Unlike traditional methods that eschew diagonalization, our method excels in handling short timescales and small system sizes, widening the scope of inquiry into critical behavior.
I Introduction
The phenomenology of critical phenomena, encompassing phase transitions in diverse contexts, stands as a cornerstone within the framework of Statistical Mechanics theory. Initially conceived within the realm of many-body physics, it has evolved into a concept with far-reaching applications spanning disciplines such as economics, network theory, sociophysics, game theory, and numerous others [1, 2, 3, 4, 5].
In spin systems, a particularly effective approach to delve into critical phenomena involves conducting short-time dynamics studies. This method entails preparing systems with carefully chosen initial conditions and then analyzing temporal averages. Through this analysis, the manifestation of critical behavior in the system is revealed via power-law dynamics [6, 7, 8, 9, 10, 11].
Such an endeavor can be pursued in models exhibiting up-down symmetry [12, 13, 14], as well as in models featuring absorbing states within the universality class of direct percolation [8, 15, 16, 17, 18, 19]. Additionally, these studies extend to tricritical points (TCP), encompassing two-dimensional and three-dimensional short-range systems, as well as systems under mean-field approximation [20, 21, 22, 23, 24], each with their distinctive characteristics and intricacies.
Utilizing time-dependent simulations to investigate these techniques presupposes the capability to compress temporal evolution while contending with inherently large systems, a challenge frequently encountered in equilibrium simulations. Moreover, equilibrium simulations grapple with the issue of critical slowing down. Nowadays simulations of two-dimensional systems typically encompass linear dimensions denoted by , conservatively ranging in the order of hundreds or, with more generous allocations, extending into the thousands. These simulations leverage parallelization techniques and GPU applications to effectively handle computational demands.
This suggests that exploring non-conventional methods is intriguing. Upon delving into the literature, the concept of random matrices reveals fascinating aspects. Originating from the intricate description of the distribution of energy levels in heavy nuclei proposed by E. Wigner [25, 26, 27, 28], its connection with the thermodynamics of Coulomb gases primarily stems from the works of Dyson [29, 30, 31].
Alternatively, utilizing individual time series to construct appropriate matrices, known as Wishart matrices [32, 33], offers a particularly intriguing avenue for delving into the statistical mechanics of spin systems and their idiosyncrasies. This approach is underscored by recent contributions [34, 35, 36, 37], as these matrices encapsulate the time-correlations of specific random variables described by stochastic processes, which can be modeled by Langevin equations or simulated via Monte Carlo (MC) Markov chains. It’s noteworthy to mention that while the integrability aspects of lattice spin systems have been explored using random matrices, the emphasis has traditionally been on direct examination of the Hamiltonians of such systems [38], rather than on correlation matrices as in the previously mentioned works.
In contrast to other methods found in the literature, the approach advocated by one of the authors of this paper in [36] diverges significantly by eschewing the use of matrices whose dimensions correspond directly to the number of lattice sites. Such an approach, while theoretically sound, can be computationally prohibitive due to the sheer scale of the matrices involved. Instead, the proposed method operates effectively with dimensions on the order of a few hundred, derived from various short-term evolution samples of the magnetization system. This strategy, as evidenced in our prior research [36, 37], proves to be both computationally efficient and theoretically robust.
In this study, we aim to extend the applicability of random matrix methodology by investigating models that exhibit tricritical points, with a particular emphasis on the transition from critical points to the tricritical one. Through careful analysis of the spectra derived from Wishart-like matrices, which capture the correlations among diverse magnetization time series, we showcase the effectiveness of our approach in elucidating the phase diagram of the Blume-Capel (BC) model in both two and three dimensions. Throughout this paper, we present our findings, highlighting how this methodology adeptly reveals the intricate characteristics of complex systems like the BC model.
Furthermore, we demonstrate that this method, despite its efficiency and suitability for short times, operates effectively for small systems, contrastively to the standard MC method.
In the next section, we introduce the Wishart-like method alongside a concise overview of the established properties of the BC model. It’s crucial to emphasize that our primary focus lies not on the intricacies of the model itself. Rather, our goal was to select the simplest model featuring a tricritical point in both two and three dimensions to validate our study.
In the following section (Section III), we unveil our principal findings, demonstrating the efficacy of our method in accurately pinpointing the critical points of both the two-dimensional and three-dimensional versions of the model. Additionally, we illustrate how our approach adeptly captures the crossover effects in a spectral manner. Furthermore, a novel aspect explored in this study, not previously investigated in our prior works, is the successful application of extreme value statistics in establishing the criticality of such systems.
Lastly, we demonstrate the effectiveness of our method even for very small systems. We illustrate that although there may be a computational cost associated with diagonalizing matrices, this cost is offset by the advantages gained from shorter computation times and smaller system sizes. The paper concludes with a summary of key findings and conclusions.
II Random Matrices, Critical, and Tricritical Points in the Blume-Capel Model
Tricritical points play a vital role in contemporary research within condensed matter theory and statistical mechanics. The pioneering discovery of the first tricritical point in He-3 and He-4 mixtures by R. B. Griffiths in 1970 marked a significant milestone [39]. Subsequently, Griffiths, along with Blume and Emery, introduced the BEG (Blume-Emery-Griffiths) model in 1971, which provided a framework to replicate the thermodynamic behavior observed in these mixtures [40]. This model, based on a spin-1 Ising model, has since become a cornerstone in the study of tricritical phenomena.
In its broader scope, the Hamiltonian can be expressed as:
The initial term delineates the crystalline interaction among the spins, whereas the subsequent term denotes the multispin interaction among them. Finally, the third, fourth, and last terms represent the Ising interaction between spin pairs, anisotropic interaction, and the interaction of spins with an external magnetic field, respectively.
Indeed, an even more straightforward variation of this model, commonly referred to as the Blume-Capel (BC) model [41, 42], is delineated by the Hamiltonian:
| (1) |
where each spins can hold the values , it would be enough to present the existence of a tricritical point in both two and three dimensions, separating a critical line of the first order line.
The first term models the local interaction between the spins, with representing the interaction strength and indicating that the interaction occurs between nearest neighbor pairs of sites and . The parameter is called the anisotropy field and is responsible for zero-field splitting, resulting in an increase in energy for states even in the absence of an external magnetic field. Finally, the third term models the interaction of the system with an external magnetic field of intensity , which we will assume is not present.
In this scenario, the model delineates a critical line (CL) culminating in a tricritical point (TCP). Subsequently, it exhibits a first-order line (FOL), as illustrated in Figure 1 for both the two-dimensional and three-dimensional versions of the BC model in the absence of an external magnetic field.
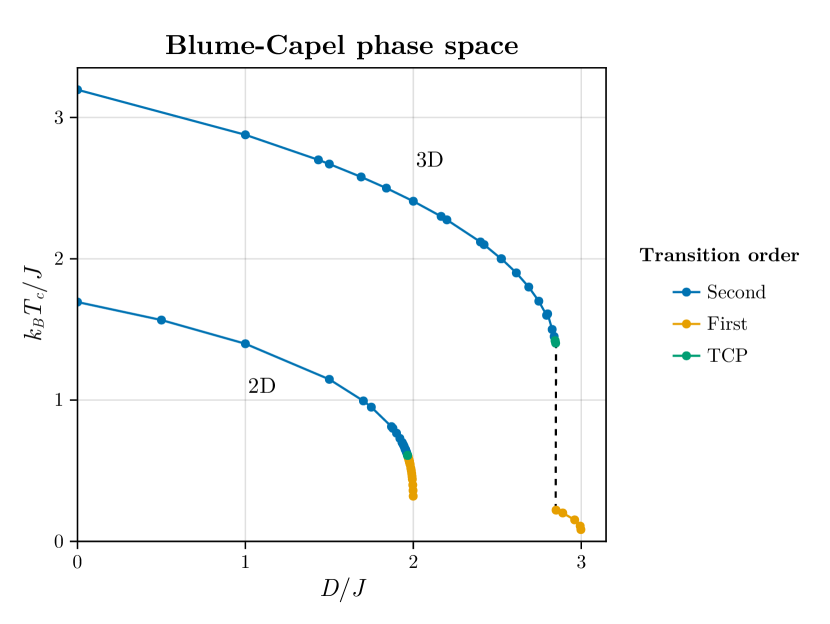
This figure is utilized only for pedagogical reasons in this work since all points used in this current work uses the points estimated in this line that were very didactically obtained by Butera and Pernici [43]. Sure, a lot of estimates shown in such reference were re-obtained by the authors since there was a evolution of estimates with very different methods along of many years that include the a lot of good works (see for example [44, 45, 46, 47]). Thus the question is if we can detect the critical line of the BC model for different values of using Wishart-random matrices spectra and how the method responds to the crossover between CL and FOL intermediated by the TCP point.
Therefore, leveraging a framework established in prior research, this study demonstrates our capability to localize critical points within two and three-dimensional BC models, while also investigating the existing crossover phenomena. Subsequently, the following section provides a concise overview of the random matrix methodology employed in our approach, along with the quantities slated for estimation within this method.
II.1 Wishart-like matrices and spin systems
In our analysis, we introduce the magnetization matrix element , which denotes the magnetization of the th time series at the th Monte Carlo (MC) step in a system comprising spins. For simplicity, we set , as it represents the minimal dimension for the manifestation of phase transitions in short-range interaction systems. In this context, ranges from 1 to , and ranges from 1 to , thereby constructing the magnetization matrix with dimensions .
To delve into spectral properties, an intriguing approach is to shift our focus away from and instead examine the square matrix of size :
where each element of is defined as , referred to as the Wishart matrix [32]. To simplify computations, it is advantageous to transform the components of the matrix using the transformed matrix , whose elements are expressed in terms of standard variables as follows:
where . This transformation facilitates subsequent analysis and calculations.
Thereby:
| (2) |
where and . Here it is crucial to expound upon a pivotal calculation that elucidates the application of these matrices in greater detail. We consider two distinct time evolution samples of the magnetization per spin denoted as and , where . In this context:
where denotes the value of the -th spin in the -th evolution or run at time .
We can establish the correlation between these two time series using the following definition:
Given that , and , it follows that thermodynamic limit ():
When , . This leads to: , and we can express the correlation coefficient (our matrix element of ) as:
where and . Thus for is determined by:
This metric assesses the relationship between the temporal averages of spatial correlations within both inter and intra-time series. By analyzing both spatial and temporal dimensions, it provides a compelling approach to delve into spin systems.
Thinking in the general case, when the variables are uncorrelated random variables, momentarily forgetting the context of these variables represent magnetization of spin systems, the eigenvalue density of the matrix conforms to the well-known Marchenko-Pastur (MP) distribution [48]. For our specific case, we express this distribution as:
| (3) |
where
Undoubtedly, we expect that for , the density of eigenvalues obtained from computational simulations approaches in Equation 3, but our method may not necessarily fit such a distribution perfectly due to residual autocorrelation. The interesting question is what happens when . Moreover, we will utilize the density , obtained from computer simulations, to determine the critical parameters of spin models.
The moments of are calculated as:
| (4) |
where is the number of bins of the histogram of . Thus, for , we also expect to approach:
Explicitly, and . However, beyond these limits, the behavior of can provide thermodynamic information about spin models, as suggested by our previous works [36, 37]. In those works, we observed that monitoring and as a function of indicates a minimum of and an inflection point for (or divergence of its derivative) occurs at .
Here, we will demonstrate that this method works effectively for the BC model in both two and three dimensions, particularly in identifying critical points and examining its response to the crossover phenomena between CL and FOL.
III Results
Now, we will present our main results. In the first subsection, we showcase the outcomes of our spectral method concerning the critical points of the BC model in both two and three dimensions. Following this, in the second subsection, we extend our investigation to demonstrate the crossover effects in the model, as captured by the density of maximal eigenvalues of Wishart matrices.
For our analysis, we construct distinct matrices of size for each fixed temperature. Each matrix is derived from magnetization time series, each comprising Monte Carlo steps. These time series are obtained via MC simulations employing heatbath single spin flip dynamics for the BC model, resulting in a total of eigenvalues used to construct the histogram for each temperature. All eigenvalues are categorized into bins. In the two-dimensional systems, we utilize a linear dimension of , while in three dimensions, we employ .
An essential aspect for the accurate numerical application of the method involves utilizing the histogram to compute the eigenvalue moments through numerical experiments, as per Equation 4, and directly calculating the numerical moments. It is crucial to emphasize this point for readers intending to apply the method, as we have confirmed that computing the averages directly does not yield the expected results presented here.
III.1 Critical points
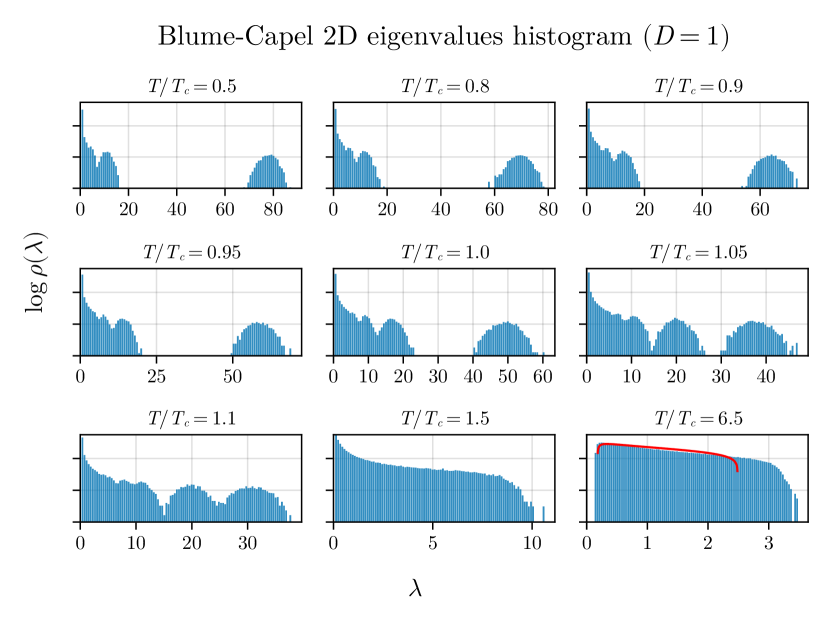
We begin our results by displaying the histogram of eigenvalues. We choose for both the 2D and 3D BC models to illustrate the density of eigenvalues obtained through the diagonalization of matrices . Figure 2 presents histograms for various temperatures. An evolution of the gap between the two eigenvalue bulks can be observed. Similar behavior is noted for the Ising model on two-dimensional lattices under mean-field approximations [36, 37].
We can discern analogous behavior in the three-dimensional BC model, as illustrated in Figure 3.
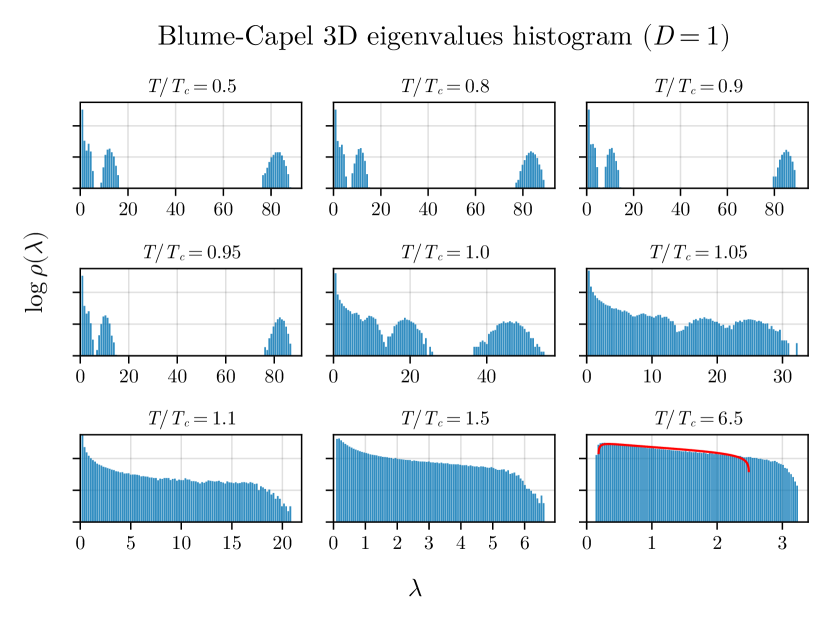
It’s crucial to highlight the distinctive trend of the eigenvalue gap narrowing around the critical temperature, along with the correspondence to the MP law for . While a perfect agreement is not expected as approaches infinity due to the correlation matrix’s construction, incorporating total magnetization and time series with inherent autocorrelation, it’s important to note that this doesn’t diminish the method’s validity in any manner.
However, it is necessary to utilize this density of states to effectively determine the critical parameter. This can be achieved by computing the moments of the density of states, specifically and . In this regard, we observe the results for three different values of . For the two-dimensional BC model (refer to Figure 4), we tested three values: , , and , employing the corresponding values estimated in [43] as a basis. Similarly, for the 3D BC model, we utilized , , and , as depicted in Figure 5.
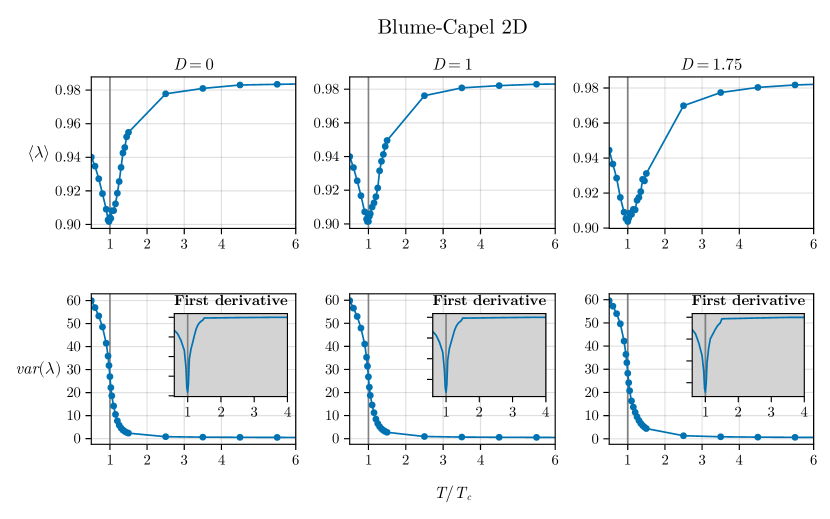
We can observe a pronounced minimum in at in both the two-dimensional and three-dimensional versions of the BC model, which is related to the closing gap observed in Figures 2 and 3. Additionally, an inflection point seems to be observed for the variance exactly at in both versions of the model (in two and three dimensions), demonstrating that both spectral measures – the average and variance – are effective in exploring criticality. The inset plot displays the first derivative of the variance:
indicating that the critical temperature is associated with a pronounced minimum (a negative value of significant magnitude), where
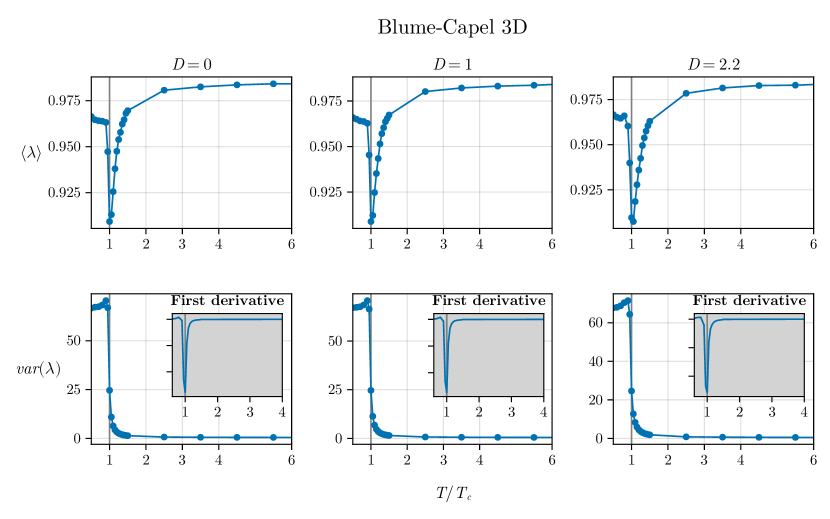
To better understand such behavior, we examine the second derivative:
and its plot is depicted in Figure 6 for both scenarios: the two-dimensional and three-dimensional BC models.
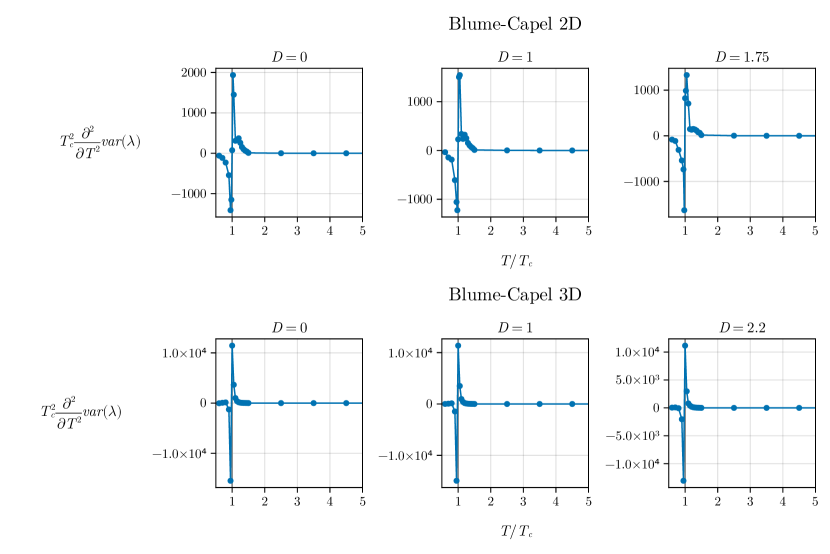
We notice that the critical temperature precisely aligns with the inflection point of the eigenvalue variance due to the condition for and for . Understanding the nature of this inflection point warrants further investigation, prompting a thorough discussion. In our work, we provide an in-depth analysis of this aspect in the appendix.
Thus, in this first subsection, we observed that critical points of the BC model are well captured by this spectral methodology in both versions of the model: two and three dimensions. We used different parameters based on fluctuations of the eigenvalues and their convenient derivatives to conduct our analysis. Now it is important to utilize this method to explore some nuances of points near the tricritical one. We will demonstrate how the method responds to the crossover effect.
III.2 Crossover phenomena
We begin by simulating the average eigenvalue as a function of . However, our focus now shifts to examining points near the tricritical point (TCP) to observe how the spectra of Wishart matrices behave when approaching this point alongside time series of magnetization simulated with (MC) simulations. By repeating our procedure, we initially investigate the issue in two dimensions to understand how the spectrum respond to the expected crossover phenomena in this model (refer to Figure 7). To accomplish this, we employed the values , , , , , and (TCP).
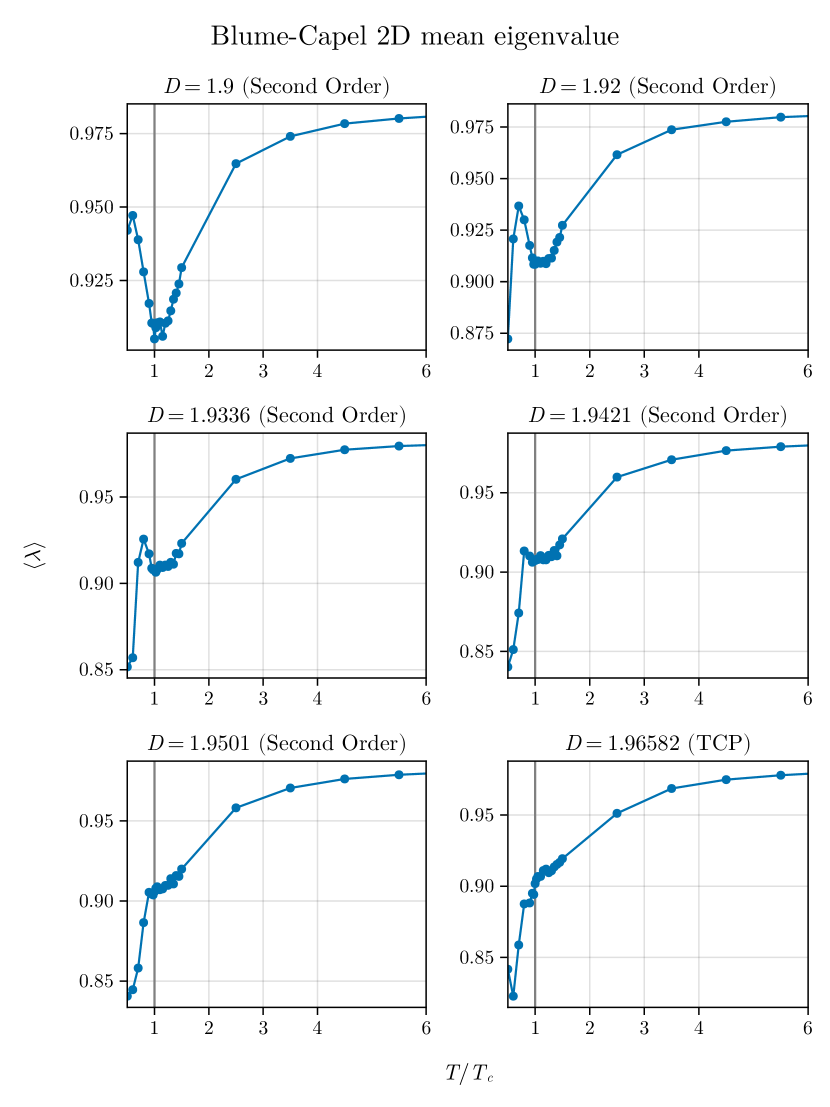
We notice that the minimum becomes less pronounced and deformed as we approach the TCP. However, it is interesting to note that even for points near the TCP, the method indicates the critical point albeit with reduced precision. Initially, the peak transforms into a shell, resembling a shoulder, and eventually, at the tricritical point, the minimum completely disappears.
This indicates that the average, which localized the critical points well away from the TCP, strongly suffers the influence of this point, showing that the spectra of our correlation matrices precisely reflects what occurs with the thermodynamics of the model. Following this, we observe the dispersion of eigenvalues. We plot as a function of for the same values of previously used to study . This result is presented in Figure 8.
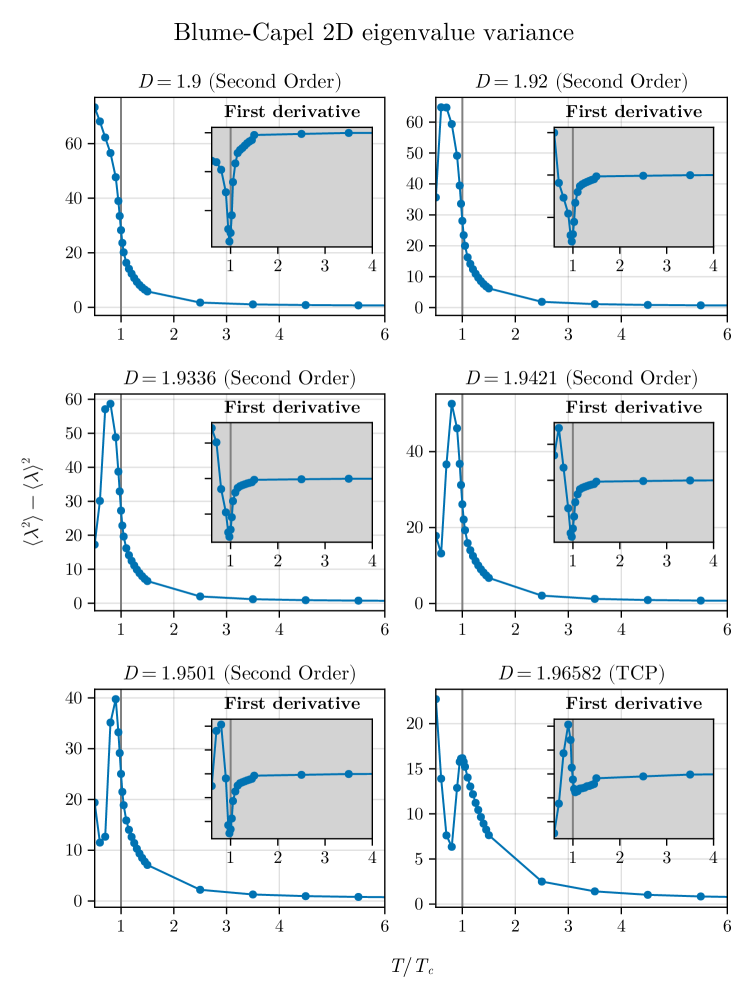
In contrast to the behavior observed with , the quantity exhibits an inflection point very close to , even for points near the TCP; i.e., the variance senses the crossover but is not completely extinguished as with the simple average.
However, at this precise juncture, a peak occurs at the TCP, which, upon closer examination, appears to shift as approaches , i.e., we observe a migration of the maximum that will coincide at the critical temperature only exactly at TCP. Particularly intriguing is the observation that the migration of the maximum occurs with a decrease in its amplitude as approaches .
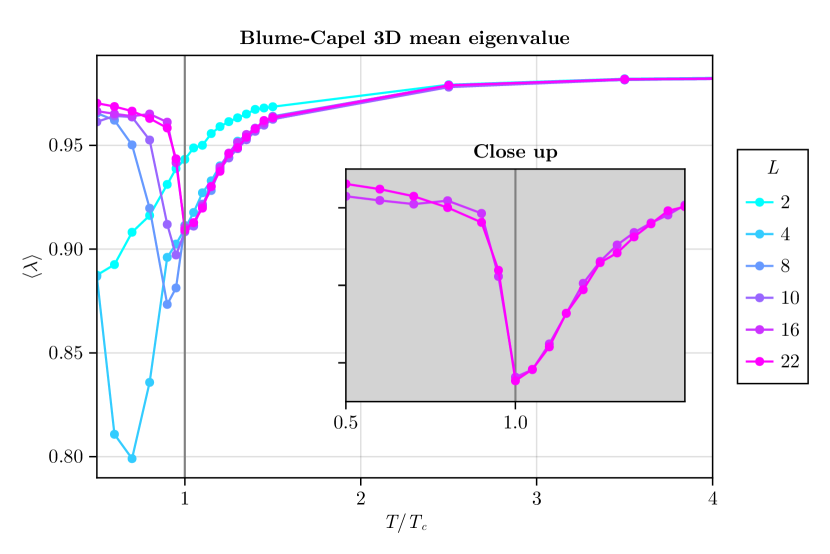
Now, we extend this investigation to the three-dimensional BC model. The behavior of the average as a function of for different values of is illustrated in Figure 9.
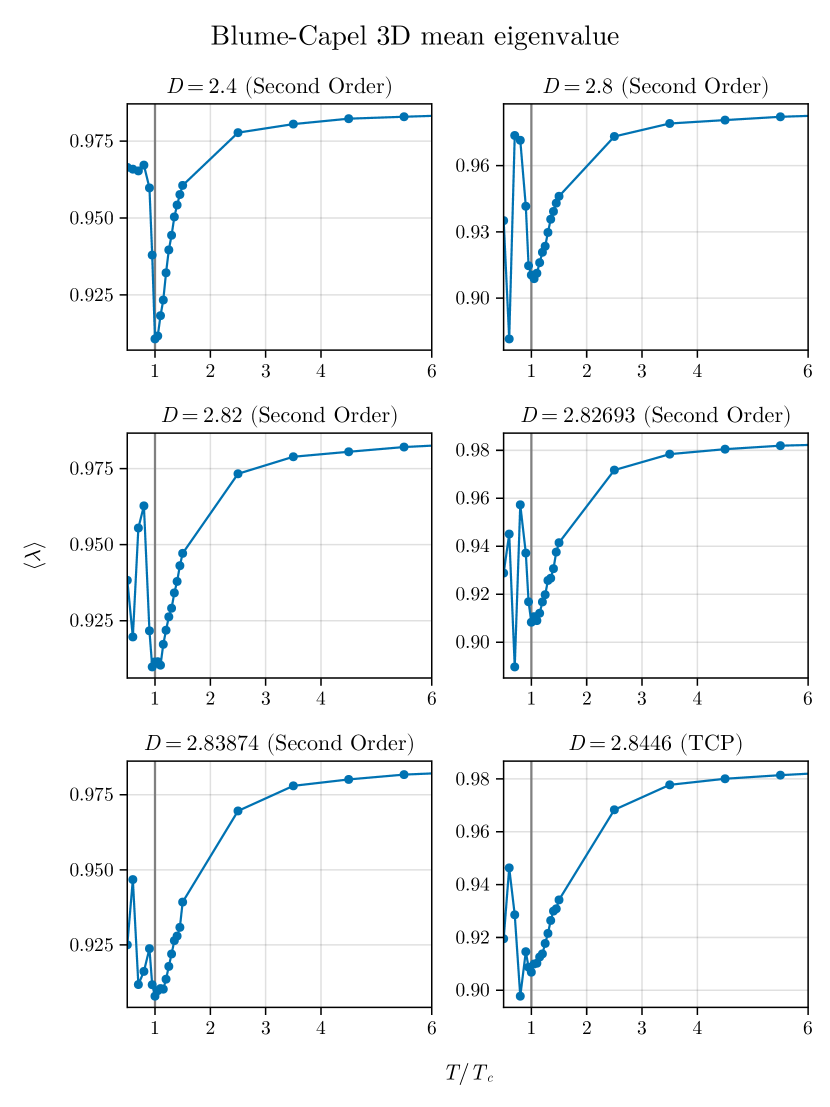
Exactly as occurred in the two-dimensional version of the model, the method indicates the critical point but loses precision as it approaches the TCP. However, we observe that for the 3D version, the minimum is more persistent, even at the TCP itself, since we do not observe a shoulder as obtained in the two-dimensional version.
Here, it is important to mention that in the three-dimensional version of the BC model, the short-time regime presents a logarithmic correction [20, 21], which should suggest such different behavior. However, again, for points far from the TCP, the minimum of always occurs at as the method exactly prescribes in its original proposal.
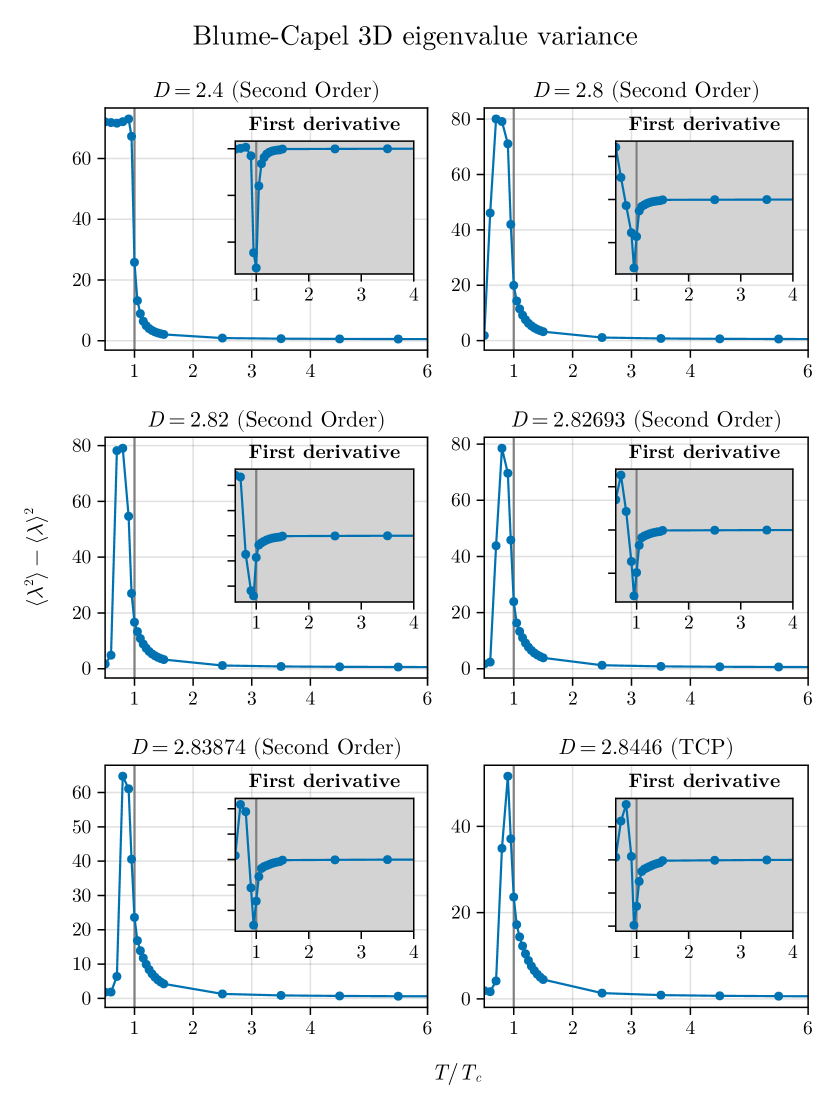
And what about the variance? Similar to what occurred in the two-dimensional version, the inflection point appears for all points. Their estimates in the vicinity of the TCP point slightly differ from the exact critical value. This further reinforces and suggests that we can use the inflection point of the spectral variance as a reliable indicator of critical phenomena (see Figure 10) far from TCP, but crossover effects can generate small deviations around TCP.
Crossover effects are observed in several works, and they play an important role in determining other quantities related to critical behavior, such as critical exponents. Here, we study their influence on the spectra of Wishart matrices built with time series of magnetization of the BC model.
Our results suggest that works very well for critical points outside the influence of the crossover, but it is not a good indicator of criticality near the TCP. In this case, we can make use of eigenvalue variance, which exhibits an inflection point at the critical temperature and responds reasonably well even when near the TCP, although it is also sensitive to crossover effects.
It is important to mention that MC simulations, whether in equilibrium or nonequilibrium, are generally sensitive to crossovers. For example, the dynamic exponent , expected to be universal, is significantly influenced along the critical line in two dimensions [23, 24], and even in the mean-field regime [22].
In Statistical Mechanics, the role of the maximum eigenvalue appears in many contexts, and an important question is whether they can also be used to quantify critical phenomena in the spectral method developed here. In other words, does the maximum eigenvalue of Wishart matrices respond to the critical behavior of the BC model? The answer is positive, and we will present the results in the next subsection.
III.3 Analyzing Extreme Statistics of Correlation Magnetization Matrices
The utilization of extreme values has been extensively investigated within formal contexts to characterize phase transitions in random matrices (see, for instance, [49, 50]). Nevertheless, we posit that our approach holds promise for extension, leveraging similar principles computationally and efficiently to pinpoint critical points. Hence, this paper embarks on an exploration of extreme value statistics as indicators of critical points within the BC model, employing our correlation magnetization matrices.
Accordingly, for each matrix constructed, we extract its maximum eigenvalue and compute the average across multiple runs using the following formula:
and consider its behavior as a function of different temperatures for the BC model in both two and three dimensions. For such analysis, we choose , , , , , and in two dimensions and , , , , , and for the three-dimensional version of the model. The behavior of as a function of is shown in Figures 11 and 12 respectively for the cases of the two and three-dimensional BC models.
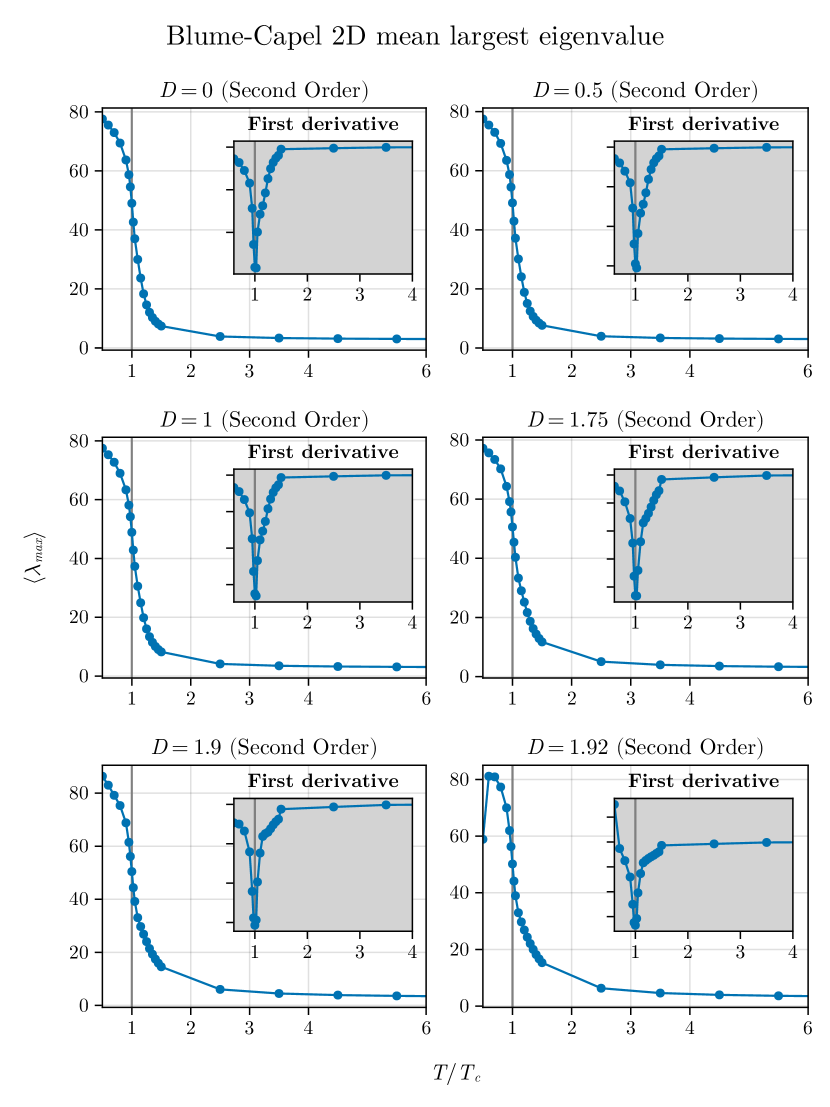
We observe that in both situations, the critical point is identified by a notable inflection point. Additionally, we show the first derivative in relation to , simply described as , as a function of as inset plots in these figures.
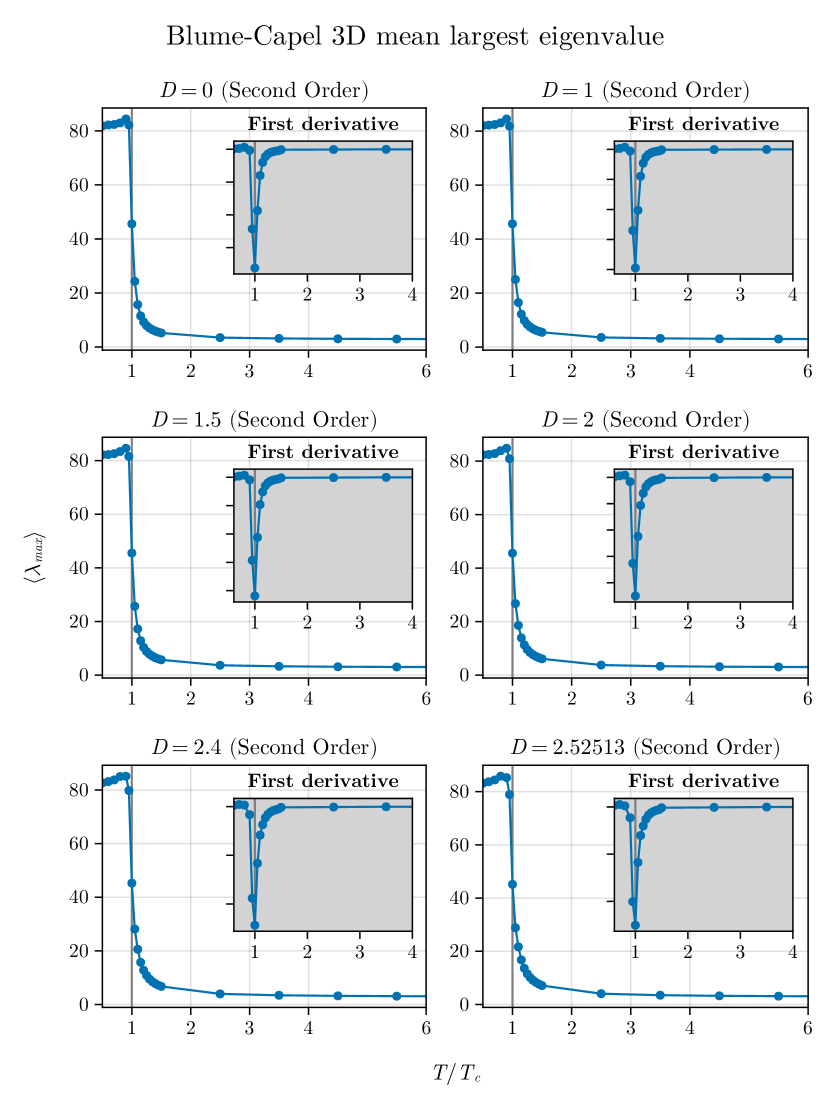
Thus, we can also observe that the averaged maximum eigenvalue responds to the criticality of the system for the different critical points studied here for the BC model regardless of dimensionality. This adds an additional parameter to our framework to identify criticality in spin systems that can be tested in other models. In the next section, we will conclude our analysis by showing that the method that uses short times (in this current contribution and in the previous ones [37, 36] we used steps) also works with small systems. Up to now, we have used in two dimensions. We will demonstrate that this number can be further reduced.
III.4 Finite Size Scaling: Exploring Small Systems with Short Time Scales
The method’s efficiency in saving computer time through the use of short time scales presents a particularly intriguing prospect. For instance, in this current study, we employed steps. Therefore, to highlight the versatility of our method, we will explore another aspect: the system size. We have investigated this aspect in both two and three dimensions, demonstrating that systems can be studied effectively with even smaller sizes, yielding good estimates.
We deliberately selected only the case of without loss of generality. The average eigenvalue is plotted as a function of for different sizes of the two-dimensional BC system (refer to Figure 13). Initially, we explore sizes ranging from to , and subsequently extend to , , , , , , and .
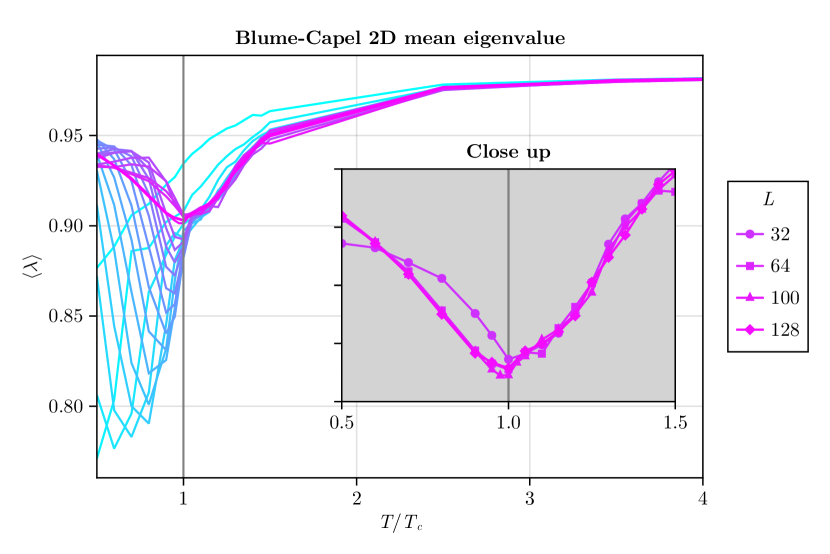
We can observe an influence of the system size, where for small systems, a minimum at the exact is found. The inset plot illustrates that for , the minimum at coincides. With , there is excellent agreement.
For the three dimensional model, our investigation yields similar results. Encouragingly, we found consistent behavior, particularly noteworthy for , where a distinct trend emerges: the average eigenvalue reaches a minimum precisely at . This observation implies the feasibility of exploring intricate phenomena within compact systems. Thus, the potential for fruitful spectral analyses in modest-scale systems becomes increasingly evident.
As we wrap up this subsection, it’s remarkable to note that in addition to employing short-time evolution of magnetization ( steps), we can also leverage small systems to achieve robust results. Surprisingly, for in the two-dimensional BC model and in the three-dimensional BC model, our method accurately identifies the critical temperature of the model. This underscores the efficacy of the spectral method, highlighting its strength in pinpointing critical points.
Readers are encouraged to juxtapose our method with simpler MC simulations, considering its additional workload in terms of matrix diagonalization. However, it operates on low-dimensional matrices (with here – adjustable for further optimization). In comparison to time-dependent simulations, which may require, for instance, and a substantial number of runs to adequately sample quantities (with a minimum of runs for ferromagnetic initial states and over for disordered initial states where ), our method presents an intriguing alternative. It’s worth noting that capturing the thermodynamics of the model with such accuracy using a computationally "cheap" spectral method is not a trivial achievement.
Equilibrium MC simulations are plagued by the issue of critical slowing down, compounded by the use of larger lattices than those employed in our approach. While a thorough comparison between this spectral method and standard MC methods warrants attention, we must emphasize the compelling observation that the thermodynamics of the systems are remarkably well-reflected by this "spectral thermodynamics".
An avenue ripe for exploration is the investigation of long-range systems, which will undoubtedly command our focus in future applications, precisely due to the lack of requirement for large-scale systems.
IV Conclusions
In this study, we have extended a method originally developed in [36] to describe the spin-1 Ising model with anisotropy, known as the Blume-Capel model. This model exhibits a tricritical point in both two and three dimensions. Our method has proven effective in accurately capturing these critical points and illustrating the associated crossover phenomena.
Furthermore, we underscore the computational efficiency of our proposed method compared to similar approaches. By diagonalizing matrices of size , where is set to 100 in this work, we alleviate the computational burden. This stands in contrast to other spectral methods in the literature, which necessitate diagonalizing matrices of size , where represents the linear dimension of the system and its dimensionality. For instance, in a system with and , this would entail diagonalizing matrices of size for a significant number of runs, which is computationally intensive.
In summary, our findings demonstrate that spectral methods provide a promising avenue for characterizing the thermodynamics of spin systems exhibiting tricritical points and crossover phenomena, regardless of the system’s dimensionality. Notably, we achieved these results using very small systems and short time series, suggesting a means to bypass both critical slowing down and the necessity for extremely large systems often observed in standard MC simulations that do not involve the diagonalization of Wishart matrices.
While our proposal does not seek to directly compete with standard MC simulations, either in equilibrium or nonequilibrium settings, our results indicate that the method merits consideration for application in these contexts due to its efficiency and sensitivity.
V Appendix
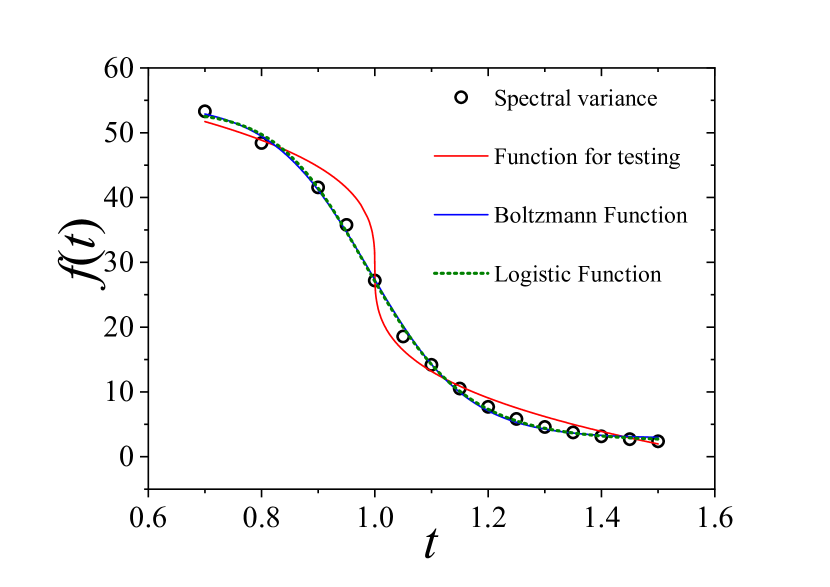
We observed that the inflection point appearing in the spectral variance serves as an excellent indicator of critical behavior when employing the method of constructing Wishart matrices. Clearly, within this framework, we can explore the nature of the inflection point under consideration. As a preliminary test, we opted for the simple case and plotted the spectral variance for various values of , including , as depicted in Figure 15. We fitted two suggestive functions to the data, beginning with the well-known logistic function:
and the second one, the Boltzmann function:
Both fits were conducted by initially fixing , as and represent normalization and fitting parameters, respectively. Thus, the fit essentially revolves around one parameter: . This observation arises from the fact that both functions can be expressed as:
where for the logistic function and for the Boltzmann function. We can observe a good visual fit, both with a coefficient of determination . For additional information regarding the fits presented in Figure 15, for the logistic function we obtained: , , and . Similarly, for the Boltzmann function, we obtained: , , and .
First, we would like to demonstrate that serves as an inflection point for both functions. In the first case, we have:
and it is certain that for this type of curve. Thus, for , , while for , , demonstrating that the Boltzmann function with has an inflection point at . Specifically, .
Similarly, for the logistic function, we have:
For , , and therefore , and for , , and . This shows that is also an inflection point. Again .
In the same Figure 15 we purposively presented an additional fit to a function:
We tested other powers except for , as it provokes interesting discussions among more skeptical readers, even though it does not visually fit well. The aim here is to demonstrate that even when we encounter an inflection point where the second derivative is not defined, as suggested by the plots presented in Figure 6, we encountered no issues. For the best fit, we obtained and for (fixed). Despite and , ensuring an inflection point even when:
This scenario is a basic calculus concept, yet it is always worth noting.
References
- [1] H. Eugene Stanley, Introduction to Phase Transitions and Critical Phenomena, Oxford Science Publications, (1987)
- [2] J-P Bouchaud, M. Potters, Theory of Financial Risk and Derivative Pricing, Cambridge University Press (2003)
- [3] C. Castellano, S. Fortunato, V. Loreto, Statistical physics of social dynamics, Rev. Mod. Phys 81, 591 (2009)
- [4] G. Szabo, G. Fath, Evolutionary games on graphs, Phys. Rep. 446, 97 (2007)
- [5] A.-L. Barabasi, Network Science, Cambridge University Press (2016)
- [6] H. K. Janssen, B. Schaub, B. Schmittmann, New universal short-time scaling behaviour of critical relaxation processes, Z. Phys. B: Condens. Matter 73, 539 (1989)
- [7] H. K. Janssen, K. Oerding, Non-equilibrium relaxation at a tricritical point, J. Phys. A: Math. Gen. 27, 715 (1994)
- [8] M. Henkel, M. Pleimling, Non-equilibrium Phase Transitions, Vol. 2: Ageing and Dynamical Scaling far from Equilibrium, Springer, Dordrecht (2010)
- [9] B. Zheng, Monte Carlo simulations of short-time critical dynamics, Int. J. Mod. Phys. B 12, 1419 (1998)
- [10] D. A. Huse, Remanent magnetization decay at the spin-glass critical point: A new dynamic critical exponent for nonequilibrium autocorrelations, Phys. Rev. B 40, 304 (1989)
- [11] E. V. Albano, M. A. Bab, G. Baglietto, R. A. Borzi, T. S. Grigera, E. S. Loscar, D. E. Rodriguez, M. L. R. Puzzo, G. P. Saracco, Study of phase transitions from short-time non-equilibrium behaviour, Rep. Prog. Phys. 74, 026501 (2011)
- [12] G. Grinstein, C. Jayaprakash, Y. He, Statistical mechanics of probabilistic cellular automata, Phys. Rev. Lett. 55, 2527 (1985)
- [13] T. Tome, M. J. de Oliveira, Short-time dynamics of critical nonequilibrium spin models, Phys. Rev. E 58, 4242 (1998)
- [14] T. Tome, M. de Oliveira, Stochastic Dynamics and Irreversibility, Springer (2014)
- [15] H. K. Janssen, On the nonequilibrium phase transition in reaction-diffusion systems with an absorbing stationary state, Z. Phys. B 42, 151 (1981)
- [16] P. Grassberger, The critical behaviour of two-dimensional self-avoiding random walks, Z. Phys. B 48, 255 (1982)
- [17] J. Marro, R. Dickman, Nonequilibrium Phase Transitions, Cambridge (1999)
- [18] H. Hinrichsen, Non-equilibrium critical phenomena and phase transitions into absorbing states, Adv. Phys. 49, 815 (2000)
- [19] R. da Silva, R. Dickman, J. R. Drugowich de Felicio, Critical behavior of nonequilibrium models in short-time Monte Carlo simulations, Phys. Rev. E 70, 067701 (2004)
- [20] H. K. Janssen, K. Oerding, Non-equilibrium relaxation at a tricritical point, J. Phys. A: Math. Gen. 27, 715 (1994)
- [21] R. da Silva, Numerical evidence of Janssen-Oerding’s prediction in a three-dimensional spin model far from equilibrium, Phys. Rev. E 105, 034114 (2022)
- [22] R. da Silva, Exploring the Similarities Between Mean-field and Short-range Relaxation Dynamics of Spin Models, Braz. J. Phys. 52, 128 (2022)
- [23] R. da Silva, N. A. Alves, and J. R. Drugowich de Felicio, Mixed initial conditions to estimate the dynamic critical exponent in short-time Monte Carlo simulation, Phys. Rev. E 66, 026130 (2002)
- [24] R. da Silva, H. A. Fernandes, J. R. Drugowich de Felicio, W. Figueiredo, Novel considerations about the non-equilibrium regime of the tricritical point in a metamagnetic model: Localization and tricritical exponents, Comp. Phys. Comm. 184, 2371 (2013)
- [25] E. P. Wigner, Characteristic Vectors of Bordered Matrices with Infinite Dimensions I, Ann. Math. 62, 548–564 (1955)
- [26] E. P. Wigner, Characteristic Vectors of Bordered Matrices with Infinite Dimensions II, Ann. Math. 65, 203–207 (1957)
- [27] E. P. Wigner, On the Distribution of the Roots of Certain Symmetric Matrices, Ann. Math. 67, 325–327 (1958)
- [28] M. L. Mehta, Random Matrices, Academic Press, Boston (1991)
- [29] F.J. Dyson, Statistical Theory of the Energy Levels of Complex Sytems I, J. Math. Phys. 3, 140–156 (1962)
- [30] F.J. Dyson, Statistical Theory of the Energy Levels of Complex Sytems II, J. Math. Phys. 3, 157–165 (1962)
- [31] F.J. Dyson, Statistical Theory of the Energy Levels of Complex Sytems III, J. Math. Phys. 3, 166–175 (1962)
- [32] J. Wishart, The generalised product moment distribution in samples from a normal multivariate population, Biometrika 20A, 32 (1928)
- [33] G. Livan, M. Novaes, P. Vivo, Introduction to Random Matrices, Theory and Practice, Springer (2018)
- [34] T. Vinayak, T. Prosen, B. Buca, T. H. Seligman, Spectral analysis of finite-time correlation matrices near equilibrium phase transitions, EPL 108, 20006 (2014)
- [35] S. Biswas, F. Leyvraz, P.M. Castillero, T.H. Seligman, Rich structure in the correlation matrix spectra in non-equilibrium steady states, Sci. Rep. 7 40506 (2017)
- [36] R. da Silva, Random matrices theory elucidates the nonequilibrium critical phenomena, Int. J. Mod. Phys. C, 2350061 1 (2023)
- [37] R. da Silva, H. C. M. Fernandes, E. Venites Filho, S. D. Prado, J. R. Drugowich de Felicio, Mean-field criticality explained by random matrices theory, Braz. J. Phys. 53, 80 (2023)
- [38] J.-Ch. Angles d’Auriac, J.-M. Maillard, Random matrix theory in lattice statistical mechanics, Physica A 321, 325 (2003)
- [39] R. B. Griffiths, Thermodynamics Near the Two-Fluid Critical Mixing Point in He3-He4, Phys. Rev. Lett. 24, 715 (1970)
- [40] M. Blume, V. J. Emery, R. B. Griffiths, Ising Model for the Transition and Phase Separation in He3-He4 Mixtures, Phys. Rev. A 4, 1071 (1971)
- [41] M. Blume, Theory of the First-Order Magnetic Phase Change in UO2, Phys. Rev. 141, 517 (1966)
- [42] H. Capel, On the possibility transitions of first-order in Ising systems with zero-field phase of triplet ions splitting, Physica 32, 966 (1966)
- [43] P. Butera, M. Pernici, The Blume-Capel model for spins S=1 and 3/2 in dimensions d=2 and 3, Physica A 507, 22–66 (2018)
- [44] P.D. Beale, Finite-size scaling study of the two-dimensional Blume-Capel model, Phys. Rev. B 33, 1717–1720 (1986)
- [45] M. Deserno, Tricriticality and the Blume-Capel model: A Monte Carlo study within the microcanonical ensemble, Phys. Rev. E 56, 5204–5210 (1997)
- [46] J.C. Xavier, F. C. Alcaraz, D. Pena Lara, J. A. Plascak, Critical behavior of the spin-3/2 Blume-Capel model in two dimensions, Phys. Rev. B 57, 11575 (1998)
- [47] M. Hasenbusch, Dynamic critical exponent of the three-dimensional Ising universality class: Monte Carlo simulations of the improved Blume-Capel model, Phys. Rev. E. 101, 022126 (2020)
- [48] V. A. Marcenko, L. A. Pastur, Distribution of Eigenvalues for Some Sets of Random Matrices, Math. USSR Sb. 1 457 (1967)
- [49] J. Baik, G. B. Arous, S. Pechet, Phase transition of the largest eigenvalue for nonnull complex sample covariance matrices, Ann. Probab. 33, 1643 (2005)
- [50] F. Benaych-Georges, A. Guionnet, M. Maida, Fluctuations of the extreme eigenvalues of finite rank deformations of random matrices, Electron. J. Probab. 16, 1621 (2011)
- [51] R. da Silva, S. D. Prado, Exploring Transition from Stability to Chaos through Random Matrices, Dynamics 3, 777-792 (2023)
- [52] R. da Silva, T. Tome, M. J. de Oliveira, Numerical exploration of the aging effects in spin systems, Phys. Lett. A 489, 129148 (2023)