A Computational Analysis of Lyric Similarity Perception
Abstract
In musical compositions that include vocals, lyrics significantly contribute to artistic expression. Consequently, previous studies have introduced the concept of a recommendation system that suggests lyrics similar to a user’s favorites or personalized preferences, aiding in the discovery of lyrics among millions of tracks. However, many of these systems do not fully consider human perceptions of lyric similarity, primarily due to limited research in this area. To bridge this gap, we conducted a comparative analysis of computational methods for modeling lyric similarity with human perception. Results indicated that computational models based on similarities between embeddings from pre-trained BERT-based models, the audio from which the lyrics are derived, and phonetic components are indicative of perceptual lyric similarity. This finding underscores the importance of semantic, stylistic, and phonetic similarities in human perception about lyric similarity. We anticipate that our findings will enhance the development of similarity-based lyric recommendation systems by offering pseudo-labels for neural network development and introducing objective evaluation metrics.
A Computational Analysis of Lyric Similarity Perception
Haven Kim Taketo Akama
1 Introduction
The popularization of music streaming services has expanded the use and distribution of music recommendation systems, which are instrumental in facilitating the discovery of music within vast music libraries, catering to diverse user preferences. While collaborative filtering (CF) remains a common method in various recommendation domains, music recommendation systems have largely shifted towards content-driven approaches by learning similarities in audio signals McFee et al. (2012); Bogdanov et al. (2013) and calculating the similarity between a user’s query and potential matches in the dataset Deldjoo et al. (2021); Pearce and Müllensiefen (2017). These approaches have necessitated consideration of aspects that influence music similarity perception Schedl et al. (2018), including ones that model human perception of similarities between two musical audio signals Berenzweig et al. (2004); Novello et al. (2011), which enriches our understanding of how people understand music and what they expect from music search systems Casey et al. (2008).
In musical tracks accompanied with vocal performances, however, lyrics often play a pivotal role in enhancing the appeal of the song as they express emotions that resonate with listeners by conveying messages Watanabe and Goto (2020). Consequently, there has been a growing interest in developing a lyric recommender system that suggests lyrics akin to a user’s favorites or custom choices. The earliest that we know was based on similarity between vectors that represent the inverse document frequency (IDF) of words Mahedero et al. (2005). Some systems employed unsupervised learning algorithms for clustering lyrics. These include models based on Latent Dirichlet Allocation (LDA) Sasaki et al. (2014); Tsukuda et al. (2017), the Doc2Vec, and the Self-Organizing Feature Maps (SOFMs) Patra et al. (2017).
Although promising, such systems lack the consideration as to what constitutes perceptual lyric similarity despite the suggestion of prior study that integrating a model of human perception and cognition into the algorithms could significantly mitigate the limitations inherent in purely feature-based algorithms Pampalk (2004). Moreover, considering that these recommender systems aim to suggest lyrics similar to the input in terms of perception, the gap in understanding what humans anticipate from music searches becomes a critical issue.
This oversight stems from a dearth of research in this specific area. Lyric similarity is a concept that lacks a clear definition, and to our knowledge, no scientific research has been conducted to pinpoint the factors influencing perceptual lyrical similarity. Moreover, due to the lack of attention in this domain, objective evaluation metrics have yet to be established. Consequently, the evaluation of previous systems has depended on subjective assessments Sasaki et al. (2014); Patra et al. (2017), which are time-consuming and costly, or on indirect measures like perplexity Tsukuda et al. (2017).
Notably, there is relatively little focus on computationally modeling perceptual lyric similarity. To address this, we compared six computational methods, including ones influenced by existing systems and our own novel approaches, against human perceptions of lyric similarity. This led us to investigate whether computational metrics accurately represent perceptual lyric similarity. Finally, we identified three computational metrics that show statistically significant correlations with human perception: one based on pre-trained language models, one on the music tracks from which the lyrics are derived, and one on phonetic characteristics such as the degree of phoneme repetition and the choice of phonemes. We expect these findings to be beneficial for building systems that suggest similar lyrics to input by generating pseudo-labels for neural model development or evaluating similar-lyric recommendation systems.
The subsequent section will specify the selection and details of these six computational models (Section 2). Following that, we will outline the design of the human perception survey we conducted (Section 3). The results of this survey will be presented and analyzed in the next section (Section 4). The last section will conclude the paper, highlighting insights gained from our human perception experiments and the potential applications of our findings(Section 5).
2 Computational Modeling of Lyric Similarity
In this section, we introduce several factors that have been suggested as contributing to characterizing lyrics. We then describe computational models used to calculate the values of similarities in these factors, which will be compared with human perceptions of lyric similarity along with motivation from previous studies for selecting each model. Python implementations of these metrics are provided as supplementary materials and will be released publicly upon acceptance.
2.1 Topic
The concept of topic is pivotal in studies on lyrics, as suggested by models for on lyrics generation based on topic transitions Watanabe et al. (2014, 2017) and automatic topic detection Choi and Downie (2018). Particularly, an earlier study postulated that thematic content significantly influences lyric similarity, leading to the development of a system rooted in a model initially devised for topic modeling Sasaki et al. (2014); Tsukuda et al. (2017). This suggests a potential impact of topic on the perceived similarity of lyrics. Consequently, our experiment employs a computational model to gauge lyric similarity from this perspective.
Topic Similarity (): Latent Dirichlet Allocation (LDA) Blei et al. (2003), an unsupervised machine learning algorithm designed for topic modeling, has been applied to a system that automatically recommends to lyrics akin to a user’s input Sasaki et al. (2014); Tsukuda et al. (2017). This algorithm operates on the premise that topics can be defined by their word usage, learning how topics are distributed within one unit of lyrics and how words are distributed across a given topic. Following this, we trained a LDA model to categorize lyric topics into 50 classes. In order to numerically represent topic similarity between pairs of lyrics, we followed the convention of calculating cosine similarity between the LDA vectors Towne et al. (2016). When the predicted topic probabilities for a given lyric set is represented as a vector , where is the probability of being classified under the -th topic, we define the topic similarity () between two lyric sets and , as a cosine similarity between and , as follows.
| (1) |
2.2 Meaning
Semantic factors play a crucial role in determining the perceptual similarity of textual content. In a preliminary study, we asked four participants to assess lyric similarity and to explain their criteria; the meaning was the most frequently mentioned factor. This indicates a substantial effect of meaning on how people perceive lyric similarity. Therefore, our experiment incorporates a computational model to automatically assess lyric similarity based on semantics.
Semantic Similarity (): A popular approach to obtain numerical representation of semantics is to utilize embeddings of a pre-trained BERT Devlin et al. (2019)-based language model. For our experiments, we used a pre-trained Sentence BERT model Reimers and Gurevych (2019) 111We used all-MiniLM-L6-v2 Wang et al. (2020), where we call the 384-dimensional contextual embeddings of lyrics , . We define the semantic similarity () as the cosine similarity between embeddings, as below.
| (2) |
2.3 Mood
Mood is a widely studied concept in studies on lyrics, with mood classification and analysis based on lyrics Laurier et al. (2008); Hu et al. (2009) standing out as prominent topics in the field of music information retrieval, and a prior study even suggested that lyrics are more effective for classifying music moods than audio Hu and Downie (2010). Furthermore, a recent lyric recommendation system relies on emotion prompts, classified into four: happy, angry, relaxed, and sad Revathy et al. (2023). This suggests the potential role of mood in determining lyric similarity. In response, we have incorporated a computational model that accounts for this aspect.
Mood Difference (): To numerically represent mood for lyrics, we utilized the Deezer Mood Detection Dataset Delbouys et al. (2018), a dataset characterizes a musical track with a two-element vector, , representing its valence and arousal levels. Here, high valence with high arousal corresponds to happiness, low valence with high arousal indicates anger, low valence and low arousal denotes sadness, and high valence and low arousal represents relaxation. To compare two sets of lyrics from track and from in terms of mood, we calculated the euclidean distance between these two-element vectors and . This distance is defined as the mood difference () between and .
| (3) |
2.4 Style
Style, often considered to be defined by an artist, is an ambiguous but crucial factor in characterizing lyrics. In response, previous research has delved into style classification based on lyrics Li and Ogihara (2004) and lyric generation models that emulate the style of a particular artist Barbieri et al. (2012). This indicates that style similarity could play a significant role in the perceived similarity of lyrics. Consequently, we have included a computational model in our study to address this aspect.
Audio Similarity (): Musical characteristics affects a song’s lyrical style Mayer et al. (2008). For example, lyrics within the same genre tend to exhibit stylistic similarities. Therefore, we used audio features in order to represent similarity between lyrics. In order to obtain features for lyrics , we obtained the 200-sized embedding for the corresponding musical track , generated by the penultimate layer of a CNN-based music feature extractor Pons and Serra (2019). The audio similarity () between two sets of lyrics and , each for musical tracks and , is defined as defined as a cosine similarity between two corresponding embeddings, and .
| (4) |
2.5 Sound
In our study, we also concentrated on the sound, which comes from the phonetic features of lyrics, rather than their meaning. Although the concept of sound similarity is somewhat nebulous, certain studies have investigated it by focusing on phonetic features, such as rhyme, for musical genre classification Mayer et al. (2008). Despite the concept being relatively underexplored in lyrics research, we identified two computational models from previous studies that address this aspect within the realms of poetry and lyric translation evaluation. The two computational models employed in our experiments are based on these studies.
Phonetic Similarity (): One of our computational models was inspired by a previous study that assessed sound similarity in poetry Parrish (2017). This study initially decomposed 113,852 words into phonemes (e.g., ring into [R, IH, NG]) and represented each phoneme with pre-defined corresponding features (e.g., [R, IH, NG] with [{alv, apr}, {fnt,smh,unr,vwl}, {nas, vel}]). Consequently, two pseudo-features were added at the beginning and end of each feature list, and pairs of consecutive features were formed. (e.g., ({beg}×{alv, apr}) ({alv, apr}×{fnt,smh,unr,vwl}) ({fnt,smh,unr,vwl}×{nas, vel}) ({nas, vel}×{end})). The distribution of these feature pairs was then represented as a vector, and PCA analysis Abdi and Williams (2010) was applied to reduce the dimensionality of these vectors to 50. Adopting this methodology, we generated 50-dimensional phonetic vectors using lyrics, rather than individual words. For two sets of lyrics , , with their corresponding phonetic vectors and , we defined the cosine similarity between and as the phonetic similarity between and (), consistent with the methodology of the prior study, as follows.
| (5) |
Musical Difference (): A previous study on lyric translation suggested that a set of lyrics’ musicality is influenced by two factors: phoneme repetition and phoneme choice Kim et al. (2023). To quantify the phoneme repetition degree, they decomposed the lyrics into phonetic components and grouped them into bi-grams, and divided the unique bi-gram counts by the total bi-gram counts. This value, called , indicates higher repetition with a lower value, and vice versa. The difference in repetition between two sets of lyrics, and , is determined by comparing and . To assess the similarity in phoneme usage between and , they calculated the of the combined lyrics , where lower values imply greater shared phonemes. The musical difference between two sets of lyrics was defined as the sum of the differences in repetition degrees () and the of the concatenated lyrics (). We adopted this approach to calculate the musical difference () between and .
| (6) |
3 Experimental Setup
3.1 Data Collection
We collected lyrics along with their metadata from the Deezer Mood Detection Dataset Delbouys et al. (2018) and the Million Song Dataset Bertin-Mahieux et al. (2011). Additionally, we obtained 30 seconds audio previews that are matched against metadata from the Million Song Dataset. This comprehensive collection yielded a total of 17,865 tracks. Each song, on average, contained 7.07 lyrical sections, and we ended up with 126,336 total sets of lyrics.
3.2 Grouping Lyric Pairs
The number of feasible lyric pair combinations from the 126,336 lyric sets, excluding pairs derived from the same song, was 7,979,812,331. To observe the statistical tendency of these pairs, we randomly sampled 100,000 pairs and evaluated them using six different metrics that were introduced in the previous section.
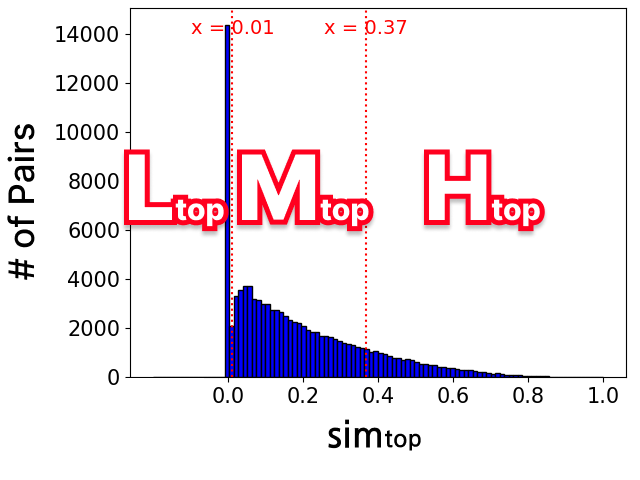
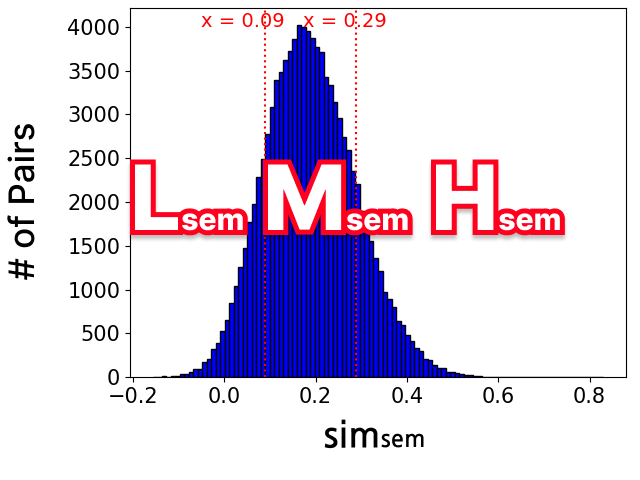
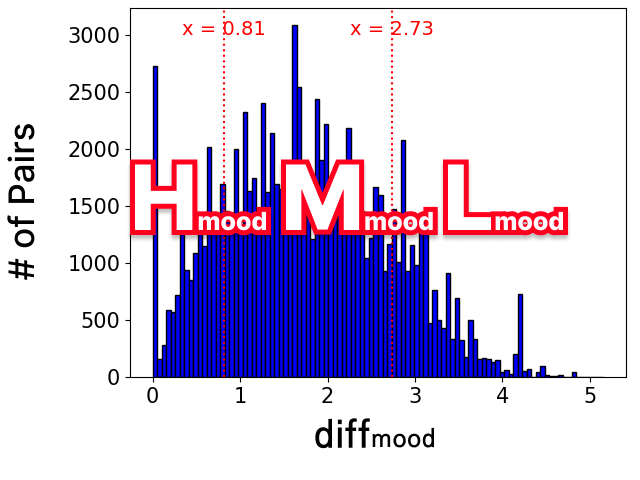
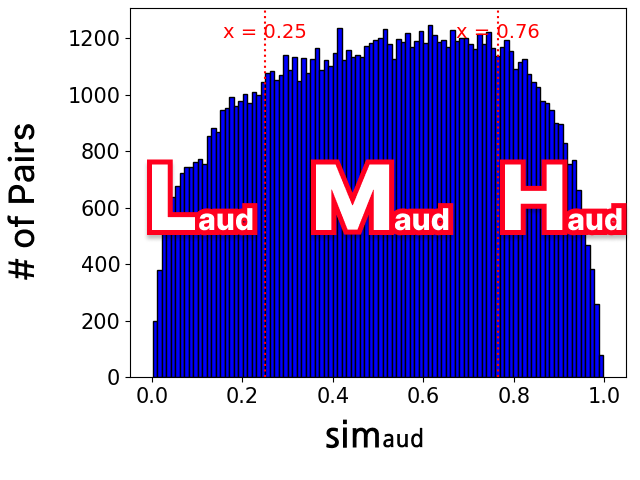
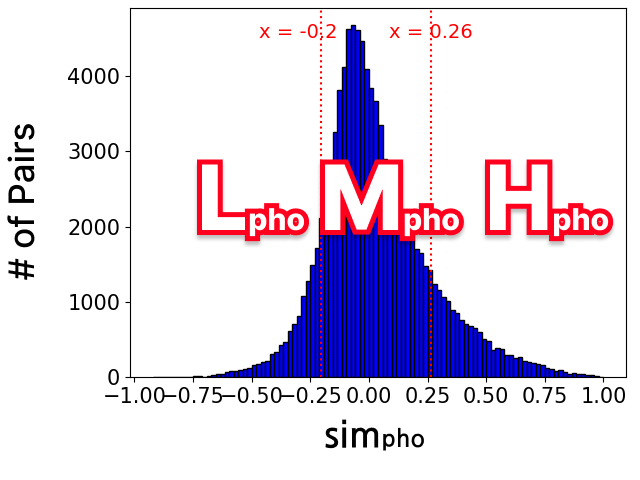
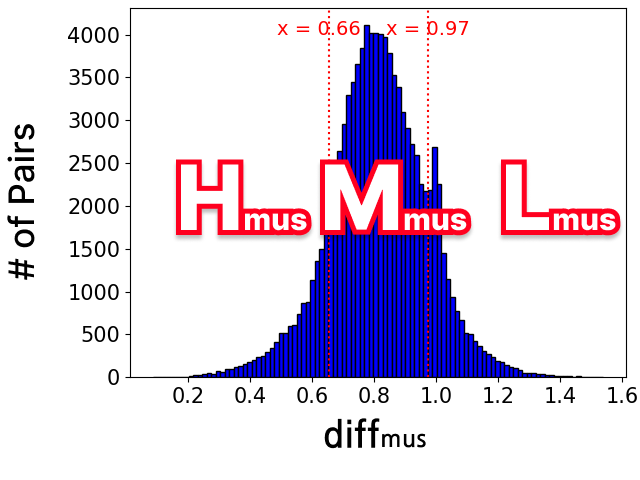
Our primary goal was to categorize lyric pairs into three distinct groups-high, medium, and low similarity (H, M, L)-for each metric. Due to the unique range and distribution characteristics of the six metrics, we avoided uniform cutoffs for categorization. Instead, we defined the “medium” category (M) as pairs whose scores fell within one standard deviation from the mean. Pairs with scores beyond this range were categorized as either “high” (H) or “low” similarity (L) . For metrics indicating similarity, (, , , ), pairs with higher scores were assigned to the “high” similarity group (, , , and ) and those with lower scores were to the “low” group (, , , and ). Conversely, for metrics indicating differences ( and ), pairs with higher scores were categorized as having “low” similarity ( and ), and vice versa. The distribution and categorization cutoffs are detailed in Figure 2.
3.3 Variable Control
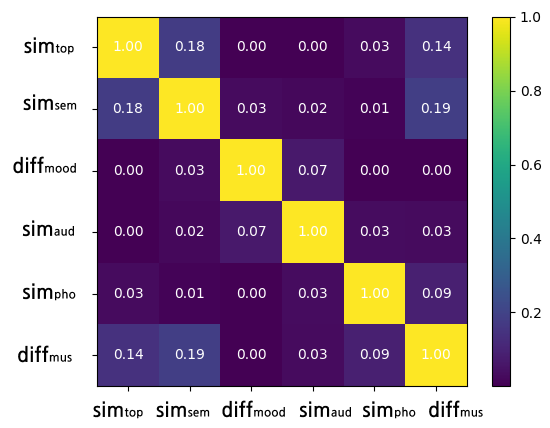
Using the same sample of 100,000 lyrics, we assessed the absolute Pearson correlation between metrics, identifying four mildly correlated pairs with the correlation larger than or equal to 0.1-{, }, {, }, {, }, and , }. The mild correlation between and (0.18) is expected, as topics identified by an LDA model often reflect semantic coherence. Their mild correlations with (0.14 and 0.19, respectively) are attributed to the tendency that shared words significantly affect these metrics by resulting in higher and and lower . On the other hand, the correlation between and appears to be attributed to their shared focus on phonetic aspects.
Despite these correlations, no pair exceeded a 0.20 correlation, indicating relative independence among metrics. Therefore, we were able to maintain consistency in the other five metrics when assessing the impact of a single metric, thereby minimizing external variable influence. Given the limited array of lyric pairs, finding sets with identical scores across five metrics while differing in one was nearly impossible. We instead selected pairs that share closely matched scores across five metrics. To determine “closeness”, we used the concept of item similarity, defined as one minus the ratio of their differences to the maximum possible difference Bansal and Jain (2020). Although 0.8 is suggested in previous literature, we employed a more stringent threshold of 0.99 for each metric, to ensure higher precision in our experiment. For instance, if the topic similarity score () between a reference lyric set () and two comparison sets ( and ) are 0.67 and 0.68 respectively, these are considered “close” in terms of for our experimental purposes, given that the maximum score is 1 and the minimum is 0.
3.4 Survey
Each survey question was designed to evaluate the impact of one specific metric. Participants were presented with a set of reference lyrics and three comparison sets, corresponding to high, medium, and low levels of similarity (H, M, L) as measured by the selected metric. To ensure consistency, the three comparison sets achieved closeness across the other five metrics. For instance, in questions assessing topic similarity, three comparison sets were selected to maintain over 99% closeness in terms of semantic similarity, mood difference, audio similarity, phonetic similarity, and musical difference with reference lyris while each having high, medium, and low levels of topic similarity with reference.
Among various methods employed in perceptual experiments to evaluate similarity, we chose ranking, instead of rating, as it has proven its simplicity and robustness in various domains Burton and Nerlove (1976); Novello et al. (2011); participants, at each question, were asked to identify which comparison sets most closely resembled the reference lyrics and which were the most dissimilar. The survey comprised six questions for each metric, each with different reference lyrics from a variety of genres. These genres, including rock, pop, country, hip-hop, electronic, and R&B, were selected based on prior studies that discuss genre diversity in lyrics Tee et al. (2022). This resulted in a total of 36 unique question sets (6 genres × 6 metrics). The orders of both the questions and the comparison lyrics within each question were randomized. Our survey involve four lyricists proficient in English and their average age are 32.25 years.
4 Results
In this section, we examine the survey results presented in Figure 3 and Table 1. Figure 3 illustrates the statistical comparisons among three similarity groups (H, M, L) in terms of mean ranking scores and their 95% confidence intervals. Table 1 provides the Pearson correlations between the six metrics and the ranking scores, along with their p-scores. A ranking score of 1 implies the highest perceptual similarity, while a score of 3 suggests the lowest.
| Correlation | -value | |
|---|---|---|
| Topic Similarity () | -0.13 | 0.56 |
| Semantic Similarity () | -0.65 | 0.00 |
| Mood Difference () | 0.06 | 0.79 |
| Audio Similarity () | -0.48 | 0.03 |
| Phonetic Similarity () | -0.41 | 0.09 |
| Musical Difference () | 0.74 | 0.00 |
Topic Similarity () : We observed that the group with the lowest topic similarity () exhibited the lowest perceptual similarity. However, the high group () did not demonstrate better perceptual similarity compared to the medium group (); the latter even exhibited marginally higher mean perceptual similarity. This finding suggests potential limitations in lyric retrieval systems that rely soley on LDA models, given that they are suppoed to recommend highly similar lyrics. The Pearson correlation of -0.13 and a -value of 0.56 further indicate a non-significant statistical relationship between this metric and perceptual similarity.
Semantic Similarity () : Conversely, a significant correlation was found between semantic similarity () and perceptual similarity, evidenced by the correlation coefficient of -0.65 and a near-zero -value, showing the robustness of this relationship. The group with high scores () showed markedly better perceptual similarity compared to the medium () and low groups (), which had similar average rankings. This finding further suggests the importance of value in order to achieve high perceptual lyric similarity.
Mood Difference () : Contrary to expectations, mood did not exhibit a statistically significant correlation with perceptual similarity, as indicated by a correlation of 0.061, a -value of 0.79, and the lack of differences across the high, medium, and low similarity groups (, , ) in mean ranking values. This suggests that a mood-based similar-lyric recommendation system may not align well with human perceptual judgments.
As an example, we take one question from the survey with reference lyrics that represents a sad mood with valence and arousal levels of -1.94 and -0.66, respectively, as annotated in the Deezer Mood Detection Dataset Delbouys et al. (2018).
[
indentfirst=false,
leftmargin=rightmargin=]
Reference lyrics: 222
Songwriters: Michael Dulaney, Neil Thrasher
Seventeen years old
She was out with her friends
They started drinking at some party
Until she was three sheets to the wind
Her momma always told her she could call no matter what
She was crying on the front steps
When her mom showed up
Participants compared the reference lyrics with two sets of lyrics: the first set, Lyrics from , exhibits high mood similarity with them, reflecting sadness by matching the reference lyrics in both valence and arousal levels. The second set, Lyrics from , demonstrates low mood similarity, representing happiness with distinct valence and arousal levels of 1.54 and 1.70, respectively.
[
indentfirst=false,
leftmargin=rightmargin=]
Lyrics from : 333
Songwriters: Mick Jagger, Keith Richards
And you know who’s the 2000 man
And your kids they just won’t understand you at all
Lyrics from : 444
Songwriter: Rhett Miller
Skin all over you
I’m a worrier it’s true
I came over to cushion your breakables
Breathe in you are stronger
You don’t have to wonder
You know my conviction’s unshakable
Although lyrics from share the same arousal and valence values as the reference lyrics, participants did not perceive them to be similar. In fact, three out of four participants found lyrics from —which significantly differs in mood levels—to be more similar to the reference lyrics.
Audio Similarity () : Rather, our findings suggest that humans tend to focus on stylistic elements of lyrics, which are often determined by musical features (e.g., genre), as shown by the moderate correlation of -0.48 between audio similarity () and perceptual similarity (-value = 0.03). This relationship is further shown in the distinct perceptual similarity rankings among the , , and groups.
Phonetic Similarity () : The relationship between phonetic similarity () and perceptual similarity showed a moderate correlation with a correlation efficient of -0.41, with the high group () achieving the highest perceptual similarity. However, a -value of 0.09 suggests unreliability in this metric.
Musical Difference () : The musical difference metric (), another sound-related measure, demonstrated a more stable correlation (0.743) with perceptual similarity (-value = 0.00). Notably, small perceptual difference was observed between the high and medium similarity groups ( and ), yet a marked decrease in perceptual similarity was apparent in the low similarity group (). This suggests a relative insensitivity of human perception to small values, but a heightened sensitivity to larger differences.
5 Conclusions and Future Work
In this study, we evaluated six computational models that quantify lyric similarity, including both ones influenced by prior studies and novel approaches proposed by us, against human perception. Our results reveal that three metrics—semantic similarity (), audio similarity (), and musical difference ()—demonstrate statistically significant correlations with human perceptual assessments. The relatively low correlation among these metrics (less than 0.2) suggests that lyric similarity is a multi-dimensional concept. Notably, while semantic, stylistic, and sound aspects significantly influence perceptual lyric similarity, as indicated by the correlations with , , and , respectively, mood did not emerge as a significant factor. This was evidenced by the negligible correlation of 0.06 between perceptual similarity and mood difference (). Moreover, we showed that while unsupervised algorithms aiming to capture thematic () or phonetic coherence () showed some correlations with human perception, if failed to prove robustness and reliability.
We expect that our exploration of the alignment between various computational models and human perception regarding lyric similarity will catalyze further research in this area. Potential applications of three computational models, which have demonstrated correlations with human perception, include the development of basic lyric recommendation algorithms based on a simple calculation, the generation of pseudo-labels for neural network development, and the automatic evaluation of similarity-based lyric recommendation systems.
References
- Abdi and Williams (2010) Hervé Abdi and Lynne J Williams. 2010. Principal component analysis. Wiley interdisciplinary reviews: computational statistics, 2(4):433–459.
- Bansal and Jain (2020) Kriti Bansal and Vinod Jain. 2020. Performance analysis of collaborative filtering based recommendation system on similarity threshold. In 2020 Fourth International Conference on Computing Methodologies and Communication (ICCMC), pages 442–448. IEEE.
- Barbieri et al. (2012) Gabriele Barbieri, François Pachet, Pierre Roy, and Mirko Degli Esposti. 2012. Markov constraints for generating lyrics with style. In Ecai, volume 242, pages 115–120.
- Berenzweig et al. (2004) Adam Berenzweig, Beth Logan, Daniel PW Ellis, and Brian Whitman. 2004. A large-scale evaluation of acoustic and subjective music-similarity measures. Computer Music Journal, pages 63–76.
- Bertin-Mahieux et al. (2011) Thierry Bertin-Mahieux, Daniel PW Ellis, Brian Whitman, and Paul Lamere. 2011. The million song dataset.
- Blei et al. (2003) David M Blei, Andrew Y Ng, and Michael I Jordan. 2003. Latent dirichlet allocation. Journal of machine Learning research, 3(Jan):993–1022.
- Bogdanov et al. (2013) Dmitry Bogdanov et al. 2013. From music similarity to music recommendation: Computational approaches based on audio features and metadata.
- Burton and Nerlove (1976) Michael L Burton and Sara B Nerlove. 1976. Balanced designs for triads tests: Two examples from english. Social Science Research, 5(3):247–267.
- Casey et al. (2008) Michael A Casey, Remco Veltkamp, Masataka Goto, Marc Leman, Christophe Rhodes, and Malcolm Slaney. 2008. Content-based music information retrieval: Current directions and future challenges. Proceedings of the IEEE, 96(4):668–696.
- Choi and Downie (2018) Kahyun Choi and J Stephen Downie. 2018. Exploratory investigation of word embedding in song lyric topic classification: promising preliminary results. In Proceedings of the 18th ACM/IEEE on Joint Conference on Digital Libraries, pages 327–328.
- Delbouys et al. (2018) Rémi Delbouys, Romain Hennequin, Francesco Piccoli, Jimena Royo-Letelier, and Manuel Moussallam. 2018. Music mood detection based on audio and lyrics with deep neural net. arXiv preprint arXiv:1809.07276.
- Deldjoo et al. (2021) Yashar Deldjoo, Markus Schedl, and Peter Knees. 2021. Content-driven music recommendation: Evolution, state of the art, and challenges. arXiv preprint arXiv:2107.11803.
- Devlin et al. (2019) Jacob Devlin, Ming-Wei Chang, Kenton Lee, and Kristina Toutanova. 2019. BERT: Pre-training of deep bidirectional transformers for language understanding. In Proceedings of the 2019 Conference of the North American Chapter of the Association for Computational Linguistics: Human Language Technologies (NAACL-HLT), pages 4171–4186.
- Hu and Downie (2010) Xiao Hu and J Stephen Downie. 2010. When lyrics outperform audio for music mood classification: A feature analysis. In Ismir, pages 619–624.
- Hu et al. (2009) Xiao Hu, J Stephen Downie, and Andreas F Ehmann. 2009. Lyric text mining in music mood classification. American music, 183(5,049):2–209.
- Kim et al. (2023) Haven Kim, Kento Watanabe, Masataka Goto, and Juhan Nam. 2023. A computational framework for singable lyric translation. In Proceedings of the 24th International Society for Music Information Retrieval (ISMIR).
- Laurier et al. (2008) Cyril Laurier, Jens Grivolla, and Perfecto Herrera. 2008. Multimodal music mood classification using audio and lyrics. In 2008 seventh international conference on machine learning and applications, pages 688–693. IEEE.
- Li and Ogihara (2004) Tao Li and Mitsunori Ogihara. 2004. Music artist style identification by semi-supervised learning from both lyrics and content. In Proceedings of the 12th annual ACM international conference on Multimedia, pages 364–367.
- Mahedero et al. (2005) Jose PG Mahedero, Álvaro MartÍnez, Pedro Cano, Markus Koppenberger, and Fabien Gouyon. 2005. Natural language processing of lyrics. In Proceedings of the 13th annual ACM international conference on Multimedia, pages 475–478.
- Mayer et al. (2008) Rudolf Mayer, Robert Neumayer, and Andreas Rauber. 2008. Rhyme and style features for musical genre classification by song lyrics. In Ismir, pages 337–342.
- McFee et al. (2012) Brian McFee, Luke Barrington, and Gert Lanckriet. 2012. Learning content similarity for music recommendation. IEEE Transactions on Audio, Speech, and Language Processing, 20(8):2207–2218.
- Novello et al. (2011) Alberto Novello, Martin MF McKinney, and Armin Kohlrausch. 2011. Perceptual evaluation of inter-song similarity in western popular music. Journal of New Music Research, 40(1):1–26.
- Pampalk (2004) Elias Pampalk. 2004. A matlab toolbox to compute music similarity from audio. In ISMIR.
- Parrish (2017) Allison Parrish. 2017. Poetic sound similarity vectors using phonetic features. In Proceedings of the AAAI Conference on Artificial Intelligence and Interactive Digital Entertainment, volume 13, pages 99–106.
- Patra et al. (2017) Braja Gopal Patra, Dipankar Das, and Sivaji Bandyopadhyay. 2017. Retrieving similar lyrics for music recommendation system. In Proceedings of the 14th International Conference on Natural Language Processing (ICON-2017), pages 290–297.
- Pearce and Müllensiefen (2017) Marcus Pearce and Daniel Müllensiefen. 2017. Compression-based modelling of musical similarity perception. Journal of New Music Research, 46(2):135–155.
- Pons and Serra (2019) Jordi Pons and Xavier Serra. 2019. musicnn: Pre-trained convolutional neural networks for music audio tagging. arXiv preprint arXiv:1909.06654.
- Reimers and Gurevych (2019) Nils Reimers and Iryna Gurevych. 2019. Sentence-BERT: Sentence embeddings using Siamese BERT-networks. In Proceedings of the 2019 Conference on Empirical Methods in Natural Language Processing and the 9th International Joint Conference on Natural Language Processing (EMNLP-IJCNLP), pages 3982–3992.
- Revathy et al. (2023) VR Revathy, Anitha S Pillai, and Fatemah Daneshfar. 2023. Lyemobert: Classification of lyrics’ emotion and recommendation using a pre-trained model. Procedia Computer Science, 218:1196–1208.
- Sasaki et al. (2014) Shoto Sasaki, Kazuyoshi Yoshii, Tomoyasu Nakano, Masataka Goto, and Shigeo Morishima. 2014. Lyricsradar: A lyrics retrieval system based on latent topics of lyrics. In Ismir, pages 585–590.
- Schedl et al. (2018) Markus Schedl, Hamed Zamani, Ching-Wei Chen, Yashar Deldjoo, and Mehdi Elahi. 2018. Current challenges and visions in music recommender systems research. International Journal of Multimedia Information Retrieval, 7:95–116.
- Tee et al. (2022) Tze Huat Tee, Belicia Qiao Bei Yeap, Keng Hoon Gan, and Tien Ping Tan. 2022. Learning to automatically generating genre-specific song lyrics: A comparative study. In Iberoamerican Knowledge Graphs and Semantic Web Conference, pages 62–75. Springer.
- Towne et al. (2016) W Ben Towne, Carolyn P Rosé, and James D Herbsleb. 2016. Measuring similarity similarly: Lda and human perception. ACM Transactions on Intelligent Systems and Technology (TIST), 8(1):1–28.
- Tsukuda et al. (2017) Kosetsu Tsukuda, Keisuke Ishida, and Masataka Goto. 2017. Lyric jumper: A lyrics-based music exploratory web service by modeling lyrics generative process. In ISMIR, pages 544–551.
- Wang et al. (2020) Wenhui Wang, Furu Wei, Li Dong, Hangbo Bao, Nan Yang, and Ming Zhou. 2020. MiniLM: Deep self-attention distillation for task-agnostic compression of pre-trained transformers. Advances in Neural Information Processing Systems (NeurIPS), 33:5776–5788.
- Watanabe and Goto (2020) Kento Watanabe and Masataka Goto. 2020. Lyrics information processing: Analysis, generation, and applications. In Proceedings of the 1st Workshop on NLP for Music and Audio (NLP4MusA), pages 6–12, Online. Association for Computational Linguistics.
- Watanabe et al. (2014) Kento Watanabe, Yuichiroh Matsubayashi, Kentaro Inui, and Masataka Goto. 2014. Modeling structural topic transitions for automatic lyrics generation. In Proceedings of The 28th Pacific Asia Conference on Language, Information and Computation, pages 422–431. Waseda University.
- Watanabe et al. (2017) Kento Watanabe, Yuichiroh Matsubayashi, Kentaro Inui, Tomoyasu Nakano, Satoru Fukayama, and Masataka Goto. 2017. Lyrisys: An interactive support system for writing lyrics based on topic transition. In Proceedings of the 22nd international conference on intelligent user interfaces, pages 559–563.