0 \vgtccategoryResearch \vgtcpapertypeTheory/Model \authorfooter Md Naimul Hoque and Sungbok Shin are with University of Maryland, College Park in College Park, MD, USA. E-mail: {nhoque, sbshin90}@umd.edu. Niklas Elmqvist is with Aarhus University in Aarhus, Denmark. E-mail: elm@cs.au.dk. \shortauthortitleVisualization for HCAI Tools
Harder, Better, Faster, Stronger: Interactive Visualization for Human-Centered AI Tools
Abstract
Human-centered AI (HCAI), rather than replacing the human, puts the human user in the driver’s seat of so-called human-centered AI-infused tools (HCAI tools): interactive software tools that amplify, augment, empower, and enhance human performance using AI models; often novel generative or foundation AI ones. In this paper, we discuss how interactive visualization can be a key enabling technology for creating such human-centered AI tools. Visualization has already been shown to be a fundamental component in explainable AI models, and coupling this with data-driven, semantic, and unified interaction feedback loops will enable a human-centered approach to integrating AI models in the loop with human users. We present several examples of our past and current work on such HCAI tools, including for creative writing, temporal prediction, and user experience analysis. We then draw parallels between these tools to suggest common themes on how interactive visualization can support the design of future HCAI tools.
keywords:
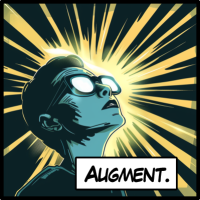
HCAI tools, supertools, explainable AI, visualization, FATE, human agency, ownership.HCAI tool capabilities. Overview of HCAI tool capabilities identified by Shneiderman [88, 89]: amplify (increasing or strengthening, such as through a megaphone), augment (adding new abilities, such as eyeglasses improving the wearer’s vision), empower (making tasks previously impossible to be possible, such as pushing a large boulder uphill), and enhance (improving the quality of an existing ability, such as a craftsman polishing an artifact). Images by MidJourney (v6).


1 Introduction
Despite tremendous advances in artificial intelligence (AI) and machine learning (ML) research in the last few years, important voices in the field are increasingly being raised in support of a more humane approach to AI that places human values and agency at the forefront: so-called human-centered AI (HCAI). For example, in a 2018 op-ed in the New York Times, leading Stanford AI researcher Fei-Fei Li called for an AI that is “good for people” and that “enhances” rather than “replaces” us [63]. That same year, UC Berkeley professor and AI expert Michael Jordan emphasized the need for “well-thought out interactions of humans and computers” and called for a “new discipline” to study this interaction111That discipline obviously exists: human-computer interaction (HCI). [54]. More recently, Ben Shneiderman, a professor emeritus at University of Maryland, published a book called Human-Centered AI in 2022 that proposed a new two-dimensional design space that incorporates both human agency and computer automation. Shneiderman further laid out a new research agenda for HCAI tools or what he calls AI-infused supertools (Figure Harder, Better, Faster, Stronger: Interactive Visualization for Human-Centered AI Tools) that “enable people to see, think, create, and act in extraordinary ways, by combining potent user experiences with embedded AI support services.” However, while Shneiderman and many others have pointed to existing such HCAI tools and suggest many other future ones, there is still no clear definition or generative mechanism for how to build such tools.
In this paper, we propose interactive visualization—visual representations of data to aid cognition [14]—as a key enabling technology for building HCAI software tools [3, 35]. Heer [37] emphasized the need for a “shared representation” as a fundamental requirement in balancing agency and automation in HCAI systems; we think that visualization can be a particularly effective such representation that provides insight into the complex and large-scale datasets managed by current AI models. Furthermore, interactive visualization also supports the requirements laid out in Shneiderman’s “Prometheus Principles” [88] for HCAI systems, including consistent interface, continuous visual display, informative feedback, progress indicators, completion reports, and rapid, incremental, and reversible actions. Finally, visualization has already seen extensive use in mixed-initiative interaction tools [46] that combine human and AI efforts. We call this overall approach visualization-enabled HCAI tools.
To validate our approach, we begin by giving a brief background of the sometimes diverging, sometimes converging fields of AI (artificial intelligence) and IA (intelligence augmentation). We then derive a definition of HCAI tools, their capabilities, and the human concerns they encompass. We show how important design characteristics of visualization can address these concerns. We go on to review four examplars of visualization-enabled AI tools; nonanthropomorphic tools designed to facilitate users harnessing an underlying AI model through a graphical interface incorporating visual representations of data. We use these examples to extract design guidelines for how to construct visual representations in support of HCAI principles. Finally, we close the paper with a research vision for how visualization can become a powerful medium for AI—an HCAI lingua franca—through the careful application of these design principles.
2 Background: History of AI-Infused Tools
The idea of computers supporting humans is as old as computing itself. However, differing beliefs about how computers should interact with human intelligence in the 1950s yielded two separate camps: the artificial intelligence (AI) camp, which strove to create autonomous entities simulating human intelligence, and the intelligence augmentation (IA) camp, which saw computers as tools designed to enhance human capabilities. While a detailed history of AI and IA research is beyond the scope of this article, we will cover the most significant facts here and discuss how the convergence of AI and IA gave rise to the field of human-centered AI and the concept of HCAI-infused software tools.
The IA side of the equation—to which fields such as HCI and data visualization can trace their most significant lineage—was marked by early successes in creating tools amplifying human capabilities, arguably because of the presence of a proven and adaptive intelligence: the human user. W. Ross Ashby closes his 1956 book Introduction to Cybernetics [6] by conceptualizing the idea of augmenting human decision-making and problem-solving capabilities through cybernetic systems, noting that “it seems to follow that intellectual power, like physical power, can be amplified”[6, p. 272]. In his 1960 seminal work on “Man-Computer Symbiosis” [65], J. C. R. Licklider picked up on these ideas by envisioning that in the near future “human brains and computing machines will be coupled together very tightly, and […] the resulting partnership will think as no human brain has ever thought…” [65, p. 4]. These themes were further developed by Douglas C. Engelbart in his seminal report Augmenting Human Intellect [30].
The field of AI, on the other hand, has experienced a more tumultuous history characterized by waves of “AI winters” and “AI springs:” periods of fervent optimism vs. harsh skepticism (and reduced funding). Launched at the 1956 “Dartmouth Workshop” [70], whose participants numbered many AI “greats” such as John McCarthy, Claude Shannon, and Nathaniel Rochester, the field was characterized by early successes in problem-solving and language processing that fueled investment [74]. However, AI then faced several winters of disillusionment due to overpromised capabilities and technological limitations [22], which tempered expectations and refined research directions. In recent years, breakthroughs in machine learning [55], particularly deep learning [60], have ushered in a renaissance, driving AI from academic laboratories into the fabric of everyday life to transform society as a whole.
In more recent years, driven by the need to make AI more human-centric [63, 54] due to concerns over AI ethics [53], fairness [21], transparency [64, 27], and accountability [101, 26], the IA and AI camps have begun to converge under the shared banner of human-centered AI (HCAI) [89]. This shift was sparked by a confluence of factors, including high-profile cases of bias in AI systems [5, 11, 76], the growing influence of AI in critical sectors [25, 51], and a collective push from the global community for technology that enhances rather than undermines human capabilities and rights [48, 59, 63].
Visualization has long played a key role in both camps: creating intelligent tools and systems that assist people in specific tasks while helping AI researchers and practitioners create better models and data. In recent times, we have seen abundant evidence of how visualization can help design AI-assisted applications that prioritize human agency and ownership. Despite these advances, the role of visualization in HCAI remains somewhat vague and poorly understood. This paper seeks to cement the role of visualization in HCAI by discussing visualization-enabled HCAI tools: intelligent visualization tools empowering people with amazing capabilities. We highlight here the work by Willett et al. [102] that showed how superhuman characteristics can be used to describe the capabilities offered by visualization systems and inspire new ones. While that work inspired our present work, our focus is not only on amplifying and augmenting capabilities but also addressing critical human concerns (e.g., fairness and transparency), a hallmark of HCAI. Towards this end, in the below treatment we first define HCAI tools and then present why and how visualization can be a key enabling technology for such tools. We also provide concrete design guidelines for how to employ visualization for HCAI. These are novel contributions to both HCAI and visualization beyond prior art.
3 Definition: Human-Centered AI Tools
There is no generally accepted definition for “HCAI tools,” nor a clear understanding of the requirements and components of such tools. Thus, instead of a canonical definition, we provide an operational definition of HCAI tools based on their basic requirements, capabilities, and human concerns. We start by enumerating the capabilities of Shneiderman’s “supertools,” [89] the closest notion relevant to such HCAI tools. We then discuss AI model concerns and human concerns that these tools must address to qualify as “human-centered.” Finally, we list the derived outcomes that addressing these human concerns will engender.
3.1 Basic Requirements
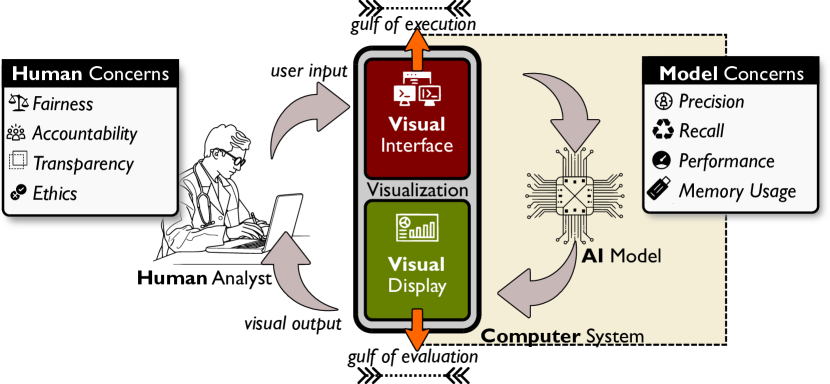
We establish some basic requirements for HCAI tools (Fig. 1):
-
•
Interactive computer software: While there may conceivably exist a notion of physical supertools, we are strictly concerned with interactive computer software in our treatment in this paper.
- •
-
•
Uses an AI model: For the tool to be at all “AI-infused,” it clearly must involve an AI model. However, this does not in any way stipulate the level of sophistication on behalf of the model; while generative AI and deep learning are currently leading the hype cycle [9], we note that basic machine learning models such as linear regression and classification may serve the human equally well depending on the task [80].
3.2 Capabilities
Shneiderman listed four characteristics or capabilities of AI-infused supertools in his book on Human-Centered AI [89]. We enumerate them below along with our extended interpretation of their meaning:
-
\faVolumeUp
Amplify (v. magnify, enlarge upon): magnifying or strengthening existing abilities.
-
–
LLMs such as ChatGPT222https://chat.openai.com/ have amplified many of our existing capabilities (e.g., editing essays and computer programming). Since then, we have seen a surge of LLM-driven applications that amplified our creativity and cognition.
-
–
CareCall [52] is an LLM-driven and publicly deployed chatbot in South Korea that assists social workers provide assistance to socially isolated individuals.
-
–
-
\faPlusCircle
Augment (v. increase, add to): adding new abilities not previously available.
-
\faFistRaised
Empower (v. give authority, make stronger): making tasks possible that were previously impossible.
-
–
Text-to-image models such as Midjourney333https://www.midjourney.com/ made it possible for non-artists to create aesthetically beautiful and creative images from textual prompts.
-
–
PromptPaint [20] empowers designers with text-to-image generation capabilities through point-medium interaction, such as mixing prompts, directional prompts, etc.
-
–
-
\faBolt
Enhance (v. intensify, increase, improve): improving the quality of existing abilities or artifacts.
-
–
Let the Chart Spark [103] enhances the design of semantic context within visualization designs using graphical elements created from text-to-image generative models.
-
–
An AI-powered chatbot [104] enhances participant performance in online studies by providing a clearer understanding of consent information compared to traditional form-based methods.
-
–
3.3 Model Concerns
While AI model concerns are not our primary focus in this paper, they are worth briefly revisiting here for context:
-
•
Precision. The fraction of relevant instances among the retrieved instances in a classification or prediction task.
-
•
Recall. The fraction of relevant instances that were retrieved among all relevant instances in a binary classification task.
-
•
Performance. The overall effectiveness and efficiency of an AI system in achieving its intended tasks or objectives.
-
•
Computational performance. Efficiency in executing computational tasks for an AI system, including training and inference.
-
•
Memory usage. The amount of memory (storage and processing) consumed by an AI system during its operation.
3.4 Human Concerns
While the above requirements and capabilities provide the foundation for HCAI tools, these tools must also incorporate human concerns [63] if they are to qualify as being “human-centered.” To be clear, not all tools will address all human concerns, and not all human concerns can be listed exhaustively. Additionally, some dimensions of human concerns can be inter-dependant. For instance, an HCAI tool capable of explaining its decisions or reasoning process may satisfy transparency needs of users to some extent. Below we enumerate some representative human concerns from the literature and our own work.
Fairness.
Fairness refers to the principle of ensuring that the development, deployment, and use of artificial intelligence systems are unbiased, equitable, and just [21]. However, it is now well-known that machine learning models can encode human biases and propagate them in critical applications, including banking, criminal justice, medicine, etc [76, 11, 5]. Fairness encompasses dimensions such as algorithmic fairness, dataset bias, inclusivity, diversity, and accessibility.
These concerns have motivated researchers and practitioners to develop definitions of fair machine learning. The definitions can be categorized into two broad categories: (1) those that require that disparities (e.g., error rates) remain similar across protected groups; and (2) those that require minimum or no effects of legally protected characteristics, like race and gender, on decisions [21].
Transparency.
Transparency in AI research refers to the practice of openly disclosing information about the development, functioning, and outcomes of artificial intelligence systems [64, 27]. It is widely reported to be a desired feature for any AI-infused tool or system. While there is no agreed-upon definition for AI transparency [64], most works in this domain focus on informational transparency—understanding what information about the model and data should be disclosed to enable appropriate understanding [64]. Researchers have also studied relational and social dimensions of AI transparency [64].
Explainability.
Explainability refers to providing explanations for a model’s decisions, predictions, and actions [79]. The concept is relevant to AI transparency but focuses more on elucidating the internal workings, logic, and factors influencing the output. It is crucial for building trust with the users by enabling them to understand why and how certain decisions are made, detect errors, and assess reliability. Key approaches to achieving explainability include feature importance analysis [79, 69], model visualization [40, 41], counterfactual explanations [100], and contextually relevant justifications for AI decisions [27].
Understandability.
Providing explanations may not be enough; a human user needs to understand the explanations generated by the AI models and align them with their mental models and expectations. For instance, the “General Data Protection Regulation (GDPR)” [94] from the European Union (EU) requires that users should receive explanations in a concise, transparent, intelligible, and easily accessible form. Understandability considers factors such as language, visualization, context, and user experience design to ensure that users can interpret and make informed decisions based on the AI’s outputs.
Accountability.
Accountability in AI research refers to the principle of holding individuals, organizations, and systems responsible for the development, deployment, and outcomes of artificial intelligence technologies [101, 26]. It involves aspects such as developer responsibility, regulatory compliance, monitoring and evaluation, remediation and redress, and organizational culture and governance. In recent times, we have seen regulatory policies emerging for AI accountability (e.g., Blueprint for an AI Bill of Rights from the U.S. White House [91]).
Provenance.
The notion of provenance refers to distinguishing between the contributions or influences of a human user and the AI system in generating content [31]. This concept becomes particularly relevant in scenarios where both human input and AI algorithms collaborate to produce outputs, such as in human-AI co-writing, collaborative creativity tools, or content generation platforms [44].
Privacy.
As AI systems analyze increasingly vast amounts of data, there’s a growing risk of breaches of privacy—the expectation of seclusion and selective expression of personal information—leading to unauthorized access to sensitive data [61]. Challenges include ensuring data anonymity, protecting against algorithmic biases that can lead to discriminatory outcomes, and establishing transparent practices for data handling. However, these concerns also present opportunities for researchers to develop privacy-preserving techniques such as federated learning [57] (models trained across multiple decentralized instances holding local data samples, allowing for learning without sharing raw data), differential privacy [1] (adding noise to query results to protect the privacy of individual data points), and homomorphic encryption [32] (enabling computations on encrypted data without the need to first decrypt it). Integrating privacy concerns into AI research methodologies will enhance data security, foster trust among users, and uphold ethical standards in the development and deployment of AI systems.
3.5 Derived Outcomes
The derived outcomes presented here are second-order effects arising from addressing human concerns (above) in HCAI tools. This list is not exhaustive, similar to our enumeration of human concerns:
-
1.
Agency reflects the sense of control and empowerment a system elicits in its users [37].
- 2.
-
3.
Reliability encompasses consistency, dependability, and accuracy across varying conditions, users, and inputs [88].
-
4.
Safety entails implementing measures to mitigate risks and ensure well-being, characterized by leadership commitment, open failure reporting, oversight boards, and public problem disclosure [88].
- 5.
4 Interactive Visualization for HCAI tools
The basic premise of this paper is that interactive visualization can serve as a key enabling technology for HCAI tools as defined in Section 3. In this section, we will show how visualization can both provide the necessary design components for such HCAI tools, as well as give examples of how it can address the human concerns inherent to these tools. We close the section with a classification of a selection of these so-called visualization-enabled HCAI tools.
4.1 Design Characteristics
Several guidelines on HCAI tools and related technologies exist in the literature. Eric Horvitz, an early pioneer in mixed-initiative interaction, in 1999 presented 12 guidelines for mixed-initiative interaction tools [46]. While there is no 1-to-1 mapping between HCAI and mixed-initiative, several of these guidelines are directly relevant to HCAI tools. Harking back to these early mixed-initiative systems, Microsoft recently published 18 guidelines for human-AI interaction [3] validated against 20 HCAI-infused tools and with 49 practitioners. Similarly, Google PAIR’s People + AI Guidebook [35] list 23 patterns providing principles and practices for designing human-centered AI systems. In discussing practical tradeoffs between agency and automation, Heer [37] presented shared representations of user tasks and capabilities as the common denominator in three case studies of human-AI tools. Finally, Shneiderman proposed his Prometheus Principles [88] (which draw lineage from his direct manipulation principles [86]).
Here we outline the design characteristics (DC1–DC5) that visualization can provide in support of these combined guidelines:
-
DC1
Open-ended and data-driven: A direct strength of data visualization is that it—unlike confirmatory tools—supports open-ended exploratory data analysis [92] informed by the data.
-
DC2
Facilitates user–computer conversations: Modern data visualization tools are fundamentally interactive [73, 106], thus supporting seamless exchanges between the AI and the user.
-
–
This supports Horvitz’s guidelines #5 (employing dialog to resolve key uncertainties, #6 (allowing invocation and termination), and #9 (efficient agent-user collaboration [46]).
-
–
This interactive nature undergirds Shneiderman’s consistent interfaces to allow users to form, express, and revise intent as well as rapid, incremental, and reversible actions [88].
- –
- –
-
–
-
DC3
Externalizes data: Visualizations serve as external representations [83] of data, thereby offloading memory, facilitating re-representation, and simplifying computation.
-
–
Horvitz suggests designing tools that maintain working memory (guideline #11) [46].
-
–
One of Google PAIR’s patterns encourages explainability by being transparent about privacy and data settings [35].
-
–
This can reduce cognitive load by showing contextually relevant information and remembering recent interactions (G4 and G12 from Microsoft’s guidelines [3]).
-
–
-
DC4
Shared data representation: Visual representations can serve as a representation of the data common to both user and AI model.
-
–
A shared representation [37] is central to Heer’s argument for enabling both user and AI control of a common task.
-
–
Such visual representations provide support for Shneiderman’s continuous visual display of objects, informative feedback, progress indicators, and completion reports [88].
-
–
These representations can be used to, as Google PAIR puts it, determine how to show model confidence, if at all as well as explain for understanding, not completeness [35].
- –
-
–
These data representations scaffold several of Microsoft’s human-AI guidelines [3], including make clear why the system did what it did (G11) and convey the consequences of user actions (G16).
-
–
-
DC5
Shared task representation: Similarly, the interactions enabled by the visualization capture the user’s potential actions.
-
–
Similarly to DC4, this scaffold’s Heer’s shared representation [37] of the user’s actions on the data.
-
–
This also supports Shneiderman’s continuous visual display of actions of interest [88].
- –
-
–
Microsoft’s human-AI guidelines encourage to make clear what the system can do (G1) and make clear how well the system can do what it can do (G2) [3].
-
–
| HCAI Tool | Venue | Year | \faVolumeUp | \faPlusCircle | \faFistRaised | \faBolt | \faBalanceScale | \faConnectdevelop | \faComment | \faExclamationCircle | \faBook | \faClock | \faMask | \faKeyboard | \faDesktop |
|---|---|---|---|---|---|---|---|---|---|---|---|---|---|---|---|
| TimeFork [7] | ACM CHI | 2016 | ✓ | ✓ | – | ✓ | – | – | ✓ | ✓ | – | – | – | ✓ | ✓ |
| Outcome-Explorer [45] | IEEE VIS | 2022 | ✓ | – | – | ✓ | – | ✓ | ✓ | ✓ | – | ✓ | – | ✓ | ✓ |
| uxSense [8] | IEEE TVCG | 2023 | ✓ | ✓ | ✓ | ✓ | – | ✓ | – | ✓ | – | ✓ | – | ✓ | ✓ |
| HaLLMark [44] | ACM CHI | 2024 | ✓ | ✓ | ✓ | ✓ | – | ✓ | – | – | ✓ | ✓ | – | ✓ | ✓ |
| DVP [42] | ACM DIS | 2022 | ✓ | ✓ | ✓ | ✓ | ✓ | – | – | – | – | – | – | ✓ | ✓ |
| Utopian [18] | IEEE VIS | 2013 | ✓ | – | – | ✓ | – | – | – | – | – | ✓ | – | ✓ | ✓ |
| InterAxis [58] | IEEE VIS | 2015 | ✓ | – | – | ✓ | – | – | – | ✓ | – | ✓ | – | ✓ | ✓ |
| GradCam [84] | IEEE ICCV | 2017 | – | ✓ | – | – | – | – | ✓ | – | – | – | – | ✓ | – |
| Concept Vector [77] | IEEE VIS | 2017 | ✓ | – | – | ✓ | – | – | ✓ | ✓ | ✓ | ✓ | – | ✓ | ✓ |
| Vigor [78] | IEEE VIS | 2017 | ✓ | – | – | ✓ | – | – | ✓ | ✓ | – | ✓ | ✓ | ✓ | ✓ |
| Gan Lab [56] | IEEE VIS | 2018 | ✓ | – | – | – | – | ✓ | ✓ | ✓ | ✓ | ✓ | – | ✓ | ✓ |
| Seq-2-Seq Vis [90] | IEEE VIS | 2018 | – | ✓ | – | – | – | ✓ | ✓ | ✓ | ✓ | ✓ | – | ✓ | ✓ |
| RuleMatrix [71] | IEEE VIS | 2018 | ✓ | ✓ | – | ✓ | – | ✓ | ✓ | ✓ | ✓ | – | – | ✓ | ✓ |
| Sherpa [23] | IEEE VDS | 2019 | ✓ | – | – | – | – | ✓ | ✓ | ✓ | – | – | – | ✓ | – |
| Vis for the Blind [16] | EuroVis | 2019 | – | ✓ | ✓ | – | – | – | ✓ | – | – | – | – | ✓ | – |
| AILA [17] | ACM CHI | 2019 | ✓ | – | – | – | – | – | – | – | – | ✓ | – | ✓ | ✓ |
| Deep Drawing [98] | IEEE VIS | 2019 | ✓ | – | – | – | – | – | – | – | – | – | – | ✓ | ✓ |
| VisCode [107] | IEEE VIS | 2019 | ✓ | – | – | ✓ | – | – | – | – | – | – | – | ✓ | – |
| FashionQ [50] | IEEE TVCG | 2021 | ✓ | – | – | ✓ | – | – | – | – | – | ✓ | – | ✓ | – |
| Auto Title [68] | IEEE TVCG | 2023 | ✓ | – | – | ✓ | ✓ | – | ✓ | ✓ | ✓ | ✓ | – | ✓ | ✓ |
| Data Player [85] | IEEE VIS | 2023 | ✓ | – | – | – | – | – | – | – | – | ✓ | – | ✓ | ✓ |
| DMiner [66] | IEEE VIS | 2023 | ✓ | – | – | – | – | – | – | ✓ | – | – | – | ✓ | – |
| Data Formulator [95] | IEEE VIS | 2023 | ✓ | – | – | – | – | – | – | ✓ | – | ✓ | – | ✓ | ✓ |
4.2 Addressing the Human Concerns
Here we describe how visual analytics and interactive visualization can address the human concerns outlined in Section 3.
Fairness.
Visualization has a unique capability to help users detect and mitigate biases in ML models by summarizing performance (e.g., accuracy) or disparities (e.g., error rates) across a large number of intersectional social groups (e.g., white female) in a large-scale dataset [12, 97, 34]. Visualization also enables users to draw their own conclusions and avoids providing explicit results, which is crucial for tasks such as bias detection, as the definition of bias or fairness varies across societies and cultures [42]. What’s more, even non-experts can detect biases using visualization [105, 42], which makes visualization a powerful probe for end-users to prevent harmful biases from being propagated in their artifact while using HCAI tools.
Transparency.
Visualization can support AI transparency by visually representing concepts and models that are often abstract and complex. It is particularly suited for this task as it enables users to interactively explore the models and their inner states to understand model features [45, 99]. Examples include visualizing concepts extracted from neural networks [43, 47], causal models for decision-making [45], and shape functions in generalized additive models [39].
Explainability.
Visualization is widely used in explainable AI (XAI) research to present evidence for a model’s decisions, predictions, and actions [67, 82]. Starting from simple bar charts for representing feature importance [79] to more advanced techniques such as saliency maps [2], high dimensional projections [100], and post-hoc models for visualizing decision rules [71] are now ubiquitous. Incorporating such techniques in HCAI tools will support users in critical domains (e.g., medical and health applications) where explainability is a priority.
Understandability.
A well-known advantage of interactive visualization is that it can represent complex and large-scale data in an accessible and easy-to-understand format—“using vision to think” [14]. In fact, prior research has found that interactive visual explanations are more effective for understanding AI output than textual ones [15].
Accountability.
AI accountability largely deals with regulatory policies and laws, where algorithmic mechanisms, while pertinent, are not the main focus. This is likely the reason behind a lack of visualization research addressing accountability. One exception is HaLLMark [44], which helps writers evaluate their conformity to AI co-writing policies using interactive visualization. This mechanism would allow publishers and readers to assess compliance and provide a means to hold writers accountable for their use of LLMs in written artifacts. Accountability also depends on other concerns such as transparency and explainability [26], where visualization can play a key role.
Provenance.
Interactive visualization has long been used for keeping track of data provenance [13], such as interaction and analysis histories [38, 49]. For instance, History Flow [93] and DocuViz [96] are examples of visualization techniques for studying co-authorship patterns (cooperation and conflicts) over time in collaborative writing. Similar techniques can visualize human-AI collaboration [3].
Privacy.
Privacy-preserving visualization can incorporate commonly used data anonymization techniques (e.g., -anonymity and -diversity) [19] for maintaining privacy. Moreover, privacy-preserving visualization provides an interface to users for examining potential privacy issues, obfuscating information as suggested by the system, and customizing privacy configuration as needed [19, 24].
4.3 Review of Visualization-Enabled HCAI Tools
Table 1 presents a curated selection of research we consider to be visualization-enabled HCAI tools. The research team collaboratively created this list through extensive discussions. Note that our classification not only includes the four capabilities and seven concerns in Section 3, but also whether the systems address the gulfs of execution \faKeyboard and evaluation \faDesktop [75]. We will discuss the systems highlighted in blue in the following section.
5 Motivating HCAI Tools
Here we review four examples of HCAI tools from our own work that illustrate how visualization can enable supporting the four HCAI tool capabilities and seven human concerns in Section 3. These HCAI tools are classified as the first rows in Table 1 (blue highlights). We describe them in detail and use their example to derive design guidelines.
5.1 TimeFork
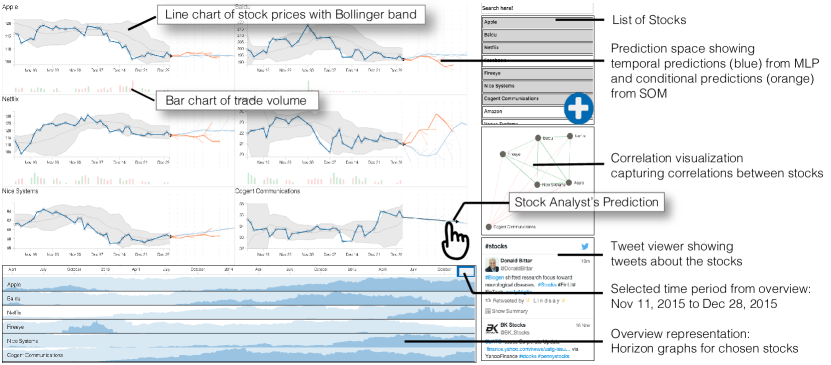
TimeFork [7] is a mixed-initiative visual analytics system for temporal prediction in multiple time series, with a demonstration for the stock market (Figure 2). The goal of TimeFork is simple: to complement the capabilities of the human analyst by enabling them to provide key insights for “what-if” scenarios for how a specific time series or group of time series might develop in the future, and then have a large-scale temporal prediction model “fill in the blanks” by suggesting what the remaining series would do in response. In other words, the tool leverages the strengths of humans—lateral thinking and creative insight—by having them make point decisions about the future development of a stock and then make up for their weaknesses—raw computation for a large number of other stocks—using the automatic prediction model.
Our evaluation asked 13 participants to invest virtual money ($100,000) into a stock market portfolio at four points during a six-month period in 2014 and 2015. In one condition, they did this task manually with no support; in another, they used the TimeFork method. Finally, we compared their performance to the fully automatic method, where no user intervention was allowed. Our findings showed that participants performed the best in terms of portfolio value and overall investment strategy when using TimeFork—i.e., when preserving both user control and benefit from AI support—than when using fully manual or fully automatic decision-making. In particular, our findings showed TimeFork yielding robust performance in situations with poor predictive performance by the automated model. This means that the idea of complementing the user with an AI model also works in the other way; complementing weaknesses of the AI model with the user.
HCA Tool Characteristics.
TimeFork supports decision-making for temporal prediction in several ways: by amplifying \faVolumeUp the user’s natural predictive abilities beyond a few to thousands of stocks, by augmenting \faPlusCircle their abilities to understand complex co-dependencies between multiple stocks (e.g., that Google stock rising usually means that Meta, Microsoft, and Apple will also rise), and enhancing \faBolt their performance by bolstering precision using accurate models. Furthermore, the real-time visual feedback in response to user interaction, which shows possible prediction outcomes, promotes explainability \faComment, the visual representation supports understandability \faExclamationCircle, and the guided user interactions and small multiples visualization contribute to shrinking both the gulfs of execution \faKeyboard and evaluation \faDesktop.
Design Insights.
We derive the following insights from our work:
-
•
Support, don’t supplant. ††margin: ††margin: Rather than trying to make fully automatic decisions, it is better to support the user as far as possible in making the decision. Not only does it preserve agency and clarifies accountability, it also tends to yield better performance.
-
•
Simple visuals can help explain ††margin: ††margin: complex models using a familiar visual language. Embedding explanations in the stock charts improves understandability and shrinks the gulf of evaluation.
5.2 HaLLMark
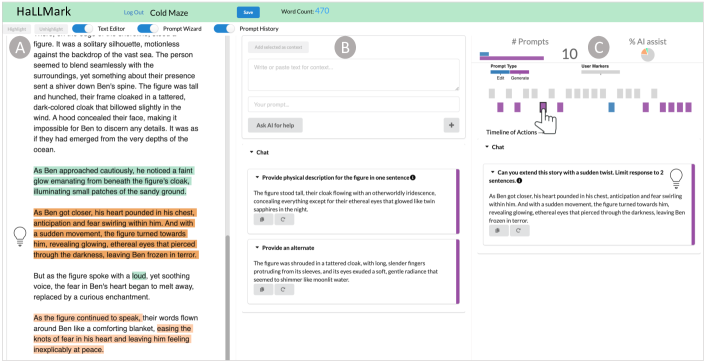
HaLLMark [44] is a web-based co-writing tool for large language models (LLM) that stores and visualizes a writer’s interaction with the LLM (Figure 3). The system facilitates writers to self-reflect on their use of the LLM by clearly highlighting AI writing and prompting activities (editing vs. generating). The motivation is that by capturing interactions between AI and writers as the document evolves and by supporting interactive exploration of that provenance, a writer will have an enhanced sense of agency, control, and ownership of the final artifact. Provenance can also help writers conform to AI-assisted writing policies and be transparent to publishers and readers.
From evaluations with 13 creative writers, we found that HaLLMark encouraged writers to actively evaluate AI assistance from the onset of the writing process. As a result, it instilled a sense of control in the writer’s mind and improved the sense of ownership over the final artifact. Writers also felt that HaLLMark would help them become more transparent in communicating AI co-writing to external parties.
HCAI Tool Characteristics.
HaLLMark supports all four capabilities of an HCAI tool. It amplifies \faVolumeUp and enhances \faBolt writing with AI and visualization. It augments \faPlusCircle several new capabilities, including tracking provenance as well as ensuring transparency and accountability with regard to AI co-writing policies. It also empowers \faFistRaised writers to control and reflect on how and when they want to use AI support. HaLLMark also addresses several of the human concerns: transparency \faConnectdevelop, accountability \faBook, and provenance \faClock. By addressing these concerns, it also addresses derived outcomes such as ownership.
Design Insights.
We outline insights drawn from HaLLMark:
-
•
Simple visualization design ††margin: ††margin: can satisfy an HCAI tool’s capabilities as well as address human concerns needed for it to be effective. The visualization design in HaLLMark is very simple compared to typical visual analytics dashboards containing multiple views; a linear timeline with colored and grey rectangles. However, this simple visual design is enough to amplify creative writing as well as address several human concerns.
-
•
Multiple human concerns ††margin: ††margin: can be addressed through careful visualization design. In HaLLMark, a single provenance visualization was able to improve users’ agency, transparency, accountability, and ownership needs. Thus, researchers should aim to design features that address multiple concerns (although we acknowledge that not all concerns can or should be addressed in a single tool).
5.3 Outcome-Explorer
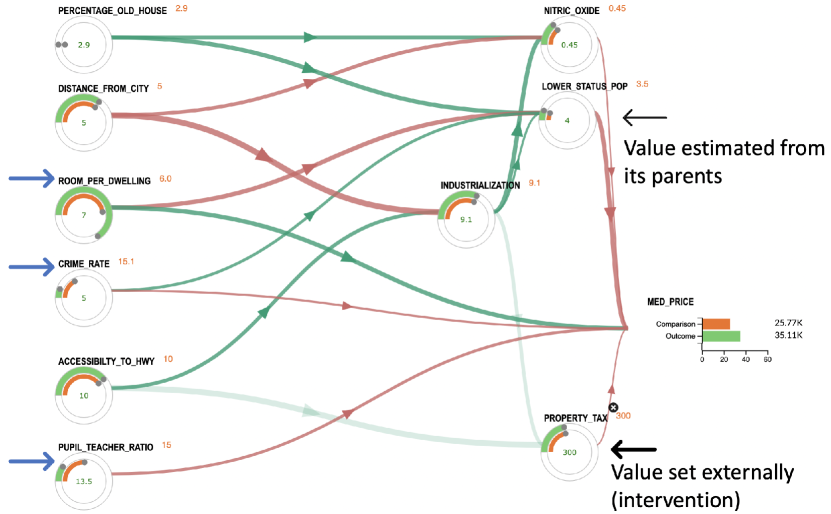
Outcome-Explorer [45] is a tool for transparent and interpretable AI decision-making. Its goal is to help users get answers to explanation queries such as “Why does this model make such decisions?”, “What if I change a particular input feature?” or “How will my action change the decision?” To facilitate this, the system uses a causal model for prediction as it is ‘inherently interpretable”: it’s inner-workings are directly observable through a Directed Acyclic Graph (DAG). Users (both expert and non-expert) can interact with the causal model by setting specific values to variables, visualizing changes in the underlying causal model, and then receiving the AI’s decision.
HCAI Tool Characteristics.
Outcome-Explorer facilitates transparency \faConnectdevelop by clearly representing the relationships between the variables and how they impact the outcome variable (e.g., loan approval decisions). It shrinks the gulf of evaluation \faKeyboard and execution \faDesktop by allowing users to interact with the causal model. It improves explainability \faComment, understandability \faExclamationCircle, and provenance \faClock through features such as interactive what-if analysis, neighborhood exploration (decisions for similar data profiles), and provenance visualization (Figure 4).
Design Insights.
We outline two insights learned from the tool:
-
•
Abundant opportunities to interact with visualizations can be the key to support users with varying needs and skills in HCAI tools. ††margin: ††margin: Unlike typical visual analytics systems, Outcome-Explorer supports both experts and non-experts. Everyone can set values to the parameters and explore the outcomes while expert users can take leverage of advanced features such as comparing two data profiles to see how the outcomes vary between the profiles.
-
•
Evaluation of visualization-enabled HCAI tools should engage users in realistic decision-making tasks. ††margin: ††margin: Prior research suggests that proxy tasks and subjective measures are not good predictors of how humans might perform on actual decision-making tasks [10]. In the evaluation of Outcome-Explorer, participants were asked to iteratively changing real-world parameters to achieve a target outcome in an actual decision-making task.
5.4 uxSense
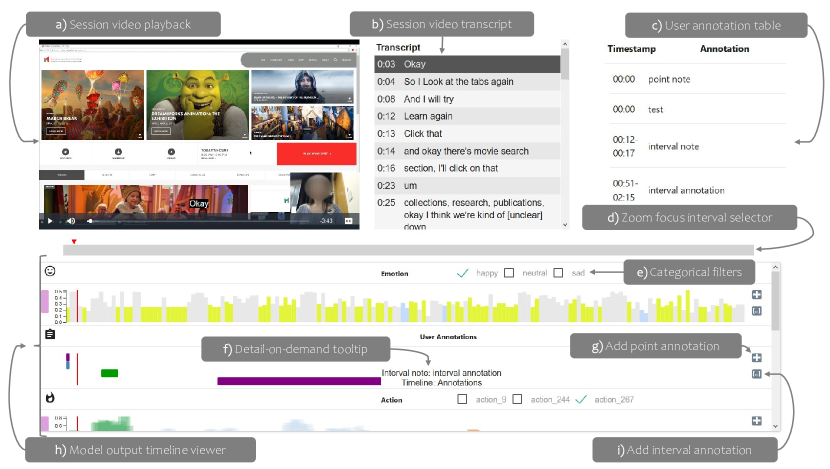
UX research is a data-driven endeavor with multiple sources of rich data that needs to be correlated and analyzed in unison—primarily video recorded of participants using a novel software tool, but also their spoken language, mouse cursor movements, and facial expressions and body language. The uxSense tool takes a radical approach by proposing to use computer vision and action labeling AI models to derive abstract data streams from this video and audio data. The motivation is that rather than trying to painstakingly analyze all this data manually, the UX analyst is better served by state-of-the-art AI models running classification at scale and then presenting the raw results to the user. Figure 5 shows the main uxSense interface, with both (a) a video playback window, (b) a transcript, (c) analyst annotation, and a coordinated timeline of data streams on the bottom half of the screen. In this way, the user can access a wealth of preprocessed data that reduces their cognitive load while retaining the raw video and audio.
We asked five UX professionals from U.S. tech companies to use the tool to analyze a usability session involving a commercial software application. On the whole, participants felt that the preprocessing filters provided by uxSense would significantly ease their daily work by providing a high-level overview of the data and pinpointing areas of interest. However, a key feedback had to do with the trustworthiness of the models, which may preclude users from accepting it wholesale.
HCAI Tool Characteristics.
uxSense supports all four capabilities of an HCAI tool: it amplifies \faVolumeUp a UX expert’s abilities to handle massive scale, augments \faPlusCircle their ability by adding novel data streams to the analysis, empowers \faFistRaised their ability to analyze data that was not previously accessible, and enhances \faBolt their precision and accuracy. The visual representations provides transparency \faConnectdevelop into AI models and promotes understandability \faExclamationCircle of their output using a familiar visual language, and the timeline representation supports provenance \faClock.
Design Insights.
We outline insights drawn from uxSense:
-
•
Show the users the data ††margin: ††margin: from the AI models rather than trying to use it to come to some automatic decision or insight. The user is there already: defer final interpretations and decisions to them.
-
•
Using real tasks and real users ††margin: ††margin: for a visualization-enabled HCAI tool motivates and demonstrates the tool best during evaluation. AI is already being used to tackle life-and-death problems; our evaluations should have the same level of ambition.
6 Designing Visualization-Enabled HCAI Tools
Summarizing the insights (i1–i5) from our exemplar visualization-enabled HCAI tools yields several guidelines on how to design such tools. We also discuss limitations and open problems in our framework.
6.1 Design Guidelines
DG1 - Simple Is Plenty [i2].
In a visualization-enabled HCAI tool, the visualization will work as a communication medium between the AI model and the human user. This means that the design of visualization should not induce unnecessary friction or cognitive load. In fact, many times the users are domain experts and not visualization experts, which means that their tolerance for complex representations is further diminished. Rather, designers should favor simple, familiar, and understandable visualizations [81]. The scalability, clarity, and function of the visual representation are of the utmost importance.
DG2 - Tackle Human Concerns Directly [i3].
Addressing human concerns directly in the design of visualization-enabled HCAI tools is crucial for fostering trust, transparency, and acceptance. This guideline emphasizes the importance of designing with empathy and awareness of the end-users’ perspectives, particularly regarding ethics, privacy, fairness, and understandability. Visualizations should transparently communicate how data is used, how decisions are made, and the implications of those decisions, including potential biases and limitations. By proactively addressing these concerns through the power of visualization, designers can help demystify AI processes and foster a more trustworthy relationship between users and the HCAI tool.
DG3 - Encourage Interaction [i4].
Fostering a human-data interaction is key to enhancing user engagement and understanding. Interactivity allows users to explore data and AI outputs on their terms, enabling them to ask questions, probe uncertainties, and discover insights through direct manipulation. Designers should integrate interactive elements to shrink the gulf of execution between the user and the AI model. This not only increases the utility and accessibility of the HCAI tool but also empowers users to form a deeper connection with the data, facilitating a more intuitive and engaging learning process.
DG4 - Show, Don’t Tell [i1].
Don’t try to answer a specific question or support a specific decision with your visualization. There is a reason HCAI tools involve humans in the loop—empower them to uncover insights independently rather than directing them towards pre-defined conclusions. This design guideline advocates for creating visualizations that present data in an unbiased and unfiltered manner, allowing users to explore, interpret, and draw conclusions based on their expertise and perspective. By designing visualizations that lay out the data landscape without steering users towards a specific interpretation, designers respect the users’ agency, analysis skills, and decision-making authority. This encourages a deeper engagement with the data, fostering a sense of discovery and ownership over insights.
DG5 - Practice Like You Play [i5].
Visualization-enabled HCAI tools should be evaluated and tested with realistic datasets, real tasks, and representative users. Given the scale and scope of AI in today’s society, we cannot afford to test these tools on toy datasets that do not scale, tasks that look nothing like real ones, and users drawn merely from convenience populations.
6.2 Limitations and Open Problems
This work was reviewed by several leading HCAI experts and the work has been revised accordingly. Changes include ensuring that the agency of using HCAI tools lies firmly in the human operators, improvements to the design guidelines, and missing references. Nevertheless, we do not purport to say that this paper is in any way complete or exhaustive. There are several limitations to our work that bear discussion.
While our design guidelines are drawn from existing empirical work, an external reviewer noted that they have not been properly anchored in design practice. Their suggestion was to conduct a focus group session with 3-5 professional designers to discuss the design guidelines and examples. This is an excellent improvement left for future work.
We also encountered some challenges when classifying existing work using our capabilities and human concerns. For example, we found that the four HCAI tool capabilities (Section 3.2), originally suggested by Ben Shneiderman [89], are difficult to separate. Furthermore, we also found relatively few tools that support empowering \faFistRaised as well as privacy \faMask. However, we believe that this is primarily because visualization-enabled HCAI tools are still in their early days. This is also perhaps why the best methods to evaluate these tools are still unclear.
Finally, it is also worth noting that while visualization does provide additional reasoning power to an HCAI tool, as this article has amply shown, it also introduces another layer of indirection and abstraction. Not everyone are familiar with visualization, and even familiar visual representations may require training or impose cognitive load.
7 Outlook: Visualization for HCAI Tools
We have presented a novel design framework for visualization-enabled HCAI tools that not only amplifies \faVolumeUp, augments \faPlusCircle, empowers \faFistRaised, and enhances \faBolt human capabilities, but also addresses vital human concerns that define the burgeoning area of human-centered AI. As we look towards the future, we believe that visualization stands poised to become a lingua franca of HCAI tools, bridging the gap between complex AI processes and human cognition. This evolution will be driven by the universal capacity of visual information to convey intricate details in an intuitive, accessible manner, transcending linguistic and technical barriers. As HCAI tools become increasingly embedded in various domains, from healthcare to urban planning, the role of visualization in democratizing access to AI-generated insights will expand. By leveraging advances in interactive and immersive technologies [28], such as augmented reality (AR) and virtual reality (VR), visualization will offer even more engaging and intuitive platforms for exploring AI data landscapes. This progression will not only enhance individual understanding and decision-making but will also foster collaborative problem-solving across disciplines, promoting a shared comprehension of AI-driven insights. In essence, we think that visualization has the potential to evolve beyond merely representing AI model data to become a foundational element in the dialogue between humans and AI, enabling a future where complex AI outputs are as understandable and actionable as natural human language.
Acknowledgements.
This work was supported partly by Villum Investigator grant VL-54492 by Villum Fonden. Any opinions, findings, and conclusions expressed in this material are those of the authors and do not necessarily reflect the views of the funding agency. We thank Dan M. Russell and Ben Shneiderman for their feedback on progressive drafts of this work.References
- [1] M. Abadi, A. Chu, I. Goodfellow, H. B. McMahan, I. Mironov, K. Talwar, and L. Zhang. Deep learning with differential privacy. In Proc. ACM CCS, p. 308–318. ACM, New York, 2016. doi: 10 . 1145/2976749 . 2978318
- [2] J. Adebayo, J. Gilmer, M. Muelly, I. J. Goodfellow, M. Hardt, and B. Kim. Sanity checks for saliency maps. In Proc. NeurIPS, pp. 9525–9536, 2018.
- [3] S. Amershi, D. Weld, M. Vorvoreanu, A. Fourney, B. Nushi, P. Collisson, J. Suh, S. Iqbal, P. N. Bennett, K. Inkpen, J. Teevan, R. Kikin-Gil, and E. Horvitz. Guidelines for Human-AI interaction. In Proc. ACM CHI, pp. 3:1–3:13. ACM, New York, 2019. doi: 10 . 1145/3290605 . 3300233
- [4] T. Angert, M. Suzara, J. Han, C. Pondoc, and H. Subramonyam. Spellburst: A node-based interface for exploratory creative coding with natural language prompts. In Proc. ACM UIST. ACM, New York, 2023. doi: 10 . 1145/3586183 . 3606719
- [5] J. Angwin, J. Larson, S. Mattu, and L. Kirchner. Machine bias. ProPublica, 2016.
- [6] W. R. Ashby. An Introduction to Cybernetics. Chapman & Hall, London, UK, 1956.
- [7] S. K. Badam, J. Zhao, S. Sen, N. Elmqvist, and D. S. Ebert. TimeFork: Interactive prediction of time series. In Proc. ACM CHI, pp. 5409–5420. ACM, New York, 2016. doi: 10 . 1145/2858036 . 2858150
- [8] A. Batch, Y. Ji, M. Fan, J. Zhao, and N. Elmqvist. uxSense: Supporting user experience analysis with visualization and computer vision. IEEE TVCG, pp. 1–15, 2023. doi: 10 . 1109/TVCG . 2023 . 3241581
- [9] R. Bommasani and et al. On the opportunities and risks of foundation models. CoRR, abs/2108.07258, 2021.
- [10] Z. Buçinca, P. Lin, K. Z. Gajos, and E. L. Glassman. Proxy tasks and subjective measures can be misleading in evaluating explainable AI systems. In Proc. ACM IUI, pp. 454–464, 2020. doi: 10 . 1145/3377325 . 3377498
- [11] J. Buolamwini and T. Gebru. Gender shades: Intersectional accuracy disparities in commercial gender classification. In Proc. PMLR FAccT, vol. 81, pp. 77–91. PMLR, 2018.
- [12] Á. A. Cabrera, W. Epperson, F. Hohman, M. Kahng, J. Morgenstern, and D. H. Chau. FAIRVIS: visual analytics for discovering intersectional bias in machine learning. In Proc. IEEE VAST, pp. 46–56, 2019. doi: 10 . 1109/VAST47406 . 2019 . 8986948
- [13] S. P. Callahan, J. Freire, E. Santos, C. E. Scheidegger, C. T. Silva, and H. T. Vo. VisTrails: visualization meets data management. In Proc. ACM SIGMOD, pp. 745–747, 2006. doi: 10 . 1145/1142473 . 1142574
- [14] S. K. Card, J. D. Mackinlay, and B. Shneiderman. Readings in Information Visualization — Using Vision to Think. Morgan Kaufmann Publishers, San Francisco, CA, USA, 1999.
- [15] H.-F. Cheng, R. Wang, Z. Zhang, F. O’Connell, T. Gray, F. M. Harper, and H. Zhu. Explaining decision-making algorithms through UI: Strategies to help non-expert stakeholders. In Proc. ACM CHI, p. 1–12. ACM, New York, 2019. doi: 10 . 1145/3290605 . 3300789
- [16] J. Choi, S. Jung, D. G. Park, J. Choo, and N. Elmqvist. Visualizing for the non-visual: Enabling the visually impaired to use visualization. Comput. Graph. Forum, 38(3):249–260, 2019. doi: 10 . 1111/cgf . 13686
- [17] M. Choi, C. Park, S. Yang, Y. Kim, J. Choo, and S. R. Hong. AILA: Attentive interactive labeling assistant for document classification through attention-based deep neural networks. In Proc. ACM CHI, p. 1–12. ACM, New York, 2019. doi: 10 . 1145/3290605 . 3300460
- [18] J. Choo, C. Lee, C. K. Reddy, and H. Park. UTOPIAN: User-driven topic modeling based on interactive nonnegative matrix factorization. IEEE TVCG, 19(12):1992–2001, 2013. doi: 10 . 1109/TVCG . 2013 . 212
- [19] J. Chou, Y. Wang, and K. Ma. Privacy preserving visualization: A study on event sequence data. Comput. Graph. Forum, 38(1):340–355, 2019. doi: 10 . 1111/CGF . 13535
- [20] J. J. Y. Chung and E. Adar. PromptPaint: Steering text-to-image generation through paint medium-like interactions. In Proc. ACM UIST. ACM, New York, 2023. doi: 10 . 1145/3586183 . 3606777
- [21] S. Corbett-Davies and S. Goel. The measure and mismeasure of fairness: A critical review of fair machine learning. CoRR, abs/1808.00023, 2018.
- [22] D. Crevier. AI: The Tumultuous History of the Search for Artificial Intelligence. Basic Books, New York, NY, USA, 1993.
- [23] Z. Cui, J. Kancherla, H. C. Bravo, and N. Elmqvist. Sherpa: Leveraging user attention for computational steering in visual analytics. In Proc. IEEE VDS, pp. 48–57, 2019. doi: 10 . 1109/VDS48975 . 2019 . 8973384
- [24] A. Dasgupta, M. Chen, and R. Kosara. Measuring privacy and utility in privacy-preserving visualization. Comput. Graph. Forum, 32(8):35–47, 2013. doi: 10 . 1111/CGF . 12142
- [25] T. H. Davenport. The AI Advantage: How to Put the Artificial Intelligence Revolution to Work. MIT Press, Cambridge, MA, USA, 2018. doi: 10 . 7551/mitpress/11781 . 001 . 0001
- [26] N. Diakopoulos. Accountability in algorithmic decision making. Commun. ACM, 59(2):56–62, jan 2016. doi: 10 . 1145/2844110
- [27] U. Ehsan, Q. V. Liao, M. Muller, M. O. Riedl, and J. D. Weisz. Expanding explainability: Towards social transparency in AI systems. In Proc. ACM CHI, pp. 82:1–82:19. ACM, New York, 2021. doi: 10 . 1145/3411764 . 3445188
- [28] N. Elmqvist. Data analytics anywhere and everywhere. Commun. ACM, 66(12):52–63, 2023. doi: 10 . 1145/3584858
- [29] N. Elmqvist, A. V. Moere, H. Jetter, D. Cernea, H. Reiterer, and T. J. Jankun-Kelly. Fluid interaction for information visualization. Inf. Vis., 10(4):327–340, 2011. doi: 10 . 1177/1473871611413180
- [30] D. C. Engelbart. Augmenting human intellect: A conceptual framework. Technical Report AFOSR-3223, Stanford Research Institute, 1962.
- [31] K. K. Feng, N. Ritchie, P. Blumenthal, A. Parsons, and A. X. Zhang. Examining the impact of provenance-enabled media on trust and accuracy perceptions. Proc. ACM Hum. Comput. Interact, 7(CSCW2):1–42, 2023.
- [32] C. Gentry. Fully homomorphic encryption using ideal lattices. In Proc. ACM STOC, p. 169–178, 2009. doi: 10 . 1145/1536414 . 1536440
- [33] K. I. Gero, V. Liu, and L. B. Chilton. Sparks: Inspiration for science writing using language models. In Proc. ACM DIS, pp. 1002–1019. ACM, New York, 2022. doi: 10 . 1145/3532106 . 3533533
- [34] B. Ghai and K. Mueller. D-BIAS: A causality-based human-in-the-loop system for tackling algorithmic bias. IEEE TVCG, 29(1):473–482, 2023. doi: 10 . 1109/TVCG . 2022 . 3209484
- [35] Google PAIR. People + AI Guidebook. https://pair.withgoogle.com/guidebook/, 2019. Accessed March 2024.
- [36] M. A. Hearst, J. F. Allen, E. Horvitz, and C. I. Guinn. Trends & controversies: Mixed-initiative interaction. IEEE Intell. Syst., 14(5):14–24, 1999. doi: 10 . 1109/5254 . 796083
- [37] J. Heer. Agency plus automation: Designing artificial intelligence into interactive systems. Proc. Natl. Acad. Sci. U.S.A., 116(6):1844–1850, 2019. doi: 10 . 1073/PNAS . 1807184115
- [38] J. Heer, J. D. Mackinlay, C. Stolte, and M. Agrawala. Graphical histories for visualization: Supporting analysis, communication, and evaluation. IEEE TVCG, 14(6):1189–1196, 2008. doi: 10 . 1109/TVCG . 2008 . 137
- [39] F. Hohman, A. Head, R. Caruana, R. DeLine, and S. M. Drucker. Gamut: A design probe to understand how data scientists understand machine learning models. In Proc. ACM CHI. ACM, New York, 2019. doi: 10 . 1145/3290605 . 3300809
- [40] F. Hohman, M. Kahng, R. Pienta, and D. H. Chau. Visual analytics in deep learning: An interrogative survey for the next frontiers. IEEE TVCG, 25(8):2674–2693, 2019. doi: 10 . 1109/TVCG . 2018 . 2843369
- [41] F. Hohman, H. Park, C. Robinson, and D. H. P. Chau. Summit: Scaling deep learning interpretability by visualizing activation and attribution summarizations. IEEE TVCG, 26(1):1096–1106, 2019. doi: 10 . 1109/TVCG . 2019 . 2934659
- [42] M. N. Hoque, B. Ghai, and N. Elmqvist. DramatVis Personae: Visual text analytics for identifying social biases in creative writing. In Proc. ACM DIS, pp. 1260–1276, 2022. doi: 10 . 1145/3532106 . 3533526
- [43] M. N. Hoque, W. He, A. Shekar, L. Gou, and L. Ren. Visual concept programming: A visual analytics approach to injecting human intelligence at scale. IEEE TVCG, 29(01):74–83, 2023. doi: 10 . 1109/TVCG . 2022 . 3209466
- [44] M. N. Hoque, T. Mashiat, B. Ghai, C. Shelton, F. Chevalier, K. Kraus, and N. Elmqvist. The HaLLMark effect: Supporting provenance and transparent use of large language models in writing through interactive visualization. In Proc. ACM CHI, pp. 1–15. ACM, New York, 2024. doi: 10 . 1145/3613904 . 3641895
- [45] M. N. Hoque and K. Mueller. Outcome-Explorer: A causality guided interactive visual interface for interpretable algorithmic decision making. IEEE TVCG, 28(12):4728–4740, 2022. doi: 10 . 1109/TVCG . 2021 . 3102051
- [46] E. Horvitz. Principles of mixed-initiative user interfaces. In Proc. ACM CHI, pp. 159–166, 1999. doi: 10 . 1145/302979 . 303030
- [47] J. Huang, A. Mishra, B. C. Kwon, and C. Bryan. ConceptExplainer: Interactive explanation for deep neural networks from a concept perspective. IEEE TVCG, 29(1):831–841, 2023. doi: 10 . 1109/TVCG . 2022 . 3209384
- [48] IEEE Global Initiative on Ethics of Autonomous and Intelligent Systems. Ethically aligned design: A vision for prioritizing human well-being with autonomous and intelligent systems. Technical report, IEEE, 2017.
- [49] W. Javed and N. Elmqvist. ExPlates: Spatializing interactive analysis to scaffold visual exploration. Comput. Graph. Forum, 32(3):441–450, 2013. doi: 10 . 1111/CGF . 12131
- [50] Y. Jeon, S. Jin, P. C. Shih, and K. Han. FashionQ: An AI-driven creativity support tool for facilitating ideation in fashion design. In Proc. ACM CHI. ACM, New York, 2021. doi: 10 . 1145/3411764 . 3445093
- [51] F. Jiang, Y. Jiang, H. Zhi, Y. Dong, H. Li, S. Ma, Y. Wang, Q. Dong, H. Shen, and Y. Wang. Artificial intelligence in healthcare: past, present and future. Stroke Vasc. Neurol., 2(4):230–243, 2017. doi: 10 . 1136/svn-2017-000101
- [52] E. Jo, D. A. Epstein, H. Jung, and Y.-H. Kim. Understanding the benefits and challenges of deploying conversational ai leveraging large language models for public health intervention. In Proc. ACM CHI. ACM, New York, 2023. doi: 10 . 1145/3544548 . 3581503
- [53] A. Jobin, M. Ienca, and E. Vayena. The global landscape of AI ethics guidelines. Nat. Mac. Intell., 1(9):389–399, 2019. doi: 10 . 1038/s42256-019-0088-2
- [54] M. Jordan. Artificial Intelligence – The Revolution Hasn’t Happened Yet. https://medium.com/@mijordan3/5e1d5812e1e7, 2018.
- [55] M. I. Jordan and T. M. Mitchell. Machine learning: Trends, perspectives, and prospects. Science, 349(6245):255–260, 2015.
- [56] M. Kahng, N. Thorat, D. H. Chau, F. B. Viégas, and M. Wattenberg. GAN Lab: Understanding complex deep generative models using interactive visual experimentation. IEEE TVCG, 25(1):310–320, 2019. doi: 10 . 1109/TVCG . 2018 . 2864500
- [57] P. Kairouz et al. Advances and open problems in federated learning. Found. Trends Mach. Learn., 14(1-2):1–210, 2021. doi: 10 . 1561/2200000083
- [58] H. Kim, J. Choo, H. Park, and A. Endert. InterAxis: Steering scatterplot axes via observation-level interaction. IEEE TVCG, 22(1):131–140, 2016. doi: 10 . 1109/TVCG . 2015 . 2467615
- [59] M. Latonero. Governing artificial intelligence: Upholding human rights & dignity. Technical report, Data & Society Research Institute, Oct 2018.
- [60] Y. LeCun, Y. Bengio, and G. Hinton. Deep learning. Nature, 521(7553):436–444, 2015.
- [61] H.-P. Lee, Y.-J. Yang, T. S. von Davier, J. Forlizzi, and S. Das. Deepfakes, phrenology, surveillance, and more! a taxonomy of AI privacy risks. In Proc. ACM CHI, pp. 1–1. ACM, New York, 2024. doi: 10 . 1145/3613904 . 3642116
- [62] M. Lee, P. Liang, and Q. Yang. CoAuthor: Designing a Human-AI collaborative writing dataset for exploring language model capabilities. In Proc. ACM CHI, pp. 388:1–388:19. ACM, New York, 2022. doi: 10 . 1145/3491102 . 3502030
- [63] F.-F. Li. How to make A.I. that’s good for people. New York Times, Mar. 2018.
- [64] Q. V. Liao and J. W. Vaughan. AI transparency in the age of LLMs: A human-centered research roadmap. CoRR, abs/2306.01941, 2023. doi: 10 . 48550/ARXIV . 2306 . 01941
- [65] J. C. R. Licklider. Man-computer symbiosis. IRE Transactions on Human Factors in Electronics, HFE-1:4–11, 1960.
- [66] Y. Lin, H. Li, A. Wu, Y. Wang, and H. Qu. DMiner: Dashboard design mining and recommendation. IEEE TVCG, pp. 1–15, 2023. doi: 10 . 1109/TVCG . 2023 . 3251344
- [67] Z. C. Lipton. The mythos of model interpretability. Commun. ACM, 61(10):36–43, 2018. doi: 10 . 1145/3233231
- [68] C. Liu, Y. Guo, and X. Yuan. AutoTitle: An interactive title generator for visualizations. IEEE TVCG, pp. 1–12, 2023. doi: 10 . 1109/TVCG . 2023 . 3290241
- [69] S. M. Lundberg and S.-I. Lee. A unified approach to interpreting model predictions. In Proc. NeurIPS, p. 4768–4777, 2017.
- [70] J. McCarthy, M. Minsky, N. Rochester, and C. E. Shannon. A proposal for the Dartmouth summer research project on artificial intelligence, August 31, 1955. AI Magazine, 27(4):12–14, 2006. doi: 10 . 1609/AIMAG . V27I4 . 1904
- [71] Y. Ming, H. Qu, and E. Bertini. RuleMatrix: Visualizing and understanding classifiers with rules. IEEE TVCG, 25(1):342–352, 2019. doi: 10 . 1109/TVCG . 2018 . 2864812
- [72] P. Mirowski, K. W. Mathewson, J. Pittman, and R. Evans. Co-writing screenplays and theatre scripts with language models: Evaluation by industry professionals. In Proc. ACM CHI, pp. 355:1–355:34. ACM, New York, 2023. doi: 10 . 1145/3544548 . 3581225
- [73] T. Munzner. Visualization Analysis and Design. A K Peters, Boca Raton, FL, USA, 2014.
- [74] A. Newell and H. A. Simon. Computer science as empirical inquiry: Symbols and search. Commun. ACM, 19(3):113–126, 1976.
- [75] D. A. Norman. The Design of Everyday Things. Basic Books, New York, NY, USA, 1988.
- [76] Z. Obermeyer and S. Mullainathan. Dissecting racial bias in an algorithm that guides health decisions for 70 million people. In Proc. ACM FAccTA, p. 89. ACM, New York, 2019. doi: 10 . 1145/3287560 . 3287593
- [77] D. Park, S. Kim, J. Lee, J. Choo, N. Diakopoulos, and N. Elmqvist. ConceptVector: Text visual analytics via interactive lexicon building using word embedding. IEEE TVCG, 24(1):361–370, 2018. doi: 10 . 1109/TVCG . 2017 . 2744478
- [78] R. Pienta, F. Hohman, A. Endert, A. Tamersoy, K. Roundy, C. Gates, S. Navathe, and D. H. Chau. VIGOR: Interactive visual exploration of graph query results. IEEE TVCG, 24(1):215–225, 2018. doi: 10 . 1109/TVCG . 2017 . 2744898
- [79] M. T. Ribeiro, S. Singh, and C. Guestrin. "Why Should I Trust You?": Explaining the predictions of any classifier. In Proc. ACM KDD, p. 1135–1144, 2016. doi: 10 . 1145/2939672 . 2939778
- [80] C. Rudin. Stop explaining black box machine learning models for high stakes decisions and use interpretable models instead. Nat. Mac. Intell., 1(5):206–215, 2019. doi: 10 . 1038/s42256-019-0048-x
- [81] D. M. Russell. Simple is good: Observations of visualization use amongst the big data digerati. In Proc. ACM AVI, pp. 7–12. ACM, New York, 2016. doi: 10 . 1145/2909132 . 2933287
- [82] W. Samek, G. Montavon, A. Vedaldi, L. K. Hansen, and K.-R. Müller, eds. Explainable AI: Interpreting, Explaining and Visualizing Deep Learning, vol. 11700 of Lecture Notes in Computer Science. Springer Publishing, New York, NY, USA, 2019. doi: 10 . 1007/978-3-030-28954-6
- [83] M. Scaife and Y. Rogers. External cognition: how do graphical representations work? Int. J. Hum. Comput. Stud., 45(2):185–213, 1996. doi: 10 . 1006/IJHC . 1996 . 0048
- [84] R. R. Selvaraju, M. Cogswell, A. Das, R. Vedantam, D. Parikh, and D. Batra. Grad-CAM: Visual explanations from deep networks via gradient-based localization. In Proc. IEEE ICCV, pp. 618–626, 2017. doi: 10 . 1109/ICCV . 2017 . 74
- [85] L. Shen, Y. Zhang, H. Zhang, and Y. Wang. Data player: Automatic generation of data videos with narration-animation interplay. IEEE TVCG, 30(1):109–119, 2024. doi: 10 . 1109/TVCG . 2023 . 3327197
- [86] B. Shneiderman. Direct manipulation: A step beyond programming languages. Computer, 16(8):57–69, 1983. doi: 10 . 1109/MC . 1983 . 1654471
- [87] B. Shneiderman. The eyes have it: A task by data type taxonomy for information visualizations. In Proc. IEEE VL, pp. 336–343, 1996. doi: 10 . 1109/VL . 1996 . 545307
- [88] B. Shneiderman. Human-centered artificial intelligence: Reliable, safe & trustworthy. Int. J. Hum. Comput. Interact., 36(6):495–504, 2020. doi: 10 . 1080/10447318 . 2020 . 1741118
- [89] B. Shneiderman. Human-Centered AI. Oxford University Press, Oxford, United Kingdom, 2022.
- [90] H. Strobelt, S. Gehrmann, M. Behrisch, A. Perer, H. Pfister, and A. M. Rush. Seq2seq-Vis: A visual debugging tool for sequence-to-sequence models. IEEE TVCG, 25(1):353–363, 2019. doi: 10 . 1109/TVCG . 2018 . 2865044
- [91] The White House. Blueprint for an AI Bill of Rights. https://www.whitehouse.gov/ostp/ai-bill-of-rights/, 2023.
- [92] J. W. Tukey. Exploratory Data Analysis. Behavioral Science: Quantitative Methods. Addison-Wesley, 1977.
- [93] F. B. Viégas, M. Wattenberg, and K. Dave. Studying cooperation and conflict between authors with history flow visualizations. In Proc. ACM CHI, pp. 575–582, 2004. doi: 10 . 1145/985692 . 985765
- [94] P. Voigt and A. Von dem Bussche. The EU General Data Protection Regulation (GDPR): A Practical Guide. Springer Publishing, 2017.
- [95] C. Wang, J. Thompson, and B. Lee. Data Formulator: AI-Powered concept-driven visualization authoring. IEEE TVCG, 30(1):1128–1138, 2024. doi: 10 . 1109/TVCG . 2023 . 3326585
- [96] D. Wang, J. S. Olson, J. Zhang, T. Nguyen, and G. M. Olson. DocuViz: Visualizing collaborative writing. In Proc. ACM CHI, pp. 1865–1874. ACM, New York, 2015. doi: 10 . 1145/2702123 . 2702517
- [97] Q. Wang, Z. Xu, Z. Chen, Y. Wang, S. Liu, and H. Qu. Visual analysis of discrimination in machine learning. IEEE TVCG, 27(2):1470–1480, 2021. doi: 10 . 1109/TVCG . 2020 . 3030471
- [98] Y. Wang, Z. Jin, Q. Wang, W. Cui, T. Ma, and H. Qu. DeepDrawing: A deep learning approach to graph drawing. IEEE TVCG, 26(1):676–686, 2020. doi: 10 . 1109/TVCG . 2019 . 2934798
- [99] Z. J. Wang, R. Turko, O. Shaikh, H. Park, N. Das, F. Hohman, M. Kahng, and D. H. P. Chau. CNN Explainer: Learning convolutional neural networks with interactive visualization. IEEE TVCG, 27(2):1396–1406, 2021. doi: 10 . 1109/TVCG . 2020 . 3030418
- [100] J. Wexler, M. Pushkarna, T. Bolukbasi, M. Wattenberg, F. B. Viégas, and J. Wilson. The what-if tool: Interactive probing of machine learning models. IEEE TVCG, 26(1):56–65, 2020. doi: 10 . 1109/TVCG . 2019 . 2934619
- [101] M. Wieringa. What to account for when accounting for algorithms: a systematic literature review on algorithmic accountability. In Proc. ACM FAccTA, p. 1–18, 2020. doi: 10 . 1145/3351095 . 3372833
- [102] W. Willett, B. A. Aseniero, S. Carpendale, P. Dragicevic, Y. Jansen, L. Oehlberg, and P. Isenberg. Perception! Immersion! Empowerment! Superpowers as inspiration for visualization. IEEE TVCG, 28(1):22–32, 2022. doi: 10 . 1109/TVCG . 2021 . 3114844
- [103] S. Xiao, S. Huang, Y. Lin, Y. Ye, and W. Zeng. Let the chart spark: Embedding semantic context into chart with text-to-image generative model. IEEE TVCG, 30(1):284–294, 2024. doi: 10 . 1109/TVCG . 2023 . 3326913
- [104] Z. Xiao, T. W. Li, K. Karahalios, and H. Sundaram. Inform the uninformed: Improving online informed consent reading with an AI-powered chatbot. In Proc. ACM CHI, pp. 112:1–112:17. ACM, New York, 2023. doi: 10 . 1145/3544548 . 3581252
- [105] J. N. Yan, Z. Gu, H. Lin, and J. M. Rzeszotarski. Silva: Interactively assessing machine learning fairness using causality. In Proc. ACM CHI, p. 1–13. ACM, New York, 2020. doi: 10 . 1145/3313831 . 3376447
- [106] J. S. Yi, Y. ah Kang, J. Stasko, and J. Jacko. Toward a deeper understanding of the role of interaction in information visualization. IEEE TVCG, 13(6):1224–1231, 2007. doi: 10 . 1109/TVCG . 2007 . 70515
- [107] P. Zhang, C. Li, and C. Wang. VisCode: Embedding information in visualization images using encoder-decoder network. IEEE TVCG, 27(2):326–336, 2021. doi: 10 . 1109/TVCG . 2020 . 3030343