Coherent Control of an Optical Quantum Dot Using Phonons and Photons
Abstract
Genuine quantum-mechanical effects are readily observable in modern optomechanical systems comprising bosonic (“classical”) optical resonators. Such systems have enabled laser-cooling of mesoscopic objects, generation of squeezed light, and the conversion of photons between microwave and optical modes. Here we demonstrate unique advantages of optical two-level systems, or qubits, for optomechanics. The qubit state can be coherently controlled using an immense variety of driving schemes including both phonons and resonant or detuned photons. We experimentally demonstrate this using charge-controlled InAs quantum dots (QDs) in surface-acoustic-wave resonators. Time-correlated single-photon counting measurements reveal the control of QD population dynamics using engineered optical pulses and mechanical motion. As a first example, we show how this can improve signal-to-background scattering in microwave-to-optical transduction processes. Specifically, we tailor the scheme so that mechanically assisted photon scattering is enhanced over the direct detuned photon scattering from the optical system. These differences are greatly amplified by strategic temporal pulse shaping. Quantum-mechanical calculations show good agreement with our experimental results and provide guidance for adapting these schemes to small phonon occupancies relevant for microwave-to-optical quantum transduction.
Optomechanics underlies major technological advancements ranging from single particle and atom trapping [1] to gravitational-wave detection [2, 3]. As detection sensitivities and fabrication capabilities have improved, cavity optomechanics has been extended to explore and exploit more subtle quantum-mechanical effects [2, 4], enabling laser-cooling of mesoscopic objects [5, 6, 7, 8], new sources of squeezed light [9], transduction between microwaves and optical light [10, 11, 12, 13, 14, 7, 15], and entanglement between optical and mechanical [16, 17] or optical and microwave modes [18, 19]. Notably, all such previous demonstrations have exploited bosonic (“classical”) optical resonators, for example, whispering-gallery-mode resonators [5], Fabry-Perot resonators [10, 8], and photonic-crystal nanobeams [6, 11, 12, 13, 19, 15]; their purpose is essentially to confine the optical field to the region where the optomechanical interaction occurs, or to enforce frequency-dependent optical admittances that depend sensitively on mechanical motion. For applications where single-quantum interactions are most relevant, such as quantum microwave-optical transduction, single-phonon generation [20] or single-photon generation [21], optical two-level systems (TLSs) — appropriately referred to as qubits — may be beneficial because they inherently limit optical interactions to single-photon levels. They also enable coherent control schemes that are not possible in bosonic optical resonators. Optical TLSs and related three-level systems can resonantly couple with mechanical modes, offering potential routes to efficient optomechanical cooling and phonon “lasing” [22].
Semiconductor quantum dots (QDs) are excellent realizations of optical TLSs [23, 24], exhibiting nearly gigahertz emission rates, near-unity quantum yields, near-transform-limited linewidths, high single-photon purity and high single-photon indistinguishability [25]. They have been used to generate nonclassical states of light [26], spin-photon entanglement [27, 28, 29], and photon-photon entanglement [30, 31]. Demonstrations of unconventional coherent excitation schemes using two ultrafast red-detuned laser pulses highlight the remarkable degree of control possible with QDs [21, 32]. Recent efforts involve integrating QDs into larger multifunctional hybrid quantum systems [33, 34, 35, 36]. QDs and other solid-state quantum emitters, e.g., diamond color centers, have more recently been explored as light-matter intermediaries in quantum optomechanical systems [22, 37, 38, 39, 40, 41, 42, 43, 44, 45, 46, 47, 48]. Oscillations between excited orbital states in diamond color centers have been observed using multi-phonon processes and introduced as a method for dynamically mitigating decoherence [49]. To date, we know of no demonstrations of coherent optical and mechanical control of a coupled QD-phonon system. Such an effect could be used to improve signal-to-background performance in applications such as microwave-to-optical transduction by controlling the probabilities of direct-excitation scattering compared to phonon-assisted scattering from the QD. These same methods may be immediately applied to “swing-up” schemes to coherently prepare the QD’s exciton (biexciton) state for single-photon (entangled-photon) generation using a single nonresonant pump which can then be spectrally filtered [50].
Here, we use frequency- and time-tailored optical pulses, driven surface acoustic wave (SAW) cavity phonons, and time-domain optical measurements to experimentally demonstrate phonon-assisted coherent dynamics in a single QD. That is, QD excitation dynamics are controlled using both phonons and photons. Mechanical motion has large effects on TLS trajectories up to approximately 1 ns after the onset of optical driving, even after substantial radiative relaxation. As a first example — relevant to microwave-to-optical transduction — we show that optical pulse shapes and durations can be optimized such that phonon-assisted scattering is substantially enhanced compared to background scattering from direct detuned excitation. Quantum-mechanical calculations show good agreement with experiment, together indicating that large signal-to-background improvements are possible in these systems with optimized pulse shaping and device performance. There is no analogue in optomechanical systems comprising classical optical resonators.
I Visualizing phonon-assisted TLS dynamics
Current realizations of hybrid QD-mechanical systems are operated at timescales much longer than relevant dephasing times, i.e. via continuous-wave (CW) pumping [41, 42, 34, 43, 47], or with nonresonant optical pumping [51, 38, 44], and therefore these coherent properties are obscured. In a few cases, unique TLS signatures have been observed through second-order photon correlation measurements [41, 47]. Dynamics in phonon-assisted scattering have been observed, but the optical TLS coherence was not exploited or explored [42]. In the CW case, the QD merely plays a role analogous to the optical resonators in the above-mentioned bosonic systems. In fact, the two-level nature of the QD could even be considered a disadvantage in these cases, as saturation can occur under the strong optical pumping required to get significant optomechanical coupling rates. This is remedied by using short optical pulses and well-known coherent control methods, as we show here.
Our system comprises a single optical QD with transition frequency subject to an optical drive (frequency =+ with detuning ) in a single-mode SAW cavity (frequency ). The SAW strain field parametrically modulates the QD’s frequency via deformation potential coupling [52, 37, 53, 54]. This coupling is described by a rate , leading to an instantaneous QD frequency +. Importantly, this phonon-induced frequency modulation leads to discernible variations in the TLS occupancy when the QD is optically driven (Fig. 1). In practice, an optimized pulse shape would be developed to prepare the TLS in a desired state, then successive processes would be triggered on photons collected after this pulse. A more detailed theoretical description of this system is provided in Methods and in the Supplementary Information.
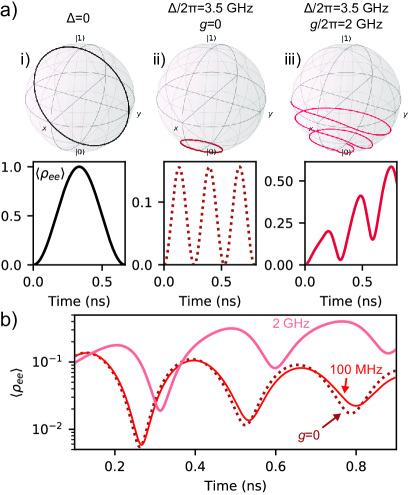
To illustrate our scheme, consider the TLS trajectories under three distinct excitation conditions (Fig. 1a) generated with a simple theoretical model. We show: ) resonant optical pumping (=0), ) red-detuned (=) optical pumping without phonons (=0), and ) red-detuned (=) optical pumping with phonons ( of order megahertz or gigahertz). In the elementary case of resonant pumping, the QD state traces closed circles around a vertical equator of the Bloch sphere and the occupancy, , exhibits traditional Rabi oscillations at frequency . As we introduce a detuning, the QD’s state again traces closed circles around the Bloch sphere at the generalized Rabi frequency =, albeit staying much closer to the south pole (ground state). The maximum occupancy depends on the ratio and remains much smaller than one in the cases considered here. With a phononic coupling, the dynamics are qualitatively different from both previous cases. The acoustic field perturbs the trajectory from case , generally increasing the QD’s occupancy while the optical drive remains active. The QD occupancy can in principle reach unity given enough time and assuming slow dephasing with appropriate combinations of and [50]. The difference in occupancies is theoretically apparent with as small as 100 MHz, even when radiative relaxation is included in the calculations (Fig. 1b). Previous work has reported single-phonon optomechanical coupling rates as large as 1-3 MHz [44, 47] wherein the effects demonstrated here should thus readily be observable with phonons. In our experiments we use large SAW cavities with small 10 kHz. Nonetheless, = reaches 1 GHz with phonon occupancies of which we readily achieve with modest external microwave driving powers of approximately dBm (Supplementary Information).
II Characterizing basic device performance
A fabricated QD-SAW optomechanical device is shown in Fig. 2a. Complete fabrication details are described in ref [46]. SAWs are confined between two acoustic mirrors forming an acoustic Fabry-Perot cavity at frequency 3.5 GHz with a quality factor 20,000 and finesse 130. The cavity both enhances the QD-SAW interaction compared to that on a bare surface [43] and allows us to parameterize the QD-SAW interaction by the single-phonon coupling rate and equilibrium phonon number . The SAW cavity mode is coherently populated with phonons by driving an interdigital transducer (IDT) with an external microwave source.
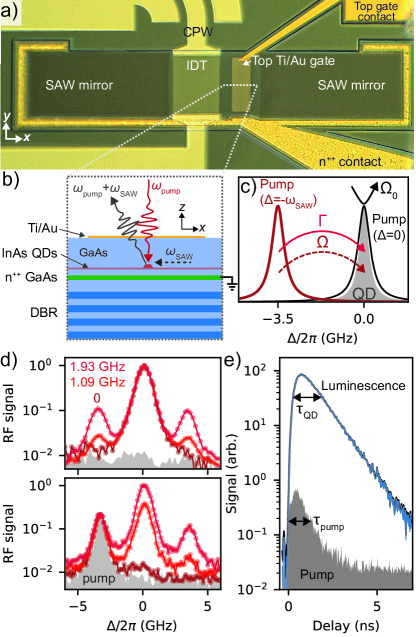
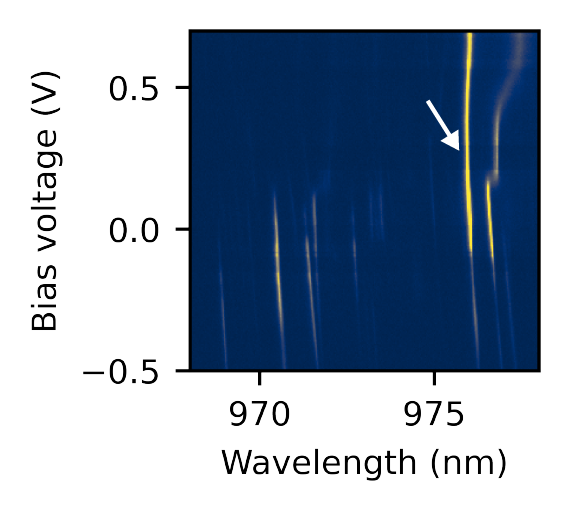
For good QD performance, QDs are electrostatically stabilized and controlled by a vertical diode (Fig. 2b) [55, 46]. This enables tuning of the QD’s charge state and wavelength with applied gate bias voltage (Supplementary Information) [56, 57] and reduces QD absorption linewidths to 350 MHz in best cases [58, 59, 57]. Under CW (narrowband) pumping, direct and phonon-assisted excitation can be fairly well isolated by changing the pump frequency. Under pulsed pumping, the increased pump bandwidth makes it more difficult to isolate these processes spectrally (Fig. 2c), but it opens the new possibility of coherent population control through pulse tuning as we next demonstrate.
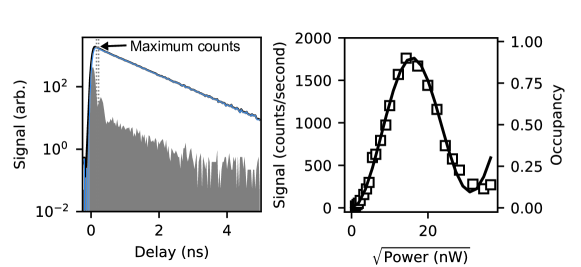
We interrogate a singly charged QD at 975.934 nm with an approximately 800 MHz linewidth (full width at half maximum) measured over a timescale of several seconds. This broadening beyond the radiative lifetime limit is likely due to slow (sub-MHz) spectral wandering [60, 59], as we will describe in more detail in a later section. Nonetheless, our system satisfies the condition — known as the resolved-sideband regime — as verified by measuring the absorption (Fig. 2d; top panel) and scattering spectra (Fig. 2d; bottom panel) of the single QD under SAW modulation. Well-defined spectral sidebands at = correspond to single-phonon-assisted optical scattering from the QD [52, 61, 43]. Our main optical measurements involve exciting the QD with frequency-tuned and time-tailored optical pulses (Methods). A CW pump with variable detuning originates from a narrow-linewidth (10 kHz) laser. Pulses with durations of approximately 1 ns are generated by passing the CW pump through two electro-optic modulators and a tunable spectral filter (Methods). The time distribution of scattered photons is resolved using time-correlated single-photon counting techniques, as illustrated in Fig. 2e.
III Resolving phonon-assisted excitation dynamics
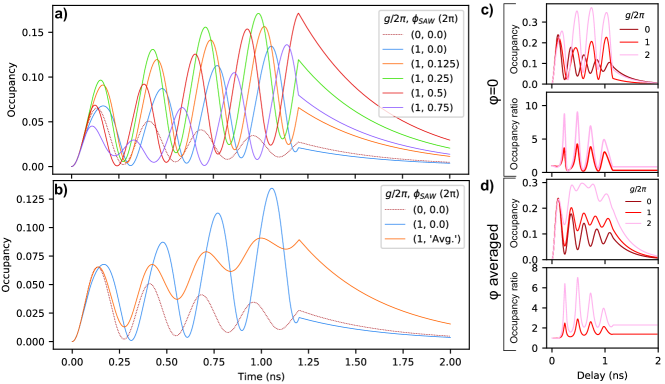
The long (1 ns) pulse duration allows us to directly observe, within approximately 10 seconds, the QD’s average population dynamics as the QD emits photons at random times during each pulsed-excitation event. These time-domain traces of the QD’s dynamics are each composed of several million photon detection events (Methods). Series of such measurements under red-detuned (=) pumping with varying between approximately 0 (only thermal occupancy) and 2 GHz are shown in Figs. 3a-b. Measured count rates are converted to estimated QD occupancies using a calibration procedure described in Supplementary Information. For the remainder of this article, we will refer to the ratio of occupancies as the “enhancement”, = where is the signal at time with coupling rate . This enhancement measures how well the presence or absence of phonons can be detected with the optical signal.
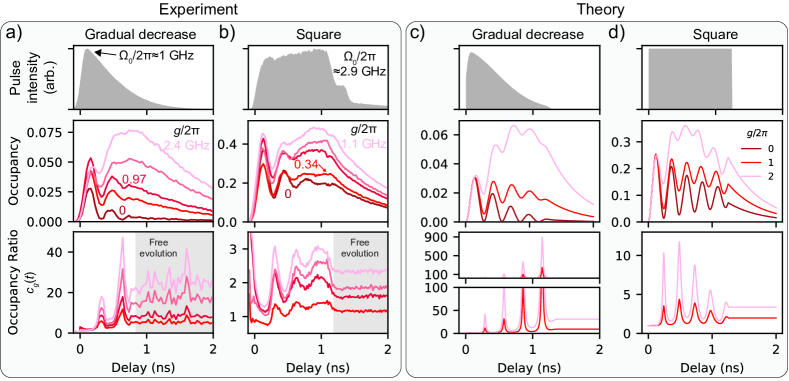
We first discuss results using a pulse with a gradually decreasing intensity (Fig. 3a). Experimentally measured pulse shapes are shown in the top panels. The QD occupancy (Fig. 3a: center panel) with no added phonons (brown curve) shows several Rabi oscillations at frequency , which is dominated by the detuning. Obvious changes in the dynamics are resolved when the SAW cavity is occupied such that = MHz (lowest red curve). These differences become more pronounced as increases, where the QD occupancy is estimated to reach 0.075 for = GHz at 800 ps. The data reveal that there are several pulse durations where phonon-assisted excitation (red curves) dominates substantially over the bare QD excitation (brown curve) — namely around 300 ps and 600 ps — largely governed by times when the bare QD occupancy swings down to approximately zero. These measured enhancements reach between 12 and 45 at 600 ps, depending on the SAW cavity occupancy (Fig. 3a; bottom panel). To illustrate the importance of the pulse shape on the measured enhancements, we perform a similar set of measurements using an (approximately) square optical pulse (Fig. 3b). Although obvious changes in the dynamics are again observed with as small as 340 MHz (bottom panel; red curve), the measured enhancements are considerably smaller than in the “exponential” pulse case, remaining near unity in all cases presented here.
The benefit of a gradually decreasing pulse intensity — as compared to a square pulse for example — becomes clear upon inspection of the bare QD dynamics. Numerical calculations of QD dynamics are presented in Figs. 3c-d, roughly corresponding to the two experimental cases shown in Figs. 3a-b (Methods). For a pulse with constant intensity (Fig. 3d; brown curve), the bare QD occupancy oscillates around and approaches a constant central value as radiative relaxation (or dephasing in general) proceeds. Consequently, successive minima in the bare QD’s occupancy grow increasingly large as the pulse continues. This behavior is also observed in our experiments (Fig. 3b). Enhancements remain smaller than 10 throughout the pulse duration. If the pulse intensity is instead gradually decreased soon after the onset, minima in the bare QD’s occupancy can grow increasingly close to zero over the pulse duration (Fig. 3c; brown curve). Enhancements thus increase over the course of the QD’s lifetime or longer, approaching maximum values near 1000 for 1 GHz at long times. Calculations presented in Fig. 3 assume radiative relaxation and no additional dephasing (Methods); the effect of additional dephasing is discussed in the next section.
In our measurements, successive detection events sample different mechanical phases , and so the occupancies shown in Fig. 3a,b represent the dynamics averaged over all such phases. Calculations shown in Figs. 3c,d are thus averaged over this phase. While does affect the specific trajectory, it has only a weak effect on the shape and magnitude of which is our primary concern here (Supplementary Information). This scenario would in fact be relevant for, e.g., single-mode quantum microwave-to-optical transduction where the relevant phonon Fock states do not carry a well-defined phase. For applications where the specific trajectory should be well controlled, for example in the above-mentioned “swing-up” scheme, one can synchronize the mechanical drive phase with the onset of the optical pump [50].
IV Comparing pulsed and CW pumping schemes
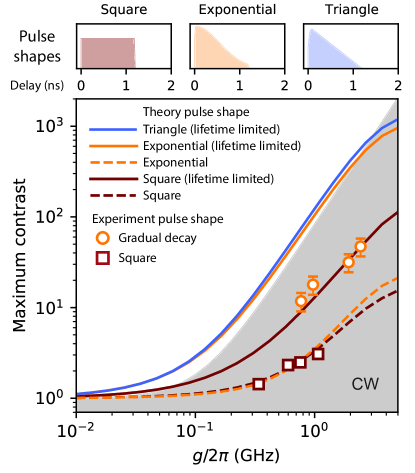
Fig. 4 summarizes our experimental (open markers) and numerical (solid/dashed curves) results, where we plot maximal enhancements as a function of . We theoretically consider three idealized and simple pulse shapes — square, “exponential”, and triangle, as illustrated in the top panels — and TLSs with both radiative relaxation only (solid curves) and additional pure dephasing (dashed curves); see Methods. “Exponential” and “square” correspond approximately to our two experimental cases, “exponential” referring to the exponentially decaying tail. With optical pulse lengths comparable to the TLS lifetime of 1 ns, triangular and “exponential” pulse shapes provide very similar performance, and both provide approximately ten-fold greater maximal enhancement than square pulses. The importance of both (1) a gradually decreasing pulse intensity and (2) lifetime-limited TLS dephasing are clear. Additional dephasing over timescales comparable to the QD lifetime — and thus the pulse duration — rapidly reduces maximal enhancements. Our experimental results evidence some form of dephasing in addition to radiative decay. Nonetheless, the experimentally obtained improvement between pulse shapes corresponds well to the ten-fold improvement seen in calculations. This suggests that our results are limited by slow spectral fluctuations rather than pure dephasing at the timescale of the QD’s lifetime. That is, our experimental occupancies are slightly “smeared” as the detuning effectively varies between successive detection events. This will be largely alleviated by investigating QDs with narrower measured linewidths.
We also compare these time-domain results to a steady-state case where a CW pump illuminates the TLS with = (gray filled region). Here, phonon assisted (direct) scattering occurs at a rate = (=) and we plot =, analogous to the time-domain calculations [62, 63, 2]. This CW case is formally also the behavior expected for a classical optical resonator, although the scattering is generally associated with different spectral components. Note that this approximation is valid for . Nonetheless, this is indeed the regime where the coherent control schemes available with a TLS show the largest benefits. Note that for any pulse shape, the signal approaches zero as the optomechanical interaction rate approaches zero. Nonetheless, triangular and exponential pulses show the greatest performance improvements compared to CW pumping when 50 MHz which is likely to be relevant for modern and future quantum applications [13, 18].
V Discussion
We experimentally demonstrated how coherent optical control methods available with QD optomechanical systems can be exploited to enhance phonon-assisted scattering in applications such as microwave-to-optical transduction. Specifically, time-correlated single-photon counting measurements reveal excitation dynamics in a semiconductor QD that depend on the presence of microwave-frequency phonons. Pulse durations exist where background scattering from direct excitation is greatly reduced, improving the relative rate from phonon-assisted scattering. This signal-to-background ratio depends on the basic features of the optical pulse, including amplitude, detuning, shape, and phase. We explored three very simple distinct pulse shapes and demonstrated that pulses with a gradually decreasing intensity are beneficial. More complicated pulse shapes involving frequency, amplitude and phase shaping may be developed to further improve the performance.
More generally, this work shows that with the QD, new parameters are available for interacting with the mechanical system. For example, in addition to pump intensity, the performance now depends on details of the varying pump — including the amplitude and phase (not explored in this work) — at nanosecond timescales. In fact, with this time-domain control, there is no fundamental reason for matching the detuning to the mechanical mode frequency as is needed with bosonic resonators [2]. Using additional detuned pumps may offer another level of control, similar to previously demonstrated “swing-up” schemes [21, 32, 50]. Since the QD’s lifetime sets the timescale of state preparation and readout, average optical pump powers used for these protocols are at the nanowatt scale and this optical power is not stored in a resonator, reducing absorption-induced heating which is a major concern in optomechanical crystals [64, 13, 18].
Comparing our experimental results to numerical calculations suggests that our measured QD experiences slow spectral fluctuations that decrease the experimentally obtained enhancements. This is likely reflected in our measured QD linewidth of 800 MHz, but additional characterization would be needed to disentangle pure dephasing at the timescale of the QD’s lifetime from slow (sub-MHz) spectral wandering [60]. Modern optimized charge-controlled QDs regularly exhibit near-lifetime-limited linewidths [59, 57, 65], and we thus anticipate that performance comparable to our idealized numerical calculations is possible. Overall improved performance is anticipated from p-i-n charge-controlled QDs which offer greater charge and frequency stability, greater optical pumping efficiency, higher photon collection efficiency, and reduced pump background. Although our numerical calculations do not take into account the finite pump bandwidth, this is likely to play only a small role in experiments since the ideal pulse durations are longer than 1 ns, corresponding to transform-limited bandwidths of 350 MHz which are small compared to our detuning of 3.5 GHz. Larger issues likely arise from small polarization drifts in the experimental system which may change the field amplitude and temporal pulse shape that the QD experiences over the course of the 30-60 second integration times used in our experiments. Future efforts should involve optimizing QD performance in application-relevant mechanical resonators and exploring the broad parameter space of optical pumping schemes for improving the enhancements described here.
VI Acknowledgements
We thank Emanuel Knill for informative discussions and intellectual support related to this work.
VII Author Contributions
R.A.D., A.K., and K.L.S. conceived and designed the experiments. R.A.D. performed the measurements and analyzed the data. All authors contributed materials and analysis tools. R.A.D. and K.L.S. wrote the paper with input from all other authors.
VIII Methods
VIII.1 System Hamiltonian
The Hamiltonian describing our system, in a frame rotating with the optical pump at frequency , is given by
| (1) |
where , and describe the pump-QD detuning, the resonant Rabi rate, and QD-SAW coupling, respectively. is taken to be a real-valued function with a time dependence that describes the optical pulse envelope. We numerically calculate the dynamics of the system, described by Eqn. 1, using the Lindblad master equation with the open-source Python library QuTiP. Radiative decay is included through the Lindblad operator with rate . Additional pure dephasing is included through the Lindblad operator with rate . The rates and are specified in the manuscript where relevant. Further details are provided in the Supplementary Information.
VIII.2 Experimental Setup
All of our QD optical measurements were performed using a 5 K optical cryostat with an internal cryogenic 0.81 NA objective. The resonant pump beam is shaped outside the cryostat using single-mode optical fiber components and free-space optical components. The resonant pump beam was a tunable external-cavity diode laser with a 10 kHz linewidth. Pump beams illuminate the QD through the objective. QD luminescence was collected by the same objective and isolated from the pump predominantly by spectral filtering (for measurements involving a nonresonant pump) or polarization filtering (for measurements involving a resonant pump) with at least 106 pump rejection. Luminescence was collected into single-mode optical fiber and various frequency- and time-domain measurements were performed using procedures detailed below. The QD bias voltage was held constant for all measurements shown in the manuscript. The QD emission wavelength (and therefore the resonant pump wavelength) used in this work was 975.934 nm.
VIII.3 Continuous-wave Resonance Fluorescence Spectra
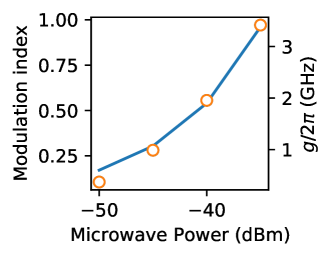
Continuous-wave (CW) resonance fluorescence (RF) spectra (e.g. Fig. 2) were recorded by slowly sweeping the frequency of a tightly focused resonant pump beam over the QD’s exciton resonance while holding the QD bias constant. Luminescence counts at each frequency were recorded using a superconducting nanowire single photon detector (SNSPD) mounted in a dilution refrigerator. A pump power of approximately 2 nW at the sample was used, corresponding to approximately 1/10 the measured saturation level of the QD. For manuscript Fig. 2d (upper panel), such spectra were recorded without SAW driving and with SAW driving using an external coherent microwave source at approximately 3.518 GHz and external microwave driving powers between -50 dBm and -35 dBm. External microwave driving powers were converted to coupling rates by a series of calibration data where the modulation index was fit for each microwave driving power and was derived by the relationship =. The calibration data are shown in the Supplementary Information.
For manuscript Fig. 2d (lower panel), the “resonant” pump was held at a constant frequency detuning of =. A pump power of approximately 5 nW was used. The frequency spectrum of scattered photons was measured by passing the collection port through a tunable Fabry-Perot etalon filter with a 600 MHz linewidth before being counted on an SNSPD. In manuscript Fig. 2d (lower panel), such spectra were again measured without SAW driving and with SAW driving at 3.518 GHz and the same powers as in manuscript Fig. 2d (upper panel).
VIII.4 Pulsed Optical Measurements and Time-domain QD Dynamics
The time evolution of the QD dynamics was measured using standard time-correlated single-photon counting (TCSPC) techniques with a two-channel picosecond event timer and TCSPC module. For “exponential” decaying pulses, optical pulses were generated by passing a CW “resonant” optical pump (same as described above) through two cascaded electro-optic modulators (EOMs). The EOMs were driven by amplified pulses from an approximately 100-ps square-wave electronic pulse generator (EPG). The EPG was externally triggered using an arbitrary waveform generator (AWG) at 38 MHz. The rise time, fall time and width of the output pulses were measured to be approximately 15 ps, 15 ps, and 130 ps respectively. The on/off contrast was measured to be better than . The frequency bandwidth of the output pulses was measured to be 7 GHz. To decrease the bandwidth (and increase the pulse duration), the pulses were transmitted through a 600 MHz tunable Fabry-Perot etalon which was tuned for maximum transmission at the pulse’s center frequency. For square pulses, the EOMs were directly driven using a high-speed AWG (64 GS/sec) with approximately 30 ps rise time and pulses of arbitrary length. The pulse center frequency was detuned by with respect to the QD’s resonance frequency (detuning specified in each measurement). Measured pulse profiles shown in the manuscript were from the reflected signal and may contain system reflections that don’t illuminate the QD. That is, the pulse profile experienced by the QD may differ slightly from what we measured. This may partially account for the onset of the QD’s free evolution around 800 ps in Fig. 3a although the measured pulse continues beyond this time.
The time distribution of the QD luminescence was measured by again detecting the luminescence with an SNSPD and time-correlating the counts on the TCSPC module with respect to a trigger signal from the AWG. We typically used 30-60 second total integration times, over which we collected typically several million total photons. This type of measurement was performed with a wide range of average optical input powers (between approximately 0.25 nW to 1500 nW). Pump powers were converted to resonant Rabi rates by looking at the resulting time-domain oscillations.
The time-resolved QD dynamics shown in the manuscript are presented after subtracting the experimentally measured pump contribution (i.e. unrejected pump background). Count rates were converted to approximate excited state occupancies using a series of power-dependent calibration data where observed Rabi oscillations were compared to numerical calculations. This subtraction process and scaling process are further illustrated in the Supplementary Information.
References
- [1] A. Ashkin. Optical trapping and manipulation of neutral particles using lasers. Proceedings of the National Academy of Sciences 94, 10 4853–4860 (1997).
- [2] M. Aspelmeyer, T. J. Kippenberg, and F. Marquardt. Cavity optomechanics. Rev. Mod. Phys. 86, 4 1391–1452 (2014).
- [3] D. Blair, L. Ju, and Y. Ma. Optomechanics for Gravitational Wave Detection: From Resonant Bars to Next Generation Laser Interferometers. In P.-F. Cohadon, J. Harris, F. Marquardt, and L. Cugliandolo, editors, Quantum Optomechanics and Nanomechanics: Lecture Notes of the Les Houches Summer School: Volume 105, August 2015, p. 0. Oxford University Press (2020). ISBN 978-0-19-882814-3.
- [4] S. Barzanjeh, A. Xuereb, S. Gröblacher, M. Paternostro, C. A. Regal, and E. M. Weig. Optomechanics for quantum technologies. Nat. Phys. 18, 1 15–24 (2022).
- [5] A. Schliesser, R. Rivière, G. Anetsberger, O. Arcizet, and T. J. Kippenberg. Resolved-sideband cooling of a micromechanical oscillator. Nature Phys 4, 5 415–419 (2008).
- [6] J. Chan, T. P. M. Alegre, A. H. Safavi-Naeini, J. T. Hill, A. Krause, S. Gröblacher, M. Aspelmeyer, and O. Painter. Laser cooling of a nanomechanical oscillator into its quantum ground state. Nature 478, 7367 89–92 (2011).
- [7] B. Brubaker, J. Kindem, M. Urmey, S. Mittal, R. Delaney, P. Burns, M. Vissers, K. Lehnert, and C. Regal. Optomechanical Ground-State Cooling in a Continuous and Efficient Electro-Optic Transducer. Phys. Rev. X 12, 2 021062 (2022). Publisher: American Physical Society.
- [8] S. A. Saarinen, N. Kralj, E. C. Langman, Y. Tsaturyan, and A. Schliesser. Laser cooling a membrane-in-the-middle system close to the quantum ground state from room temperature. Optica, OPTICA 10, 3 364–372 (2023).
- [9] T. P. Purdy, P.-L. Yu, R. W. Peterson, N. S. Kampel, and C. A. Regal. Strong Optomechanical Squeezing of Light. Phys. Rev. X 3, 3 031012 (2013).
- [10] R. W. Andrews, R. W. Peterson, T. P. Purdy, K. Cicak, R. W. Simmonds, C. A. Regal, and K. W. Lehnert. Bidirectional and efficient conversion between microwave and optical light. Nature Phys 10, 4 321–326 (2014).
- [11] K. C. Balram, M. I. Davanço, J. D. Song, and K. Srinivasan. Coherent coupling between radiofrequency, optical and acoustic waves in piezo-optomechanical circuits. Nature Photon 10, 5 346–352 (2016).
- [12] M. Mirhosseini, A. Sipahigil, M. Kalaee, and O. Painter. Superconducting qubit to optical photon transduction. Nature 588, 7839 599–603 (2020).
- [13] M. Forsch, R. Stockill, A. Wallucks, I. Marinković, C. Gärtner, R. A. Norte, F. van Otten, A. Fiore, K. Srinivasan, and S. Gröblacher. Microwave-to-optics conversion using a mechanical oscillator in its quantum ground state. Nat. Phys. 16, 1 69–74 (2020).
- [14] N. J. Lambert, A. Rueda, F. Sedlmeir, and H. G. L. Schwefel. Coherent Conversion Between Microwave and Optical Photons—An Overview of Physical Implementations. Advanced Quantum Technologies 3, 1 1900077 (2020).
- [15] M. J. Weaver, P. Duivestein, A. C. Bernasconi, S. Scharmer, M. Lemang, T. C. v. Thiel, F. Hijazi, B. Hensen, S. Gröblacher, and R. Stockill. An integrated microwave-to-optics interface for scalable quantum computing. Nat. Nanotechnol. 19, 2 166–172 (2024).
- [16] R. Riedinger, S. Hong, R. A. Norte, J. A. Slater, J. Shang, A. G. Krause, V. Anant, M. Aspelmeyer, and S. Gröblacher. Non-classical correlations between single photons and phonons from a mechanical oscillator. Nature 530, 7590 313–316 (2016).
- [17] A. A. Rakhubovsky, D. W. Moore, U. Delić, N. Kiesel, M. Aspelmeyer, and R. Filip. Detecting Nonclassical Correlations in Levitated Cavity Optomechanics. Phys. Rev. Appl. 14, 5 054052 (2020).
- [18] W. Jiang, F. M. Mayor, S. Malik, R. Van Laer, T. P. McKenna, R. N. Patel, J. D. Witmer, and A. H. Safavi-Naeini. Optically heralded microwave photon addition. Nat. Phys. 19, 10 1423–1428 (2023).
- [19] S. Meesala, D. Lake, S. Wood, P. Chiappina, C. Zhong, A. D. Beyer, M. D. Shaw, L. Jiang, and O. Painter. Quantum entanglement between optical and microwave photonic qubits (2023). ArXiv:2312.13559 [physics, physics:quant-ph].
- [20] I. Söllner, L. Midolo, and P. Lodahl. Deterministic Single-Phonon Source Triggered by a Single Photon. Phys. Rev. Lett. 116, 23 234301 (2016).
- [21] T. K. Bracht, M. Cosacchi, T. Seidelmann, M. Cygorek, A. Vagov, V. M. Axt, T. Heindel, and D. E. Reiter. Swing-Up of Quantum Emitter Population Using Detuned Pulses. PRX Quantum 2, 4 040354 (2021).
- [22] K. V. Kepesidis, S. D. Bennett, S. Portolan, M. D. Lukin, and P. Rabl. Phonon cooling and lasing with nitrogen-vacancy centers in diamond. Phys. Rev. B 88, 6 064105 (2013).
- [23] P. Ester, S. Stufler, S. de Michaelis Vasconcellos, M. Bichler, and A. Zrenner. Ramsey fringes in a single InGaAs/GaAs quantum dot. physica status solidi (b) 243, 10 2229–2232 (2006).
- [24] D. Press, T. D. Ladd, B. Zhang, and Y. Yamamoto. Complete quantum control of a single quantum dot spin using ultrafast optical pulses. Nature 456, 7219 218–221 (2008).
- [25] P. Senellart, G. Solomon, and A. White. High-performance semiconductor quantum-dot single-photon sources. Nature Nanotech 12, 11 1026–1039 (2017).
- [26] R. Trivedi, K. A. Fischer, J. Vučković, and K. Müller. Generation of Non‐Classical Light Using Semiconductor Quantum Dots. Adv Quantum Tech 3, 1 1900007 (2020).
- [27] Z. Luo, S. Sun, A. Karasahin, A. S. Bracker, S. G. Carter, M. K. Yakes, D. Gammon, and E. Waks. A Spin–Photon Interface Using Charge-Tunable Quantum Dots Strongly Coupled to a Cavity. Nano Lett. 19, 10 7072–7077 (2019).
- [28] M. H. Appel, A. Tiranov, S. Pabst, M. L. Chan, C. Starup, Y. Wang, L. Midolo, K. Tiurev, S. Scholz, A. D. Wieck, A. Ludwig, A. S. Sørensen, and P. Lodahl. Entangling a Hole Spin with a Time-Bin Photon: A Waveguide Approach for Quantum Dot Sources of Multiphoton Entanglement. Phys. Rev. Lett. 128, 23 233602 (2022).
- [29] N. Coste, D. A. Fioretto, N. Belabas, S. C. Wein, P. Hilaire, R. Frantzeskakis, M. Gundin, B. Goes, N. Somaschi, M. Morassi, A. Lemaître, I. Sagnes, A. Harouri, S. E. Economou, A. Auffeves, O. Krebs, L. Lanco, and P. Senellart. High-rate entanglement between a semiconductor spin and indistinguishable photons. Nat. Photon. 17, 7 582–587 (2023).
- [30] Y. Chen, M. Zopf, R. Keil, F. Ding, and O. G. Schmidt. Highly-efficient extraction of entangled photons from quantum dots using a broadband optical antenna. Nat Commun 9, 1 2994 (2018).
- [31] J. Liu, R. Su, Y. Wei, B. Yao, S. F. C. d. Silva, Y. Yu, J. Iles-Smith, K. Srinivasan, A. Rastelli, J. Li, and X. Wang. A solid-state source of strongly entangled photon pairs with high brightness and indistinguishability. Nat. Nanotechnol. 14, 6 586–593 (2019).
- [32] Y. Karli, F. Kappe, V. Remesh, T. K. Bracht, J. Münzberg, S. Covre da Silva, T. Seidelmann, V. M. Axt, A. Rastelli, D. E. Reiter, and G. Weihs. SUPER Scheme in Action: Experimental Demonstration of Red-Detuned Excitation of a Quantum Emitter. Nano Lett. 22, 16 6567–6572 (2022).
- [33] P. Lodahl, S. Mahmoodian, and S. Stobbe. Interfacing single photons and single quantum dots with photonic nanostructures. Rev. Mod. Phys. 87, 2 347–400 (2015).
- [34] Y. Tsuchimoto, Z. Sun, E. Togan, S. Fält, W. Wegscheider, A. Wallraff, K. Ensslin, A. İmamoğlu, and M. Kroner. Large-bandwidth Transduction Between an Optical Single Quantum Dot Molecule and a Superconducting Resonator. PRX Quantum 3, 3 030336 (2022).
- [35] D. D. Bühler, M. Weiß, A. Crespo-Poveda, E. D. S. Nysten, J. J. Finley, K. Müller, P. V. Santos, M. M. de Lima, and H. J. Krenner. On-chip generation and dynamic piezo-optomechanical rotation of single photons. Nat Commun 13, 1 6998 (2022).
- [36] H. Larocque, M. A. Buyukkaya, C. Errando-Herranz, S. Harper, J. Carolan, C.-M. Lee, C. J. K. Richardson, G. L. Leake, D. J. Coleman, M. L. Fanto, E. Waks, and D. Englund. Tunable quantum emitters on large-scale foundry silicon photonics (2023). ArXiv:2306.06460 [physics, physics:quant-ph].
- [37] M. Schuetz, E. Kessler, G. Giedke, L. Vandersypen, M. Lukin, and J. Cirac. Universal Quantum Transducers Based on Surface Acoustic Waves. Phys. Rev. X 5, 3 031031 (2015).
- [38] M. Weiß and H. J. Krenner. Interfacing quantum emitters with propagating surface acoustic waves. J. Phys. D: Appl. Phys. 51, 37 373001 (2018).
- [39] S. Maity, L. Shao, S. Bogdanović, S. Meesala, Y.-I. Sohn, N. Sinclair, B. Pingault, M. Chalupnik, C. Chia, L. Zheng, K. Lai, and M. Lončar. Coherent acoustic control of a single silicon vacancy spin in diamond. Nat Commun 11, 1 193 (2020).
- [40] J. Kettler, N. Vaish, L. M. de Lépinay, B. Besga, P.-L. de Assis, O. Bourgeois, A. Auffèves, M. Richard, J. Claudon, J.-M. Gérard, B. Pigeau, O. Arcizet, P. Verlot, and J.-P. Poizat. Inducing micromechanical motion by optical excitation of a single quantum dot. Nat. Nanotechnol. (2020).
- [41] D. M. Lukin, A. D. White, R. Trivedi, M. A. Guidry, N. Morioka, C. Babin, O. O. Soykal, J. Ul-Hassan, N. T. Son, T. Ohshima, P. K. Vasireddy, M. H. Nasr, S. Sun, J.-P. W. MacLean, C. Dory, E. A. Nanni, J. Wrachtrup, F. Kaiser, and J. Vučković. Spectrally reconfigurable quantum emitters enabled by optimized fast modulation. npj Quantum Inf 6, 1 1–9 (2020).
- [42] D. Wigger, M. Weiß, M. Lienhart, K. Müller, J. J. Finley, T. Kuhn, H. J. Krenner, and P. Machnikowski. Resonance-fluorescence spectral dynamics of an acoustically modulated quantum dot. Phys. Rev. Research 3, 3 033197 (2021).
- [43] P. Imany, Z. Wang, R. A. DeCrescent, R. C. Boutelle, C. A. McDonald, T. Autry, S. Berweger, P. Kabos, S. W. Nam, R. P. Mirin, and K. L. Silverman. Quantum phase modulation with acoustic cavities and quantum dots. Optica 9, 5 501 (2022).
- [44] R. A. DeCrescent, Z. Wang, P. Imany, R. C. Boutelle, C. A. McDonald, T. Autry, J. D. Teufel, S. W. Nam, R. P. Mirin, and K. L. Silverman. Large Single-Phonon Optomechanical Coupling Between Quantum Dots and Tightly Confined Surface Acoustic Waves in the Quantum Regime. Phys. Rev. Applied 18, 3 034067 (2022).
- [45] T. Hahn, D. Groll, H. J. Krenner, T. Kuhn, P. Machnikowski, and D. Wigger. Photon scattering from a quantum acoustically modulated two-level system. AVS Quantum Science 4, 1 011403 (2022).
- [46] Z. Wang, R. A. DeCrescent, P. Imany, J. T. Bush, D. V. Reddy, S. W. Nam, R. P. Mirin, and K. L. Silverman. Gated InAs quantum dots embedded in surface acoustic wave cavities for low-noise optomechanics (2023). ArXiv:2312.10215 [physics, physics:quant-ph].
- [47] C. Spinnler, G. N. Nguyen, Y. Wang, L. Zhai, A. Javadi, M. Erbe, S. Scholz, A. D. Wieck, A. Ludwig, P. Lodahl, L. Midolo, and R. J. Warburton. A single-photon emitter coupled to a phononic-crystal resonator in the resolved-sideband regime (2023). ArXiv:2311.05342 [cond-mat, physics:physics, physics:quant-ph].
- [48] S. D. Patel, K. Parto, M. Choquer, N. Lewis, S. Umezawa, L. Hellman, D. Polishchuk, and G. Moody. Surface Acoustic Wave Cavity Optomechanics with Atomically Thin h-BN and WSe2 Single-Photon Emitters. PRX Quantum 5, 1 010330 (2024).
- [49] B. A. McCullian, V. Sharma, H. Y. Chen, J. C. Crossman, E. J. Mueller, and G. D. Fuchs. Coherent Acoustic Control of Defect Orbital States in the Strong-Driving Limit (2024). ArXiv:2403.10989 [cond-mat, physics:quant-ph].
- [50] M. Kuniej, M. Gawełczyk, and P. Machnikowski. Hybrid acousto-optical swing-up preparation of exciton and biexciton states in a quantum dot (2024). ArXiv:2402.07887 [cond-mat, physics:quant-ph].
- [51] O. D. D. Couto, S. Lazić, F. Iikawa, J. A. H. Stotz, U. Jahn, R. Hey, and P. V. Santos. Photon anti-bunching in acoustically pumped quantum dots. Nature Photon 3, 11 645–648 (2009).
- [52] M. Metcalfe, S. M. Carr, A. Muller, G. S. Solomon, and J. Lawall. Resolved Sideband Emission of InAs / GaAs Quantum Dots Strained by Surface Acoustic Waves. Phys. Rev. Lett. 105, 3 037401 (2010).
- [53] D. A. Golter, T. Oo, M. Amezcua, I. Lekavicius, K. A. Stewart, and H. Wang. Coupling a Surface Acoustic Wave to an Electron Spin in Diamond via a Dark State. Phys. Rev. X 6, 4 041060 (2016).
- [54] T. Aref, P. Delsing, M. K. Ekström, A. F. Kockum, M. V. Gustafsson, G. Johansson, P. J. Leek, E. Magnusson, and R. Manenti. Quantum Acoustics with Surface Acoustic Waves. In R. H. Hadfield and G. Johansson, editors, Superconducting Devices in Quantum Optics, Quantum Science and Technology, pp. 217–244. Springer International Publishing, Cham (2016). ISBN 978-3-319-24091-6.
- [55] A. Reigue, R. Hostein, and V. Voliotis. Resonance fluorescence of a single semiconductor quantum dot: the impact of a fluctuating electrostatic environment. Semicond. Sci. Technol. 34, 11 113001 (2019).
- [56] A. Högele, S. Seidl, M. Kroner, K. Karrai, R. J. Warburton, B. D. Gerardot, and P. M. Petroff. Voltage-Controlled Optics of a Quantum Dot. Phys. Rev. Lett. 93, 21 217401 (2004).
- [57] M. C. Löbl, I. Söllner, A. Javadi, T. Pregnolato, R. Schott, L. Midolo, A. V. Kuhlmann, S. Stobbe, A. D. Wieck, P. Lodahl, A. Ludwig, and R. J. Warburton. Narrow optical linewidths and spin pumping on charge-tunable close-to-surface self-assembled quantum dots in an ultrathin diode. Phys. Rev. B 96, 16 165440 (2017).
- [58] C. Matthiesen, A. N. Vamivakas, and M. Atatüre. Subnatural Linewidth Single Photons from a Quantum Dot. Phys. Rev. Lett. 108, 9 093602 (2012).
- [59] A. V. Kuhlmann, J. H. Prechtel, J. Houel, A. Ludwig, D. Reuter, A. D. Wieck, and R. J. Warburton. Transform-limited single photons from a single quantum dot. Nat Commun 6, 1 8204 (2015).
- [60] A. V. Kuhlmann, J. Houel, A. Ludwig, L. Greuter, D. Reuter, A. D. Wieck, M. Poggio, and R. J. Warburton. Charge noise and spin noise in a semiconductor quantum device. Nature Phys 9, 9 570–575 (2013).
- [61] M. Weiß, D. Wigger, M. Nägele, K. Müller, J. J. Finley, T. Kuhn, P. Machnikowski, and H. J. Krenner. Optomechanical wave mixing by a single quantum dot. Optica 8, 3 291 (2021).
- [62] R. Loudon. The Quantum Theory of Light. Oxford University Press, Oxford, New York, third edition, third edition edition (2000). ISBN 978-0-19-850176-3.
- [63] E. B. Flagg, A. Muller, J. W. Robertson, S. Founta, D. G. Deppe, M. Xiao, W. Ma, G. J. Salamo, and C. K. Shih. Resonantly driven coherent oscillations in a solid-state quantum emitter. Nature Phys 5, 3 203–207 (2009).
- [64] S. M. Meenehan, J. D. Cohen, S. Gröblacher, J. T. Hill, A. H. Safavi-Naeini, M. Aspelmeyer, and O. Painter. Silicon optomechanical crystal resonator at millikelvin temperatures. Phys. Rev. A 90, 1 011803 (2014).
- [65] N. Tomm, A. Javadi, N. O. Antoniadis, D. Najer, M. C. Löbl, A. R. Korsch, R. Schott, S. R. Valentin, A. D. Wieck, A. Ludwig, and R. J. Warburton. A bright and fast source of coherent single photons. Nat. Nanotechnol. (2021).
Supplementary Information
1 System Hamiltonian
Our system comprises a two-level system (TLS) with frequency driven at optical frequency with a coupling (Rabi) rate . The TLS frequency is modulated at microwave frequency with a modulation depth =. The Hamiltonian is:
| (2) |
We transform into a frame rotating about the TLS’s axis at the pump frequency using the unitary operator =. The transformed Hamiltonian =, after applying the rotating-wave approximation for frequencies and identifying the pump-TLS detuning =, is:
| (3) |
We have allowed to adopt a time dependence which describes the optical pulse envelope. Formally, Eqn. 2 assumes that the time variation of is slow enough that the resulting spectral distribution remains small compared to the detuning so that the optical drive can be approximated as monochromatic. Experimentally, we enforce this using long pulses and/or spectral filters. We additionally assume that is a real-valued function. In general, pulse shaping will cause the pulse amplitude to become complex which may affect the specific TLS trajectories.
We numerically calculate the dynamics of the system, described by Eqn. 2, using the Lindblad master equation for the density matrix :
| (4) |
with collapse operators = and rates . Radiative decay is included through the Lindblad operator with rate . Additional pure dephasing is included through the Lindblad operator with rate . Note that “slow” spectral fluctuations — those occurring over timescales significantly longer than the QD’s lifetime — affect the measured TLS trajectories in a qualitatively different way than pure dephasing. We did not account for such spectral fluctuations in our calculations. Calculations are performed using the open-source Python library QuTiP.
The mechanical phase affects the specific trajectory around the Bloch sphere. As described in the manuscript, our measurements sample many instances of and so the presented occupancy dynamics represent averages over all . Calculations shown in manuscript Figs. 3c-d account for this by averaging calculated trajectories over eight uniformly spaced values of ranging from 0 to . Figs. S1a,b illustrate how the trajectory changes with (panel a), and also the result of averaging over these trajectories (panel b). Figs. S1c,d show that this averaging has only weak effects on the occupancy ratio although the specific dynamics are changed.
2 Experimental Setup
All of our QD optical measurements were performed using a 5 K optical cryostat with an internal cryogenic 0.81 NA objective. Nonresonant and resonant pump beams were shaped outside the cryostat using single-mode optical fiber components and free-space optical components. The resonant pump beam was a tunable external-cavity diode laser with an approximately 10 kHz linewidth at 970 nm. The nonresonant pump was a 632 nm diode laser. Pump beams illuminate the QD through the objective. QD luminescence was collected by the same objective and isolated from the pump predominantly by spectral filtering (for measurements involving a nonresonant pump) or polarization filtering (for measurements involving a resonant pump) with at least 106 pump rejection. Luminescence was collected into single-mode optical fiber and various frequency- and time-domain measurements were performed using procedures detailed below. The QD bias voltage was held constant for all measurements except for Fig. 2c of the manuscript.
2.1 Bias-dependent QD Photoluminescence Spectra
QDs were illuminated with nonresonant pump light. Photoluminescence (PL) was collected into a single-mode fiber and reflected pump light was spectrally rejected. Pump powers were kept well below saturation levels. PL was sent to a spectrometer and recorded with a CCD camera. The QD bias was varied in discrete steps while repeated integrations were performed. Spectra were stitched together in post-processing. The bias-dependent PL spectrum from the QD interrogated in the manuscript is shown in Fig. S2.
2.2 Continuous-wave Resonance Fluorescence Spectra
Continuous-wave (CW) resonance fluorescence (RF) spectra (e.g. manuscript Fig. 2a) were recorded by slowly sweeping the frequency of a tightly focused resonant pump beam over the QD’s exciton resonance while holding the QD bias constant. Luminescence counts at each frequency were recorded using a superconducting nanowire single photon detector (SNSPD) mounted in a dilution refrigerator. A pump power of approximately 2 nW at the sample was used, corresponding to approximately 1/10 the measured saturation level of the QD. For manuscript Fig. 2d (upper panel), such spectra were recorded without SAW driving and with SAW driving using an external coherent microwave source at approximately 3.518 GHz and external microwave driving powers between -50 dBm and -35 dBm. External microwave driving powers were converted to coupling rates by a series of calibration data where the modulation index was fit for each microwave driving power and was derived by the relationship =. The calibration data are shown in Fig. S3.
For manuscript Fig. 2d (lower panel), the “resonant” pump was held at a constant frequency detuning of =. A pump power of approximately 5 nW was used. The frequency spectrum of scattered photons was measured by passing the collection port through a tunable Fabry-Perot etalon filter with a 600 MHz linewidth before being counted on an SNSPD. In manuscript Fig. 2d (lower panel), such spectra were again measured without SAW driving and with SAW driving at 3.518 GHz and the same powers as in manuscript Fig. 2d (upper panel).
2.3 Pulsed Optical Measurements and Time-domain QD Dynamics
The time evolution of the QD dynamics was measured using standard time-correlated single-photon counting (TCSPC) techniques with a two-channel picosecond event timer and TCSPC module. For “exponential” decaying pulses, optical pulses were generated by passing a CW “resonant” optical pump (same as described above) through two cascaded electro-optic modulators (EOMs). The EOMs were driven by amplified pulses from an approximately 100-ps square-wave electronic pulse generator (EPG). The EPG was externally triggered using an arbitrary waveform generator (AWG). The rise-time, fall-time and width of the output pulses were measured to be approximately 15 ps, 15 ps, and 130 ps respectively. The on/off contrast was measured to be better than . The frequency bandwidth of the output pulses was measured to be 7 GHz. To decrease the bandwidth (and increase the pulse duration), the pulses were transmitted through a 600 MHz tunable Fabry-Perot etalon which was tuned for maximum transmission at the pulse’s center frequency. For square pulses, the EOMs were directly driven using a high-speed AWG (64 GS/sec) with approximately 30 ps rise time and pulses of arbitrary length. The pulse center frequency was detuned by with respect to the QD’s resonance frequency (detuning specified in each measurement). Measured pulse profiles shown in the manuscript may differ slightly from the pulse experienced by the QD due to small system reflections outside the cryostat. The time distribution of the QD luminescence was measured by again detecting the luminescence with an SNSPD and time-correlating the counts on the TCSPC module with respect to a trigger signal from the AWG. We typically used 30-60 second total integration times, over which we collected typically several million total photons. This type of measurement was performed with a wide range of average optical input powers (between approximately 0.25 nW to 1500 nW). Pump powers were converted to resonant Rabi rates by looking at the resulting time-domain oscillations.
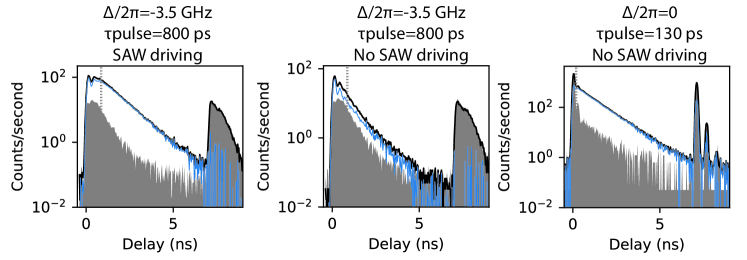
The time-resolved QD dynamics shown in the manuscript are presented after subtracting the experimentally measured pump contribution. This subtraction process is illustrated in Fig. S4, where black curves represent the directly measured data including pump and QD luminescence contributions, gray regions represent the measured pump contribution, and blue curves represent the difference which we associated with the QD contribution.
3 Estimating QD Occupancies from Experimental Time-Domain Data
QD occupancies were derived by comparing count rates from time-resolved QD luminescence data to a reference count rate. The reference count rate was derived by performing a set of time-resolved QD luminescence measurements with 130 ps optical pulses and widely varying optical pump powers and analyzing the resulting Rabi oscillations in the signal. Experimental Rabi oscillations were compared to numerical calculations of the QD occupancy under a 130-ps square pulse. The calculation includes dephasing assuming that the QD dephasing is purely radiative. (The measured 1 ns radiative lifetime corresponds to a 321 MHz decay rate.) This calibration is illustrated in Fig. S5. Note that experimental occupancies will be overestimated if the QD experiences additional dephasing. Nonetheless, this scaling is irrelevant for the enhancements presented in the manuscript.