Carbon isotope chemistry in protoplanetary disks: Effects of C/O ratios
Abstract
Carbon isotope fractionation of CO has been reported in the disk around TW Hya, where elemental carbon is more abundant than elemental oxygen ([C/O]elem 1). We investigated the effects of the [C/O]elem ratio on carbon fractionation using astrochemical models that incorporate isotope-selective photodissociation and isotope-exchange reactions. The 12CO/13CO ratio could be lower than the elemental carbon isotope ratio due to isotope exchange reactions when the [C/O]elem ratio exceeds unity. The observed 12CO/13CO and H12CN/H13CN ratios around TW Hya could be reproduced when the [C/O]elem ratio is 2–5. In the vicinity of the lower boundary of the warm molecular layer, the formation of ices leads to the gas phase [C/O]elem ratio approaching unity, irrespective of the total (gas + ice) [C/O]elem ratio. This phenomenon reduces the variation in the 12CO/13CO ratio across different [C/O]elem ratios.
1 Introduction
The isotopic ratio of molecules is a powerful tool for investigating the origin of solar system materials and for revealing the possible chemical link between the solar system and the interstellar medium (ISM) (see, e.g., Ceccarelli et al., 2014; Nomura et al., 2023, for a recent review). The carbon isotope ratios are reported to be roughly constant in the Solar System (Clayton & Nittler, 2004). The 12CO/13CO ratio in the solar photosphere (93.48 0.68, Lyons et al., 2018) is slightly higher than terrestrial carbonates (Craig, 1957; Fleisher et al., 2021, VPDB, 88.99), while 12CO/13CO ratio in comet 67P/Churyumov-Gerasimenko is 86 8 (Rubin et al., 2017).
On the other hand, the carbon isotope ratio of CO, one of the main reservoirs of carbon, evolves in star-forming regions. In the early stages, no significant carbon fractionation is observed in both the gas and ice phases of CO (Boogert et al., 2002; Pontoppidan et al., 2003; Agúndez et al., 2019; Yoshida et al., 2019). However, the solar-mass young stellar objects exhibit 12CO/13CO ranging from 85 to 160 when using the near-infrared CO absorption lines (Smith et al., 2015). These values notably higher than the 12CO/13CO ratios of ISM (62 4, Langer & Penzias, 1993). Intriguingly, divergent ratios of 31 (TYC8998-760-1b) and 10.2–42.6 (WASP-77Ab) have been reported in the atmosphere of young super-Jupiter (Zhang et al., 2021; Line et al., 2021).
The carbon isotope fractionation could occur through the isotope exchange reactions (e.g., Watson, 1976; Langer et al., 1984; Roueff et al., 2015; Colzi et al., 2020; Loison et al., 2020) and the isotope-selective photodissociation of CO (e.g., Bally & Langer, 1982; Visser et al., 2009). The former is efficient in the surface layer of cloud and disk irradiated by the interstellar and stellar UV radiation, while the latter works in the cold regions (e.g., Röllig & Ossenkopf, 2013; Furuya & Aikawa, 2018; Visser et al., 2018).
The 12CO/13CO ratio in the protoplanetary disk differs between observations and previous chemical models. The carbon isotope fractionation of CO has been spatially observed in the disk around TW Hya (Zhang et al., 2017; Yoshida et al., 2022). On the other hand, chemical models exhibit that the 12CO/13CO ratio is similar to the the elemental carbon isotope ([12C/13C]elem) ratio (Woods & Willacy, 2009; Roueff et al., 2015; Viti et al., 2020). The chemical models used a typical ISM values like elemental carbon abundance relative to total hydrogen ([C]elem) of 10-4 and elemental carbon to oxygen ([C/O]elem) ratio lower than unity. However, the observations toward disk sources show an elevated [C/O]elem ratio ( 1.0, e.g., Bergin et al., 2016) and the depletion of CO is also observed (e.g., Kama et al., 2016).
The [C/O]elem ratio higher than unity could change the 12CO/13CO ratio (Yoshida et al., 2022). Therefore, in this work, we will investigate the effect of [C/O]elem ratio as well as [C]elem on the carbon isotope ratios in the disk. We will briefly describe our model in Section 2. In Section 3, we will present our results, and in Section 4, we will compare our results with the observations. Then, we will summarize our conclusions in Section 5.
2 Models
We investigate carbon isotope features in the protoplanetary disk around TW Hya using the axisymmetric two-dimensional (2 D) thermochemical disk model, packages of unified modeling for radiative transfer, gas energetics, and chemistry (PURE-C, Lee et al., 2021). The code calculates the gas and dust temperatures and the chemical abundances self-consistently for given (gas and dust) density profiles and the radiation fields.
2.1 Physical parameters of disk
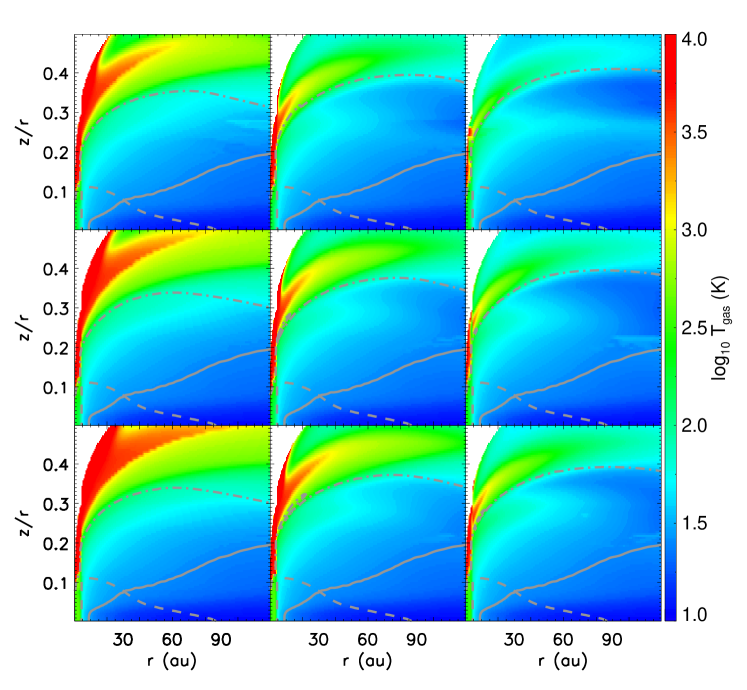
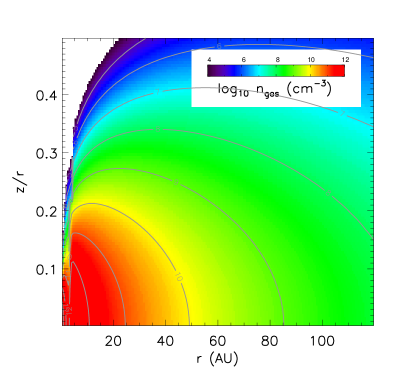
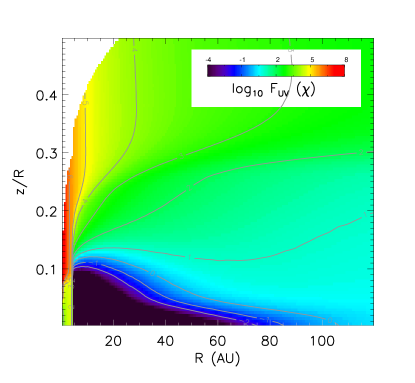
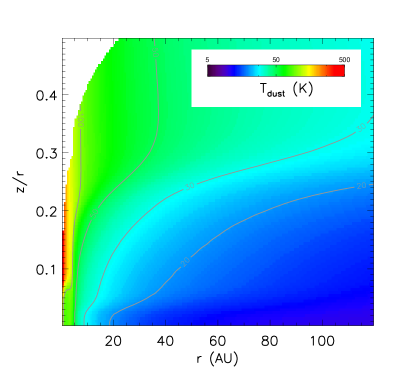
The density profiles of the gas and dust grains are adopted from the model of the TW Hya disk (Kama et al., 2016), which could reproduce the spectral energy distributions and the observed fluxes of multiple lines. The gas mass is set to 2.3 10 and the gas to dust mass ratio is set to 200. The small dust grains (0.005 m–1 m) are coupled with gas and their mass is only 1 % of the total grain masses, while the large dust grains ( = 0.005 m–1 mm) are concentrated near the midplane and their scale height is 0.2 the scale height of the gas. Representative grain sizes of 0.1 m and 10 m, respectively, and density of 2.09 g cm-3 are used for the chemical model (Woitke et al., 2016). The far-ultraviolet (UV) and X-ray luminosities ( and ) are 0.017 and 1.4 erg s-1, respectively. The cosmic ray ionization rate is 5 10-19 s-1 (Kama et al., 2016). The gas number density and the resultant UV flux normalized by Draine field (Draine, 1978), ionization ra/tes (X-ray and Cosmic ray), and dust temperature are shown in Figure 1. The gas temperature decreases as the initial elemental abundances of carbon and oxygen increase, resulting in more efficient cooling, as presented in Figure 14.

2.2 Chemical model
Our chemical network is based on that in Furuya & Aikawa (2018), but extended to include mono-13C species, relevant isotope exchange reactions (e.g., Watson, 1976; Langer et al., 1984; Roueff et al., 2015; Colzi et al., 2020; Loison et al., 2020), and isotope-selective photodissociation of CO (e.g., Bally & Langer, 1982; Visser et al., 2009). In our network, we do not distinguish 13C isotopomer with different 13C position for simplicity; e.g., 13CCH and C13CH are treated as the same species. As we are interested in only the small species such as CO, HCN, HCO+, we reduce the network by choosing the species used in Lee et al. (2021) with 13C-bearing species instead of 15N-bearing species.
Important isotope exchange reactions in our models are:
| (1) |
| (2) |
| (3) |
| (4) |
| (5) |
| (6) |
| (7) |
and we adopt the reaction rates in Table 1 of Roueff et al. (2015) and in Table 2 of Loison et al. (2020). Note that the reactions with number of 12, 13, 19, and 20 in Table 2 of Loison et al. (2020) are also included in this work. Forward reactions are exothermic reactions due to the zero point energy differences between products and reactants presented as temperatures in the reactions (1)–(7), and are faster than backward ones, especially in cold conditions (30 K). The most important isotope exchange reaction is the reaction (1) (e.g., Langer et al., 1984), because the CO is a main reservoir of volatile carbon (Pontoppidan et al., 2014), and many C-bearing species, such as CN and HCN, formed from C+. Reaction (1) results in a 13C-enrichment of CO and the molecules formed from CO, whereas it leads to a 13C-deficiency of the molecules formed from C+.
The self-shielding of H2 (Draine & Bertoldi, 1996), C (Kamp & Bertoldi, 2000), and N2 (Heays et al., 2014) as well as CO (Visser et al., 2009) are considered in our model. The column densities used in the self-shielding are calculated by averaging the vertical and radial column densities weighted by the UV flux along each direction (see details in Lee et al., 2021). The isotope selective photodissociation of CO is significant only near the CO photodissociation front (near the surface layers of the molecular cloud or the disk). The self-shielding of 12CO and 13CO makes the 12CO/13CO ratio higher than the elemental carbon isotope ratio ([12C/13C]elem), while the carbon isotope ratio of the molecules formed from C+ becomes lower than [12C/13C]elem.
In our models, gas-ice chemistry is described by the two-phase model (Hasegawa et al., 1992). Our model takes into account gas-phase chemistry, interactions between gas and (icy) grain surfaces, and grain surface chemistry. Note that the all chemical reactions on the grain surface work only in the top two layers because mantle layers ( 2 layers) are assumed to be inert (Aikawa & Herbst, 1999; Cuppen et al., 2017). In addition, the photodissociation of ices is included in this work, which is assumed to have the same rates in the gas-phase. In the lower boundary of the warm molecular layer, CO ice can become CO2 ice on dust grains, which removes the CO in the gas phase (Bergin et al., 2014; Furuya & Aikawa, 2014). Therefore, not only the gas phase C/O ratio but also carbon isotope ratios of the gas phase species can be affected. In this work, we use the age of TW Hya (10 Myr, e.g., Herczeg et al., 2023) as the chemical evolution time to compare our results with observed values toward TW Hya. Furthermore, we compare the results between the evolution times of 1 Myr and 10 Myr.
2.3 Initial abundances
We investigate the effects of the [C/O]elem ratio and the [C]elem on the carbon isotope ratios of observable species in the warm molecular layer. The initial abundances are listed in Table 1 (Cleeves et al., 2015; Lee et al., 2021). The elemental carbon isotope ([12C/13C]elem) ratio of 69 is adopted (Wilson, 1999). The elemental carbon abundances, [C]elem are 1.7 10-6, 1.7 10-5, and 1.0 10-4 in the model names beginning with A, B, C, respectively. The numbers following the model names indicate the [C/O]elem ratios. Note that the chemistry in the warm molecular layer tends to approach or reach an equilibrium state around the typical disk age of 1 Myr). Therefore, the results are predominantly determined by the elemental carbon and oxygen abundances rather than the initial abundances of species: whether the initial carbon and oxygen are in molecular forms or atomic forms. Thus, the initial abundances are set using only water ice, CO, and C as shown in Table 1.
| Species | Abundanceaa x(y) means x 10y. | Species | Abundanceaa x(y) means x 10y. |
|---|---|---|---|
| H2 | He | ||
| HCNbb The initial abundance of 13C bearing species
is by a factor of
69 lower than that of 12C bearing species except for C2H (34.5). The latter contains two carbon atoms and doubly counted. |
NH3 ice | ||
| N | N2 | ||
| C+bb The initial abundance of 13C bearing species
is by a factor of
69 lower than that of 12C bearing species except for C2H (34.5). The latter contains two carbon atoms and doubly counted. |
CH4bb The initial abundance of 13C bearing species
is by a factor of
69 lower than that of 12C bearing species except for C2H (34.5). The latter contains two carbon atoms and doubly counted. |
||
| CNbb The initial abundance of 13C bearing species
is by a factor of
69 lower than that of 12C bearing species except for C2H (34.5). The latter contains two carbon atoms and doubly counted. |
H | ||
| HCO+bb The initial abundance of 13C bearing species
is by a factor of
69 lower than that of 12C bearing species except for C2H (34.5). The latter contains two carbon atoms and doubly counted. |
C2Hbb The initial abundance of 13C bearing species
is by a factor of
69 lower than that of 12C bearing species except for C2H (34.5). The latter contains two carbon atoms and doubly counted. |
||
| Fe+ | Mg+ | ||
| Si+ | S+ | ||
| Model | Species / Abundancesaa x(y) means x 10y. | ||
| namecc The elemental carbon abundances are 1.7 10-6, 1.7 10-5, and
1.0 10-4 for the model names beginning with A, B, and C, respectively. The following numbers indicate the [C/O]elem ratio. |
H2O ice | CObb The initial abundance of 13C bearing species
is by a factor of
69 lower than that of 12C bearing species except for C2H (34.5). The latter contains two carbon atoms and doubly counted. |
Cbb The initial abundance of 13C bearing species
is by a factor of
69 lower than that of 12C bearing species except for C2H (34.5). The latter contains two carbon atoms and doubly counted. |
| A0.5 | |||
| A1.0 | |||
| A1.5 | |||
| A2.0 | |||
| A5.0 | |||
| B0.5 | |||
| B1.0 | |||
| B1.5 | |||
| B2.0 | |||
| B5.0 | |||
| C0.5 | |||
| C1.0 | |||
| C1.5 | |||
| C2.0 | |||
| C5.0 | |||
3 Results
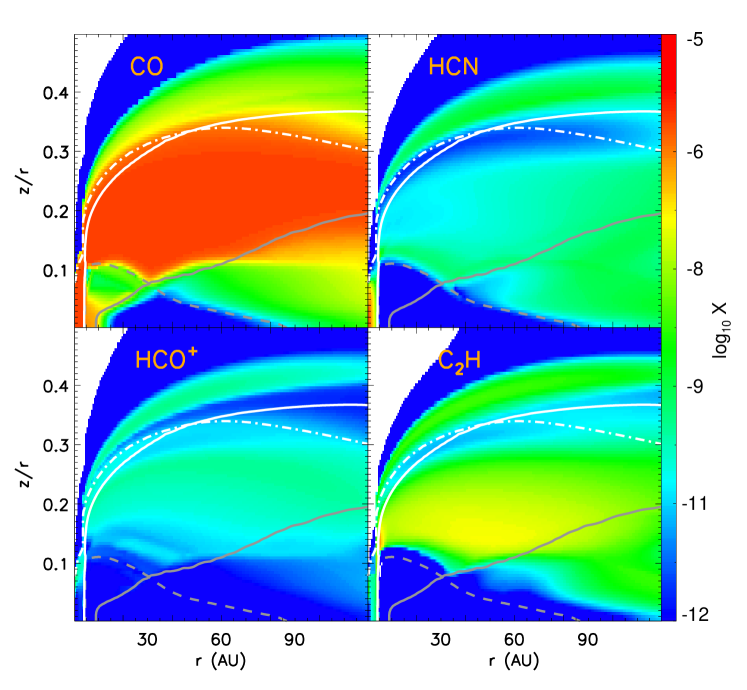
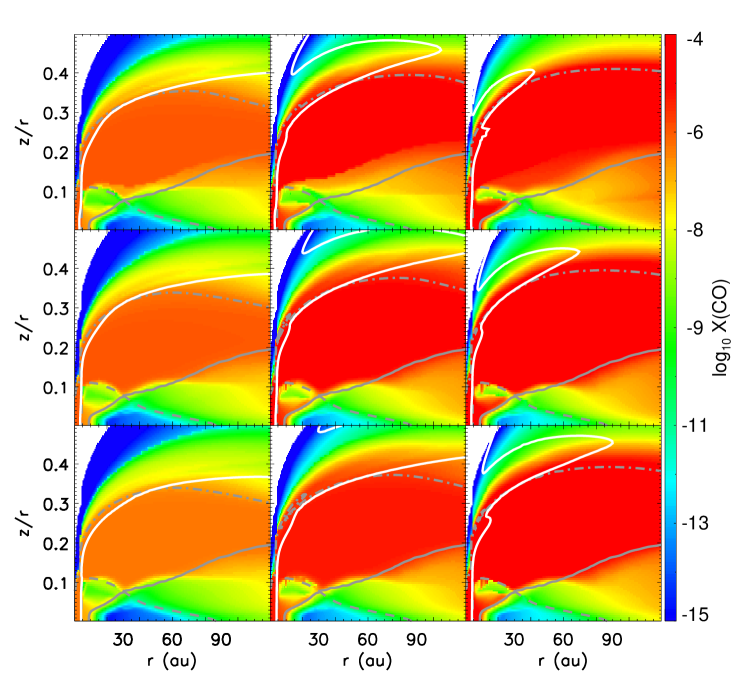
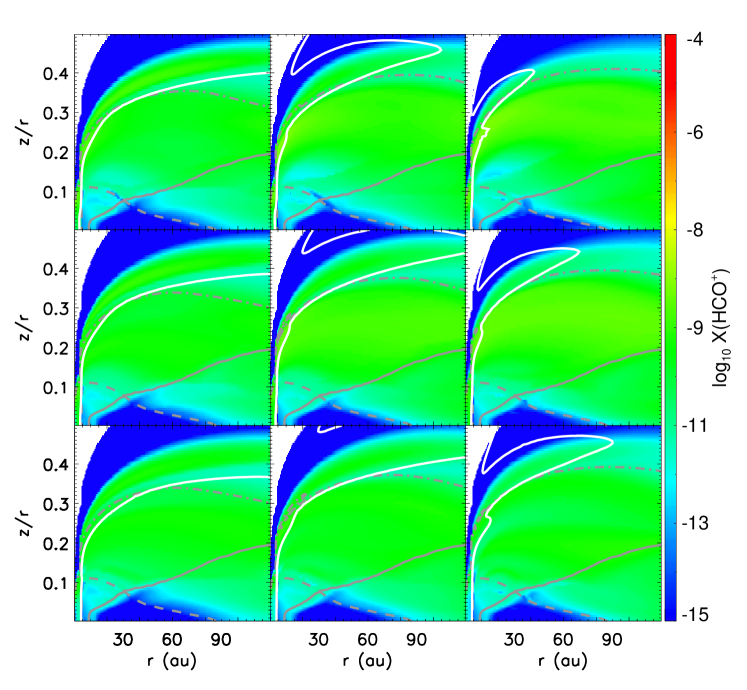
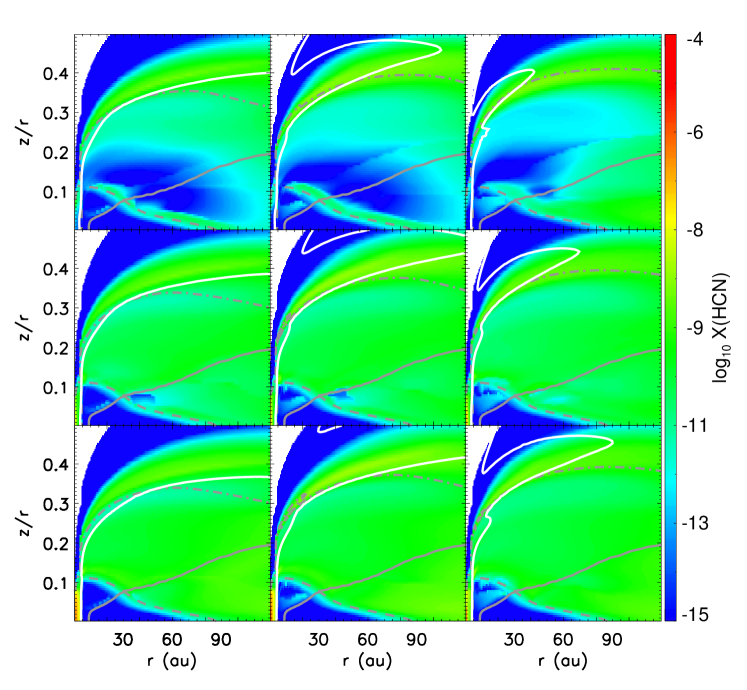
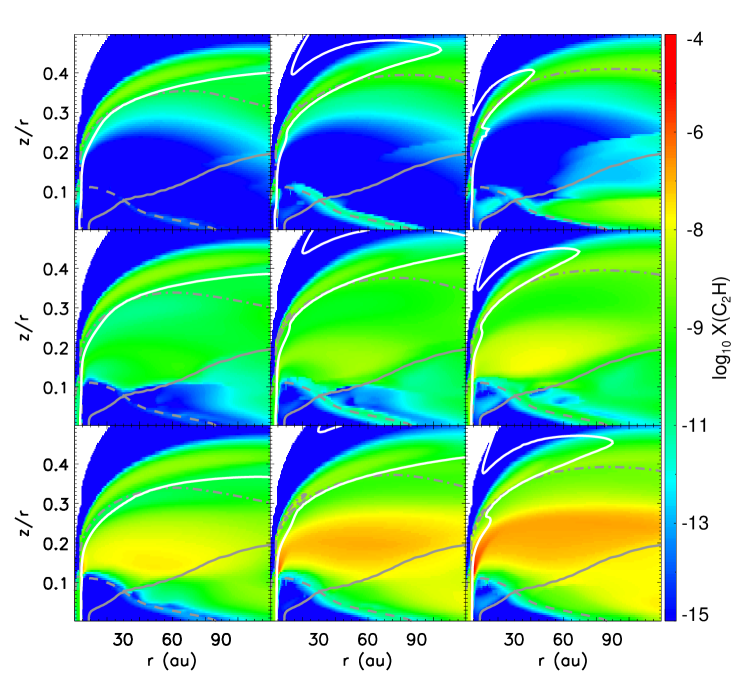
Figure 2 shows the 2D abundance distributions for CO, HCO+, HCN, and C2H in the reference model with [C]elem = 1.7 and [C/O]elem = 2.0, which reproduces well the observed molecular lines (Kama et al., 2016). The gas-phase CO is abundant in the warm molecular layer (e.g., Aikawa et al., 2002), which is surrounded by the CO photodissociation front (the dot-dashed white curves where the CO abundance is half of [C]elem) at the upper boundary and the CO snow surface (20–30 K, the solid gray curves) at the lower boundary.
The lower boundary of warm molecular layer in the inner disk ( 30 au) can be modified by the CO2 ice formation. When the ionization rate is higher than 10-18 s-1, the gas-phase CO is converted into CO2 ice within a few Myr (Bergin et al., 2014; Furuya & Aikawa, 2014; Lee et al., 2021). Therefore, CO is depleted above the CO snow surface (the solid gray curve) as shown in the top left panel of Figure 2, where the X-ray ionization rate is higher than 10-18 s-1. In addition, CO ice reacts with OH ice, which is a product of the photodissociation of water ice, and also becomes the CO2 ice (Ruaud & Gorti, 2019; Furuya et al., 2022a). However, in regions with the UV flux (the sum of stellar and external fields) above 0.1 Draine field, the CO2 ice is photodissociated and goes back to the CO ice, which is subsequently thermally desorbed.
Below the CO snow surface in the outer disk, a fraction of HCN and C2H as well as CO are in the gas phase, which could contribute to the observed column density. They are photodesorbed by the UV photons when the UV flux is higher than 0.1 Draine field (the dashed curves in Figure 2), although thermal desorption is inefficient and most volatiles are in the ice phase. Note that the binding energies (on water ices) of HCN, C2H, and CO2 are 3700 K, 3000 K, and 2600 K, respectively, which are higher than the CO binding energy of 1150 K (Wakelam et al., 2017; Furuya & Aikawa, 2018).

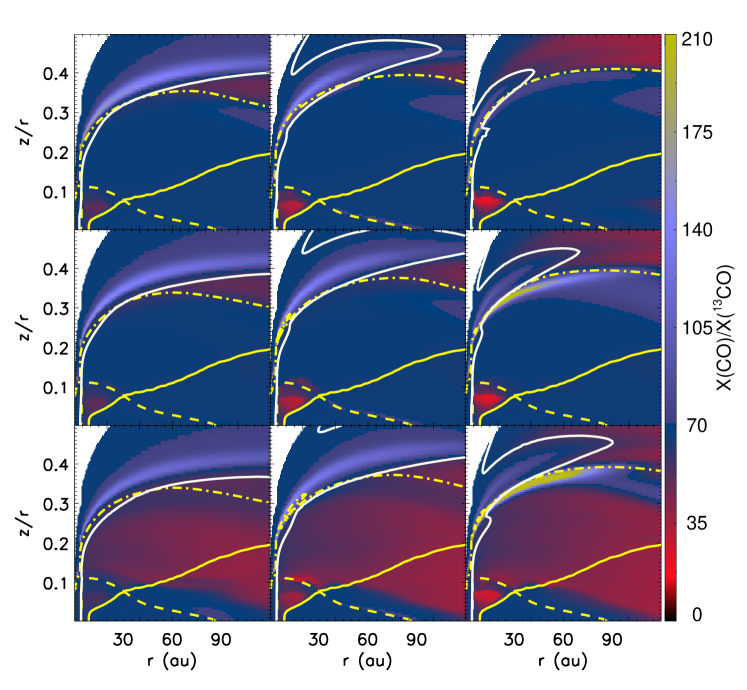
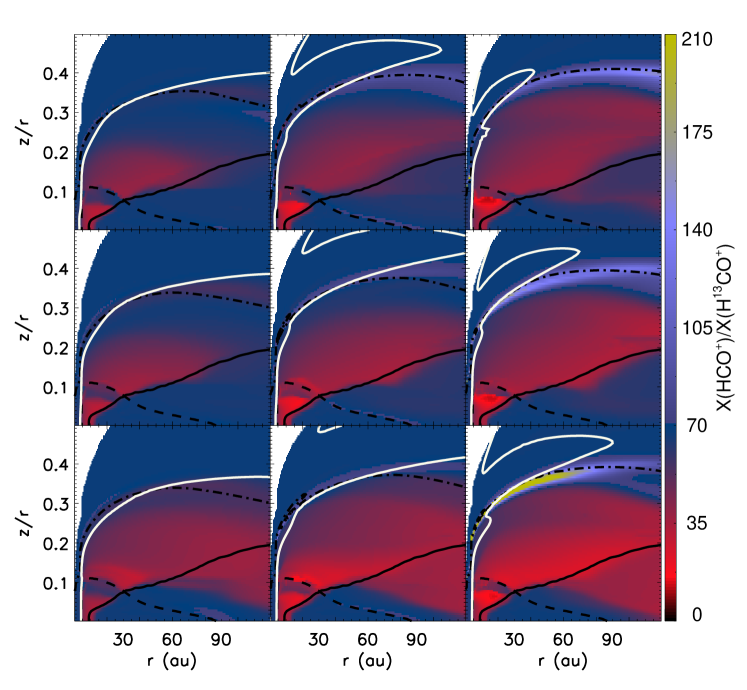
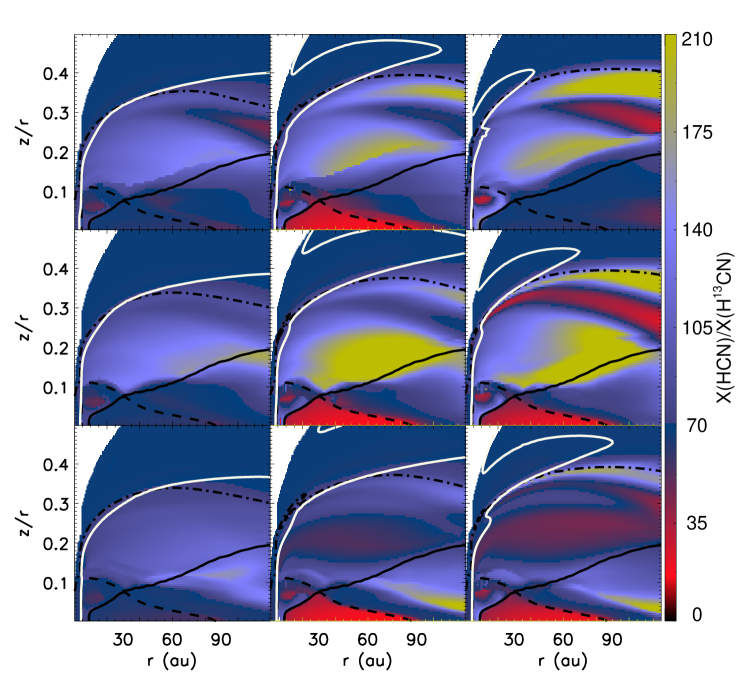
Figure 3 shows the 2D distributions of the carbon isotope ratios for the same molecules depicted in Figure 2, and the vertical distributions of the abundances and the isotope ratios at 30 au are displayed in the right panels in Figure 4. In the UV-dominated surface layers of the disk, the isotope selective photodissociation of CO determines 12CO/13CO ratio (e.g., Visser et al., 2018). All CO molecules are efficiently photodissociated, resulting in a very small abundance of CO, thus, the ratio is close to [12C/13C]elem near the atmosphere surface ( 0.4 around = 30 au). However, this ratio increases as the CO molecules begin to survive from the UV photons (light-blue color in the top left panel) in the vicinity of the CO photodissociation front (e.g., Visser et al., 2009). Nevertheless, the isotope exchange reaction (1) partly mitigates the fractionation caused by isotope selective photodissociation of CO when the gas temperature falls below 100 K (indicated by the solid white curves in Figure 3) near the CO photodissociation front (Woods & Willacy, 2009). Therefore, even around the CO photodissociation front, CO is enriched in 13C as shown in the top left panel of Figure 3 (see also Figure 16).
In the warm molecular layer, CO becomes enriched in 13C (red color) through the isotope exchange reaction (1). The reaction (2) induces greater carbon fractionation in HCO+ than in CO. On the other hand, the molecules formed from C+ (HCN and C2H) are 13C-poor in the warm molecular layer as shown in the right column of Figure 3. The degree of carbon isotope fractionation of the molecules is more significant below the CO snow surface (solid gray lines) in the outer disk because the reaction (1) is more efficient in the colder region.
The carbon isotope ratios in the disk could change with the age of the disk. As shown in the middle row of Figure 4, the molecules in the lower height of the warm molecular layer mainly contribute to the (vertically integrated) observed column density. The chemistry in the warm molecular layer generally becomes an equilibrium condition within 1 Myr. However, the CO abundance starts to decrease due to CO2 ice formation after 1 Myr (Furuya & Aikawa, 2014) in the lower boundary of the warm molecular layer in the inner disk ( 40 au), where the X-ray ionization rate is as low as 10-18–10-17 s-1. Therefore, the observed carbon isotope ratio as well as the abundances could be evolved between 1–10 Myr.
3.1 Effects of [C/O]elem
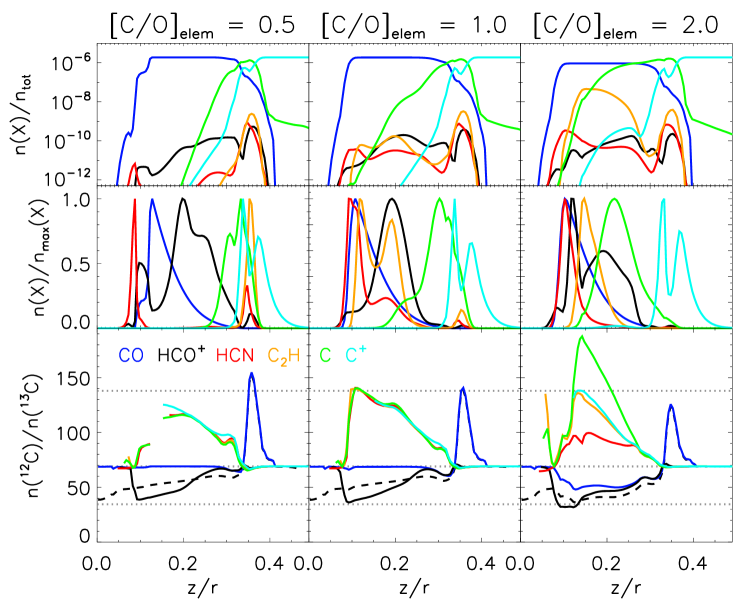
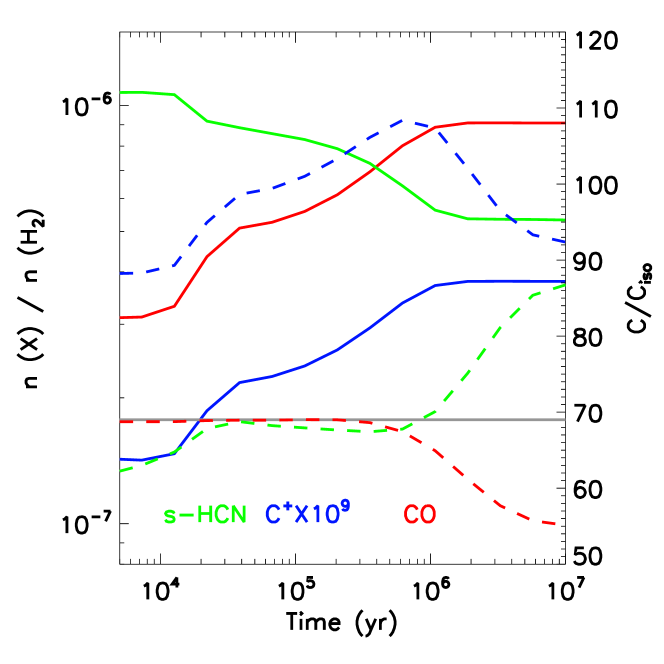
Figure 4 shows vertical distributions of abundance (top) and carbon isotope ratio (bottom) at the distance of 30 au from the central star when [C/O]elem ratios are 0.5, 1.0, and 2.0 from left to right. When [C/O]elem 1, most elemental carbon exists in the form of CO in the warm molecular layer (0.1 z/r 0.35). On the other hand, when [C/O]elem 1, atomic carbon, carbon chain molecules, and cyanide (e.g., C2, C2H, HCN) are also abundant due to the presence of a sufficient amount of leftover elemental carbon remaining after the formation of CO (e.g., Bergin et al., 2014; Cleeves et al., 2018; Lee et al., 2021).
The 12CO/13CO ratio in the warm molecular layer depends on the [C/O]elem ratio, and is primarily determined by the isotope exchange reaction (1). When the [C/O]elem ratio is 1, the self-shielding is very efficient, making CO the primary reservoir for elemental carbon. Therefore, the isotope exchange reactions cannot induce the CO fractionation, and thus, the 12CO/13CO ratio is close to [12C/13C]elem (see the blue lines in the left and middle columns of Figure 4, Woods & Willacy, 2009). However, when the [C/O]elem ratio exceeds unity (right column of Figure 4), the abundances of atomic carbon gas and ices of HCN and carbon chain molecules, such as Cm and CmHn, become comparable to that of CO gas. Consequently, sufficient amount of C+ continues to be supplied by carbon-containing species, and the isotope exchange reaction (1) results in the 12CO/13CO ratio lower than [12C/13C]elem ratio, as presented by the blue line in the bottom right panel of Figure 4.
Figure 5 exhibits the chemical evolution at the vicinity of the lower boundary of the warm molecular layer (0.1) at 30 au in the reference model. Ices of HCN and CmHn are abundant and comparable to the CO gas, and they exhibit 13C-deficiency due to 13C-deficient C+, produced by the isotope exchange reaction (1), when [C/O]elem 1. The ices of HCN and CmHn undergo a transformation to the CO gas after a few 103–104 yrs, which is initiated by the photo-desorption of ices by stellar UV photons. The newly supplied elemental carbons (as well as elemental oxygens) in the gas phase increase the CO abundance and decrease the 12CO/13CO ratio through the reaction (1).
Carbon isotope ratios of other molecules are also altered by the [C/O]elem ratio. Woods & Willacy (2009) showed that based on the dominance of reaction (2) (Langer et al., 1984), one can estimate the expected isotope ratio of H12CO+/H13CO+ through the following relation:
| (8) |
The dashed black lines in Figures 4 and 6 show the H12CO+/H13CO+ ratio using the above equation along with the 12CO/13CO ratio (the solid blue lines) while the solid black lines exhibit the H12CO+/H13CO+ ratio in our model. The strong gradients in physical and chemical conditions including both gas temperature, CO abundance, and electron abundance cause our models to deviate from this simple relationship (see Figure 3 in Furuya et al., 2022b), and thus models will be necessary for interpreting observed H12CO+/H13CO+ ratios in disks.
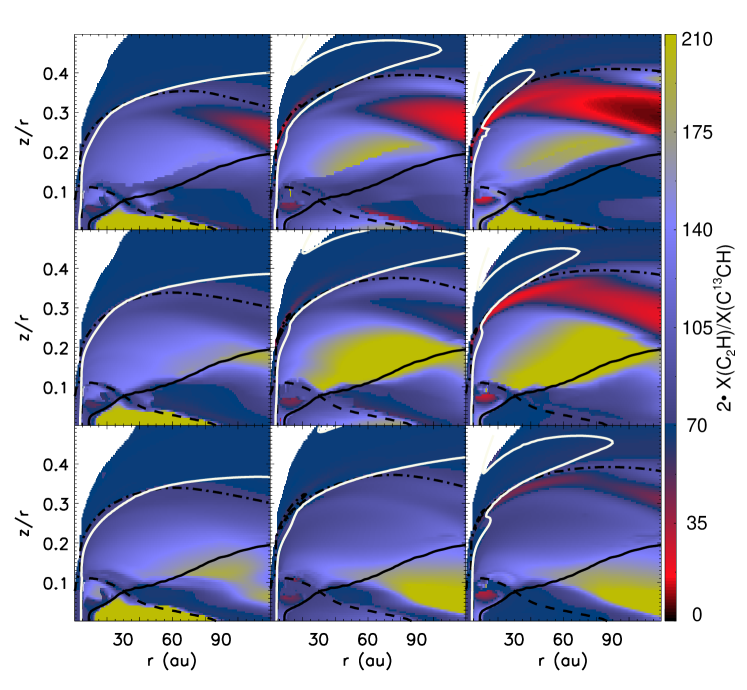
HCN and C2H are formed from C+, and thus, their carbon isotope ratios align with 12C+/13C+. However, when the [C/O]elem ratio exceeds unity, the atomic carbon and C2 are abundant in the warm molecular layer. Thus, isotope exchange reactions 3–7 (Loison et al., 2020) contribute to lower H12CN/H13CN and 12C2H/C13CH ratios compared to the 12C+/13C+ ratio as shown in the bottom panel of Figure 4.
3.2 Effects of [C]elem
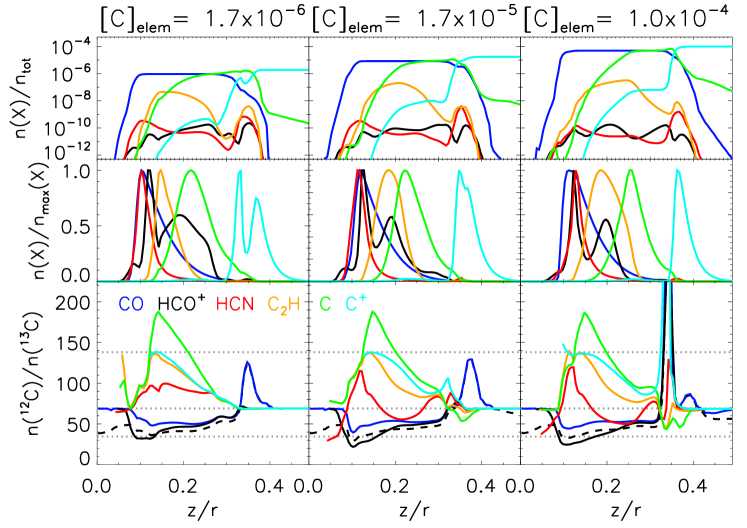
The elemental carbon abundance ([C]elem) of disks is poorly constrained, and like oxygen, it is thought to vary (e.g., Ansdell et al., 2016). In this section we explore differences in the elemental carbon abundances on the carbon isotope ratios. Figure 6 shows the differences in abundances and carbon isotope ratios for the molecules presented in Figure 4, considering variations in elemental carbon abundances ([C]elem), fixing the [C/O]elem ratio of 2.0. The peak abundances of CO/C/C+ increase by a factor of 10 and 50 as the [C]elem increases. The height of the CO photodissociation front where the CO abundance is a half of [C]elem, increases with a higher [C]elem. This is because the CO self-shielding is more effective due to the higher CO abundance in the atmosphere. However, it is worth noting that the contribution of this height to the column density, when integrated along the entire height, is negligible as shown in the middle panels of Figure 6.
Carbon isotope ratios of CO, atomic carbon, and C+ in the warm molecular layer show a similar trend regardless of [C]elem as shown in the bottom panels of Figure 6. In the warm molecular layer, the ratios are mainly determined by the isotope exchange reaction (1). As the [C]elem increases, the gas temperature could be decreased due to efficient cooling by CO and H2O in the upper warm molecular layer ( 0.25; see Figure 14). However, the gas temperature is close to the dust temperature in the lower warm molecular layer. Therefore, CO, atomic C, and C+ show similar carbon isotope ratios across different [C]elem in the warm molecular layer.
However, in the atmosphere, the isotope selective photodissociation of CO is important, which is more efficient as [C]elem increases. Furthermore, gas temperature decreases according to [C]elem. Therefore, carbon isotope ratios exhibit complicated trends due to the competition between the isotope exchange reaction (1) and the isotope selective photodissociation of CO.
The carbon isotope ratios of the products are determined by the contribution of the inheritance from CO or C+ and the additional isotope reactions: reaction (2) for HCO+, reactions (5) and (6) for the C2H, and reactions (3) and (4) for the HCN, respectively. In the warm molecular layer, the abundances of CO, C, and C+ are more sensitive to the elemental carbon abundance compared to those of HCO+, HCN, and C2H. Thus, the contribution of the latter isotope reactions increases, and the HCO+, C2H, and HCN are 13C-enriched compared to their mother species (CO and C+).
4 Discussions
4.1 Comparison with observations
Previous disk models used the elemental abundances similar to the ISM values with the [C/O]elem ratio lower than unity (Woods & Willacy, 2009; Furuya & Aikawa, 2014; Visser et al., 2018). In this case, the 12CO/13CO ratio is similar to the [12C/13C]elem ratio (Roueff et al., 2015; Viti et al., 2020) or close to the initial 12CO/13CO ratio (Woods & Willacy, 2009). On the other hand, molecules formed from C+ in the cold region could undergo fractionation through the reaction (1). However, the elemental abundances of the disk around TW Hya differ from the ISM condition. The bright C2H emission is observed toward TW Hya, implying an elevated [C/O]elem ratio ( 1.0, e.g., Bergin et al., 2016), and the depletion of CO is also observed (Kama et al., 2016). Furthermore, those features are common in the disk sources (Bergin et al., 2016; Miotello et al., 2019; Bergner et al., 2020; Bosman et al., 2021a, b; Sturm et al., 2022). Therefore, the observed carbon isotope ratios could be explained by elevated [C/O]elem ratios.
4.1.1 CO
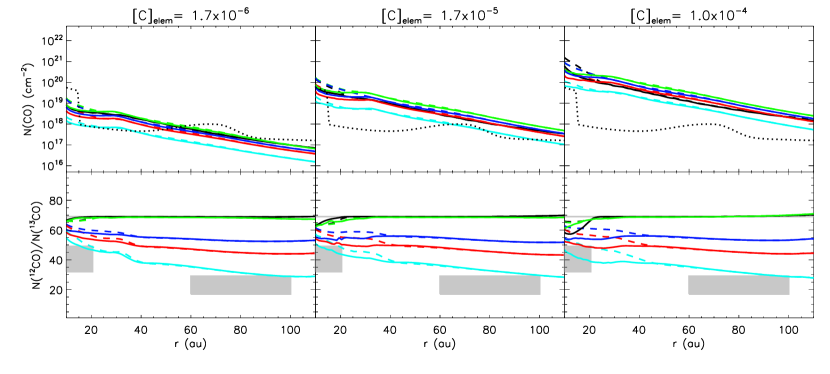
Spatially resolved observations of the carbon isotope fractionation have been conducted in the disk around TW Hya. The observationally derived 12C18O/13C18O ratio is 40 around 5–20.5 au (Zhang et al., 2017) and the 12CO/13CO ratio is 236 around 60 – 100 au and 100 in the outer disk ( 100 au, Yoshida et al., 2022).
Figure 7 shows the CO column densities (top panels) and the column density ratios of 12CO to 13CO (bottom panels) as functions of a distance from the central star. The elemental carbon abundances, [C]elem are 1.7 10-6, 1.7 10-5, and 1.0 10-4, respectively, from left to right, respectively. The model with [C/O]elem 5 reasonably well reproduces the observed 12CO/13CO ratio. However, the observed 12CO/13CO ratio is still slightly lower than the 12CO/13CO ratio predicted by our model with [C/O]elem = 5 (see the solid lines in the left bottom panel of Figure 7), which implies that the [C/O]elem ratio might be even higher than five and/or the gas temperature might be lower in the TW Hya disk than that in our model. When we reran the reference model after artificially reducing the gas temperature by half, the carbon isotope ratio decreases by 15–20%.
The [C/O]elem and [C]elem could affect the CO column density and carbon isotope ratio. When [C/O]elem 1, the CO column density decreases due to an oxygen deficiency relative to carbon for the formation of CO. On the other hand, when [C/O]elem 1, the column density of CO decreases due to its conversion into CO2 ice near the CO snow surface. The CO column densities increase as [C]elem increases, and the trends of CO column density with respect to the [C/O]elem ratio are similar in all three cases with varying [C]elem. The observed CO column density in the TW Hya disk (Huang et al., 2018) appears to be similar to the models with [C]elem = 1.7 10-6. The dotted and solid lines indicate the models with the evolution time of 1 Myr and 10 Myr, respectively. The column densities within au slightly decrease because the CO2 ice still forms after 1 Myr.
When [C/O]elem 1, the column density ratio of 12CO/13CO is close to the [12C/13C]elem ratio. However, as the [C/O]elem ratio exceeds unity, the column density ratio decreases below the [12C/13C]elem ratio. The trends of 12CO/13CO with respect to the [C/O]elem ratio are consistent across all three [C]elem cases. Furthermore, the 12CO/13CO ratio is unaffected by the [C]elem.
Our results are consistent with a simple approach in Yoshida et al. (2022). In the normal dense ISM condition, where elemental carbon to oxygen ratio ([C/O]elem) is 0.5 and most volatile carbon is locked up in CO, the degree of carbon fractionation in CO by reaction (1) is not significant (deviation of 12CO/13CO from [12C/13C]elem is 30 % at most, Furuya et al., 2011). However, this situation can change when [C/O]elem is 1 because, in that case, volatile carbon carriers as abundant as CO exist. According to Yoshida et al. (2022), the 12CO/13CO ratio normalized by the elemental carbon isotope ratio [12C/13C]elem is roughly expressed by
| (9) | |||||
assuming that the reaction (1) is in chemical equilibrium, only C+ and CO are the carbon carriers, and [C/O]elem is larger than unity. The above equation would give the lower limit of the normalized ratio, because other carbon carriers, such as C atoms and icy species, besides C+ and CO, should exist in reality. When [C/O]elem is (33 for 10 K and 3 for 30 K), the ratio inversely scales with [C/O]elem . Therefore, 12CO/13CO can be significantly different from [12C/13C]elem when [C/O]elem 1. According to Equation 9, the [C/O]elem ratio of 3–10 is needed to reproduce the observed 12CO/13CO ratio in the inner disk around TW Hya (Yoshida et al., 2022).
4.1.2 HCO+
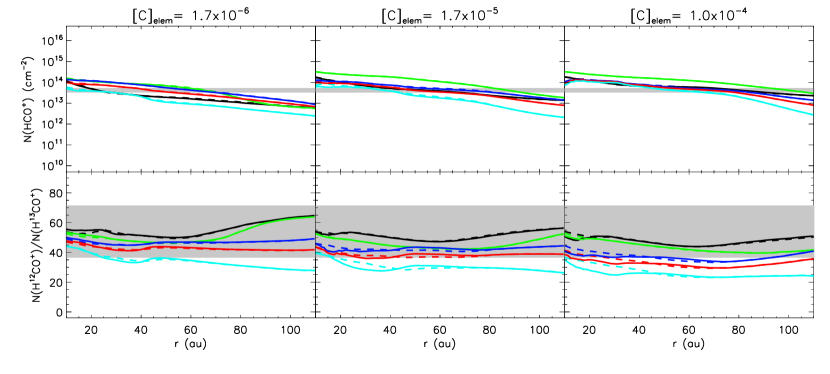
The observed H13CO+ and HC18O+ column densities in the whole disk around TW Hya are (7.8 2.0) 1011 cm-2 and (7.5 1.3) 1010 cm-2, respectively, based on the H13CO+ and HC18O+ 4–3 lines (Furuya et al., 2022b). When we assume that the H12CO+/HC18O+ ratio is the elemental ratio of 557 (Wilson, 1999), the H12CO+ column density and the H12CO+/H13CO+ ratio are (4.2 0.7) 1013 cm-2 and 54 17, respectively (see the horizontal gray boxes in Figure 8). The [C/O]elem ratio and [C]elem do not affect significantly the HCO+ column density and the H12CO+/H13CO+ ratio. The H12CO+/H13CO+ ratio is lower than the 12CO/13CO ratio through the isotope exchange reaction (2). This ratio is by 20% more fractionated compared to 12CO/13CO ratio in the inner disk (40 au) regardless of [C/O]elem. Most our models exhibit narrow ranges of column density and carbon isotope ratio compared to the observed ones as shown in Figure 8.
4.1.3 HCN
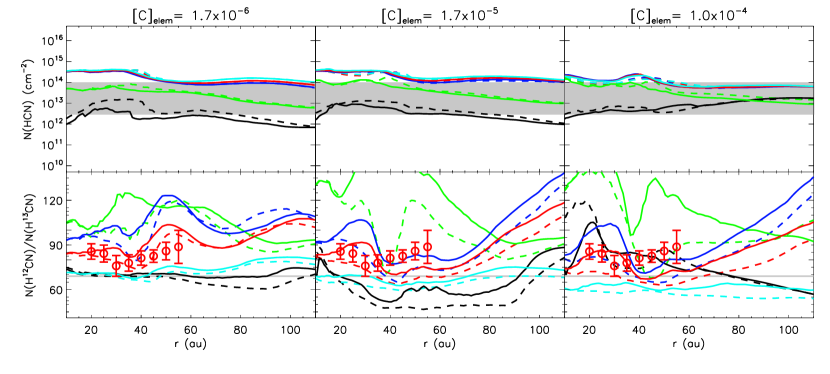
The H12CN/H13CN ratio is reported as 86 4 toward TW Hya using the optically thin HCN 4–3 hyperfine lines and H13CN 4–3 line (Hily-Blant et al., 2019). The observed H12CN/H13CN ratio in the TW Hya disk (open circles in the bottom panels of Figure 9) is well fit with the models with [C/O]elem = 2–5 (the red and cyan lines) when [C]elem is 1.7 10-6.
Figure 9 shows the HCN column densities (top panels) and the column density ratios of H12CN to H13CN (bottom panels). The HCN column density increases with the [C/O]elem ratio and is saturated when [C/O]elem 1.5. The H12CN/H13CN ratio within = 80 au increases with the [C/O]elem ratio and reaches its maximum value of 120 around the [C/O]elem ratio of unity. Then, the ratio decreases with increasing the [C/O]elem ratio when [C/O]elem 1. For a given [C/O]elem ratio, the H12CN/H13CN ratio decreases as [C]elem increases via the isotope exchange reaction (5) as mentioned in Section 3. When [C]elem is higher, the lower [C/O]elem ratio could fit the observations. In addition, the ratio could be lower than [12C/13C]elem ratio when [C/O]elem = 5. The H12CN/H13CN ratio is higher at 10 Myr (solid lines) compared to 1 Myr (dashed lines), which is the opposite trend shown in the 12CO/13CO ratio (see Section 4.1.1). However, their differences are too small to distinguish observationally.
4.1.4 C2H
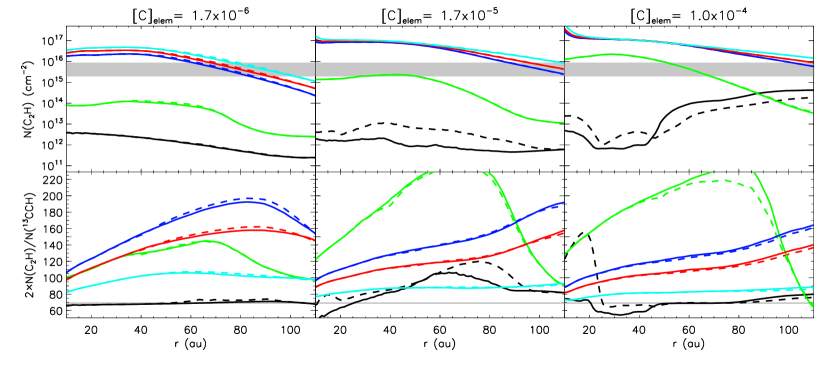
The bright C2H emission in the disk indicates that the [C/O]elem ratio exceeds unity. The observed C2H column density toward the TW Hya disk (Kastner et al., 2014) could be fit with the models with [C/O]elem 1.5 as shown in the previous works (e.g., Bergin et al., 2014; Lee et al., 2021). However, the 12C2H/C13CH ratio toward TW Hya has been not reported yet. Thus, we expected the 12C2H/C13CH ratio based on our model. Note that 13CCH and C13CH are treated as the same species in our work. Their carbon isotope ratios could be differ through 13CCH + H C13CH + H + 8.1 K, thus, their isotope ratios are similar in our work (Furuya et al., 2011).
Figure 10 shows the C2H column densities (top panels) and the column density ratios of C2H and C13CH (bottom panels). When [C]elem is 1.7 10-6, the 12C2H/C13CH ratio increases up to 180 at the [C/O]elem ratio of 1.5 (blue line) then it decreases with increasing the [C/O]elem ratio. The 12C2H/C13CH ratio is governed by a balance between the inheritance from 12C+/13C+ (resulting in an elevated 12C2H/C13CH) and the reactions (6) and (7) (leading to a reduction in the 12C2H/C13CH). Thus, the maximum 12C2H/C13CH ratio (200) is achieved at the [C/O]elem ratio of 1 when [C]elem is 1.7 10-5 and 1.0 10-4 because of the growing significance of the latter contribution.
4.2 Gas phase carbon isotope ratio
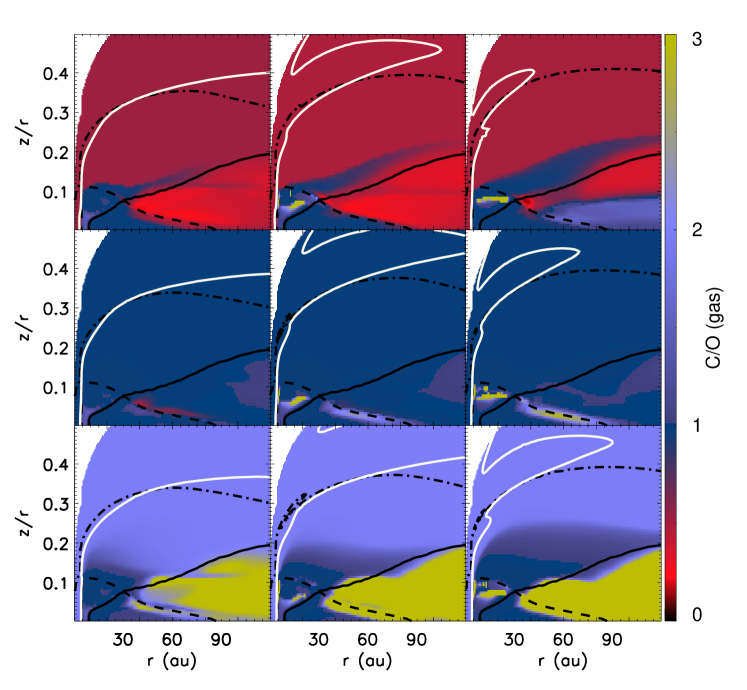
The isotope ratio measured in disks is primarily in gas phase carriers. In this section we focus on its gas-phase values for different molecules commonly observed. The 12CO/13CO ratio depends on the gas-phase [C/O]elem ratio (hereafter [C/O]gas) while the [C/O]elem ratio mentioned in this work is the total values including both gas and ice phases. Figure 11 shows the 2 D distribution of only the [C/O]gas ratios. The [C/O]gas ratio in the warm molecular layer is close to the total value ([C/O]elem) except for the lower boundary where the [C/O]gas ratio is close to unity. When the [C/O]elem ratio is 0.5 (top rows), CO2 ice is dominant just above the CO snow surface, thus, the [C/O]gas ratio approaches unity. When the [C/O]elem ratio is higher than unity (bottom rows), HCN and carbon chain ices, like CmHn, attain notable abundances (comparable to CO) near the lower boundary of the warm molecular layer in the inner disk. This occurrence leads to the [C/O]gas ratio approaching unity regardless of the [C/O]elem ratio and [C]elem. However, in mid-plane at the outer disk, gas phase CO freezes out onto dust grains below the CO snow surface, and atomic carbon is dominant in the gas phase. Therefore, the [C/O]gas ratio is higher than the [C/O]elem ratio when the [C/O]elem ratio exceeds unity, while the [C/O]gas ratio is close to the [C/O]elem ratio in other cases regardless of [C]elem.
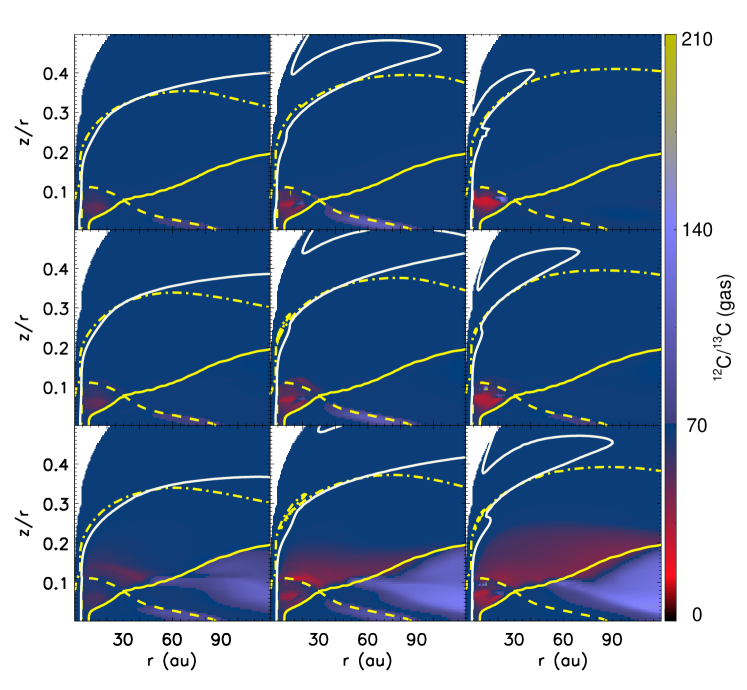
Figure 12 shows the gas phase carbon isotope ratio. The gas phase carbon isotope ratio exhibits a similar trend independent of [C]elem. When the [C/O]elem ratio is 1, the carbon isotope ratio is close to [12C/13C]elem above the UV flux of 0.1 Draine field (the dashed yellow lines). However, when the [C/O]elem ratio exceeds unity, 13C is enriched in the gas phase near the lower boundary of the warm molecular layer where CO is abundant in the gas phase (above the CO snow surface and the UV flux of 0.1 Draine field). It implies that ice abundances are comparable to the CO abundance and 13C is deficient in the ice phase there. On the other hand, the gas exhibits a 13C-deficiency below the CO snow surface in the outer disk where only small portion (a few %) of elemental carbon is in the gas phase and dominant gas phase species are atomic carbon.
4.3 Effects of Ionization rate
Carbon fractionation mainly occurs in the cold regions through the isotope-exchange reactions (e.g., Nomura et al., 2023). Thus, ionization rates might affect the carbon isotope ratios. In the lower boundary of the warm molecular layer, the formation of C+ and 13C+ starts from the reaction of CO + He+ and the later is ionized by X-rays and/or cosmic rays in the reference model. Therefore, the efficiency of the isotope exchange reaction (1) might depend on the ionization rates by X-rays and/or cosmic rays.
The reference model could fit the observations of the ionization tracers, HCO+ and N2H+. The HCO+ column density, which is derived by using HC18O+ 4–3 line (Furuya et al., 2022a), is fitted with the reference model as mentioned in Section 4.1.2 although the HCO+ column density is insensitive to the ionization rates (Aikawa et al., 2021). Our model could also fit the observed N2H+ column density of 1013 cm-2, which is measured using N2H+ 1–0 and 4-3 lines (Cleeves et al., 2015; Schwarz et al., 2019). Note that Cleeves et al. (2015) determined an ionization rate (X-ray + CR) below 10-19 s-1 at the disk midplane, derived through the fitting of the observed HCO+ and N2H+ data. In contrast, our model shows an ionization rate exceeding 10-18 s-1, as presented in the bottom left panel of Figure 1. We find a reduced ionization rate is needed, however how the [C/O]elem ratio and the isotope ratio of carbon may play an important role that should be explored in future work.
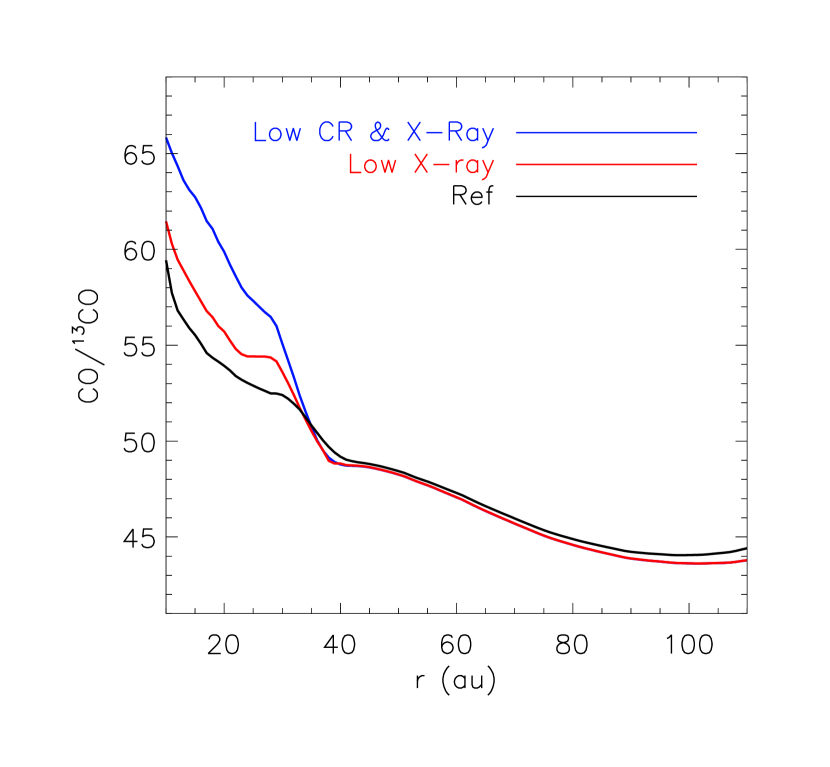
Figure 13 shows the effects of ionization rates to 12CO/13CO ratio. In the reference model (the black line), the ionization by X-rays is more dominant than that by cosmic rays (with the rate of 5 10-19 s-1 Kama et al., 2016) except for the mid-plane of the inner disk ( 10 au). The red and blue lines indicate the model with X-ray luminosity 10-3 times that of the reference model (). The latter model has an order of magnitude lower cosmic ray ionization rate compared to the reference model. The ionization rates at = 0.1, where the contribution to the column density is maximum, at = 30 au are 3.2 s-1, 4.7 s-1, and 5.0 s-1, for the black, red and blue line models, respectively. The column densities of HCO+ are similar within a factor of two among the models while the N2H+ column densities in the red and blue line models are a factor of 10 and 30 lower than that in the reference model.
5 Summary
We have investigated the effects of elemental carbon to oxygen ([C/O]elem) ratio and elemental carbon abundance to hydrogen ([C]elem) on the carbon isotope ratio in the disk.
1. The 12CO/13CO ratio monotonically decreases with increasing [C/O]elem ratio, and CO appears 25% and 50% more fractionated in the outer disk (40 au) when [C/O]elem are 1.5 and 5, respectively. The 12CO/13CO ratio is close to [12C/13C]elem when [C/O]elem is 1 except for the inner disk (20 au) regardless of [C]elem. When [C/O]elem 1, CO is enriched in 13C in the warm molecular layer through the isotope exchange reaction (1). The 12CO/13CO ratio observed in the TW Hya disk could be reproduced when the [C/O]elem ratio is higher than 2–5.
2. H12CO+/H13CO+ ratio is by 20% more fractionated compared to 12CO/13CO ratio in the inner disk (40 au) regardless of [C/O]elem. Most models could reproduce the observed H12CO+/H13CO+ ratio of 5417 within the error range.
3. It is not straightforward to infer the [C/O]elem ratio from the carbon isotope ratios of HCN and carbon chain molecules (e.g., C2H). This is because they exhibit an increasing trend followed by a decrease according to the [C/O]elem ratio. In addition, they are also affected by [C]elem. However, their column densities are sensitive to [C/O]elem ratio, and thus, can be used as an indicator of [C/O]elem ratio. Thus, chemical models are essential for interpreting observations. The H12CN/H13CN ratio observed in the TW Hya disk could be reproduced when the [C/O]elem ratio of 2–5.
4. When [C/O]elem 1, in the vicinity of the lower boundary of warm molecular layer, the 13C-enriched CO dominates in the gas phase. In addition, the gas phase [C/O]elem ratio approaches unity because excess elemental carbon in the gas phase is removed through ice formation in the form of HCN and carbon chain molecules (CmHn), which exhibit 13C depletion. Thus, 13C is enriched in the bulk of the gas while being deficient in the bulk of the ice phase.
Acknowledgements
We are grateful to the anonymous referee for the valuable comments that helped to improve the manuscript. This work is supported by the Korea Astronomy and Space Science Institute under the R&D program (Project No. 2024-1-841-00) supervised by the Ministry of Science and ICT. H.N. acknowledges financial support by JSPS and MEXT Grants-in-Aid for Scientific Research, 18H05441, 19K03910, 20H00182. K.F. acknowledges financial support by JSPS and MEXT Grants-in-Aid for Scientific Research, 20H05847 and 21K13967.
References
- Agúndez et al. (2019) Agúndez, M., Marcelino, N., Cernicharo, J., Roueff, E., & Tafalla, M. 2019, A&A, 625, A147, doi: 10.1051/0004-6361/201935164
- Aikawa & Herbst (1999) Aikawa, Y., & Herbst, E. 1999, A&A, 351, 233
- Aikawa et al. (2002) Aikawa, Y., van Zadelhoff, G. J., van Dishoeck, E. F., & Herbst, E. 2002, A&A, 386, 622, doi: 10.1051/0004-6361:20020037
- Aikawa et al. (2021) Aikawa, Y., Cataldi, G., Yamato, Y., et al. 2021, ApJS, 257, 13, doi: 10.3847/1538-4365/ac143c
- Ansdell et al. (2016) Ansdell, M., Williams, J. P., van der Marel, N., et al. 2016, ApJ, 828, 46, doi: 10.3847/0004-637X/828/1/46
- Bally & Langer (1982) Bally, J., & Langer, W. D. 1982, ApJ, 255, 143, doi: 10.1086/159812
- Bergin et al. (2014) Bergin, E. A., Cleeves, L. I., Crockett, N., & Blake, G. A. 2014, Faraday Discussions, 168, 61, doi: 10.1039/C4FD00003J
- Bergin et al. (2016) Bergin, E. A., Du, F., Cleeves, L. I., et al. 2016, ApJ, 831, 101, doi: 10.3847/0004-637X/831/1/101
- Bergner et al. (2020) Bergner, J. B., Öberg, K. I., Bergin, E. A., et al. 2020, ApJ, 898, 97, doi: 10.3847/1538-4357/ab9e71
- Boogert et al. (2002) Boogert, A. C. A., Blake, G. A., & Tielens, A. G. G. M. 2002, ApJ, 577, 271, doi: 10.1086/342176
- Bosman et al. (2021a) Bosman, A. D., Alarcón, F., Zhang, K., & Bergin, E. A. 2021a, ApJ, 910, 3, doi: 10.3847/1538-4357/abe127
- Bosman et al. (2021b) Bosman, A. D., Alarcón, F., Bergin, E. A., et al. 2021b, ApJS, 257, 7, doi: 10.3847/1538-4365/ac1435
- Ceccarelli et al. (2014) Ceccarelli, C., Caselli, P., Bockelée-Morvan, D., et al. 2014, in Protostars and Planets VI, ed. H. Beuther, R. S. Klessen, C. P. Dullemond, & T. Henning, 859, doi: 10.2458/azu_uapress_9780816531240-ch037
- Clayton & Nittler (2004) Clayton, D. D., & Nittler, L. R. 2004, ARA&A, 42, 39, doi: 10.1146/annurev.astro.42.053102.134022
- Cleeves et al. (2015) Cleeves, L. I., Bergin, E. A., Qi, C., Adams, F. C., & Öberg, K. I. 2015, ApJ, 799, 204, doi: 10.1088/0004-637X/799/2/204
- Cleeves et al. (2018) Cleeves, L. I., Öberg, K. I., Wilner, D. J., et al. 2018, ApJ, 865, 155, doi: 10.3847/1538-4357/aade96
- Colzi et al. (2020) Colzi, L., Sipilä, O., Roueff, E., Caselli, P., & Fontani, F. 2020, A&A, 640, A51, doi: 10.1051/0004-6361/202038251
- Craig (1957) Craig, H. 1957, Geochim. Cosmochim. Acta, 12, 133, doi: 10.1016/0016-7037(57)90024-8
- Cuppen et al. (2017) Cuppen, H. M., Walsh, C., Lamberts, T., et al. 2017, Space Sci. Rev., 212, 1, doi: 10.1007/s11214-016-0319-3
- Draine (1978) Draine, B. T. 1978, ApJS, 36, 595, doi: 10.1086/190513
- Draine & Bertoldi (1996) Draine, B. T., & Bertoldi, F. 1996, ApJ, 468, 269, doi: 10.1086/177689
- Fleisher et al. (2021) Fleisher, A. J., Yi, H., Srivastava, A., et al. 2021, Nature Physics, 17, 889, doi: 10.1038/s41567-021-01226-y
- Furuya & Aikawa (2014) Furuya, K., & Aikawa, Y. 2014, ApJ, 790, 97, doi: 10.1088/0004-637X/790/2/97
- Furuya & Aikawa (2018) —. 2018, ApJ, 857, 105, doi: 10.3847/1538-4357/aab768
- Furuya et al. (2011) Furuya, K., Aikawa, Y., Sakai, N., & Yamamoto, S. 2011, ApJ, 731, 38, doi: 10.1088/0004-637X/731/1/38
- Furuya et al. (2022a) Furuya, K., Lee, S., & Nomura, H. 2022a, ApJ, 938, 29, doi: 10.3847/1538-4357/ac9233
- Furuya et al. (2022b) Furuya, K., Tsukagoshi, T., Qi, C., et al. 2022b, arXiv e-prints, arXiv:2201.00935. https://arxiv.org/abs/2201.00935
- Hasegawa et al. (1992) Hasegawa, T. I., Herbst, E., & Leung, C. M. 1992, ApJS, 82, 167, doi: 10.1086/191713
- Heays et al. (2014) Heays, A. N., Visser, R., Gredel, R., et al. 2014, A&A, 562, A61, doi: 10.1051/0004-6361/201322832
- Herczeg et al. (2023) Herczeg, G. J., Chen, Y., Donati, J.-F., et al. 2023, ApJ, 956, 102, doi: 10.3847/1538-4357/acf468
- Hily-Blant et al. (2018) Hily-Blant, P., Faure, A., Vastel, C., et al. 2018, MNRAS, 480, 1174, doi: 10.1093/mnras/sty1562
- Hily-Blant et al. (2019) Hily-Blant, P., Magalhaes de Souza, V., Kastner, J., & Forveille, T. 2019, A&A, 632, L12, doi: 10.1051/0004-6361/201936750
- Huang et al. (2018) Huang, J., Andrews, S. M., Cleeves, L. I., et al. 2018, ApJ, 852, 122, doi: 10.3847/1538-4357/aaa1e7
- Kama et al. (2016) Kama, M., Bruderer, S., van Dishoeck, E. F., et al. 2016, A&A, 592, A83, doi: 10.1051/0004-6361/201526991
- Kamp & Bertoldi (2000) Kamp, I., & Bertoldi, F. 2000, A&A, 353, 276
- Kastner et al. (2014) Kastner, J. H., Hily-Blant, P., Rodriguez, D. R., Punzi, K., & Forveille, T. 2014, ApJ, 793, 55, doi: 10.1088/0004-637X/793/1/55
- Langer et al. (1984) Langer, W. D., Graedel, T. E., Frerking, M. A., & Armentrout, P. B. 1984, ApJ, 277, 581, doi: 10.1086/161730
- Langer & Penzias (1993) Langer, W. D., & Penzias, A. A. 1993, ApJ, 408, 539, doi: 10.1086/172611
- Lee et al. (2021) Lee, S., Nomura, H., Furuya, K., & Lee, J.-E. 2021, ApJ, 908, 82, doi: 10.3847/1538-4357/abd633
- Line et al. (2021) Line, M. R., Brogi, M., Bean, J. L., et al. 2021, Nature, 598, 580, doi: 10.1038/s41586-021-03912-6
- Loison et al. (2020) Loison, J.-C., Wakelam, V., Gratier, P., & Hickson, K. M. 2020, MNRAS, 498, 4663, doi: 10.1093/mnras/staa2700
- Lyons et al. (2018) Lyons, J. R., Gharib-Nezhad, E., & Ayres, T. R. 2018, Nature Communications, 9, 908, doi: 10.1038/s41467-018-03093-3
- Miotello et al. (2019) Miotello, A., Facchini, S., van Dishoeck, E. F., et al. 2019, A&A, 631, A69, doi: 10.1051/0004-6361/201935441
- Nomura et al. (2023) Nomura, H., Furuya, K., Cordiner, M. A., et al. 2023, in Astronomical Society of the Pacific Conference Series, Vol. 534, Astronomical Society of the Pacific Conference Series, ed. S. Inutsuka, Y. Aikawa, T. Muto, K. Tomida, & M. Tamura, 1075
- Pontoppidan et al. (2014) Pontoppidan, K. M., Salyk, C., Bergin, E. A., et al. 2014, in Protostars and Planets VI, ed. H. Beuther, R. S. Klessen, C. P. Dullemond, & T. Henning, 363, doi: 10.2458/azu_uapress_9780816531240-ch016
- Pontoppidan et al. (2003) Pontoppidan, K. M., Fraser, H. J., Dartois, E., et al. 2003, A&A, 408, 981, doi: 10.1051/0004-6361:20031030
- Röllig & Ossenkopf (2013) Röllig, M., & Ossenkopf, V. 2013, A&A, 550, A56, doi: 10.1051/0004-6361/201220130
- Roueff et al. (2015) Roueff, E., Loison, J. C., & Hickson, K. M. 2015, A&A, 576, A99, doi: 10.1051/0004-6361/201425113
- Ruaud & Gorti (2019) Ruaud, M., & Gorti, U. 2019, ApJ, 885, 146, doi: 10.3847/1538-4357/ab4996
- Rubin et al. (2017) Rubin, M., Altwegg, K., Balsiger, H., et al. 2017, A&A, 601, A123, doi: 10.1051/0004-6361/201730584
- Schwarz et al. (2019) Schwarz, K. R., Teague, R., & Bergin, E. A. 2019, ApJ, 876, L13, doi: 10.3847/2041-8213/ab1b0d
- Smith et al. (2015) Smith, R. L., Pontoppidan, K. M., Young, E. D., & Morris, M. R. 2015, ApJ, 813, 120, doi: 10.1088/0004-637X/813/2/120
- Sturm et al. (2022) Sturm, J. A., McClure, M. K., Harsono, D., et al. 2022, A&A, 660, A126, doi: 10.1051/0004-6361/202141860
- Visser et al. (2018) Visser, R., Bruderer, S., Cazzoletti, P., et al. 2018, A&A, 615, A75, doi: 10.1051/0004-6361/201731898
- Visser et al. (2009) Visser, R., van Dishoeck, E. F., & Black, J. H. 2009, A&A, 503, 323, doi: 10.1051/0004-6361/200912129
- Viti et al. (2020) Viti, S., Fontani, F., & Jiménez-Serra, I. 2020, MNRAS, 497, 4333, doi: 10.1093/mnras/staa2215
- Wakelam et al. (2017) Wakelam, V., Loison, J. C., Mereau, R., & Ruaud, M. 2017, Molecular Astrophysics, 6, 22, doi: 10.1016/j.molap.2017.01.002
- Watson (1976) Watson, W. D. 1976, Reviews of Modern Physics, 48, 513, doi: 10.1103/RevModPhys.48.513
- Wilson (1999) Wilson, T. L. 1999, Reports on Progress in Physics, 62, 143, doi: 10.1088/0034-4885/62/2/002
- Woitke et al. (2016) Woitke, P., Min, M., Pinte, C., et al. 2016, A&A, 586, A103, doi: 10.1051/0004-6361/201526538
- Woods & Willacy (2009) Woods, P. M., & Willacy, K. 2009, ApJ, 693, 1360, doi: 10.1088/0004-637X/693/2/1360
- Yoshida et al. (2019) Yoshida, K., Sakai, N., Nishimura, Y., et al. 2019, PASJ, 71, S18, doi: 10.1093/pasj/psy136
- Yoshida et al. (2022) Yoshida, T. C., Nomura, H., Furuya, K., Tsukagoshi, T., & Lee, S. 2022, ApJ, 932, 126, doi: 10.3847/1538-4357/ac6efb
- Zhang et al. (2017) Zhang, K., Bergin, E. A., Blake, G. A., Cleeves, L. I., & Schwarz, K. R. 2017, Nature Astronomy, 1, 0130, doi: 10.1038/s41550-017-0130
- Zhang et al. (2021) Zhang, Y., Snellen, I. A. G., Bohn, A. J., et al. 2021, Nature, 595, 370, doi: 10.1038/s41586-021-03616-x
Appendix A 2 D distributions of abundance and carbon isotope ratio