VARIATIONS IN LINE PROFILES OF ATOMIC TRANSITIONS IN RR LYRAE STARS
Abstract
We have investigated the absorption shapes of atomic lines and H in RR Lyrae stars. We used the database of high resolution spectra gathered with the Las Campanas Observatory du Pont Telescope, analyzing a set of about 2700 short exposure spectra of 17 RRab and 5 RRc variables. To increase the signal-to-noise of the spectra for each star, we first co-added spectra in small photometric phase bins, and then co-added metallic line profiles in velocity space. The resulting line absorption shapes vary with photometric phase in a consistent manner for all RRab stars, while exhibiting no obvious phase-related variations for the RRc stars. We interpret these line profile variations in terms of velocity gradients in the photospheric layers that produce absorption line profiles. The H profiles are much broader, indicative of shock temperatures of order 100,000 K.
1 INTRODUCTION
RR Lyrae stars are old low-mass pulsating variable stars located on the HR Diagram horizontal branch. They are in the post helium flash evolutionary stage, and are undergoing hydrostatic core helium fusion. The relative brightness of RR Lyraes absolute V-band magnitudes of +0.7) has made them attractive standard candles for distance determinations of Milky Way field stars, globular clusters and nearby galaxies. RR Lyraes exhibit photometric and spectroscopic variations with pulsational periods mostly in the range 0.250.75 days, but those cyclical variations are essentially constant over human timescales. Most importantly, the mean absolute V-band magnitudes of RR Lyrae stars are similar with a well-calibrated dependence on metallicity.
Our group has concentrated on studies that use high resolution optical spectroscopy to gain insight into surface activity and envelope properties of RR Lyrae variables. The goal was to explore the spectroscopic properties of these stars in detail at many phase points with a single telescope/instrument configuration, rather than to conduct a large-sample survey using possibly heterogeneous data sets with limited phase information. We have used these spectra for many purposes, such as determination of metallicities and abundance ratios (For et al. 2011a, b, Govea et al. 2014, Chadid et al. 2017, Sneden et al. 2017), studies of envelope kinematics (Chadid et al., Sneden et al.), rotation and macroturbulence estimation (Preston et al., 2019), and description of helium emission/absorption variations (Preston et al., 2022). Other investigators have used these du Pont echelle spectra as bases for studies incorporating other data sets to improve our understanding of RR Lyrae properties such as the Oosterhoff dichotomy (Fabrizio et al., 2019; Braga et al., 2021a), the Bailey diagram (Bono et al., 2020), the S metallicity parameter and [/Fe] ratios (Crestani et al., 2021a, b), radial velocity curves (Braga et al., 2021b).
In our previous studies we have seen evidence of line shape variations in atomic transitions at various pulsational phases in many RR Lyrae stars. Only in very limited phase domains are observed line profiles symmetric and described reasonably well by Gaussian functions. In this paper we present evidence that line profile distortions are systematic with phase and are similar in amplitude for all stars. These variations can be interpreted through velocity changes in photospheric material that is in constant motion during the pulsational periods of RR Lyrae stars. In section §2 we describe the spectroscopic database and reduction steps for the present study. Section §3 shows how we coadded the spectra in two ways in order to produce single mean profiles for each star at multiple pulsational phase points. We demonstrate that the shapes of these profiles vary systematically throughout the pulsational cycles in essentially the same manner in all of our program stars. Finally In §4 we develop a simple model for velocity gradients that can account for the RRab line profile variations.
2 THE SPECTROSCOPIC DATA SET
From 2006 to 2014 we gathered more than 5400 RR Lyrae spectra with the Las Campanas Observatory du Pont Telescope Echelle Spectrograph111 https://www.lco.cl/technical-documentation/echelle-spectrograph-users-manual/. In this work we use the database of several thousand du Pont echelle spectra of RR Lyrae stars (Sneden et al., 2021). The spectra have resolving power = 27,000 at 5000 Å. Here we have selected a set of stars that have a large number of spectra over their complete pulsational cycles. In Table 1 we give the photometric properties of the chosen stars, along with their metallicities, the total number of du Pont spectra available, and the number of co-added spectra (discussed below). The and values are taken from Table 1 of Chadid et al. (2017). The metallicities are means of the [Fe i/H] and [Fe ii/H] values listed in Table 2 of that paper.
The pulsational periods of RR Lyrae stars are mostly in the range 0.25 d P 0.75 d. Spectroscopic exposure times were confined to small fractions of these periods, never more than 600 s (0.01P), usually 400 s or less. This restriction resulted in relatively poor signal-to-noise ratios, S/N 1520 near 4300 Å for most spectra.
The reduction procedures for the du Pont data have been described in detail by For et al. (2011a); see that paper for details of the methods. Standard IRAF222 https://iraf.noirlab.edu/ (Tody, 1986, 1993; Fitzpatrick et al., 2024) procedures were employed in these tasks. The resulting fully reduced “raw spectra” have about 50 echelle orders spanning the approximate wavelength range 39008800 Å. Then, for the present work we created continuous flattened spectra from 40004600 Å, a spectral region that has the largest collection of atomic transitions available for study in typical RR Lyrae stars. The wavelength step size in these raw spectra is = 0.045 Å/pixel, or velocity displacement = 3.1 km s-1 at 4300 Å.
The observed line profiles of photospheric transitions in all stars arise from the combined broadening effects of the spectrograph instrumental profile and stellar temperature, microturbulence, macroturbulence, and rotational conditions. RR Lyraes have continuous envelope and atmospheric motions that are accompanied by shock waves at multiple phase points. These motions have been well documented, and are the sources of the asymmetries under investigation here. Preston et al. (2019) attempted to detect rotation in RRab stars, concluding that its effects cannot be disentangled from those arising from macroturbulence. The combined effects of macroturbulence and rotation were estimated as 5 1 km s-1; see their Figure 16.
Here we follow the discussion in Preston et al. (2019) to estimate various broadening components. The instrumental broadening of the du Pont echelle was explored extensively in that paper, which derives FWHM = 11.4 0.5 km s-1. The combined effects of thermal and microturbulent broadening, expressed as can be reasonably estimated because of the regularity of RR Lyrae variations. Figure 6 of Preston et al. suggests that for RRab stars varies from 6100 K in the phase range 0.350.75, to 7300 K near 1.0 . Similarly, microturbulent velocity changes in the range 2.94.0 km s-1 in concert with the variations. This yields a small range of thermal and microturbulent broadening during RRab cycles: 3.2 4.2 km s-1. For our purposes, understanding the imprecision of these estimates, we will hereafter assume = 3.7 km s-1.
As a preliminary to our investigation of skew we coadded observations in small intervals of phase to increase the S/N. Several considerations are involved in the creation of coadded spectra for a given star, the most important being brightness of the star, its location in the sky, and the dates of observing runs when it is observable. Thus, many observations were made of stars in the constellations Apus and Octans with declinations -80∘, because such stars can be observed at very large hour angles up to 6 h. Conversely, limited numbers of observations were made of stars with northerly declinations.
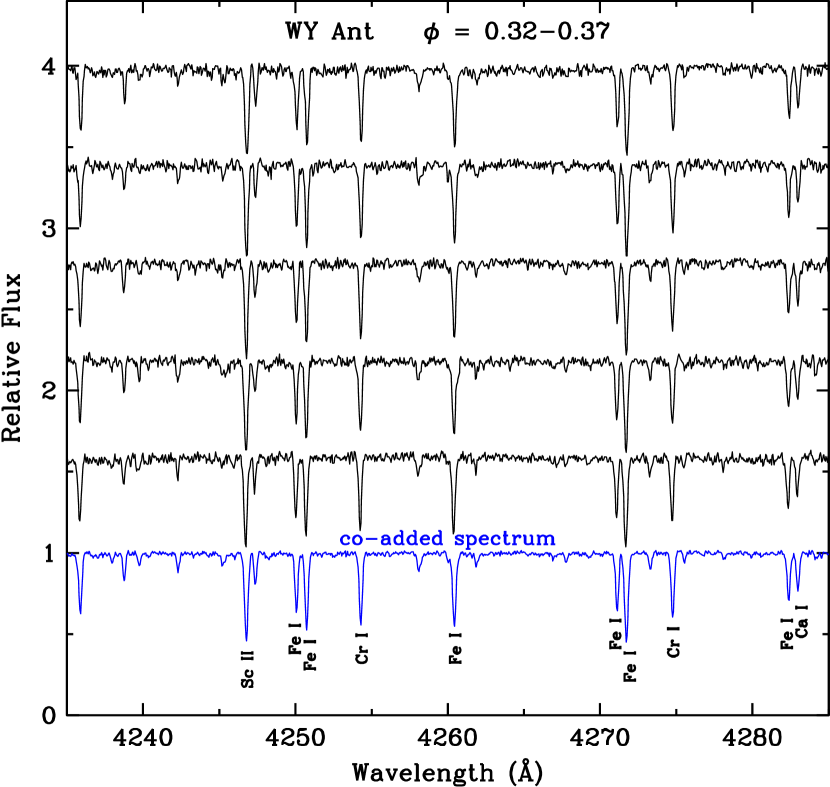
The maximum number of spectra in coadds is 10 and a typical number is 5. In a few instances single observations are included as “coadds” at interesting phases. Typical phase intervals of coadds is 0.03P. Maximum interval with few exceptions is 0.1P. In Figure 1 we illustrate the co-addition process. For this and some subsequent figures we have chosen program star WY Ant to illustrate the analytical steps. Five raw spectra contributed to the mean spectrum shown in the figure. Visual inspection will confirm that while the individual spectra have S/N 50, the co-added spectrum has S/N 100, revealing atomic lines worthy of further analysis while depressing many noise features.
3 LINE COADDITION AND PROFILE MEASUREMENTS
3.1 Formation of a Mean Metallic Line

While atmospheric conditions of RR Lyraes are constantly variable, inspection of Figure 6 in Preston et al. (2019) and other literature studies suggest that typically for RRab stars away from the shock-wave phases 6200 K, log g 2.0, and 3.0 km s-1. Superficially, their spectra look similar to that of the Sun. However, most RR Lyraes are metal-poor, [Fe/H] 1, and many weak lines in the solar spectrum disappear into RR Lyrae continuum regions. Additionally, RR Lyraes have much broader lines than does the Sun, eliminating some otherwise promising lines that become inaccessible for transition profile analysis. The relatively low values of our spectra also mangle some profiles of the remaining lines. Finally, the number of measurable transitions varies systematically with phase. The sharpest and cleanest line profiles occur in the 0.35 0.10 domain, while the broadest, most distorted profiles are often seen when 0.90 0.15.
To systematically determine a candidate line list that might serve for most program stars at most phases, we first used the solar line compendium of Moore et al. (1966) in conjunction with one of our higher spectra to identify promising transitions in the 40004600 Å that should be examined in all spectra. This exercise yielded about 100 lines.
For each co-added spectrum, we systematically measured approximate equivalent widths (s) in a semi-automatic procedure using the specialized software code SPECTRE (Fitzpatrick & Sneden, 1987). The purpose was not to determine accurate s for detailed study. Rather we wanted to identify which lines should be included in our line profile analysis of each spectrum, and their general absorption strengths. Figure 1 identifies lines retained for the example star/phase in the spectral region displayed in the plot.
For a given spectrum, the spectral region surrounding each identified line was interpolated in velocity units to small steps (0.3 km s-1). The central depth of the observed line was found in the interpolated spectrum, and a velocity array extending 400 km s-1from this central point was computed. Then these line arrays in velocity space were co-added to yield the final mean line profile. The number of individual transitions contributing to the mean profiles varied greatly from star to star (due to metallicity differences) and phase to phase (due to changes in line profile sharpness). Additionally, differences for individual stars based on their apparent magnitudes affected the number of lines available for analysis. In total, the mean line profiles were composed of between 2080 transitions.
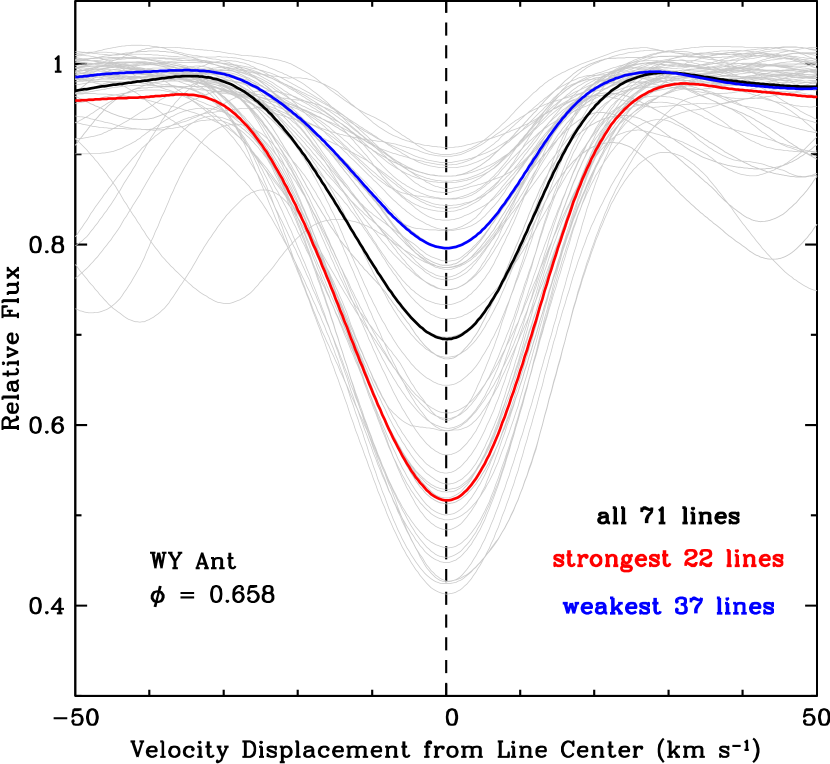
When the number of transitions used for a star at a particular phase was large, 40, the mean profiles could be constructed with subsets of lines segregated in line strength, ionization state, and excitation energy. In Figure 2 we show a typical example of such flexible line averaging, choosing WY Ant at = 0.658. We have selected this star for display in this and several more figures because it is typical of our RRab sample, and has spectra well covering its pulsational phases. At = 0.66 WY Ant has a co-added mean spectrum with 71 measurable lines having an range 20280 mÅ. Here we show the 71 line profiles individually as thin black lines and their mean as a thick black line. The means of the weakest and strongest lines are shown as blue and red lines, respectively. Inspection of these transition profiles reveals line asymmetries in all three means, with extended blue wings in each case. These asymmetries will be quantified in §3.2. In columns 9 and 10 of Table 1 we list the minimum and maximum number of lines that participated in the line profile calculations at individual phase points for each star.
3.2 Line Statistics
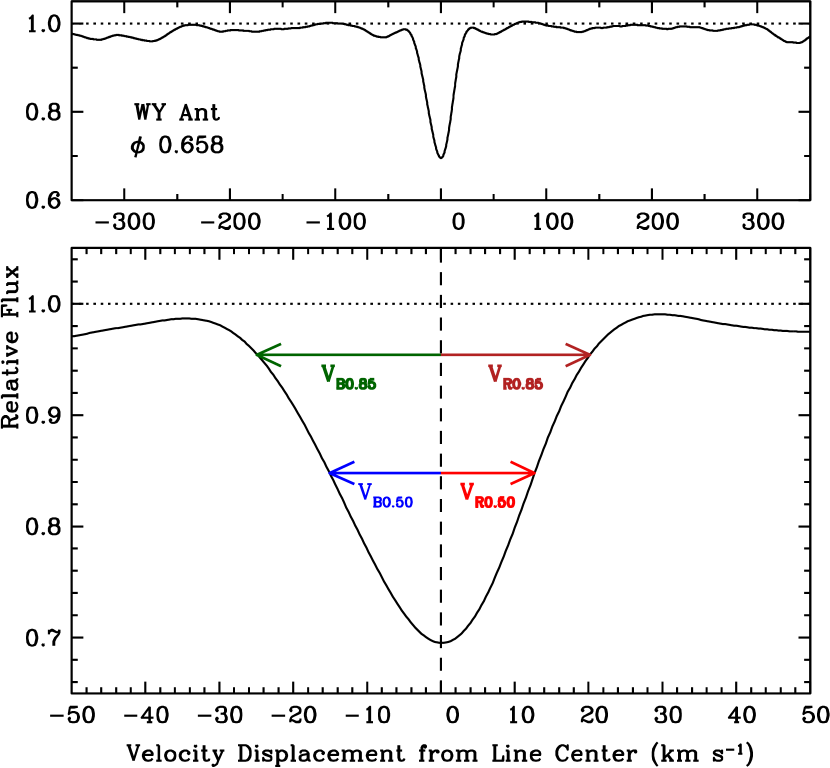
We made 3 sets of line profile measurements: (1) blue and red velocity widths, labeled and , at fractional line fluxes of 0.50 of the local continuum (e.g., at the half widths); (2) velocity widths and at 0.85 of the continuum; and (3) Pearson’s statistical 3rd moment skew values333 https://en.wikipedia.org/wiki/Skewness at those two flux levels, and . In Figure 3 we use WY Ant at pulsational phase = 0.658 to illustrate our line profile parameters. The line profile is the one formed from the whole transition set depicted in Figure 2. The choice of 0.50 central depth is a standard one for line profile descriptions. The 0.85 level was empirically chosen to measure the line asymmetries in the wings of the profile, without going so far from line center that continuum placement and contamination from other spectral features become major measurement uncertainty sources.
The first task in this process was continuum setting. In Figure 2 the apparent features that are 3050 km s-1 away from line center in the coadded line profile arise from atomic blends in individual transitions that depress their local continua. Therefore for the coadded line profiles better continuum placement was accomplished from inspection of a series of high-flux points in an expanded velocity interval, as we show in the top panel of Figure 3. Then we measured line quantities defined in the previous paragraph; see the bottom panel of this figure. Their values in all program stars at all coadded phase points are listed in Table 2.
In the WY Ant = 0.658 example, our measured quantities were = 15.1 km s-1, = 12.7 km s-1, = 24.9 km s-1, = 20.2 km s-1, and skew0.50 = 0.04, and skew0.85 = 0.10.. The blueward asymmetry is well defined at both measurement depths: + = 2.4 km s-1 and + = 4.7 km s-1. The skew values are = 0.04 and = 0.10. These line statistics all support the visual impression in Figure 3 of a line with a blueward distorted profile.
In Figure 4 we show three descriptors of WY Ant line shapes at the 0.50 and 0.85 relative flux levels for all 21 of its co-added phase points. In the top panel total line widths + and + are plotted. A relatively smooth variation from minimum width near phase 0.35 to maximum near 0.90 is easy to see and is not surprising. This trend has been noted in many papers, and has been explored in detail by For et al. (2011b) and Preston et al. (2019). In the middle panel we show a simple asymmetry measure of the differences between red and blue widths VR0.50VB0.50 and VR0.85VB0.85. At phases near line width minimum, 0.2 0.5, WY Ant metal line profiles are symmetric to our measurement limits. This apparently calm phase interval is followed by a small but easily detected blueward asymmetry that lasts until 0.85, and then by a sharp turn to a much larger redward asymmetry during the photometric rising-light phase domain. In the bottom panel of Figure 4 we plot the 3rd moment skew values at the two line flux points. The skews are consistent with the line width differences and are more statistically robust. We adopt skew as the primary line asymmetry indicator.
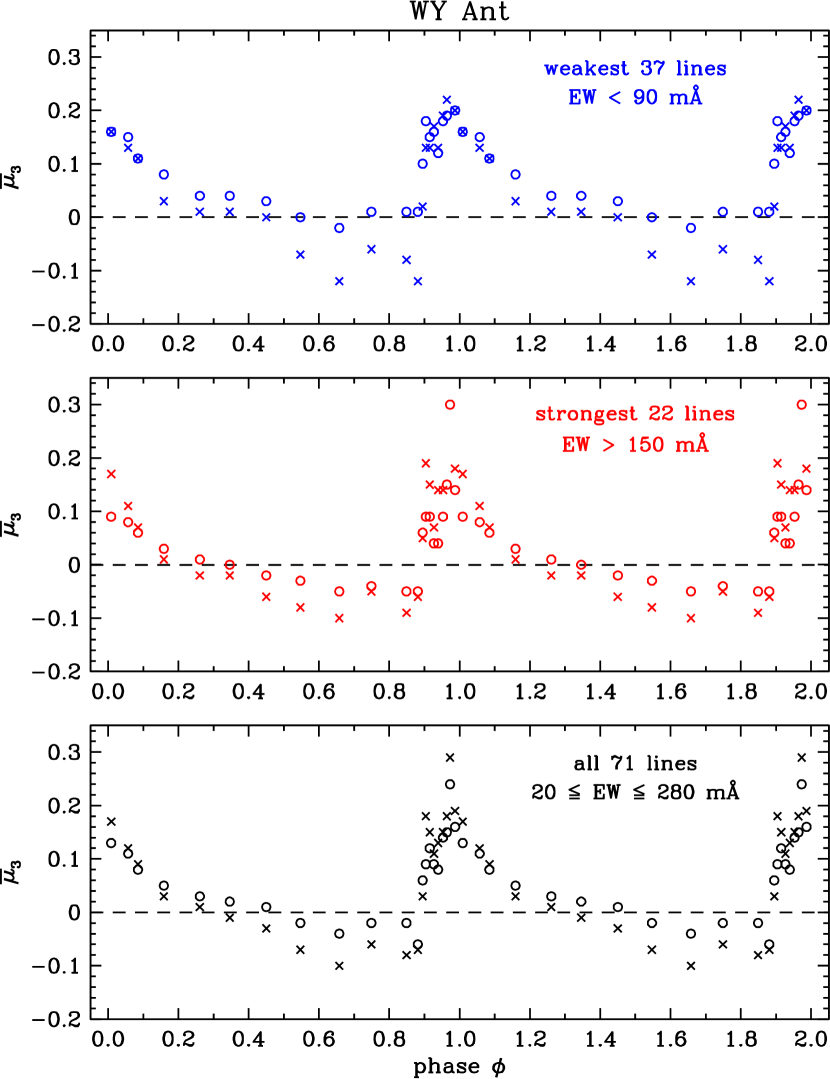
WY Ant at phase = 0.658 has many useful metallic lines with a large absorption strength range, 20 EW 280 mÅ (reduced width 5.3 log10(EW/ 4.2). Following Figure 2’s line strength divisions, in Figure 5 we show the variation of skew for weak, strong, and all lines. Inspection of these figure panels strongly suggest that the skews are qualitatively the same for lines on the linear to the damping portions of the curve of growth. This further implies that the metallic line formation photospheric layer is relatively compact. All atomic absorptions occurs in similar temperature/pressure conditions.
3.3 Line Profile Variations for RRab and RRc Stars
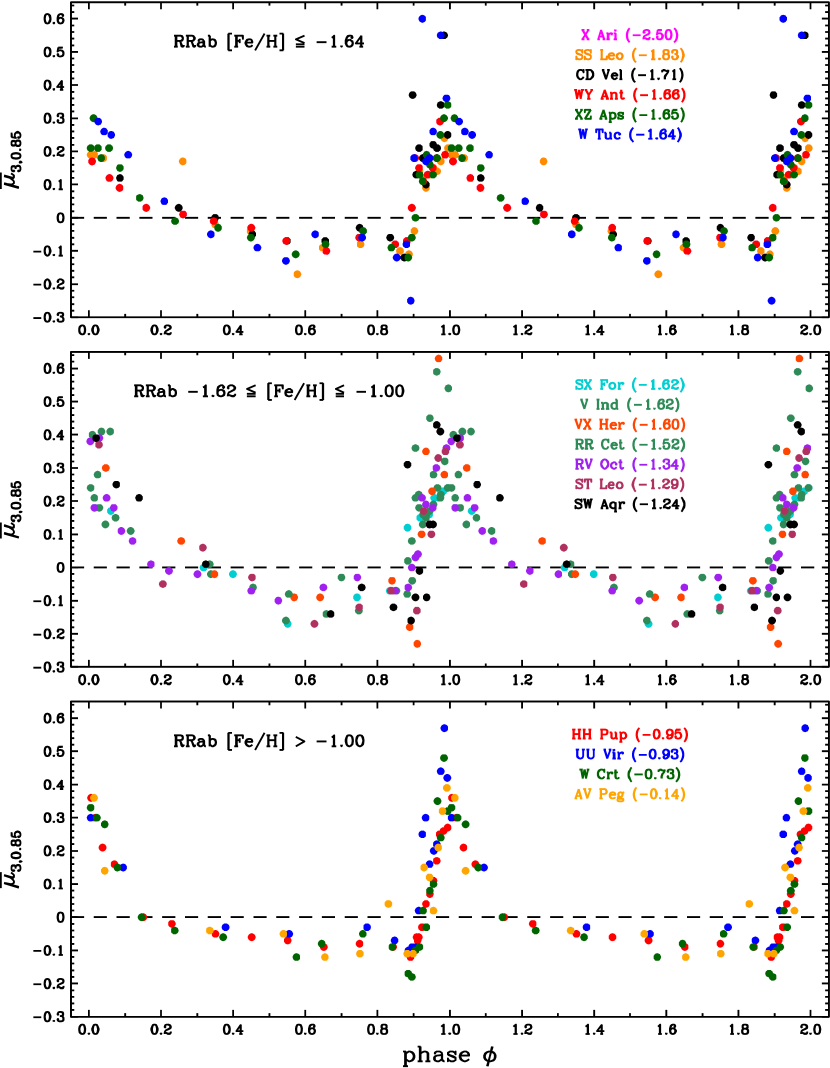
Our program sample is composed of 17 RRab and 5 RRc stars. In Figure 6 we gather the skew values for the RRab stars. Three panels are used separate the stars into lowest, intermediate, and highest metallicity groups. Previous papers by our group (e.g., Chadid et al. 2017; Sneden et al. 2017, 2018; Preston et al. 2019 have divided the RR Lyraes into metal-rich (MR) or metal-poor (MP) categories with the split estimated to be [Fe/H] = 1.0. By that criterion, the top and middle panels of Figure 6 contain all MP stars and the bottom panel has only MR stars. Inspection of the figure reveals no obvious skew differences in different metallicity bins. For MR stars (bottom panel) the phase regime of positive skew appears to be slightly smaller than those of the more metal poor stars (middle and top panels), but our MR sample has only 4 stars. Additionally MR stars have stronger line spectra at all phases, yielding more sharply defined average line profiles than for the MP groups. Gathering spectra for more MR RRab stars will be needed to resolve this possible difference between the RRab metallicity groups.
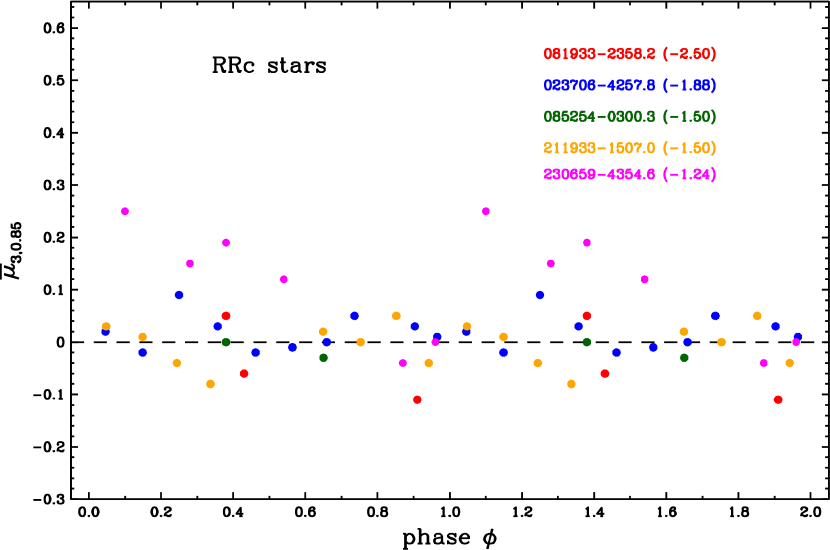
In Figure 7 we show the variation in skew with phase for our sample of RRc stars. The data in this plot strongly suggest that RRc metal lines have symmetric profiles. Apart from star AS230659–4354.6, the measured skew values all are contained within 0.1 +0.1, and there is no obvious phase dependence of the skew values. We caution that we did not observe RRc stars as intensively as the RRab stars. We have fewer coadded phase points for any RRc star (Nspec,max = 10, Table 1) than for any RRab (Nspec,min = 13, Table 1. Additionally, RRc line strengths are weaker than those of RRab stars of similar metallicities because RRc stars are warmer. Finally, the S/N values of our RRc spectra are typically lower than those of our RRab sample. Therefore we regard the skew range in Figure 7 as consistent with no line profile red/blue distortions. However, this conclusion is based only on the 5 RRc stars considered in this paper, and may not apply to all members of the RRc class. For example, Bono et al. (2000) applied hydrodynamical modeling to detailed light curves of the RRc variable U Com (P = 0.29 d), finding photometric features that would suggest that structure in RV variations might be present. A larger spectroscopic survey of RRc stars should be undertaken.
4 INTERPRETATION OF THE LINE SKEW MEASUREMENTS
Detailed dynamical model atmosphere non-local thermodynamic equilibrium (NLTE) line transfer computations are beyond the scope of the present observational spectroscopic contribution. Here we sketch the outlines of a possible interpretation of the phase-dependent skewed line shape profiles of RRab stars.
4.1 Skew due to Putative Velocity Gradients in Metallic Line-forming Regions

Investigations of skew in solar absorption lines were reviewed in detail by Dravins (1982 and references therein), who interpreted this skew successfully in terms of a solar surface covered by myriads of hotter upflowing convection cells surrounded by cooler downflowing intercellular gas. We propose a different explanation for the time-dependent skew observed in RR Lyrae stars: namely, the existence of velocity gradients in their stellar atmospheres first predicted by Bono et al. (1994).
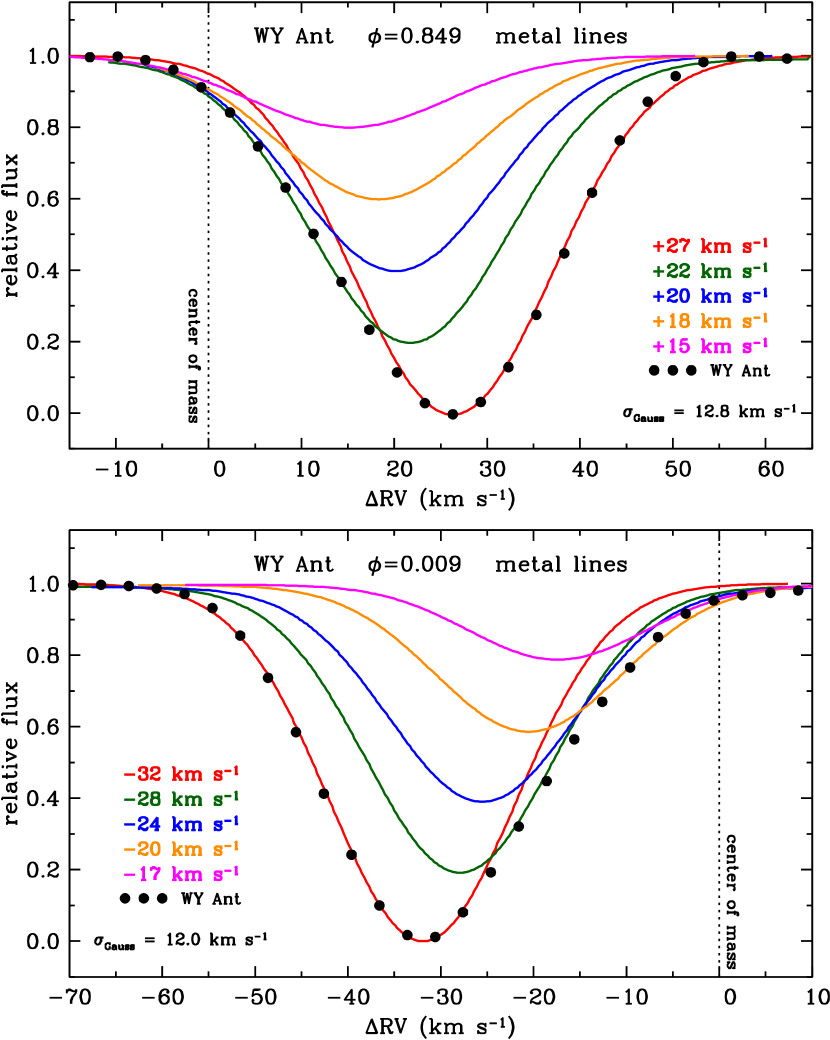
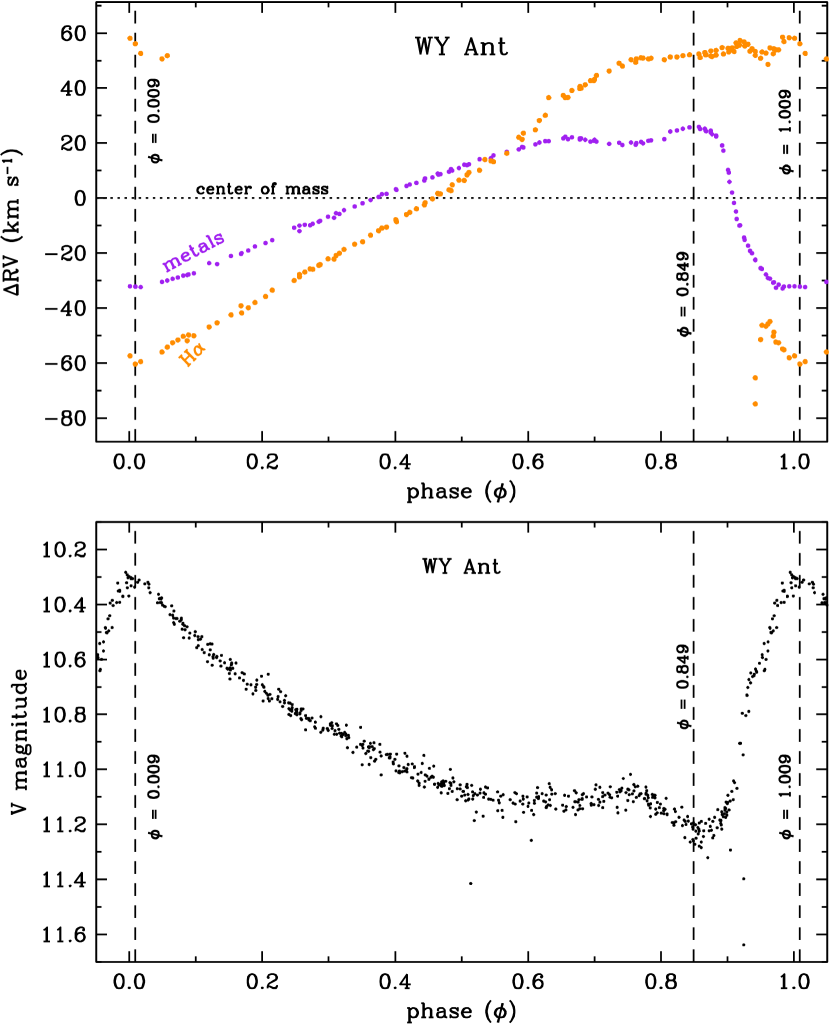
In the top panel of Figure 8 we show the metallic line skew profiles in metal-poor WY Ant at pulsational phase = 0.849, near minimum light (maximum infall velocity). In the bottom panel we show the skewed line profiles at = 0.009, just after maximum light (near maximum outflow velocity). Black filled circles denote the observed profiles, and solid lines represent our fits to the observations, to be explained below. The velocities, labeled RV, are relative to the center-of-mass velocity, defined here to be the average of the radial velocities of metal lines over a pulsational cycle. For WY Ant, we derived center-of-mass RV = 203.7 km s-1, using velocity data originally presented in Chadid et al. (2017). The RV values for both metal lines and H are shown in the top panel of Figure 9, with vertical lines placed at the phases chosen for Figure 8.
The bottom panel of Figure 9 contains the photometric V-band light curve of WY Ant444V magnitudes were taken from the All Sky Automated Survey (ASAS, Pojmanski et al. 2005); and references therein; https://www.astrouw.edu.pl/asas/. This connects photometric and spectroscopic quantities for WY Ant. Other RRab stars in our study have essentially the same variations throughout their pulsational cycles. Thus, phase = 0.849 shows very blue-skewed line profiles (Figure 5) for WY Ant, accompanying maximum infall velocity (RV 25 km s-1; Figure 9 top panel) and minimum brightness ( 11.2; Figure 9 bottom panel). Phase = 0.009 (repeated at = 1.009) corresponds to near-maximum positive (redward) skew, maximum outflow (RV 32 km s-1), and maximum brightness ( 10.3).
In both panels of Figure 8 the red curves are Gaussians fitted to the unskewed wings of the observed profiles. Gaussian values of 12.8 km s-1 and 12.0 km s-1 were used to match these wings for phases 0.849 and 0.009, respectively. We assume that these red wings represent the intrinsic profiles of gas in the metal line-forming regions at these phases. We then empirically added 4 additional line components with the same values but weaker line depths and increasing RV offsets in order to adequately match the skewed profile wings. The observed profiles are formed in ranges of geometric depth that begin at the photosphere ( 0.6) and continue to very small values in the case of H. Most metal lines are formed at modest optical depths 0.1 0.8 (e.g., Gray 2008), with the far wings arising from the deepest layers and cores at higher atmospheric optical levels. As lines grow stronger their mean formation level advances outward in stellar atmospheres. In early stellar atmospheres modeling H formation was considered as arising in a separate outer atmosphere slab by Kraft et al. (1964). This notion is supported by the computations of Stellingwerf (2013) that produced an accumulation of gas high in the atmosphere due to the succession of a multitude of outward progressing shocks.
To understand our skew profiles during rising light ( 0.9) we consider a simple model in which an outward propagating pressure wave, conserving momentum ( = constant), moves through an atmosphere of exponentially decreasing density. Conservation of momentum then puts a condition on the velocity of the wave, = cRα in which and are positive constants chosen to match the skew contributions at locations given by equations 24 and 25 of Edmonds (1969). In the post-maximum light phase ( 0.1) the velocity field, produced initially by gravitational infall, is modified by deceleration due to the pressure support predicted by Hill (1972).
We have made numerical experiments to estimate atmospheric line formation heights. We adopted the static model atmospheres of Kurucz (2011, 2018)555 http://kurucz.harvard.edu/linelists.html for these calculations. For phase = 0.847 our estimate of height above the photosphere for the model that we adopt for minimum light is shown in Figure 10. Unfortunately a similar plot for = 0.009 cannot be constructed from the observed line profiles of H because of the major interfering contribution of the red-shifted component of the doubled line profile at this phase (see the H profiles for our program star metal-poor RV Oct in Figure 18 of Chadid et al. (2017).
In our model the observed metal line profile (Figure 8 black dots) is created by contributions from a succession of layers at geometric depths within the line forming regions (R in Figure 10) that move at different redial velocities indicated in the legends. We use observed RV values of Figure 8 as proxies for unknown heights, R, within line forming regions. Actual contribution functions must be calculated by use of equations 24 and 25 of Edmonds (1969) We make no attempt to define these geometric heights in this initial reconnaissance.
Our profile in Figure 8 (top) requires a velocity gradient 20 km sec-2; the range of R corresponding to the range 0.67 0.1 in which metal lines are formed is some three times smaller than the total velocity gradient 60 km sec-2 which we deem appropriate for H in Figure 11. The two observed profiles conform to expectations. The curves with minima at fluxes 0,2, 0,4, 0.6, and 0.8, fitted to the skewed wings, are idealized Gaussian contributions to the observed skews at geometric depths defined by equations 24 and 25 of Edmonds (1969). We make no attempt to define these geometric depths in this first reconnaissance.
4.2 Comparison of Metal and H gradients
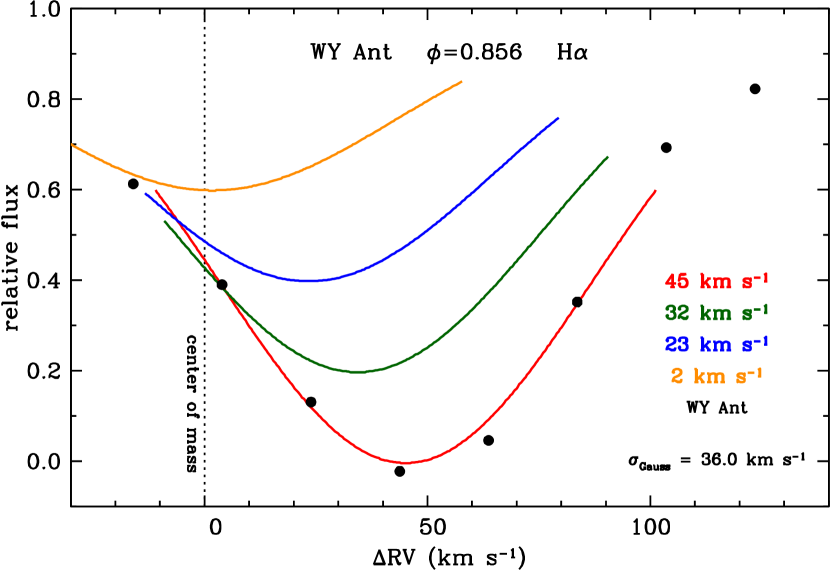
Figure 11 shows the H profile in this star at phase = 0.86, almost identical the 0.849 phase chosen for one of the metal line plots in Figure 8.666 The top panel of Figure 9 contains two sets of RV measurements for H in WY Ant in the phase range 0.951.05. This is the phase regime with obvious doubling of H profiles mentioned earlier, limiting our ability to make detailed statements about this transition in our RRab stars. Comparison of the FWHMs of metal lines (12.012.8 km s-1) and H immediately shows that temperature, not turbulence, must be the principal cause of observed line broadening in our spectra. Were turbulence the cause of broadening, line widths would be independent of atomic mass. To estimate temperatures we first remove instrumental broadening FWHMinst = 11.36 km s-1 (Preston et al., 2019) from the observed values. In the absence of better information about the temperature structure of the line forming regions we calculate Local Thermodynamic Equilibrium (LTE) temperatures given in Table 3. We regard the factor of 2 disparity between our temperature estimates for the metal lines at phases 0.849 and 0.009 as an indicator of the uncertainty in our calculations. We are content to conclude that temperatures of order 100,000 K in shocked gas are required to explain line widths in our spectra of WY Ant, an RRab star typical of our metal-poor sample.
5 SUMMARY
We have investigated metal and H line profile shapes in 17 RRab and 5 RRc variable stars. To create high resolution, high signal-to-noise line profiles for each star we first performed coaddions of individual spectra in narrow phase intervals. Then for each coadded spectrum we stacked together many metal lines in velocity space. The resulting mean line profiles exhibit line profile distortions that vary regularly with phase for all of our RRab stars. No major differences in the line profiles variations are seen over a large metallicity range. The RRc stars show no obvious phase-based variations. We have constructed model line profiles that suggest that velocity gradients in RR Lyrae photospheres can successfully account for the observed cyclic RV variations.
References
- Bono et al. (1994) Bono, G., Caputo, F., & Stellingwerf, R. F. 1994, ApJL, 432, L51, doi: 10.1086/187509
- Bono et al. (2000) Bono, G., Castellani, V., & Marconi, M. 2000, ApJ, 532, L129, doi: 10.1086/312582
- Bono et al. (2020) Bono, G., Braga, V. F., Crestani, J., et al. 2020, ApJ, 896, L15, doi: 10.3847/2041-8213/ab9538
- Braga et al. (2021a) Braga, V. F., Crestani, J., Fabrizio, M., et al. 2021a, ApJ, 919, 85, doi: 10.3847/1538-4357/ac1074
- Braga et al. (2021b) —. 2021b, ApJ, 919, 85, doi: 10.3847/1538-4357/ac1074
- Chadid et al. (2017) Chadid, M., Sneden, C., & Preston, G. W. 2017, ApJ, 835, 187, doi: 10.3847/1538-4357/835/2/187
- Crestani et al. (2021a) Crestani, J., Fabrizio, M., Braga, V. F., et al. 2021a, ApJ, 908, 20, doi: 10.3847/1538-4357/abd183
- Crestani et al. (2021b) Crestani, J., Braga, V. F., Fabrizio, M., et al. 2021b, ApJ, 914, 10, doi: 10.3847/1538-4357/abfa23
- Dravins (1982) Dravins, D. 1982, ARA&A, 20, 61, doi: 10.1146/annurev.aa.20.090182.000425
- Edmonds (1969) Edmonds, F. N., J. 1969, J. Quant. Spec. Radiat. Transf., 9, 1427, doi: 10.1016/0022-4073(69)90126-5
- Fabrizio et al. (2019) Fabrizio, M., Bono, G., Braga, V. F., et al. 2019, ApJ, 882, 169, doi: 10.3847/1538-4357/ab3977
- Fitzpatrick et al. (2024) Fitzpatrick, M., Placco, V., Bolton, A., et al. 2024, arXiv e-prints, arXiv:2401.01982, doi: 10.48550/arXiv.2401.01982
- Fitzpatrick & Sneden (1987) Fitzpatrick, M. J., & Sneden, C. 1987, in Bulletin of the American Astronomical Society, Vol. 19, Bulletin of the American Astronomical Society, 1129
- For et al. (2011a) For, B.-Q., Preston, G. W., & Sneden, C. 2011a, ApJS, 194, 38, doi: 10.1088/0067-0049/194/2/38
- For et al. (2011b) For, B.-Q., Sneden, C., & Preston, G. W. 2011b, ApJS, 197, 29, doi: 10.1088/0067-0049/197/2/29
- Govea et al. (2014) Govea, J., Gomez, T., Preston, G. W., & Sneden, C. 2014, ApJ, 782, 59, doi: 10.1088/0004-637X/782/2/59
- Gray (2008) Gray, D. F. 2008, The Observation and Analysis of Stellar Photospheres (Cambridge, UK: Cambridge University Press)
- Hill (1972) Hill, S. J. 1972, ApJ, 178, 793, doi: 10.1086/151835
- Kraft et al. (1964) Kraft, R. P., Preston, G. W., & Wolff, S. C. 1964, ApJ, 140, 235, doi: 10.1086/147910
- Kurucz (2011) Kurucz, R. L. 2011, Canadian Journal of Physics, 89, 417, doi: 10.1139/p10-104
- Kurucz (2018) Kurucz, R. L. 2018, in Astronomical Society of the Pacific Conference Series, Vol. 515, Workshop on Astrophysical Opacities, ed. C. Mendoza, S. Turck-Chiéze, & J. Colgan, 47
- Moore et al. (1966) Moore, C. E., Minnaert, M. G. J., & Houtgast, J. 1966, The solar spectrum 2935 A to 8770 A (National Bureau of Standards Monograph, Washington: US Government Printing Office (USGPO))
- Pojmanski et al. (2005) Pojmanski, G., Pilecki, B., & Szczygiel, D. 2005, Acta Astron., 55, 275
- Preston et al. (2022) Preston, G. W., Sneden, C., & Chadid, M. 2022, AJ, 163, 109, doi: 10.3847/1538-3881/ac46ca
- Preston et al. (2019) Preston, G. W., Sneden, C., Chadid, M., Thompson, I. B., & Shectman, S. A. 2019, AJ, 157, 153, doi: 10.3847/1538-3881/ab0ae1
- Sneden et al. (2017) Sneden, C., Preston, G. W., Chadid, M., & Adamów, M. 2017, ApJ, 848, 68, doi: 10.3847/1538-4357/aa8b10
- Sneden et al. (2018) Sneden, C., Preston, G. W., Kollmeier, J. A., et al. 2018, AJ, 155, 45, doi: 10.3847/1538-3881/aa9f16
- Sneden et al. (2021) Sneden, C., Preston, G. W., Chadid, M., Shectman, S., & Thompson, I. 2021, Complete RR Lyrae Las Campanas spectra, Zenodo, doi: 10.5281/ZENODO.5794389
- Stellingwerf (2013) Stellingwerf, R. F. 2013, ArXiv e-prints. https://arxiv.org/abs/1310.0535
- Tody (1986) Tody, D. 1986, in Society of Photo-Optical Instrumentation Engineers (SPIE) Conference Series, Vol. 627, Instrumentation in astronomy VI, ed. D. L. Crawford, 733, doi: 10.1117/12.968154
- Tody (1993) Tody, D. 1993, in Astronomical Society of the Pacific Conference Series, Vol. 52, Astronomical Data Analysis Software and Systems II, ed. R. J. Hanisch, R. J. V. Brissenden, & J. Barnes, 173
| Name | aa = HJB 2,450,000. | [Fe/H] | Nspec | Nspec | #linesbb#lines(min) and #lines(max) are the smallest and largest number of lines contributing to the mean line profiles at a single phase point for a star. | #linesbb#lines(min) and #lines(max) are the smallest and largest number of lines contributing to the mean line profiles at a single phase point for a star. | |||
|---|---|---|---|---|---|---|---|---|---|
| (d) | (d) | (mag) | (mag) | raw | coadded | min | max | ||
| RRab Stars | |||||||||
| WY Ant | 0.574344 | 3835.592 | 10.4 | 0.85 | 1.66 | 145 | 21 | 32 | 76 |
| SW Aqr | 0.459303 | 1876.138 | 10.6 | 1.28 | 1.24 | 135 | 18 | 8 | 55 |
| XZ Aps | 0.587266 | 3836.276 | 11.9 | 1.10 | 1.65 | 289 | 26 | 17 | 77 |
| X Ari | 0.651170 | 1890.064 | 9.2 | 0.94 | 2.50 | 195 | 19 | 12 | 49 |
| RR Cet | 0.553029 | 1900.312 | 9.3 | 0.82 | 1.52 | 96 | 20 | 19 | 65 |
| W Crt | 0.412013 | 1871.640 | 10.9 | 1.10 | 0.76 | 170 | 23 | 16 | 65 |
| SX For | 0.605342 | 1870.406 | 10.9 | 0.64 | 1.62 | 86 | 14 | 28 | 62 |
| VX Her | 0.455359 | 2699.996 | 10.1 | 1.25 | 1.60 | 81 | 13 | 7 | 56 |
| V Ind | 0.479602 | 1873.466 | 9.6 | 1.06 | 1.62 | 246 | 24 | 25 | 71 |
| SS Leo | 0.626335 | 1873.056 | 10.5 | 1.00 | 1.88 | 110 | 21 | 17 | 73 |
| ST Leo | 0.477984 | 5322.597 | 11.0 | 1.19 | 1.29 | 65 | 13 | 10 | 64 |
| RV Oct | 0.571170 | 3835.895 | 10.5 | 1.13 | 1.34 | 227 | 26 | 19 | 69 |
| AV Peg | 0.390382 | 5360.677 | 10.0 | 0.96 | 0.14 | 164 | 15 | 13 | 40 |
| HH Pup | 0.390745 | 1869.661 | 10.6 | 1.24 | 0.95 | 175 | 24 | 31 | 74 |
| W Tuc | 0.642243 | 5454.570 | 10.9 | 1.11 | 1.64 | 142 | 23 | 12 | 48 |
| CD Vel | 0.573509 | 3835.914 | 11.7 | 0.87 | 1.71 | 208 | 20 | 14 | 64 |
| UU Vir | 0.475609 | 1886.488 | 10.1 | 1.08 | 0.93 | 130 | 18 | 12 | 68 |
| RRc StarsccNames for RRc stars are from the All Sky Automated Survey (ASAS), Pojmanski et al. (2005) and references therein. | |||||||||
| AS023706–4257.8 | 0.311326 | 1868.717 | 8.8 | 0.50 | 1.88 | 96 | 10 | 35 | 58 |
| AS081933–2358.2 | 0.285667 | 4900.180 | 10.4 | 0.28 | 2.50 | 6 | 3 | 8 | 17 |
| AS085254–0300.3 | 0.266902 | 4900.400 | 12.5 | 0.47 | 1.50 | 6 | 2 | 28 | 38 |
| AS211933–1507.0 | 0.273460 | 1873.307 | 11.1 | 0.50 | 1.50 | 30 | 8 | 46 | 56 |
| AS230659–4354.6 | 0.281130 | 5014.925 | 12.8 | 0.30 | 1.24 | 30 | 7 | 13 | 26 |
| Star | phase | # lines | VB0.50 | VR0.50 | VB0.85 | VR0.85 | ||
|---|---|---|---|---|---|---|---|---|
| km s-1 | km s-1 | km s-1 | km s-1 | |||||
| WY Ant | 0.009 | 41 | 12.3 | 15.1 | 20.1 | 26.4 | 0.13 | 0.17 |
| WY Ant | 0.057 | 46 | 11.8 | 14.3 | 20.0 | 24.5 | 0.11 | 0.12 |
| WY Ant | 0.085 | 46 | 11.9 | 13.5 | 20.7 | 23.6 | 0.08 | 0.09 |
| WY Ant | 0.159 | 65 | 11.0 | 11.8 | 19.1 | 19.6 | 0.05 | 0.03 |
| WY Ant | 0.261 | 71 | 9.6 | 9.8 | 16.4 | 16.3 | 0.03 | 0.01 |
| WY Ant | 0.346 | 76 | 9.1 | 9.3 | 15.8 | 15.5 | 0.02 | 0.01 |
| WY Ant | 0.450 | 72 | 9.9 | 9.9 | 17.2 | 16.3 | 0.01 | 0.03 |
| WY Ant | 0.547 | 77 | 11.9 | 10.9 | 20.8 | 17.8 | 0.02 | 0.07 |
| WY Ant | 0.658 | 71 | 15.1 | 12.7 | 24.9 | 20.2 | 0.04 | 0.10 |
| WY Ant | 0.749 | 68 | 14.4 | 12.9 | 23.4 | 20.6 | 0.02 | 0.06 |
| WY Ant | 0.849 | 65 | 15.0 | 13.4 | 25.2 | 21.5 | 0.02 | 0.08 |
| WY Ant | 0.881 | 43 | 17.0 | 14.0 | 27.3 | 22.8 | 0.06 | 0.07 |
| WY Ant | 0.905 | 35 | 16.3 | 18.0 | 28.4 | 30.4 | 0.06 | 0.03 |
| WY Ant | 0.904 | 27 | 15.5 | 17.1 | 25.6 | 33.9 | 0.09 | 0.18 |
| WY Ant | 0.915 | 35 | 12.6 | 15.3 | 21.7 | 28.3 | 0.12 | 0.15 |
| WY Ant | 0.927 | 39 | 12.2 | 14.0 | 20.8 | 25.0 | 0.09 | 0.11 |
| WY Ant | 0.939 | 34 | 12.6 | 13.9 | 20.7 | 25.7 | 0.08 | 0.13 |
| WY Ant | 0.953 | 34 | 12.3 | 15.2 | 20.6 | 27.1 | 0.14 | 0.15 |
| WY Ant | 0.964 | 32 | 12.5 | 16.2 | 20.1 | 28.4 | 0.15 | 0.18 |
| WY Ant | 0.973 | 36 | 11.1 | 14.9 | 20.1 | 34.6 | 0.24 | 0.29 |
| WY Ant | 0.987 | 35 | 12.2 | 16.0 | 20.1 | 27.1 | 0.16 | 0.19 |
Note. — (This table is available in its entirety in machine-readable form.)
| phase | spectrum | FWHMobs | FWHMcorr | TLTE |
|---|---|---|---|---|
| (km s-1) | (km s-1) | (K) | ||
| 0.849 | metals | 12.8 | 5.9 | 118000 |
| 0.009 | metals | 12.2 | 4.5 | 67000 |
| 0.856 | H | 36.0 | 34.2 | 70000 |