AETTA: Label-Free Accuracy Estimation for Test-Time Adaptation
Abstract
Test-time adaptation (TTA) has emerged as a viable solution to adapt pre-trained models to domain shifts using unlabeled test data. However, TTA faces challenges of adaptation failures due to its reliance on blind adaptation to unknown test samples in dynamic scenarios. Traditional methods for out-of-distribution performance estimation are limited by unrealistic assumptions in the TTA context, such as requiring labeled data or re-training models. To address this issue, we propose AETTA, a label-free accuracy estimation algorithm for TTA. We propose the prediction disagreement as the accuracy estimate, calculated by comparing the target model prediction with dropout inferences. We then improve the prediction disagreement to extend the applicability of AETTA under adaptation failures. Our extensive evaluation with four baselines and six TTA methods demonstrates that AETTA shows an average of 19.8%p more accurate estimation compared with the baselines. We further demonstrate the effectiveness of accuracy estimation with a model recovery case study, showcasing the practicality of our model recovery based on accuracy estimation. The source code is available at https://github.com/taeckyung/AETTA.
1 Introduction
The rise of deep learning has impacted various fields with remarkable achievements [17, 32, 13, 33, 4]. In real-world deep learning applications, the divergence between training and test data, known as domain shifts, often leads to poor accuracy. For instance, object detection models encountering previously unseen data (e.g., variations of objects) or distributional shifts (e.g., weather changes) might suffer from performance degradation. To overcome this challenge, Test-Time Adaptation (TTA) [11, 29, 2, 35, 36, 34, 12, 28] has been regarded as a promising solution recently and actively studied. TTA aims to adapt pre-trained models to domain shifts on the fly with only unlabeled test data.
Despite recent advances in TTA, significant challenges hinder its practical applications. The core issue is that TTA’s reliance on unlabeled test-domain samples makes TTA susceptible to adaptation failures, especially in dynamic environments where the domain continuously changes [29, 30]. Although recent TTA studies deal with dynamic test streams in TTA [11, 29, 35, 36, 12], the inherent risk of TTA–blind adaptation to unseen test samples without ground-truth labels–remains a critical vulnerability. Notably, the absence of ground-truth labels makes it difficult to monitor the correctness of the adaptation. While various out-of-distribution performance estimation approaches have been proposed [1, 27, 5, 15], such methods necessitate labeled train data for accuracy estimation, which is impractical for TTA scenarios.
In light of these challenges, we propose AETTA (Accuracy Estimation for Test-Time Adaptation), a novel accuracy estimation method designed for TTA without reliance on labeled data or source data access (Figure 1). AETTA leverages prediction disagreement with dropout inferences, where the prediction disagreement between the adapted model and dropout inferences serves as a basis for performance estimation. To enhance AETTA’s robustness to adaptation failure scenarios, we propose robust disagreement equality that dynamically adjust the accuracy estimates based on model failures. The key idea is to extend the well-calibration assumption (i.e., predicted probabilities of expected model predictions are neither over-/under-confident [21]) to cover over-confident models (e.g., adaptation failures) via adaptive scaling of the predicted probability. In addition, we provide theoretical analysis on how AETTA can estimate accuracy with unlabeled test data.
We evaluate AETTA on three TTA benchmarks (CIFAR10-C, CIFAR100-C, and ImageNet-C [18]) with two scenarios of fully TTA (i.e., adapting to each corruption) [34] and continual TTA (i.e., continuously adapting to 15 corruptions) [35]. We evaluate the accuracy estimation of AETTA integrated with six state-of-the-art TTA algorithms [34, 28, 29, 35, 36, 12]. We compare AETTA with four baselines that could be applied in the TTA setting. The result illustrates that AETTA shows an average of 19.8%p more accurate estimation compared with the baselines in various TTA methods and evaluation scenarios.
Furthermore, we explore the impact of performance estimation in TTA through a case study where we avoided undesirable accuracy drops in TTA based on AETTA. We propose a simple model recovery algorithm, which resets the model when consecutive estimated accuracy degradation or sudden accuracy drop are observed. Our case study shows that our model recovery algorithm with accuracy estimation achieved 11.7%p performance improvement, outperforming the best baseline that knows when distribution changes by 3.0%p. The result shows an example where accuracy estimation could benefit TTA in practice.
2 Preliminaries
2.1 Test-Time Adaptation (TTA)
Consider the source data distribution , and the target data distribution and its random variable , where is typically unknown to the learning algorithm, and is total number of classes. The covariate shift assumption [31] asserts a disparity between the source and target data distributions, defined by while maintaining consistency in the conditional label distribution: .
Let denote a hypothesis that predicts a single class for a single input and denote a corresponding softmax value before class prediction. We define the hypothesis space as a hypothesis space induced by a stochastic training algorithm [21]. The stochasticity could arise from a different random initialization or data ordering.
Assuming an off-the-shelf model pre-trained on , the goal of (fully) test-time adaptation (TTA) [34] is to adapt for the target distribution to produce , using a batch of the unlabeled test set in an online manner.
2.2 Accuracy Estimation in TTA
We adopt a common TTA setup where source data is unavailable and target test data lacks labels [34, 28, 29, 35, 36, 12]. The objective of TTA accuracy estimation is to predict the test accuracy (or error) with unlabeled test streams.
Given an adapted model at time , we denote the test error of model by:
| (1) |
Note that we use the terms test accuracy and test error depending on the context, and the sum of them is 1. Given the temporal nature of TTA, we consider estimating the accuracy of the model –which has been updated before time –with the test batch . Following the estimation, the test batch is used for adaptation.
3 Methodology
3.1 Disagreement Equality
We introduce an approach for estimating the test error of a model that is adapted at test time. The key idea is to compare the model’s output against outputs generated through dropout inference. Remarkably, this estimation process does not rely on access to the original training or labeled test data, which contrasts with existing accuracy estimation methods [1, 21, 27, 5, 15]. For example, generalization disagreement equality (GDE) [21] proposes a theoretical ground for estimating model error by measuring the disagreement rate between two networks. However, GDE requires multiple pre-trained models from different training procedures to calculate the disagreement rate.
Instead of multiple pre-trained models, our strategy utilizes dropout inference sampling, a technique where random parts of a model’s intermediate layer outputs are omitted during the inference process [9]. From a single adapted model, we simulate the behavior of independent and identically distributed (i.i.d.) models by dropout inference sampling.
Definition 3.1.
The hypothesis space satisfies the dropout independence if for any , and its dropout inference samples are i.i.d. over .
To estimate the accuracy of the model, we propose prediction disagreement with dropout inferences (PDD) that calculates a disagreement between the adapted model and the dropout inferences with respect to test samples as:
| (2) |
where is the number of dropout inferences.
We now provide the theoretical background to estimate test error with PDD. We first define the expectation function [21] over hypothesis space , which produces probability vector of size . For -th element , we define:
| (3) |
which indicates the probability of a sample sampled from being classed as the class . Note that the expectation function does not represent the model’s accuracy; it indicates the probability of the input being classified as a particular class, regardless of the ground truth labels.
Then, we define a confidence-prediction calibration assumption, indicating that the value of for a particular class equals the probability of the sample having the same ground-truth label [21].
Definition 3.2.
The hypothesis space and corresponding expectation function satisfies confidence-prediction calibration111We rename the term from class-wise calibration [21] to clearly state the purpose of the calibration. on if for any confidence value and class :
| (4) |
With PDD and the assumption of dropout independence and confidence-prediction calibration, we are able to estimate the model’s prediction error (Theorem 3.1). Detailed proof is provided in the Appendix A.1.
Theorem 3.1 (Disagreement Equality).
If the hypothesis space and corresponding expectation function satisfies dropout independence and confidence-prediction calibration, prediction disagreement with dropouts (PDD) approximates the test error over :
| (5) |
3.2 Robust Disagreement Equality
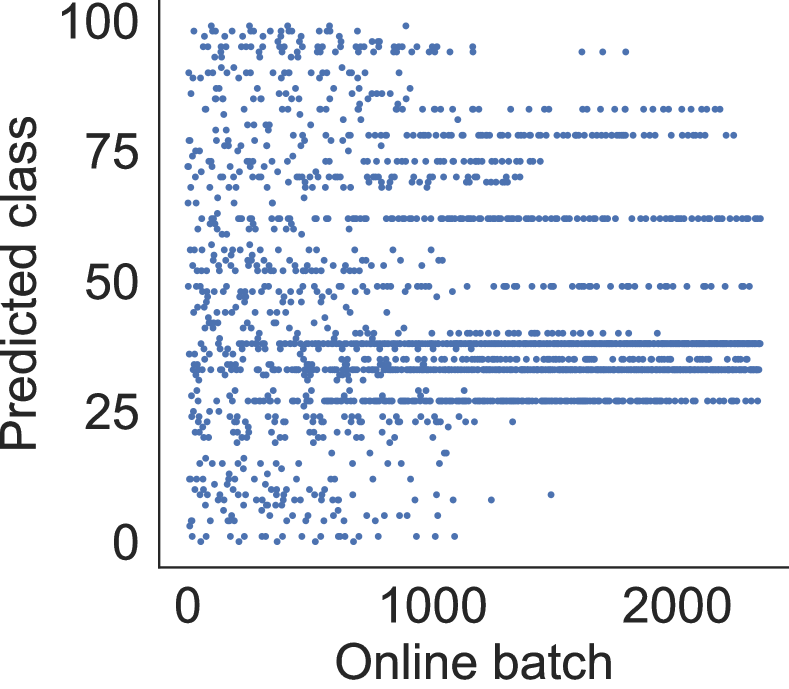
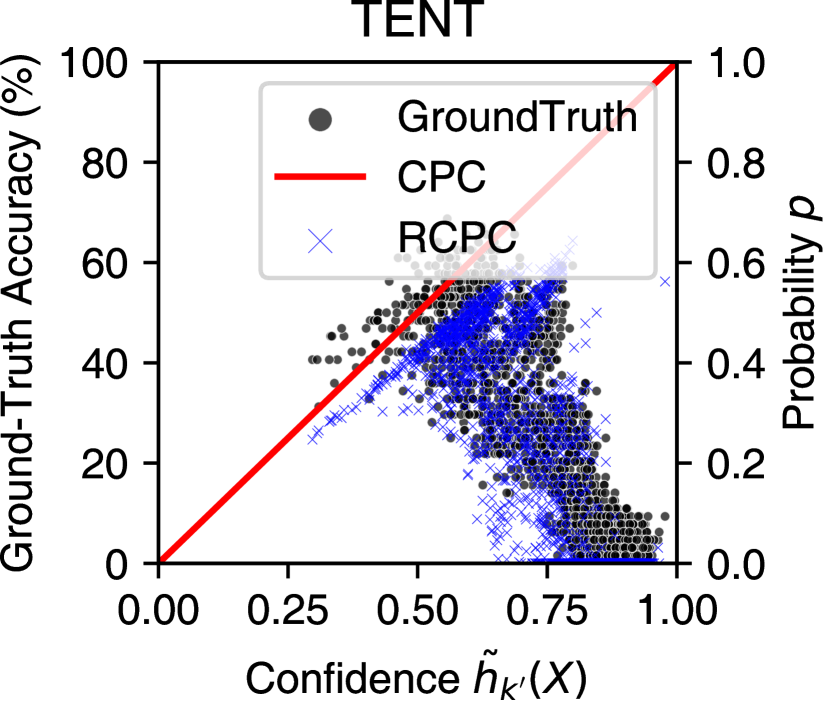
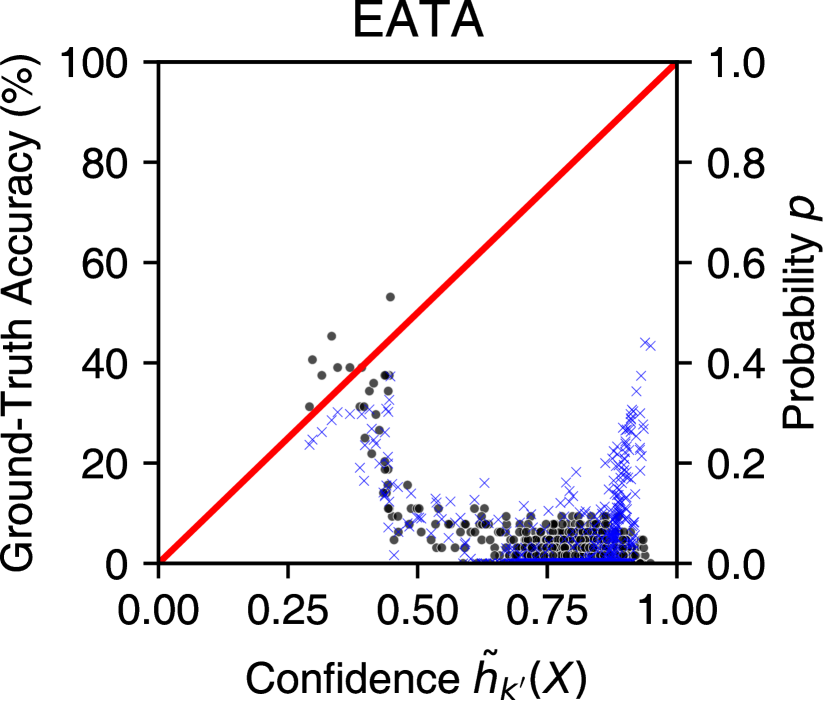
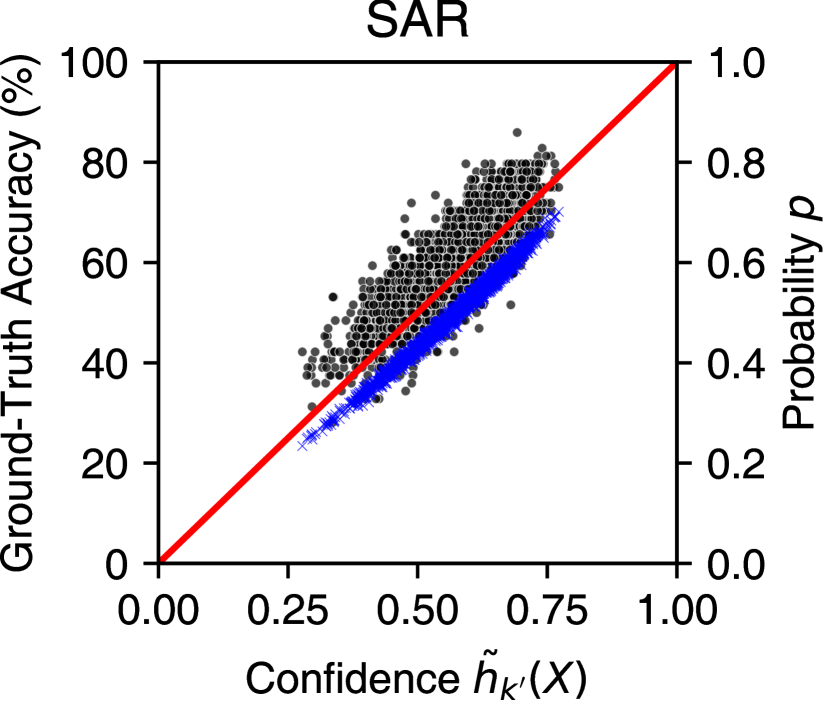
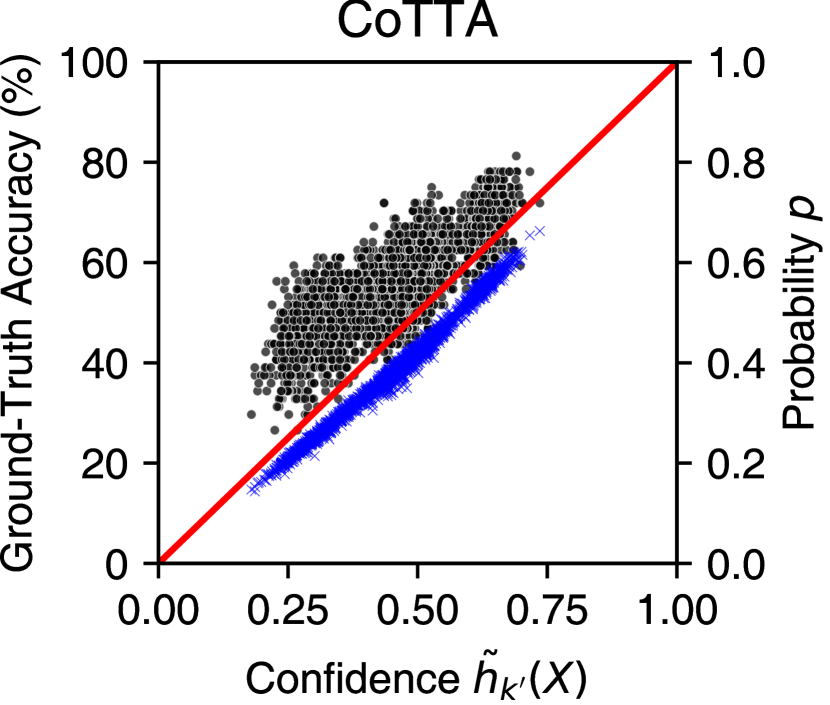
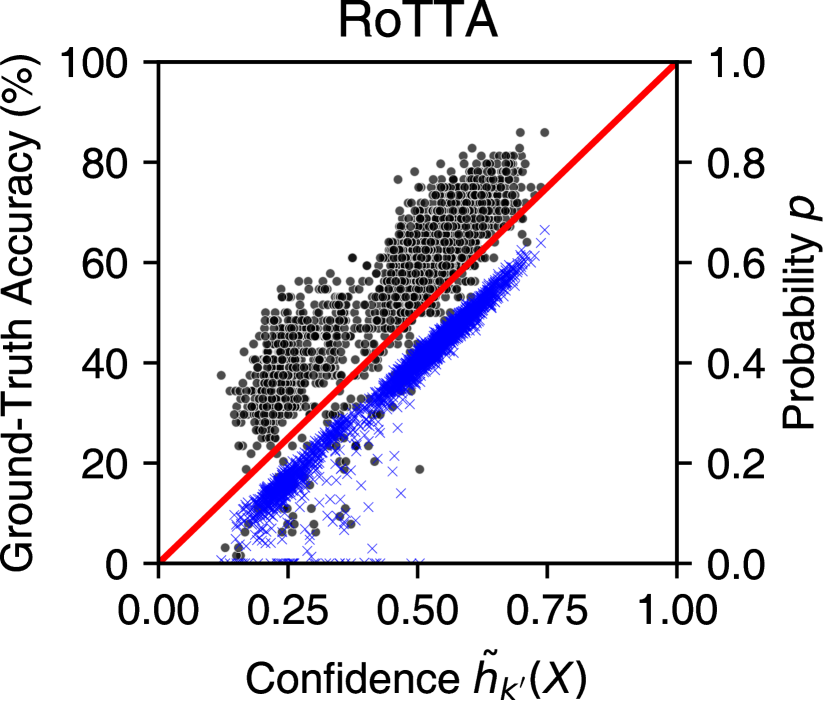
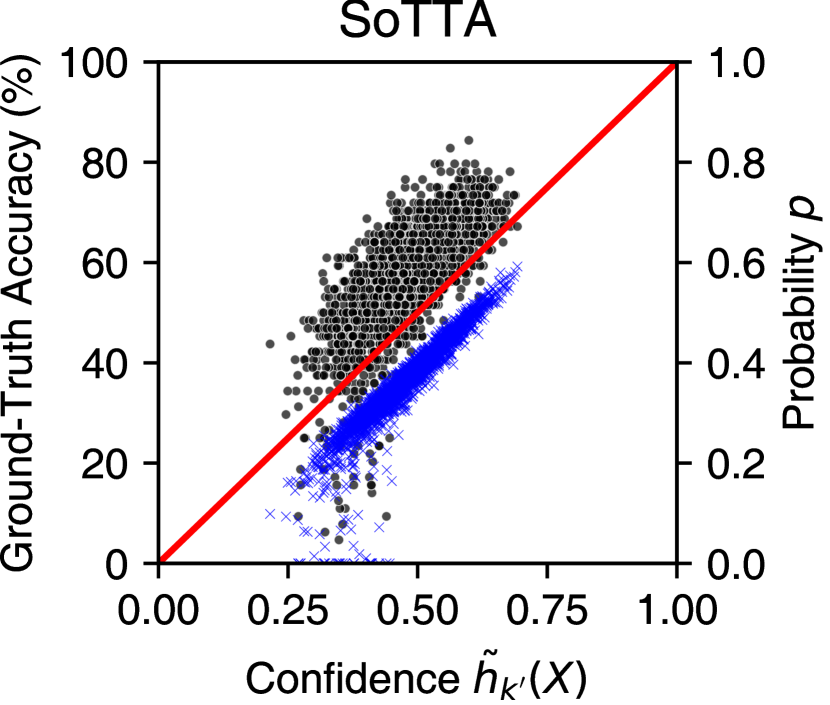
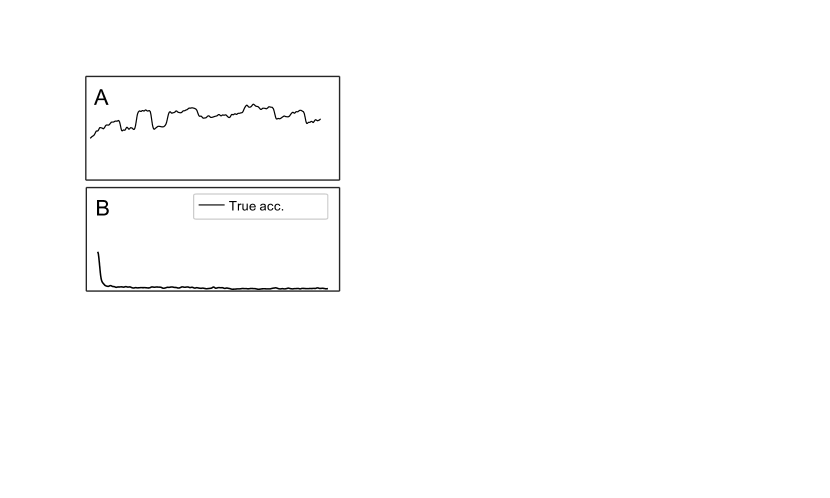
Adaptation failures in TTA are often coupled with over-confident incorrect predictions. Figure 2 shows an illustrative example of this case; as the expectation function’s accuracy drops, the confidence increases, and predictions are skewed towards a few classes222Using the probabilistic property of expectation of dropout inferences [9], we approximate as .. This violates the confidence-prediction calibration, leading to a high misalignment between test error and PDD (red lines in Figure 3).
To tackle the issue, we propose a robust confidence-prediction calibration to provide the theoretical ground of accuracy estimation for both well-calibrated or over-confident expectation function .
Definition 3.3.
The hypothesis space and corresponding expectation function satisfies robust confidence-prediction calibration on if for any confidence value , any class , and the over-confident class , there exists a weighting constant and corresponding that satisfies:
| (6) |
and
| (7) |
Robust confidence-prediction calibration adjusts the over-confident expectation function to have a lower probability on the misclassified class via multiplying . Note that we can easily expand Definition 3.3 for multiple over-confident classes. Then, we estimate the test error with Theorem 3.2 (detailed proof in the Appendix A.2).
Theorem 3.2 (Robust Disagreement Equality).
If the hypothesis space and corresponding expectation function satisfies dropout independence and robust confidence-prediction calibration with a weighting constant , prediction disagreement with dropouts (PDD) approximates the test error over :
| (8) |
where
| (9) |
3.3 Accuracy Estimation for TTA
With Theorem 3.2, we propose an empirical approach to estimate the single model test error. Our experiments show that a single model’s disagreement (and the test error) lies close to the robust disagreement equality. This aligns with the previous finding that a single pair of differently-trained models’ disagreement rate (and the test error) lies close to the disagreement equality [21]. Therefore, we approximate a single model test error as:
| (10) |
where we omit due to the insufficient information regarding the true value of . Note that for models with calibration.
Now, we discuss selecting a proper weighting constant . Note that a desirable should dynamically suppress the over-confident expectation function depending on the context so that the confidence-prediction calibration assumption holds. To this end, we use the skewness of the predicted outputs as an indicator of model over-confidence. Out intuition is based on the observation that the predicted class distribution is highly skewed when the adaptation fails (Figure 2(b)), which aligns with the findings from prior studies [24, 19]. Specifically, we estimate the skewness of predictions by calculating the entropy () of the batch-aggregated softmax values from the dropout inferences over a test batch :
| (11) |
where would maximize as with uniform predictions among the batch (e.g., no failures); while the minimum value would be when entire batch predicts a single class (e.g., adaptation failures).
We then model with as:
| (12) |
where is a hyperparameter. If the adaptation does not fail, predictions are uniformly distributed as and . Note that drives Theorem 3.2 to be equivalent to Theorem 3.1. We found that modeling with the average batch-wise entropy effectively corrects the correlation between confidence and prediction probability, as illustrated in Figure 3 (blue dots).
Observe that and result in and , respectively. Setting a small would result in a lesser penalty with adaptation failures. On the other hand, choosing a high would undesirably penalize model improvement cases. Our experiment found that accuracy estimation is not too sensitive to (Figure 5(b)), and we chose for the other experiments.
We summarize the accuracy estimation procedure in Algorithm 1. We first infer with the adapted model for the current test batch . Then, we repeatedly perform dropout inference sampling. With samples from dropout inferences, we estimate the entropy of the batch-aggregated softmax output . Finally, we calculated the expected error of the model by AETTA. We apply the exponential moving average to the final accuracy estimation for stable error estimation.
4 Experiments
| TTA Method | ||||||||
| Dataset | Method | TENT [34] | EATA [28] | SAR [29] | CoTTA [35] | RoTTA [36] | SoTTA [12] | Avg. () |
| SrcValid | 18.37 ± 0.29 | 14.37 ± 0.33 | 21.28 ± 0.27 | 18.43 ± 0.16 | 20.35 ± 1.31 | 13.13 ± 0.85 | 17.66 ± 0.24 | |
| SoftmaxScore [7] | 6.26 ± 0.49 | 4.78 ± 0.12 | 5.21 ± 0.22 | 10.96 ± 0.28 | 6.01 ± 0.23 | 4.97 ± 0.50 | 6.37 ± 0.10 | |
| GDE [21] | 18.69 ± 0.28 | 16.95 ± 0.22 | 21.25 ± 0.27 | 14.50 ± 0.03 | 23.27 ± 0.43 | 16.45 ± 0.21 | 18.52 ± 0.13 | |
| AdvPerturb [23] | 23.06 ± 1.17 | 24.97 ± 1.00 | 21.89 ± 0.95 | 18.00 ± 0.82 | 19.35 ± 0.99 | 23.68 ± 0.85 | 21.83 ± 0.92 | |
| Fully CIFAR10-C | AETTA | 4.00 ± 0.03 | 3.87 ± 0.14 | 3.89 ± 0.07 | 6.83 ± 0.47 | 6.44 ± 1.35 | 5.28 ± 0.87 | 5.05 ± 0.46 |
| SrcValid | 38.96 ± 0.22 | 10.71 ± 0.31 | 42.68 ± 0.21 | 44.58 ± 0.30 | 23.50 ± 0.51 | 19.34 ± 0.63 | 29.96 ± 0.09 | |
| SoftmaxScore [7] | 17.34 ± 0.10 | 27.86 ± 1.11 | 24.56 ± 0.25 | 34.50 ± 0.35 | 24.18 ± 0.19 | 23.98 ± 0.21 | 25.40 ± 0.23 | |
| GDE [21] | 40.11 ± 0.05 | 71.53 ± 2.12 | 42.51 ± 0.23 | 33.21 ± 0.24 | 48.02 ± 0.56 | 34.24 ± 0.12 | 44.94 ± 0.23 | |
| AdvPerturb [23] | 24.17 ± 0.41 | 8.22 ± 0.56 | 22.91 ± 0.60 | 20.53 ± 0.14 | 17.84 ± 0.65 | 25.77 ± 0.47 | 19.91 ± 0.26 | |
| Fully CIFAR100-C | AETTA | 6.89 ± 0.15 | 20.15 ± 1.70 | 6.54 ± 0.15 | 6.05 ± 0.12 | 6.88 ± 0.10 | 5.29 ± 0.18 | 8.63 ± 0.24 |
| SrcValid | 39.13 ± 0.89 | 35.89 ± 0.79 | 29.77 ± 0.94 | 41.09 ± 0.53 | 10.28 ± 0.28 | 16.00 ± 0.33 | 28.69 ± 0.54 | |
| SoftmaxScore [7] | 20.67 ± 0.01 | 21.06 ± 0.03 | 24.42 ± 0.08 | 19.62 ± 0.02 | 21.03 ± 0.04 | 23.60 ± 0.07 | 21.73 ± 0.03 | |
| GDE [21] | 70.58 ± 0.01 | 66.17 ± 0.07 | 63.48 ± 0.03 | 72.76 ± 0.02 | 66.39 ± 0.04 | 52.74 ± 0.02 | 65.35 ± 0.02 | |
| AdvPerturb [23] | 12.56 ± 0.03 | 14.52 ± 0.01 | 18.76 ± 0.06 | 11.05 ± 0.02 | 12.93 ± 0.04 | 22.90 ± 0.02 | 15.45 ± 0.02 | |
| Fully ImageNet-C | AETTA | 6.14 ± 0.03 | 6.48 ± 0.02 | 6.43 ± 0.09 | 6.02 ± 0.03 | 14.82 ± 0.01 | 17.40 ± 0.26 | 9.55 ± 0.07 |
| TTA Method | ||||||||
| Dataset | Method | TENT [34] | EATA [28] | SAR [29] | CoTTA [35] | RoTTA [36] | SoTTA [12] | Avg. () |
| SrcValid | 10.84 ± 1.83 | 11.06 ± 0.11 | 21.29 ± 0.26 | 18.30 ± 0.25 | 13.37 ± 0.89 | 9.40 ± 0.85 | 14.04 ± 0.58 | |
| SoftmaxScore [7] | 41.10 ± 11.66 | 15.40 ± 4.73 | 5.21 ± 0.22 | 12.96 ± 0.37 | 12.57 ± 0.43 | 4.37 ± 0.09 | 15.27 ± 2.51 | |
| GDE [21] | 46.29 ± 10.93 | 26.44 ± 5.16 | 21.25 ± 0.27 | 14.69 ± 0.15 | 17.50 ± 0.30 | 17.03 ± 0.70 | 23.87 ± 2.43 | |
| AdvPerturb [23] | 15.56 ± 1.53 | 20.93 ± 2.83 | 21.88 ± 0.93 | 17.79 ± 0.74 | 22.95 ± 0.82 | 23.63 ± 0.78 | 20.45 ± 1.17 | |
| Continual CIFAR10-C | AETTA | 9.05 ± 1.02 | 7.13 ± 3.33 | 3.89 ± 0.06 | 5.82 ± 0.30 | 5.36 ± 1.22 | 4.73 ± 0.34 | 6.00 ± 0.35 |
| SrcValid | 11.00 ± 0.58 | 1.68 ± 0.18 | 38.20 ± 0.22 | 46.09 ± 0.38 | 19.43 ± 1.17 | 17.16 ± 1.57 | 22.32 ± 0.52 | |
| SoftmaxScore [7] | 58.29 ± 1.82 | 76.58 ± 0.71 | 24.05 ± 0.29 | 36.27 ± 0.68 | 27.19 ± 0.12 | 21.89 ± 0.35 | 40.71 ± 0.43 | |
| GDE [21] | 80.87 ± 1.29 | 94.01 ± 0.43 | 39.21 ± 0.22 | 35.43 ± 0.30 | 41.68 ± 0.45 | 35.29 ± 0.27 | 54.41 ± 0.18 | |
| AdvPerturb [23] | 10.12 ± 0.24 | 1.97 ± 0.33 | 24.93 ± 0.57 | 19.62 ± 0.15 | 21.18 ± 0.71 | 25.12 ± 0.39 | 17.16 ± 0.32 | |
| Continual CIFAR100-C | AETTA | 5.85 ± 0.36 | 4.18 ± 0.82 | 6.67 ± 0.12 | 6.55 ± 0.17 | 5.86 ± 0.10 | 5.32 ± 0.18 | 5.74 ± 0.13 |
| SrcValid | 33.30 ± 0.93 | 36.42 ± 0.76 | 22.30 ± 0.55 | 41.06 ± 0.54 | 9.56 ± 0.26 | 14.28 ± 0.28 | 26.15 ± 0.53 | |
| SoftmaxScore [7] | 19.34 ± 0.02 | 20.16 ± 0.05 | 21.91 ± 0.16 | 19.63 ± 0.01 | 17.56 ± 0.08 | 19.67 ± 0.50 | 19.71 ± 0.53 | |
| GDE [21] | 68.30 ± 0.01 | 66.58 ± 0.03 | 64.36 ± 0.15 | 72.81 ± 0.07 | 73.76 ± 0.22 | 55.76 ± 0.45 | 66.93 ± 0.14 | |
| AdvPerturb [23] | 14.82 ± 0.02 | 14.15 ± 0.06 | 19.17 ± 0.14 | 11.06 ± 0.02 | 11.05 ± 0.05 | 20.83 ± 0.39 | 15.18 ± 0.09 | |
| Continual ImageNet-C | AETTA | 5.66 ± 0.05 | 6.73 ± 0.03 | 6.68 ± 0.04 | 5.98 ± 0.04 | 11.19 ± 0.12 | 19.22 ± 0.79 | 9.24 ± 0.14 |
We describe our experimental setup and present the results. Please refer to the Appendix D for further details.
Scenario. We consider both fully (non-continual) and continual test-time adaptation scenarios. In the fully TTA setting, target domains are each corruption type [34], while in the continual setting, the target domain continually changes to 15 different corruptions [35]. During adaptation, we calculate the accuracy estimation for every batch and report the mean absolute error between the ground-truth batch-wise accuracy. We ran experiments with three random seeds (0, 1, 2) and reported the average values. We use the test batch size 64 for all TTA baselines, with a memory size 64 for RoTTA [36] and SoTTA [12]. We specify further details of the hyperparameters in the Appendix D.2.
Datasets. We use three standard benchmarks for test-time adaptation: CIFAR10-C, CIFAR100-C, and ImageNet-C [18]. Each dataset contains 15 different corruptions with five levels of corruption, where we use corruption level 5. CIFAR10-C/CIFAR100-C/ImageNet-C contains 10/100/1,000 classes with 10,000/10,000/50,000 test data, respectively. We use pre-trained ResNet18 [17] as an adaptation target, following a recent study [12].
TTA Methods. We consider six state-of-the-art TTA methods. TENT [34] updates BN parameters with entropy minimization. EATA [28] utilizes entropy thresholding-based sample filtering and anti-forgetting regularization. SAR [29] also adapts sample filtering with sharpness minimization [8]. CoTTA [35] addresses the continual setting by augmentations and stochastic restoration of model weights to avoid catastrophic forgetting. RoTTA [36] adapts with robust batch normalization and category-balanced sampling with timeliness and uncertainty. SoTTA [12] utilizes high-confidence uniform-sampling and entropy-sharpness minimization for robust adaptation in noisy data streams [8].
Accuracy Estimation Baselines. We evaluate four distinct accuracy estimation baselines that could be applied to TTA settings: SrcValid, SoftmaxScore, GDE, and AdvPerturb.
-
•
SrcValid is a widely used technique that validates performance by leveraging labeled source data. It computes the accuracy using a hold-out labeled source dataset to estimate the target performance. Importantly, the hold-out source data for validation were not used for training in other baselines to ensure they do not affect the model performance. Note that TTA usually assumes that source data are unavailable during test time; hence, this baseline is unrealistic in TTA. We nonetheless include SrcValid as one of our baselines to understand its performance when the source data are accessible.
-
•
SoftmaxScore [7] utilizes the confidence scores derived from the last softmax layer as the model’s accuracy, which is also a widely used baseline [5, 6]. It estimates the target domain accuracy by averaging softmax confidence scores computed from the current test batch. In addition, we apply temperature scaling [16] to improve the estimation performance [10].
-
•
Generalization disagreement equality (GDE) [21] aims to estimate test accuracy by quantifying the (dis)agreement rate between predictions on a test batch generated by a pair of models. Since training multiple models is impractical, we compare the current adapted model and the previous model right before the adaptation. We also report a comparison with the original GDE and multiple pre-trained models in Appendix B.
-
•
Adversarial perturbation (AdvPerturb) [23] also aims to estimate the OOD accuracy by calculating the agreement between the domain-adapted model and the source model, where adversarial perturbations on a test batch are applied to penalize the unconfident samples near the decision boundary. We note that the original paper aims to predict the accuracy of the source model, while our goal is to predict the accuracy of the adapted model.
Results. Table 1 and Table 2 show the results on the fully and continual TTA settings. We observe that none of the baselines could reliably predict the accuracy among different scenarios. On the other hand, AETTA achieves the lowest mean absolute error, including adaptation failure cases (e.g., TENT in continual CIFAR10/100-C). On average, AETTA outperforms baselines by 19.8%p, validating the effectiveness of our robust prediction disagreement in diverse scenarios. More details are in the Appendix F.
Qualitative Analysis.
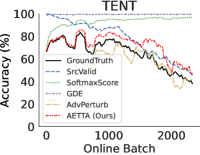
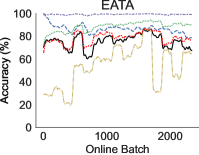
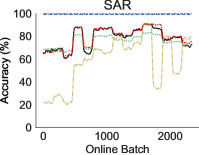
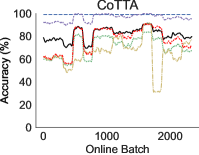
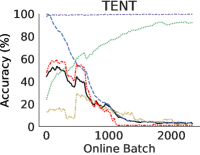
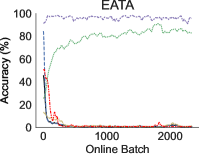
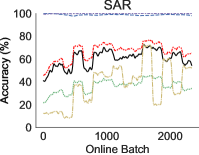
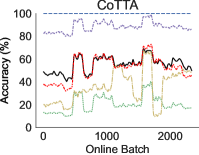
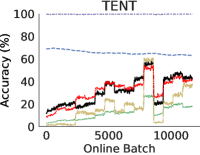
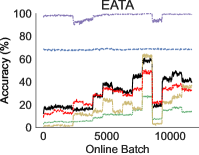
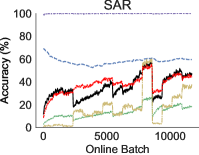
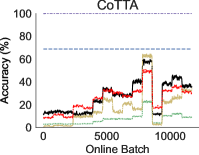
We qualitatively analyze the results of the baselines and AETTA to understand the behavior. Figure 4 visualizes the ground-truth accuracy and the estimated accuracy from the baselines and AETTA under adaptation failure and non-failure cases. The Gaussian filter is applied for visualization.
We observe that AETTA generally shows a reliable estimation of the ground-truth accuracy in diverse scenarios (fully and continual) and datasets (CIFAR10/100-C and ImageNet-C).
SrcValid correctly estimated when model accuracy decreases;
however, it consistently predicted high accuracy when the adaptation did not fail. This limitation might be due to the distributional gap between source and target data.
SoftmaxScore [7] captures the trend of ground-truth accuracy in some cases,
but it overestimates the accuracy
when the model accuracy drops. This is mostly due to the over-confident predictions from the model.
GDE [21] showed to constantly predict high values among different TTA methods.
Note that GDE was originally designed to utilize various pre-trained models. To use GDE in TTA, we utilize adapted models sampled at different stages of adaptation. The result suggests that utilizing multiple models from the single stochastic learning process might not be sufficient to consist of independent and identically distributed (i.i.d.) ensembles, leading to inaccurate estimation.
AdvPerturb [23] shows accuracy estimations when ground-truth accuracy decreases but shows high errors in other cases. We believe this happens because it
aims to evaluate the performance of the source model, not the adapted model. We found similar patterns were observed with different TTA methods.
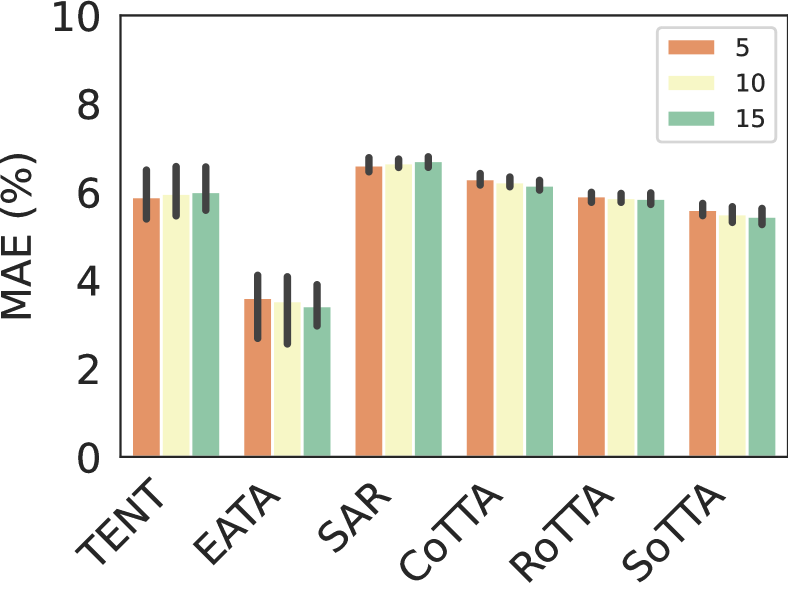
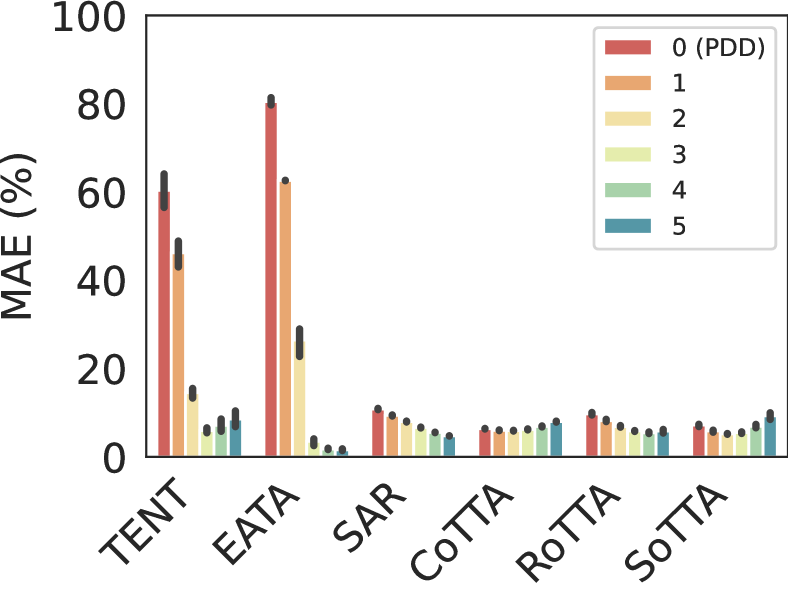
Impact of Hyperparameter . The number of dropout inferences, , is a hyperparameter for calculating the test error. We conducted an ablation study in continual CIFAR100-C with varying . As shown in Figure 5(a), we found the effect of hyperparameter is negligible. We interpret this result as the effect of calculating prediction disagreement over sufficient batch size with dropout independence, which could reduce the probabilistic variances from dropout inference sampling. We adopt a single value of for the other experiments.
Impact of Hyperparameter . We investigate the impact of , a hyperparameter to control the strength of robust confidence-prediction calibration. We conduct an ablation study in continual CIFAR100-C with varying , where indicates no weighting, thus . Figure 5(b) shows the result. Note that estimations are often inaccurate when , which shows the importance of our robust equality. Setting a reasonable is important to predict failed adaptation cases (TENT and EATA) properly, but it is generally robust after certain values. We adopt for the other experiments.
5 Case Study: Model Recovery
| TTA Method | |||||||
| Method | TENT [34] | EATA [28] | SAR [29] | CoTTA [35] | RoTTA [36] | SoTTA [12] | Avg. () |
| Episodic [37] | 33.58 ± 1.04 | 51.28 ± 0.52 | -7.00 ± 0.26 | 1.65 ± 0.10 | -22.57 ± 0.85 | -26.40 ± 0.51 | 5.09 ± 0.24 |
| MRS [29] | 24.12 ± 2.11 | 0.00 ± 0.00 | 0.00 ± 0.00 | 0.00 ± 0.00 | -1.97 ± 2.23 | 0.00 ± 0.00 | 3.69 ± 0.22 |
| Stochastic [35] | 35.93 ± 0.78 | -0.01 ± 0.47 | -2.00 ± 0.48 | 0.00 ± 0.00 | -2.55 ± 0.49 | 0.35 ± 0.51 | 5.29 ± 0.19 |
| FisherStochastic [3] | 40.27 ± 1.29 | 0.12 ± 1.16 | -4.85 ± 0.13 | 0.13 ± 0.03 | -2.89 ± 0.13 | -1.36 ± 0.51 | 5.24 ± 0.29 |
| DistShift | 38.93 ± 1.15 | 22.17 ± 2.38 | -3.25 ± 0.10 | 1.51 ± 0.09 | -7.63 ± 0.23 | 0.68 ± 0.19 | 8.74 ± 0.55 |
| AETTA | 36.79 ± 1.20 | 48.64 ± 0.74 | -5.66 ± 0.20 | 1.64 ± 0.11 | -6.03 ± 0.89 | -4.97 ± 1.58 | 11.73 ± 0.34 |
The deployment of TTA algorithms encounters a significant challenge when exposed to extreme test streams, such as continuously changing corruptions [35]. Several TTA algorithms (e.g., TENT [34]) were not designed to exhibit robustness under such extreme conditions. Consequently, the model weights are poorly updated, leading to performance degradation, even worse than the source model. Although recent studies attempt to manage dynamic test streams [11, 35, 12], TTA algorithms are still susceptible to adaptation failures [30]. To tackle the issue, we perform a case study of model recovery based on the accuracy estimation.
Recovery Algorithm. We introduce a simple reset algorithm based on our accuracy estimation with AETTA.
Our reset algorithm detects two cases: (1) consecutive low accuracies and (2) sudden accuracy drop. First, we reset the model if the five recent consecutive estimated accuracies (e.g., ) are lower than the five previous consecutive estimations (e.g., ).
This way, we can detect the gradual degradation of TTA accuracy. Second, we apply hard lower-bound thresholding, which resets the model if the estimated accuracy is below the threshold (e.g., 0.2). This could prevent catastrophic failure of TTA algorithms.
Baselines. Some TTA studies covered the model recovery/reset as a part of the TTA algorithm: Episodic resetting (Episodic) [37], where the model resets after every batch; Model Recovery Scheme (MRS) [29], where the model resets when the moving average of entropy loss falls below a certain threshold; Stochastic restoration (Stochastic) [35], where a small number of model weights are stochastically restored to the initial weight of the source model; and Fisher information based restoration (FisherStochastic) [3], which applies stochastic restoration for layer importance measured by Fisher information matrix. We also include a baseline (DistShift), which assumes that the model knows when the distribution changes and thus acts as an oracle. DistShift resets the model when the test data distribution (corruption) changes, which is not feasible in practice.
Results. Our simple recovery algorithm outperforms the baselines, including DistShift, which relies on an impractical assumption of knowing when the corruption changes. Episodic [37] showed high accuracy improvements under adaptation failures; however, it prevents
continuous adaptation, even without adaptation failures. MRS [29] fails to recover among various TTA methods due to the hard-coded threshold of loss value. Stochastic [35] and FisherStochastic [3] show marginal improvements while failing to recover EATA. Our proposed reset algorithm successfully recovers from adaptation failures while minimizing the negative effect on TTA without failures.
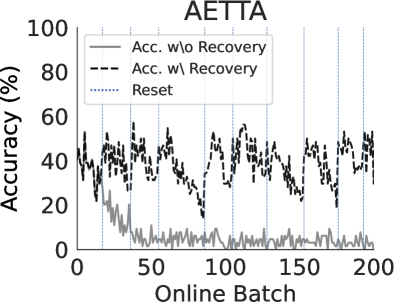
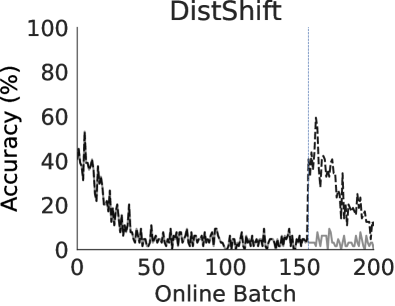
Qualitative Analysis. Figure 6 shows an example of our model recovery compared with DistShift. Notably, our recovery algorithm resets only when an accuracy degradation trend is detected. On the other hand, DistShift failed to recover in the early steps since it resets the model only on distribution shifts. This implies that estimating performance degradation is more beneficial than knowing when the domain changes to improve TTA performance.
6 Related Work
Test-Time Adaptation.
Recent progress in the field of test-time adaptation (TTA) has focused on improving model robustness [29, 11, 36, 35, 2, 28, 12] and addressing novel forms of domain shifts [11, 35, 12].
On the other hand, an analysis [30] pointed out the conventional TTA approaches remain prone to adaptation failures and demonstrated the importance of model recovery. In alignment with this insight, our work not only showcases the feasibility of accuracy estimation for TTA but also investigates a promising model recovery solution to enhance the robustness of TTA.
Accuracy Estimation. Existing accuracy estimation approaches mainly focus on the ensemble of multiple pre-trained models [27, 1, 21, 15, 5]. Accuracy-on-the-line [27] and Agreement-on-the-line [1] have demonstrated a notable linear relationship between performances in a wide range of models and distribution shifts, relying on the consistency of model predictions between in-distribution (ID) and out-of-distribution (OOD) data. The Difference of Confidence (DoC) [15] leverages differences in the model’s confidence between ID and OOD data to estimate the accuracy gap under distribution shifts for calculating the final OOD accuracy. Self-training ensemble [5] estimates the accuracy of the pre-trained classifier by iteratively learning an ensemble of models with a training dataset, unlabeled test dataset, and wrongly classified samples. All these methods require labeled ID data to estimate OOD accuracy. To our knowledge, no existing studies target the accuracy estimation in TTA where source data and labels are unavailable.
7 Conclusion
We proposed a label-free TTA performance estimation method without access to source data and target labels. Based on the dropout inference sampling, we proposed calculating the prediction disagreement to estimate the TTA accuracy. We further improved the method with robust disagreement equality by utilizing the batch-aggregated distribution to penalize skewed predictions. Our method outperformed the baselines in diverse scenarios and datasets. Finally, our case study of model recovery showed the practicality of accuracy estimation. Our findings suggest that accuracy estimation is not only feasible but also a valuable tool in advancing the field of TTA without the need for labeled data.
Acknowledgements
This work was supported by the Institute of Information & communications Technology Planning & Evaluation (IITP) grant funded by the Korea government (MSIT) (No.2022-0-00495, On-Device Voice Phishing Call Detection).
References
- Baek et al. [2022] Christina Baek, Yiding Jiang, Aditi Raghunathan, and J. Zico Kolter. Agreement-on-the-line: Predicting the performance of neural networks under distribution shift. In Advances in Neural Information Processing Systems, pages 19274–19289. Curran Associates, Inc., 2022.
- Boudiaf et al. [2022] Malik Boudiaf, Romain Mueller, Ismail Ben Ayed, and Luca Bertinetto. Parameter-free online test-time adaptation. In Proceedings of the IEEE/CVF Conference on Computer Vision and Pattern Recognition (CVPR), pages 8344–8353, 2022.
- Brahma and Rai [2023] Dhanajit Brahma and Piyush Rai. A probabilistic framework for lifelong test-time adaptation. In Proceedings of the IEEE/CVF Conference on Computer Vision and Pattern Recognition (CVPR), pages 3582–3591, 2023.
- Brown et al. [2020] Tom Brown, Benjamin Mann, Nick Ryder, Melanie Subbiah, Jared D Kaplan, Prafulla Dhariwal, Arvind Neelakantan, Pranav Shyam, Girish Sastry, Amanda Askell, Sandhini Agarwal, Ariel Herbert-Voss, Gretchen Krueger, Tom Henighan, Rewon Child, Aditya Ramesh, Daniel Ziegler, Jeffrey Wu, Clemens Winter, Chris Hesse, Mark Chen, Eric Sigler, Mateusz Litwin, Scott Gray, Benjamin Chess, Jack Clark, Christopher Berner, Sam McCandlish, Alec Radford, Ilya Sutskever, and Dario Amodei. Language models are few-shot learners. In Advances in Neural Information Processing Systems, pages 1877–1901. Curran Associates, Inc., 2020.
- Chen et al. [2021] Jiefeng Chen, Frederick Liu, Besim Avci, Xi Wu, Yingyu Liang, and Somesh Jha. Detecting errors and estimating accuracy on unlabeled data with self-training ensembles. In Advances in Neural Information Processing Systems, pages 14980–14992. Curran Associates, Inc., 2021.
- Chuang et al. [2020] Ching-Yao Chuang, Antonio Torralba, and Stefanie Jegelka. Estimating generalization under distribution shifts via domain-invariant representations. In Proceedings of the 37th International Conference on Machine Learning, pages 1984–1994. PMLR, 2020.
- Elsahar and Gallé [2019] Hady Elsahar and Matthias Gallé. To annotate or not? predicting performance drop under domain shift. In Proceedings of the 2019 Conference on Empirical Methods in Natural Language Processing and the 9th International Joint Conference on Natural Language Processing (EMNLP-IJCNLP), pages 2163–2173, 2019.
- Foret et al. [2021] Pierre Foret, Ariel Kleiner, Hossein Mobahi, and Behnam Neyshabur. Sharpness-aware minimization for efficiently improving generalization. In International Conference on Learning Representations, 2021.
- Gal and Ghahramani [2016] Yarin Gal and Zoubin Ghahramani. Dropout as a bayesian approximation: Representing model uncertainty in deep learning. In Proceedings of The 33rd International Conference on Machine Learning, pages 1050–1059, New York, New York, USA, 2016. PMLR.
- Garg et al. [2022] Saurabh Garg, Sivaraman Balakrishnan, Zachary Chase Lipton, Behnam Neyshabur, and Hanie Sedghi. Leveraging unlabeled data to predict out-of-distribution performance. In International Conference on Learning Representations, 2022.
- Gong et al. [2022] Taesik Gong, Jongheon Jeong, Taewon Kim, Yewon Kim, Jinwoo Shin, and Sung-Ju Lee. NOTE: Robust continual test-time adaptation against temporal correlation. In Advances in Neural Information Processing Systems, 2022.
- Gong et al. [2023] Taesik Gong, Yewon Kim, Taeckyung Lee, Sorn Chottananurak, and Sung-Ju Lee. SoTTA: Robust test-time adaptation on noisy data streams. In Thirty-seventh Conference on Neural Information Processing Systems, 2023.
- Goodfellow et al. [2020] Ian Goodfellow, Jean Pouget-Abadie, Mehdi Mirza, Bing Xu, David Warde-Farley, Sherjil Ozair, Aaron Courville, and Yoshua Bengio. Generative adversarial networks. Commun. ACM, 63(11):139–144, 2020.
- Goodfellow et al. [2014] Ian J Goodfellow, Jonathon Shlens, and Christian Szegedy. Explaining and harnessing adversarial examples. arXiv preprint arXiv:1412.6572, 2014.
- Guillory et al. [2021] Devin Guillory, Vaishaal Shankar, Sayna Ebrahimi, Trevor Darrell, and Ludwig Schmidt. Predicting with confidence on unseen distributions. In Proceedings of the IEEE/CVF International Conference on Computer Vision (ICCV), pages 1134–1144, 2021.
- Guo et al. [2017] Chuan Guo, Geoff Pleiss, Yu Sun, and Kilian Q. Weinberger. On calibration of modern neural networks. In Proceedings of the 34th International Conference on Machine Learning, pages 1321–1330. PMLR, 2017.
- He et al. [2016] Kaiming He, Xiangyu Zhang, Shaoqing Ren, and Jian Sun. Deep residual learning for image recognition. In Proceedings of the IEEE Conference on Computer Vision and Pattern Recognition (CVPR), 2016.
- Hendrycks and Dietterich [2019] Dan Hendrycks and Thomas Dietterich. Benchmarking neural network robustness to common corruptions and perturbations. In International Conference on Learning Representations, 2019.
- Hendrycks and Gimpel [2017] Dan Hendrycks and Kevin Gimpel. A baseline for detecting misclassified and out-of-distribution examples in neural networks. In International Conference on Learning Representations, 2017.
- Hong et al. [2023] Junyuan Hong, Lingjuan Lyu, Jiayu Zhou, and Michael Spranger. MECTA: Memory-economic continual test-time model adaptation. In The Eleventh International Conference on Learning Representations, 2023.
- Jiang et al. [2021] Yiding Jiang, Vaishnavh Nagarajan, Christina Baek, and J Zico Kolter. Assessing generalization of sgd via disagreement. In International Conference on Learning Representations, 2021.
- Kingma and Ba [2015] Diederick P Kingma and Jimmy Ba. Adam: A method for stochastic optimization. In International Conference on Learning Representations (ICLR), 2015.
- Lee et al. [2023] JoonHo Lee, Jae Oh Woo, Hankyu Moon, and Kwonho Lee. Unsupervised accuracy estimation of deep visual models using domain-adaptive adversarial perturbation without source samples. In Proceedings of the IEEE/CVF International Conference on Computer Vision (ICCV), pages 16443–16452, 2023.
- Liu et al. [2020] Weitang Liu, Xiaoyun Wang, John Owens, and Yixuan Li. Energy-based out-of-distribution detection. In Advances in Neural Information Processing Systems, pages 21464–21475. Curran Associates, Inc., 2020.
- Loshchilov and Hutter [2017] Ilya Loshchilov and Frank Hutter. SGDR: Stochastic gradient descent with warm restarts. In International Conference on Learning Representations (ICLR), 2017.
- maintainers and contributors [2016] TorchVision maintainers and contributors. Torchvision: Pytorch’s computer vision library. https://github.com/pytorch/vision, 2016.
- Miller et al. [2021] John P Miller, Rohan Taori, Aditi Raghunathan, Shiori Sagawa, Pang Wei Koh, Vaishaal Shankar, Percy Liang, Yair Carmon, and Ludwig Schmidt. Accuracy on the line: on the strong correlation between out-of-distribution and in-distribution generalization. In Proceedings of the 38th International Conference on Machine Learning, pages 7721–7735. PMLR, 2021.
- Niu et al. [2022] Shuaicheng Niu, Jiaxiang Wu, Yifan Zhang, Yaofo Chen, Shijian Zheng, Peilin Zhao, and Mingkui Tan. Efficient test-time model adaptation without forgetting. In Proceedings of the 39th International Conference on Machine Learning, pages 16888–16905. PMLR, 2022.
- Niu et al. [2023] Shuaicheng Niu, Jiaxiang Wu, Yifan Zhang, Zhiquan Wen, Yaofo Chen, Peilin Zhao, and Mingkui Tan. Towards stable test-time adaptation in dynamic wild world. In The Eleventh International Conference on Learning Representations, 2023.
- Press et al. [2023] Ori Press, Steffen Schneider, Matthias Kümmerer, and Matthias Bethge. Rdumb: A simple approach that questions our progress in continual test-time adaptation. In Thirty-seventh Conference on Neural Information Processing Systems, 2023.
- Quiñonero-Candela et al. [2008] Joaquin Quiñonero-Candela, Masashi Sugiyama, Anton Schwaighofer, and Neil D Lawrence. Dataset shift in machine learning. Mit Press, 2008.
- Ronneberger et al. [2015] Olaf Ronneberger, Philipp Fischer, and Thomas Brox. U-net: Convolutional networks for biomedical image segmentation. In Medical Image Computing and Computer-Assisted Intervention – MICCAI 2015, pages 234–241, Cham, 2015. Springer International Publishing.
- Vaswani et al. [2017] Ashish Vaswani, Noam Shazeer, Niki Parmar, Jakob Uszkoreit, Llion Jones, Aidan N Gomez, Ł ukasz Kaiser, and Illia Polosukhin. Attention is all you need. In Advances in Neural Information Processing Systems. Curran Associates, Inc., 2017.
- Wang et al. [2021] Dequan Wang, Evan Shelhamer, Shaoteng Liu, Bruno Olshausen, and Trevor Darrell. Tent: Fully test-time adaptation by entropy minimization. In International Conference on Learning Representations, 2021.
- Wang et al. [2022] Qin Wang, Olga Fink, Luc Van Gool, and Dengxin Dai. Continual test-time domain adaptation. In Proceedings of the IEEE/CVF Conference on Computer Vision and Pattern Recognition (CVPR), pages 7201–7211, 2022.
- Yuan et al. [2023] Longhui Yuan, Binhui Xie, and Shuang Li. Robust test-time adaptation in dynamic scenarios. In Proceedings of the IEEE/CVF Conference on Computer Vision and Pattern Recognition (CVPR), pages 15922–15932, 2023.
- Zhang et al. [2022] Marvin Zhang, Sergey Levine, and Chelsea Finn. Memo: Test time robustness via adaptation and augmentation. In Advances in Neural Information Processing Systems, pages 38629–38642. Curran Associates, Inc., 2022.
Supplementary Material
Appendix A Proof of Theorems
A.1 Proof of Theorem 3.1
We start expanding test error with few modifications from GDE [21]:
| (14) | ||||
| (15) | ||||
| (exchanging expectations) | (16) | |||
| (17) | ||||
| (18) | ||||
| (19) | ||||
| (20) | ||||
| (21) | ||||
| (22) | ||||
| (23) | ||||
| (24) | ||||
| (25) | ||||
| (26) | ||||
| (27) | ||||
Then, we expand the prediction disagreement with dropouts () from its definition:
| (28) | ||||
| (29) | ||||
| (30) | ||||
| (31) | ||||
| (32) | ||||
| (33) | ||||
| (34) | ||||
| (35) | ||||
| (36) | ||||
| (37) | ||||
| (38) | ||||
| (39) | ||||
| (40) | ||||
| (41) | ||||
| (42) |
Equation 27 is equivalent to Equation 42:
| (43) |
which concludes the proof of Theorem 3.1.
A.2 Proof of Theorem 3.2
From robust confidence-prediction calibration, the over-confident model’s conditional probability of the major class is scaled by , while other classes’ conditional probabilities are equally scaled up by . Then, Equation 27 now becomes:
| (44) | ||||
| (45) | ||||
| (46) | ||||
| (47) | ||||
| (48) | ||||
We rewrite Equation 48 as:
| (49) |
Then, we rewrite PDD (Equation 42):
| (50) | ||||
| (51) | ||||
| (52) | ||||
| (53) | ||||
| (54) |
Finally, we obtain the equality between and :
| (55) | |||
| (56) |
which concludes the proof of Theorem 3.2. Note that without weighting (), the result is identical to Theorem 3.1.
Appendix B Additional Experiments
GDE with multiple pre-trained models.
We compare AETTA with the original version of GDE (denoted as GDE*), utilizing multiple pre-trained models with access to training data. We report the result in Table 4. Due to the misalignment of confidence-prediction calibration, GDE* underperforms AETTA even with full access to source data.
| TTA Method | ||||||||
| Dataset | Method | TENT [34] | EATA [28] | SAR [29] | CoTTA [35] | RoTTA [36] | SoTTA [12] | Avg. () |
| GDE* [21] | 14.54 ± 8.14 | 4.11 ± 2.43 | 7.27 ± 0.16 | 9.89 ± 0.29 | 7.44 ± 0.13 | 5.79 ± 0.23 | 8.17 ± 0.87 | |
| Continual CIFAR100-C | AETTA | 5.85 ± 0.36 | 4.18 ± 0.82 | 6.67 ± 0.12 | 6.55 ± 0.17 | 5.86 ± 0.10 | 5.32 ± 0.18 | 5.74 ± 0.13 |
ImageNet-R.
To demonstrate the dataset generality of AETTA, we report the accuracy estimation result on ResNet18 architecture on ImageNet-R (Table 5). AETTA outperformed the baselines in all TTA methods, showing AETTA is applicable in various datasets (e.g., CIFAR10-C, CIFAR100-C, ImageNet-C, and ImageNet-R).
| TTA Method | ||||||||
| Dataset | Method | TENT [34] | EATA [28] | SAR [29] | CoTTA [35] | RoTTA [36] | SoTTA [12] | Avg. () |
| SrcValid | 37.00 ± 0.14 | 37.91 ± 0.18 | 36.58 ± 0.24 | 35.05 ± 0.16 | 34.43 ± 0.05 | 37.82 ± 0.41 | 36.46 ± 0.05 | |
| SoftmaxScore [7] | 10.79 ± 0.17 | 13.87 ± 0.09 | 15.02 ± 0.14 | 14.76 ± 0.07 | 14.08 ± 0.04 | 12.25 ± 0.42 | 13.46 ± 0.06 | |
| GDE [21] | 62.81 ± 0.12 | 61.36 ± 0.14 | 63.27 ± 0.18 | 64.86 ± 0.10 | 62.64 ± 0.12 | 55.23 ± 0.29 | 61.70 ± 0.02 | |
| AdvPerturb [23] | 13.42 ± 0.28 | 16.04 ± 0.36 | 17.90 ± 0.28 | 21.19 ± 0.22 | 31.12 ± 0.12 | 9.91 ± 0.73 | 18.26 ± 0.03 | |
| ImageNet-R | AETTA | 8.02 ± 0.12 | 6.87 ± 0.08 | 7.06 ± 0.19 | 7.07 ± 0.11 | 8.63 ± 0.19 | 6.79 ± 0.29 | 7.41 ± 0.05 |
ResNet50.
To demonstrate the model generality of AETTA, we report the accuracy estimation result on ResNet50 architecture on ImageNet-C (Table 6). AETTA outperformed the baselines in general, showing AETTA is applicable to diverse model architectures.
| TTA Method | ||||||||
| Dataset | Method | TENT [34] | EATA [28] | SAR [29] | CoTTA [35] | RoTTA [36] | SoTTA [12] | Avg. () |
| SrcValid | 46.46 ± 0.15 | 34.19 ± 0.67 | 30.35 ± 0.75 | 46.47 ± 0.17 | 12.28 ± 0.11 | 19.28 ± 0.18 | 31.50 ± 0.26 | |
| SoftmaxScore [7] | 23.58 ± 0.03 | 24.14 ± 0.04 | 26.22 ± 0.05 | 23.57 ± 0.04 | 24.32 ± 0.02 | 17.87 ± 0.24 | 23.28 ± 0.03 | |
| GDE [21] | 68.39 ± 0.04 | 57.08 ± 0.08 | 55.81 ± 0.06 | 68.36 ± 0.04 | 58.69 ± 0.09 | 48.15 ± 0.33 | 59.41 ± 0.04 | |
| AdvPerturb [23] | 12.77 ± 0.04 | 21.16 ± 0.05 | 23.66 ± 0.08 | 12.77 ± 0.05 | 16.44 ± 0.00 | 25.28 ± 0.32 | 18.68 ± 0.05 | |
| Fully ImageNet-C | AETTA | 6.14 ± 0.05 | 9.15 ± 0.03 | 8.50 ± 0.07 | 6.15 ± 0.04 | 28.28 ± 0.03 | 36.90 ± 0.36 | 15.85 ± 0.09 |
| SrcValid | 46.38 ± 0.10 | 35.83 ± 0.74 | 24.35 ± 1.86 | 46.46 ± 0.22 | 13.79 ± 0.16 | 5.12 ± 0.29 | 28.65 ± 0.46 | |
| SoftmaxScore [7] | 23.58 ± 0.03 | 21.34 ± 0.06 | 16.64 ± 0.25 | 23.61 ± 0.01 | 19.99 ± 0.25 | 51.60 ± 0.75 | 26.13 ± 0.12 | |
| GDE [21] | 68.36 ± 0.03 | 58.41 ± 0.14 | 60.20 ± 0.24 | 68.38 ± 0.01 | 68.98 ± 0.52 | 86.08 ± 0.36 | 68.40 ± 0.09 | |
| AdvPerturb [23] | 12.80 ± 0.04 | 19.82 ± 0.12 | 21.50 ± 0.14 | 12.77 ± 0.02 | 13.77 ± 0.35 | 4.79 ± 0.17 | 14.24 ± 0.07 | |
| Continual ImageNet-C | AETTA | 6.15 ± 0.05 | 10.81 ± 0.01 | 6.41 ± 0.08 | 6.00 ± 0.04 | 14.90 ± 0.30 | 4.21 ± 0.12 | 8.08 ± 0.04 |
Appendix C Discussion
Potential Societal Impact.
The computational overheads associated with test-time adaptation (TTA) could raise environmental concerns, particularly regarding carbon emissions. Our algorithm introduces extra model inferences for accuracy estimation. Importantly, our approach of utilizing dropout inference is computationally lightweight compared to baseline methods involving model retraining [21] and adversarial backpropagation [23]. Recent advancements, such as the memory-economic TTA [20], are anticipated to tackle these challenges effectively. This implies that, despite the computational demands, the environmental impact of our approach could be mitigated by integrating emerging strategies for resource-efficient TTA implementations.
Limitations and Future Directions.
Our research investigates the possibility of accuracy estimation for TTA with only unlabeled data. A promising direction for further improvements is the (1) optimization of the weighting constant (or corresponding ), which stands to fine-tune the calibration process, and (2) estimation of the variable for more precise error estimates. Also, we presented a case study on model recovery to demonstrate the practicality of accuracy estimation. While we chose a heuristic method to reset the model for the simplicity of analysis, there exists room for improvement to be more effective. Beyond model recovery, we also envision the potential of accuracy estimation in broader applications, such as model refinement and maintenance processes, and enhancing the dynamics of human-AI interactions, which we leave as future work.
Appendix D Experiment Details
We conducted all experiments under three random seeds (0, 1, 2) and reported the average values with standard deviations. The experiments were performed on NVIDIA GeForce RTX 3090 and NVIDIA TITAN RTX GPUs.
D.1 Accuracy Estimation Details
AETTA (Ours).
We used the number of dropout inference samples and prediction disagreement weighting hyperparameter for all experiments. The maximum entropy for the model is calculated as where is a number of classes and is one vector with size ; which results in 2.3, 4.6, and 6.9 for 10, 100, and 1,000 classes. We applied the Dropout module for each residual block layer in ResNet18 [17], where the dropout rate is 0.4, 0.3, and 0.2 for 10, 100, and 1,000 classes, following previous studies which apply different hyperparameters for different numbers of classes [28, 35, 12].
SrcValid.
For SrcValid, we used labeled source-domain validation data and calculated the accuracy. We used 1,000 random samples from the validation set of the source dataset.
SoftmaxScore.
GDE.
For generalization disagreement equality (GDE) [21], we calculated the (dis)agreement rate between predictions of the test batch over a pair of models. Unlike the setting in domain adaptation of utilizing multiple pre-trained models, we utilized the models in different adaptation stages. Specifically, we compared the two models: (1) the currently adapted model and (2) the previous model right before the adaptation. This follows the suggestion that utilizing only two models is sufficient to calculate disagreement [21].
AdvPerturb.
Adversarial perturbation [23] estimates the source model accuracy by calculating the agreement between the domain-adapted and source models by applying adversarial perturbation on the source model side. In the TTA setting, we compared the test-time-adapted model with the source model and applied the FGSM [14] adversarial attack with attack size following the original paper ().
D.2 TTA Method Details
In this study, we followed the official implementation of TTA methods. To maintain consistency, we adopted the optimal hyperparameters reported in the corresponding papers or source code repositories. We also provide additional implementation details and the use of hyperparameters if not specified in the original paper or the source code.
TENT.
For TENT [34], we configured the learning rate as for CIFAR10-C/CIFAR100-C and for ImageNet-C, aligning with the guidelines outlined in the original paper. The implementation followed the official code.333https://github.com/DequanWang/tent
EATA.
For EATA [28], we followed the original configuration of for CIFAR10-C/CIFAR100-C/ImageNet-C, entropy constant , where represents the number of classes. Additionally, we set the cosine sample similarity threshold , trade-off parameter , and moving average factor . The Fisher importance calculation involved 2,000 samples, as recommended. The implementation followed the official code.444https://github.com/mr-eggplant/EATA
SAR.
For SAR [29], we selected a batch size 64 for fair comparisons. We set a learning rate of , sharpness threshold , and entropy threshold , following the recommendations from the original paper. The top layer (layer 4 for ResNet18) was frozen, consistent with the original paper. The implementation followed the official code.555https://github.com/mr-eggplant/SAR
CoTTA.
For CoTTA [35], we set the restoration factor , and exponential moving average (EMA) factor . For augmentation confidence threshold , we followed the authors’ guidelines as for CIFAR10-C, for CIFAR100-C, and for ImageNet-C. The implementation followed the official code.666https://github.com/qinenergy/cotta
RoTTA.
For RoTTA [36], we utilized the Adam optimizer [22] with a learning rate of and . We followed the original hyperparameters, including BN-statistic exponential moving average updating rate , Teacher model’s exponential moving average updating rate , timeliness parameter , and uncertainty parameter . The implementation followed the original code.777https://github.com/BIT-DA/RoTTA
SoTTA.
For SoTTA [12], the Adam optimizer [22] was employed, featuring a BN momentum of and a learning rate of with a single adaptation epoch. The memory size was set to 64, with the confidence threshold configured as 0.99 for CIFAR10-C (10 classes), 0.66 for CIFAR100-C (100 classes), and 0.33 for ImageNet-C (1,000 classes). The entropy-sharpness L2-norm constraint was set to 0.5, aligning with the suggestion [8]. The top layer was frozen following the original paper. The implementation followed the original code.888https://github.com/taeckyung/sotta
D.3 Experiment Setting Details
Datasets.
CIFAR10-C/CIFAR100-C/ImageNet-C [18] are the most widely used benchmarks for test-time adaptation (TTA) [34, 28, 29, 35, 36, 12, 11]. All datasets contain 15 corruption types, including Gaussian, Snow, Frost, Fog, Brightness, Contrast, Elastic Transformation, Pixelate, and JPEG Compression. Each corruption is applied in 5 levels of severity, where we adopt the highest severity level of 5. CIFAR10-C and CIFAR100-C consist of 50,000 train images and 10,000 test images for 10 and 100 classes. ImageNet-C consists of 1,281,167 train images and 50,000 test images for 1,000 classes.
Pre-Training.
We employed the ResNet18 [17] as the backbone network. The model is trained for each CIFAR10-C/CIFAR100-C/ImageNet-C on the training dataset. For CIFAR10-C/CIFAR100-C, we utilized the stochastic gradient descent with a batch size of 128, a learning rate of 0.1, and a momentum of 0.9, with cosine annealing learning rate scheduling [25] for 200 epochs. For ImageNet-C, we utilized the pre-trained model from TorchVision [26].
Test-Time Adaptation.
For the fully TTA, each TTA method adapts to one corruption at a time. For the continual TTA, each TTA method continually adapts to 15 corruptions in the predefined order of [Gaussian, Snow, Frost, Fog, Brightness, Contrast, Elastic Transformation, Pixelate, and JPEG Compression], following the previous study [35]. For all experiments, we use the batch size of 64, with memory size 64 for RoTTA [36] and SoTTA [12] for a fair comparison.
D.4 Model Recovery Details (Section 5)
AETTA (Ours).
With AETTA, our reset algorithm detects two cases: (1) consecutive low accuracies and (2) sudden accuracy drops. For consecutive low accuracies, we utilize the information of estimated accuracy from each 5 batches. Regarding hard lower-bound thresholding, we employ a threshold value of 0.2. We reset both the model’s weights to those from the source model and the optimizer’s state to its initialization value.
Episodic.
Episodic resetting was first introduced by MEMO [37], where the model resets after every batch. We reset both the model’s weights and the optimizer’s state to its value before adaptation.
MRS.
The Model Recovery Scheme (MRS) was initially introduced by SAR [29] to recover the model from collapsing. The reset occurs when the moving average of entropy loss falls below a certain threshold. We utilized the threshold value of 0.2 introduced in the original paper. We reset both the model’s weights to those from the source model and the optimizer’s state to its initialization value.
Stochastic.
Stochastic restoration was first introduced by CoTTA [35]. A small number of model weights are stochastically restored to the initial weights of the source model, with a certain probability specified by the restoration factor. We use the restoration factor 0.01, as introduced in the original work.
FisherStochastic.
Fisher information based restoration was proposed by PETAL [3], based on the stochastic restoration [35]. It applies stochastic restoration based on layer importance measured by the Fisher information matrix (FIM). We use an FIM-based parameter restoration quantile value of 0.03 for CIFAR100-C, as recommended in the original paper. The parameter with an FIM value less than 0.03-quantile would be restored to the original source weight.
DistShift.
DistShift assumes that the model knows when the distribution changes and thus acts as an oracle. Resetting occurs when the test data distribution (corruption) changes. We reset both the model’s weights to those from the source model and the optimizer’s state to its initialization value.
Appendix E License of Assets
Datasets.
CIFAR10/CIFAR100 (MIT License), CIFAR10-C/CIFAR100-C (Creative Commons Attribution 4.0 International) and ImageNet-C (Apache 2.0).
Codes.
Torchvision for ResNet18 and ResNet50 (Apache 2.0), the official repository of TENT (MIT License), the official repository of EATA (MIT License), the official repository of SAR (BSD 3-Clause License), the official repository of CoTTA (MIT License), the official repository of RoTTA (MIT License), and the official repository of SoTTA (MIT License).
Appendix F Result Details
We report the detailed results per corruption in the main experiments. Table 1 in the main paper is detailed in Table 7, Table 8, and Table 9. Table 2 in the main paper is detailed in Table 10, Table 11, and Table 12. Table 3 in the main paper is detailed in Table 13.
| Noise | Blur | Weather | Digital | ||||||||||||||
| TTA Method | Acc. Estimation | Gau. | Shot | Imp. | Def. | Gla. | Mot. | Zoom | Snow | Fro. | Fog | Brit. | Cont. | Elas. | Pix. | JPEG | Avg.() |
| SrcValid | 24.85 ± 0.83 | 21.82 ± 0.74 | 32.41 ± 0.90 | 11.60 ± 0.53 | 32.49 ± 1.50 | 12.78 ± 0.45 | 11.16 ± 0.62 | 15.90 ± 0.57 | 17.90 ± 1.04 | 13.12 ± 0.78 | 8.46 ± 0.35 | 12.62 ± 0.33 | 21.53 ± 1.26 | 16.35 ± 0.68 | 22.57 ± 1.26 | 18.37 ± 0.29 | |
| SoftmaxScore [7] | 8.40 ± 0.10 | 6.57 ± 0.91 | 12.95 ± 1.53 | 3.96 ± 0.50 | 14.30 ± 2.12 | 3.76 ± 0.12 | 3.52 ± 0.36 | 4.40 ± 0.08 | 6.20 ± 0.94 | 4.08 ± 0.50 | 3.13 ± 0.08 | 4.06 ± 0.36 | 6.62 ± 1.00 | 4.63 ± 0.47 | 7.32 ± 1.40 | 6.26 ± 0.49 | |
| GDE [21] | 25.29 ± 0.67 | 22.16 ± 0.78 | 32.75 ± 1.04 | 12.07 ± 0.92 | 33.26 ± 1.83 | 12.78 ± 0.55 | 11.25 ± 0.84 | 16.02 ± 0.55 | 18.57 ± 1.07 | 13.56 ± 1.14 | 8.81 ± 0.38 | 12.72 ± 0.25 | 21.58 ± 1.23 | 16.64 ± 1.03 | 22.97 ± 1.34 | 18.69 ± 0.28 | |
| AdvPerturb [23] | 48.04 ± 2.26 | 44.69 ± 3.91 | 41.20 ± 5.55 | 28.88 ± 3.38 | 10.96 ± 2.02 | 18.75 ± 2.07 | 22.50 ± 1.34 | 5.56 ± 0.43 | 14.27 ± 2.42 | 10.58 ± 2.22 | 2.48 ± 0.08 | 52.38 ± 1.67 | 4.73 ± 0.25 | 35.74 ± 1.12 | 5.20 ± 0.10 | 23.06 ± 1.17 | |
| TENT [34] | AETTA | 4.12 ± 0.45 | 4.67 ± 0.42 | 4.59 ± 0.45 | 3.14 ± 0.11 | 7.05 ± 0.49 | 3.20 ± 0.03 | 3.07 ± 0.35 | 3.66 ± 0.11 | 4.07 ± 0.58 | 3.32 ± 0.26 | 2.70 ± 0.05 | 4.29 ± 0.19 | 4.01 ± 0.38 | 3.69 ± 0.13 | 4.41 ± 0.35 | 4.00 ± 0.03 |
| SrcValid | 18.53 ± 0.43 | 16.06 ± 1.16 | 24.04 ± 1.75 | 10.55 ± 0.25 | 23.95 ± 2.07 | 11.72 ± 0.61 | 10.26 ± 0.11 | 12.81 ± 0.31 | 12.85 ± 0.48 | 10.27 ± 0.36 | 7.78 ± 0.32 | 8.88 ± 0.82 | 19.00 ± 1.34 | 12.62 ± 0.56 | 16.18 ± 1.01 | 14.37 ± 0.33 | |
| SoftmaxScore [7] | 4.75 ± 0.62 | 3.85 ± 0.37 | 9.08 ± 0.24 | 4.14 ± 0.41 | 8.77 ± 2.09 | 3.92 ± 0.19 | 4.44 ± 0.42 | 3.50 ± 0.30 | 3.54 ± 0.39 | 4.02 ± 0.24 | 4.79 ± 0.48 | 4.22 ± 0.47 | 4.38 ± 0.40 | 3.58 ± 0.37 | 4.70 ± 0.42 | 4.78 ± 0.12 | |
| GDE [21] | 22.88 ± 0.72 | 20.42 ± 0.72 | 30.68 ± 0.46 | 11.07 ± 0.19 | 30.04 ± 2.50 | 12.58 ± 0.56 | 10.78 ± 0.38 | 14.99 ± 0.28 | 14.52 ± 0.56 | 11.48 ± 0.13 | 8.27 ± 0.46 | 9.32 ± 0.48 | 21.01 ± 0.92 | 14.85 ± 0.11 | 21.31 ± 0.97 | 16.95 ± 0.22 | |
| AdvPerturb [23] | 50.21 ± 4.36 | 45.60 ± 3.84 | 44.13 ± 4.72 | 31.34 ± 2.85 | 16.32 ± 0.62 | 19.30 ± 1.78 | 22.95 ± 2.10 | 6.43 ± 0.19 | 17.52 ± 3.03 | 13.62 ± 0.85 | 2.73 ± 0.15 | 56.00 ± 1.18 | 4.93 ± 0.06 | 37.56 ± 0.69 | 5.99 ± 0.70 | 24.97 ± 1.00 | |
| EATA [28] | AETTA | 3.86 ± 0.28 | 4.09 ± 0.25 | 5.56 ± 0.77 | 3.07 ± 0.23 | 6.88 ± 1.05 | 3.42 ± 0.20 | 3.07 ± 0.29 | 3.25 ± 0.03 | 3.48 ± 0.12 | 3.31 ± 0.33 | 2.73 ± 0.11 | 2.76 ± 0.23 | 4.45 ± 0.10 | 3.34 ± 0.35 | 4.72 ± 0.75 | 3.87 ± 0.14 |
| SrcValid | 32.05 ± 1.03 | 30.47 ± 0.81 | 37.29 ± 0.79 | 12.22 ± 0.20 | 33.83 ± 0.43 | 13.71 ± 0.10 | 12.62 ± 0.36 | 18.37 ± 0.36 | 19.73 ± 0.52 | 14.61 ± 0.57 | 9.26 ± 0.24 | 13.12 ± 0.43 | 23.28 ± 0.20 | 20.67 ± 0.02 | 28.02 ± 0.54 | 21.28 ± 0.27 | |
| SoftmaxScore [7] | 4.21 ± 0.33 | 4.08 ± 0.17 | 5.52 ± 0.59 | 6.28 ± 0.31 | 4.89 ± 0.20 | 5.92 ± 0.26 | 6.49 ± 0.52 | 4.85 ± 0.27 | 4.86 ± 0.29 | 5.80 ± 0.59 | 7.11 ± 0.48 | 5.34 ± 0.30 | 4.26 ± 0.24 | 4.55 ± 0.09 | 3.94 ± 0.11 | 5.21 ± 0.22 | |
| GDE [21] | 31.88 ± 1.08 | 30.38 ± 0.85 | 37.17 ± 0.78 | 12.22 ± 0.20 | 33.72 ± 0.46 | 13.71 ± 0.10 | 12.62 ± 0.36 | 18.37 ± 0.36 | 19.73 ± 0.52 | 14.61 ± 0.57 | 9.26 ± 0.24 | 13.12 ± 0.43 | 23.28 ± 0.20 | 20.67 ± 0.02 | 27.99 ± 0.55 | 21.25 ± 0.27 | |
| AdvPerturb [23] | 42.25 ± 2.34 | 37.73 ± 2.89 | 38.52 ± 4.53 | 30.55 ± 3.11 | 9.85 ± 1.85 | 18.17 ± 1.49 | 21.66 ± 2.37 | 4.60 ± 0.60 | 14.48 ± 2.98 | 11.73 ± 0.52 | 2.71 ± 0.14 | 52.81 ± 2.08 | 4.92 ± 0.04 | 31.36 ± 0.89 | 6.98 ± 0.44 | 21.89 ± 0.95 | |
| SAR [29] | AETTA | 4.91 ± 0.84 | 5.15 ± 0.89 | 4.75 ± 0.19 | 2.92 ± 0.14 | 5.42 ± 0.47 | 3.09 ± 0.06 | 3.18 ± 0.21 | 3.55 ± 0.37 | 3.65 ± 0.17 | 3.25 ± 0.34 | 2.81 ± 0.06 | 3.58 ± 0.61 | 3.87 ± 0.15 | 3.69 ± 0.43 | 4.47 ± 0.23 | 3.89 ± 0.07 |
| SrcValid | 23.70 ± 0.75 | 21.84 ± 0.28 | 28.79 ± 0.21 | 12.46 ± 0.33 | 29.57 ± 0.62 | 13.92 ± 0.06 | 12.75 ± 0.25 | 17.30 ± 0.41 | 17.21 ± 0.30 | 14.75 ± 0.51 | 9.26 ± 0.21 | 15.14 ± 0.06 | 21.29 ± 0.43 | 17.69 ± 0.14 | 20.78 ± 0.38 | 18.43 ± 0.16 | |
| SoftmaxScore [7] | 16.82 ± 0.51 | 17.21 ± 0.63 | 16.33 ± 0.22 | 6.71 ± 0.42 | 12.30 ± 0.19 | 7.02 ± 0.43 | 7.30 ± 0.71 | 9.69 ± 0.48 | 12.00 ± 0.63 | 7.54 ± 0.45 | 7.18 ± 0.56 | 7.90 ± 0.61 | 12.01 ± 0.38 | 11.76 ± 0.74 | 12.69 ± 0.63 | 10.96 ± 0.28 | |
| GDE [21] | 15.65 ± 0.77 | 14.29 ± 0.35 | 19.35 ± 0.33 | 12.08 ± 0.17 | 21.18 ± 0.52 | 13.08 ± 0.16 | 12.20 ± 0.07 | 14.43 ± 0.15 | 13.44 ± 0.17 | 13.60 ± 0.49 | 9.20 ± 0.16 | 13.16 ± 0.30 | 16.40 ± 0.06 | 13.91 ± 0.58 | 15.46 ± 0.45 | 14.50 ± 0.03 | |
| AdvPerturb [23] | 16.79 ± 0.32 | 15.09 ± 0.89 | 18.84 ± 3.83 | 31.44 ± 3.23 | 6.81 ± 0.51 | 20.83 ± 2.16 | 23.18 ± 2.46 | 6.05 ± 0.33 | 11.83 ± 1.56 | 17.25 ± 1.20 | 2.64 ± 0.06 | 55.25 ± 1.82 | 14.63 ± 1.63 | 21.96 ± 1.58 | 7.41 ± 0.68 | 18.00 ± 0.82 | |
| CoTTA [35] | AETTA | 15.34 ± 1.06 | 15.26 ± 1.54 | 14.98 ± 0.87 | 3.02 ± 0.06 | 6.45 ± 0.60 | 3.22 ± 0.17 | 3.20 ± 0.28 | 4.11 ± 0.24 | 5.57 ± 0.48 | 3.48 ± 0.39 | 2.79 ± 0.05 | 4.24 ± 0.10 | 5.56 ± 0.63 | 6.10 ± 0.92 | 9.18 ± 0.89 | 6.83 ± 0.47 |
| SrcValid | 27.12 ± 7.07 | 27.75 ± 6.21 | 14.88 ± 3.34 | 12.12 ± 3.16 | 25.35 ± 1.09 | 5.02 ± 0.23 | 4.88 ± 0.72 | 14.33 ± 3.02 | 36.52 ± 1.99 | 11.62 ± 1.44 | 35.55 ± 2.35 | 35.93 ± 0.82 | 20.00 ± 0.14 | 7.96 ± 0.72 | 26.23 ± 0.98 | 20.35 ± 1.31 | |
| SoftmaxScore [7] | 4.68 ± 0.46 | 4.64 ± 0.15 | 5.19 ± 0.31 | 7.29 ± 0.50 | 4.77 ± 0.27 | 7.12 ± 0.50 | 7.73 ± 0.65 | 6.49 ± 0.31 | 6.28 ± 0.47 | 7.32 ± 0.76 | 8.40 ± 0.59 | 4.71 ± 0.47 | 5.25 ± 0.04 | 5.89 ± 0.43 | 4.39 ± 0.14 | 6.01 ± 0.23 | |
| GDE [21] | 32.94 ± 0.75 | 30.87 ± 0.91 | 39.40 ± 0.72 | 12.02 ± 0.22 | 34.18 ± 0.90 | 13.48 ± 0.48 | 12.01 ± 0.26 | 17.90 ± 0.80 | 21.73 ± 0.82 | 13.93 ± 0.51 | 8.90 ± 0.42 | 40.52 ± 2.50 | 22.68 ± 0.44 | 21.22 ± 0.37 | 27.31 ± 0.69 | 23.27 ± 0.43 | |
| AdvPerturb [23] | 40.38 ± 2.57 | 36.59 ± 2.88 | 35.02 ± 3.67 | 29.64 ± 2.94 | 9.29 ± 1.72 | 17.31 ± 1.01 | 21.45 ± 2.59 | 4.81 ± 0.35 | 11.96 ± 2.41 | 11.24 ± 0.41 | 2.70 ± 0.09 | 26.49 ± 4.84 | 5.42 ± 0.24 | 29.92 ± 0.45 | 8.06 ± 0.59 | 19.35 ± 0.99 | |
| RoTTA [36] | AETTA | 13.47 ± 5.78 | 13.35 ± 5.69 | 9.74 ± 3.87 | 3.55 ± 0.44 | 5.42 ± 1.13 | 3.68 ± 0.27 | 3.88 ± 0.43 | 4.45 ± 0.93 | 4.93 ± 1.02 | 4.51 ± 0.62 | 3.31 ± 0.33 | 12.13 ± 6.65 | 4.66 ± 1.17 | 4.97 ± 1.13 | 4.57 ± 0.24 | 6.44 ± 1.35 |
| SrcValid | 11.98 ± 4.00 | 10.86 ± 0.74 | 8.25 ± 0.47 | 9.73 ± 2.10 | 23.16 ± 0.58 | 4.54 ± 0.68 | 4.74 ± 1.04 | 5.55 ± 0.66 | 16.12 ± 2.74 | 4.56 ± 0.17 | 13.62 ± 2.37 | 38.68 ± 6.48 | 19.00 ± 0.45 | 5.57 ± 0.67 | 20.67 ± 0.57 | 13.13 ± 0.85 | |
| SoftmaxScore [7] | 4.10 ± 0.13 | 4.46 ± 0.27 | 4.50 ± 0.17 | 5.45 ± 1.04 | 5.05 ± 0.65 | 5.47 ± 0.69 | 6.14 ± 0.62 | 4.82 ± 0.53 | 4.91 ± 0.97 | 5.61 ± 0.82 | 6.17 ± 1.00 | 4.36 ± 0.85 | 4.23 ± 0.41 | 5.25 ± 0.70 | 4.07 ± 0.26 | 4.97 ± 0.50 | |
| GDE [21] | 23.46 ± 0.77 | 20.15 ± 0.46 | 29.27 ± 0.45 | 10.60 ± 0.38 | 28.84 ± 0.86 | 11.03 ± 0.11 | 10.00 ± 0.56 | 13.53 ± 0.58 | 14.42 ± 0.16 | 10.67 ± 0.40 | 7.09 ± 0.09 | 13.81 ± 1.96 | 19.08 ± 0.52 | 14.25 ± 0.50 | 20.51 ± 0.82 | 16.45 ± 0.21 | |
| AdvPerturb [23] | 47.94 ± 3.36 | 43.98 ± 3.57 | 44.74 ± 4.05 | 30.14 ± 2.33 | 12.47 ± 2.81 | 18.81 ± 1.68 | 22.85 ± 2.61 | 5.48 ± 0.77 | 16.01 ± 2.86 | 12.78 ± 1.13 | 2.68 ± 0.20 | 49.76 ± 2.32 | 4.95 ± 0.33 | 37.03 ± 1.34 | 5.63 ± 0.43 | 23.68 ± 0.85 | |
| SoTTA [12] | AETTA | 9.08 ± 2.79 | 9.51 ± 2.49 | 9.23 ± 2.73 | 3.58 ± 0.27 | 5.01 ± 0.52 | 3.63 ± 0.45 | 3.77 ± 0.57 | 3.86 ± 0.42 | 4.99 ± 1.17 | 4.24 ± 0.90 | 3.05 ± 0.07 | 5.15 ± 1.28 | 4.33 ± 0.63 | 5.43 ± 1.39 | 4.41 ± 0.51 | 5.28 ± 0.87 |
| Noise | Blur | Weather | Digital | ||||||||||||||
| TTA Method | Acc. Estimation | Gau. | Shot | Imp. | Def. | Gla. | Mot. | Zoom | Snow | Fro. | Fog | Brit. | Cont. | Elas. | Pix. | JPEG | Avg.() |
| SrcValid | 46.38 ± 1.17 | 45.01 ± 1.16 | 51.81 ± 1.79 | 31.42 ± 0.67 | 49.43 ± 0.58 | 33.51 ± 0.64 | 31.37 ± 0.35 | 39.05 ± 0.33 | 38.89 ± 0.28 | 34.25 ± 0.38 | 28.72 ± 0.33 | 33.04 ± 0.61 | 41.81 ± 0.75 | 35.52 ± 0.51 | 44.24 ± 0.66 | 38.96 ± 0.22 | |
| SoftmaxScore [7] | 13.70 ± 0.41 | 14.53 ± 0.58 | 11.33 ± 0.70 | 20.57 ± 0.40 | 13.53 ± 0.49 | 19.91 ± 0.60 | 21.14 ± 0.25 | 17.30 ± 0.27 | 17.10 ± 0.23 | 18.95 ± 0.23 | 21.15 ± 0.12 | 17.26 ± 0.66 | 18.07 ± 0.57 | 19.69 ± 0.13 | 15.89 ± 0.14 | 17.34 ± 0.10 | |
| GDE [21] | 49.21 ± 0.79 | 47.38 ± 0.87 | 54.91 ± 0.53 | 31.71 ± 0.36 | 50.52 ± 0.75 | 33.61 ± 0.70 | 31.61 ± 0.37 | 40.02 ± 0.45 | 40.32 ± 0.13 | 36.41 ± 0.33 | 28.89 ± 0.17 | 32.74 ± 0.61 | 42.20 ± 0.70 | 36.20 ± 0.11 | 45.87 ± 0.35 | 40.11 ± 0.05 | |
| AdvPerturb [23] | 36.92 ± 1.76 | 38.54 ± 0.24 | 35.93 ± 0.49 | 31.08 ± 0.42 | 26.47 ± 1.53 | 18.05 ± 0.82 | 24.02 ± 0.77 | 8.33 ± 0.53 | 21.92 ± 1.07 | 19.26 ± 0.03 | 4.58 ± 0.38 | 48.38 ± 0.25 | 5.43 ± 0.10 | 37.17 ± 2.42 | 6.42 ± 0.25 | 24.17 ± 0.41 | |
| TENT [34] | AETTA | 6.55 ± 0.59 | 6.09 ± 0.17 | 7.60 ± 0.31 | 5.57 ± 0.18 | 10.27 ± 0.36 | 6.05 ± 0.37 | 5.60 ± 0.53 | 8.26 ± 0.09 | 7.21 ± 0.03 | 5.81 ± 0.09 | 5.54 ± 0.28 | 7.32 ± 0.56 | 6.99 ± 0.66 | 5.50 ± 0.23 | 8.96 ± 0.08 | 6.89 ± 0.15 |
| SrcValid | 7.65 ± 0.94 | 7.33 ± 0.33 | 7.51 ± 0.42 | 15.32 ± 1.91 | 8.35 ± 0.45 | 13.56 ± 1.08 | 12.54 ± 1.32 | 9.21 ± 1.68 | 8.91 ± 0.48 | 9.31 ± 0.73 | 17.52 ± 1.75 | 15.60 ± 0.77 | 9.99 ± 1.31 | 9.80 ± 0.28 | 8.09 ± 0.44 | 10.71 ± 0.31 | |
| SoftmaxScore [7] | 36.65 ± 1.55 | 35.32 ± 1.08 | 40.06 ± 2.16 | 15.38 ± 1.48 | 35.65 ± 2.20 | 19.64 ± 2.12 | 20.05 ± 5.94 | 27.09 ± 4.80 | 31.54 ± 4.28 | 24.67 ± 4.45 | 15.80 ± 2.67 | 25.68 ± 7.41 | 31.88 ± 2.77 | 26.64 ± 2.28 | 31.81 ± 0.85 | 27.86 ± 1.11 | |
| GDE [21] | 83.95 ± 1.83 | 83.36 ± 1.31 | 88.21 ± 0.66 | 55.73 ± 3.68 | 84.37 ± 1.49 | 62.93 ± 2.76 | 60.31 ± 7.35 | 73.24 ± 4.38 | 77.51 ± 2.86 | 70.26 ± 4.24 | 40.71 ± 3.37 | 62.07 ± 9.58 | 79.02 ± 2.84 | 71.39 ± 1.01 | 79.95 ± 1.07 | 71.53 ± 2.12 | |
| AdvPerturb [23] | 9.32 ± 0.83 | 8.30 ± 0.59 | 5.08 ± 0.16 | 16.05 ± 1.45 | 5.75 ± 0.87 | 7.72 ± 0.40 | 10.48 ± 1.96 | 4.03 ± 0.44 | 6.07 ± 1.16 | 6.79 ± 1.07 | 3.90 ± 0.18 | 21.65 ± 6.92 | 2.93 ± 0.09 | 12.38 ± 0.61 | 2.87 ± 0.07 | 8.22 ± 0.56 | |
| EATA [28] | AETTA | 18.86 ± 2.19 | 19.47 ± 1.46 | 18.76 ± 5.27 | 17.54 ± 1.56 | 26.65 ± 2.14 | 21.51 ± 1.48 | 19.45 ± 2.91 | 20.39 ± 2.07 | 18.76 ± 1.79 | 19.32 ± 0.12 | 11.18 ± 1.82 | 23.44 ± 4.90 | 24.58 ± 0.69 | 20.48 ± 2.46 | 21.82 ± 5.09 | 20.15 ± 1.70 |
| SrcValid | 53.44 ± 0.56 | 51.46 ± 0.76 | 59.19 ± 0.77 | 32.52 ± 0.17 | 53.90 ± 0.52 | 35.00 ± 0.71 | 33.63 ± 0.21 | 43.03 ± 0.48 | 43.55 ± 0.30 | 38.69 ± 0.40 | 30.12 ± 0.20 | 33.17 ± 0.40 | 43.77 ± 0.40 | 39.64 ± 0.44 | 49.16 ± 0.23 | 42.68 ± 0.21 | |
| SoftmaxScore [7] | 20.82 ± 0.65 | 21.98 ± 0.41 | 18.42 ± 0.24 | 27.91 ± 0.39 | 20.67 ± 0.57 | 26.77 ± 0.56 | 27.81 ± 0.20 | 24.33 ± 0.51 | 24.01 ± 0.40 | 26.76 ± 0.48 | 27.92 ± 0.16 | 25.97 ± 0.20 | 25.72 ± 0.41 | 26.20 ± 0.38 | 23.11 ± 0.08 | 24.56 ± 0.25 | |
| GDE [21] | 53.09 ± 0.53 | 51.11 ± 0.69 | 58.81 ± 0.77 | 32.45 ± 0.21 | 53.63 ± 0.55 | 34.91 ± 0.76 | 33.60 ± 0.26 | 42.90 ± 0.57 | 43.42 ± 0.32 | 38.63 ± 0.43 | 30.05 ± 0.19 | 33.08 ± 0.44 | 43.65 ± 0.37 | 39.50 ± 0.44 | 48.87 ± 0.21 | 42.51 ± 0.23 | |
| AdvPerturb [23] | 35.15 ± 1.78 | 36.42 ± 1.64 | 32.87 ± 1.13 | 30.78 ± 0.58 | 23.87 ± 1.07 | 16.74 ± 0.22 | 22.52 ± 0.46 | 7.21 ± 0.46 | 21.01 ± 0.61 | 18.54 ± 0.59 | 4.30 ± 0.42 | 48.28 ± 0.16 | 5.65 ± 0.37 | 34.21 ± 2.97 | 6.09 ± 0.46 | 22.91 ± 0.60 | |
| SAR [29] | AETTA | 5.75 ± 0.45 | 5.33 ± 0.29 | 6.90 ± 0.24 | 5.19 ± 0.22 | 9.56 ± 0.54 | 6.43 ± 0.32 | 5.82 ± 0.30 | 8.34 ± 0.28 | 7.15 ± 0.38 | 5.47 ± 0.18 | 5.37 ± 0.19 | 6.04 ± 0.23 | 6.57 ± 0.50 | 5.72 ± 0.33 | 8.50 ± 0.24 | 6.54 ± 0.15 |
| SrcValid | 53.11 ± 0.39 | 51.88 ± 0.44 | 57.18 ± 0.18 | 36.41 ± 0.61 | 53.90 ± 0.59 | 38.59 ± 0.67 | 37.33 ± 0.46 | 44.93 ± 0.62 | 44.30 ± 0.32 | 43.99 ± 0.46 | 32.17 ± 0.16 | 41.50 ± 1.22 | 45.74 ± 0.20 | 40.52 ± 0.10 | 47.13 ± 0.13 | 44.58 ± 0.30 | |
| SoftmaxScore [7] | 34.06 ± 0.49 | 35.00 ± 0.50 | 32.31 ± 0.35 | 32.88 ± 0.53 | 32.16 ± 0.58 | 33.73 ± 0.76 | 34.70 ± 0.60 | 36.25 ± 0.96 | 36.42 ± 0.36 | 36.35 ± 0.55 | 30.59 ± 0.77 | 32.11 ± 0.49 | 36.57 ± 0.30 | 38.82 ± 0.21 | 35.60 ± 0.09 | 34.50 ± 0.35 | |
| GDE [21] | 36.44 ± 0.63 | 35.59 ± 0.34 | 38.06 ± 0.50 | 31.10 ± 0.04 | 38.74 ± 0.55 | 31.56 ± 0.59 | 30.66 ± 0.31 | 32.25 ± 0.84 | 31.99 ± 0.24 | 32.19 ± 0.47 | 29.77 ± 0.36 | 33.19 ± 0.08 | 33.02 ± 0.17 | 29.45 ± 0.39 | 34.16 ± 0.50 | 33.21 ± 0.24 | |
| AdvPerturb [23] | 26.80 ± 0.88 | 26.32 ± 0.95 | 26.90 ± 0.45 | 32.56 ± 0.56 | 12.67 ± 0.28 | 24.33 ± 0.97 | 27.17 ± 0.14 | 5.68 ± 0.18 | 11.58 ± 0.31 | 30.58 ± 0.42 | 5.21 ± 0.30 | 47.59 ± 0.76 | 10.03 ± 0.60 | 14.24 ± 1.60 | 6.28 ± 0.19 | 20.53 ± 0.14 | |
| CoTTA [35] | AETTA | 9.24 ± 0.38 | 9.97 ± 0.55 | 8.79 ± 0.53 | 5.03 ± 0.20 | 4.83 ± 0.22 | 4.73 ± 0.21 | 4.92 ± 0.11 | 4.66 ± 0.11 | 4.76 ± 0.43 | 4.41 ± 0.16 | 5.04 ± 0.36 | 5.68 ± 0.24 | 4.78 ± 0.22 | 6.27 ± 0.28 | 7.65 ± 0.15 | 6.05 ± 0.12 |
| SrcValid | 28.06 ± 2.60 | 29.10 ± 2.49 | 16.22 ± 0.43 | 34.38 ± 1.94 | 10.57 ± 1.13 | 7.34 ± 0.25 | 17.58 ± 2.21 | 14.31 ± 1.55 | 30.17 ± 1.28 | 15.75 ± 2.45 | 30.84 ± 2.27 | 28.00 ± 1.54 | 31.30 ± 1.65 | 15.53 ± 1.36 | 43.38 ± 1.76 | 23.50 ± 0.51 | |
| SoftmaxScore [7] | 18.70 ± 0.62 | 19.63 ± 0.63 | 17.09 ± 0.46 | 29.83 ± 0.32 | 21.67 ± 0.49 | 28.86 ± 0.09 | 30.26 ± 0.35 | 25.59 ± 0.36 | 21.84 ± 0.54 | 28.33 ± 0.32 | 29.95 ± 0.16 | 13.55 ± 0.61 | 27.63 ± 0.23 | 26.73 ± 0.37 | 23.09 ± 0.49 | 24.18 ± 0.19 | |
| GDE [21] | 59.99 ± 1.07 | 59.43 ± 1.11 | 63.72 ± 0.99 | 33.71 ± 0.18 | 56.11 ± 0.24 | 36.10 ± 0.55 | 34.68 ± 0.67 | 46.27 ± 0.67 | 52.01 ± 0.59 | 41.07 ± 0.17 | 31.91 ± 0.62 | 62.02 ± 0.22 | 45.38 ± 0.57 | 44.14 ± 1.05 | 53.79 ± 0.67 | 48.02 ± 0.56 | |
| AdvPerturb [23] | 25.47 ± 1.49 | 26.56 ± 1.30 | 25.08 ± 0.90 | 28.92 ± 0.25 | 19.97 ± 0.92 | 15.41 ± 0.66 | 21.68 ± 0.69 | 6.37 ± 0.19 | 13.92 ± 0.74 | 15.02 ± 0.93 | 4.50 ± 0.35 | 20.75 ± 1.25 | 6.84 ± 0.53 | 28.80 ± 3.46 | 8.34 ± 0.62 | 17.84 ± 0.65 | |
| RoTTA [36] | AETTA | 6.37 ± 1.21 | 6.88 ± 0.64 | 4.81 ± 0.43 | 4.74 ± 0.23 | 6.28 ± 0.34 | 5.29 ± 0.11 | 5.18 ± 0.42 | 7.22 ± 0.43 | 7.58 ± 1.46 | 4.74 ± 0.26 | 4.79 ± 0.48 | 21.01 ± 3.35 | 5.53 ± 0.49 | 5.28 ± 0.56 | 7.43 ± 1.21 | 6.88 ± 0.10 |
| SrcValid | 13.43 ± 2.25 | 12.55 ± 1.41 | 8.28 ± 1.68 | 37.61 ± 3.05 | 12.41 ± 3.74 | 6.47 ± 0.88 | 12.99 ± 1.60 | 16.44 ± 1.42 | 13.05 ± 1.58 | 7.58 ± 0.80 | 10.12 ± 1.70 | 51.02 ± 4.34 | 35.45 ± 0.57 | 11.12 ± 4.35 | 41.55 ± 0.87 | 19.34 ± 0.63 | |
| SoftmaxScore [7] | 21.66 ± 0.49 | 22.18 ± 0.45 | 19.31 ± 0.05 | 25.96 ± 0.20 | 21.08 ± 0.62 | 25.26 ± 0.47 | 26.54 ± 0.43 | 24.57 ± 0.52 | 24.12 ± 0.19 | 25.49 ± 0.26 | 26.25 ± 0.47 | 23.62 ± 0.52 | 25.30 ± 0.45 | 25.17 ± 0.29 | 23.23 ± 0.39 | 23.98 ± 0.21 | |
| GDE [21] | 41.62 ± 0.27 | 40.60 ± 0.39 | 48.16 ± 0.43 | 26.49 ± 0.24 | 44.28 ± 0.48 | 28.68 ± 0.42 | 26.67 ± 0.34 | 33.51 ± 0.51 | 34.05 ± 0.18 | 30.44 ± 0.51 | 24.30 ± 0.32 | 27.73 ± 0.69 | 36.20 ± 0.21 | 31.28 ± 0.44 | 39.52 ± 0.24 | 34.24 ± 0.12 | |
| AdvPerturb [23] | 41.39 ± 1.33 | 41.35 ± 1.19 | 38.06 ± 0.94 | 32.19 ± 0.31 | 27.92 ± 1.51 | 18.64 ± 0.14 | 24.83 ± 0.76 | 10.19 ± 0.29 | 24.05 ± 0.89 | 21.34 ± 0.74 | 4.84 ± 0.51 | 48.66 ± 0.26 | 6.74 ± 0.18 | 38.48 ± 1.95 | 7.88 ± 0.29 | 25.77 ± 0.47 | |
| SoTTA [12] | AETTA | 8.11 ± 0.91 | 7.95 ± 0.39 | 6.35 ± 0.55 | 4.67 ± 0.32 | 5.03 ± 0.26 | 4.28 ± 0.18 | 4.50 ± 0.28 | 4.68 ± 0.21 | 4.73 ± 0.42 | 5.00 ± 0.37 | 4.18 ± 0.04 | 5.30 ± 0.20 | 4.58 ± 0.07 | 4.94 ± 0.48 | 5.02 ± 0.19 | 5.29 ± 0.18 |
| Noise | Blur | Weather | Digital | ||||||||||||||
| TTA Method | Acc. Estimation | Gau. | Shot | Imp. | Def. | Gla. | Mot. | Zoom | Snow | Fro. | Fog | Brit. | Cont. | Elas. | Pix. | JPEG | Avg.() |
| SrcValid | 53.54 ± 1.08 | 52.12 ± 1.12 | 53.28 ± 0.95 | 54.72 ± 0.95 | 53.66 ± 1.07 | 42.96 ± 0.92 | 32.78 ± 0.83 | 37.25 ± 0.96 | 38.77 ± 0.97 | 25.06 ± 0.94 | 10.47 ± 0.67 | 53.56 ± 0.77 | 27.86 ± 0.85 | 22.35 ± 0.70 | 28.55 ± 0.71 | 39.13 ± 0.89 | |
| SoftmaxScore [7] | 11.11 ± 0.14 | 11.97 ± 0.06 | 11.35 ± 0.03 | 9.82 ± 0.09 | 10.59 ± 0.07 | 19.16 ± 0.09 | 26.76 ± 0.09 | 22.44 ± 0.05 | 21.08 ± 0.06 | 31.41 ± 0.05 | 34.87 ± 0.01 | 9.52 ± 0.04 | 28.83 ± 0.05 | 32.26 ± 0.14 | 28.88 ± 0.11 | 20.67 ± 0.01 | |
| GDE [21] | 85.03 ± 0.14 | 83.75 ± 0.06 | 84.81 ± 0.04 | 85.74 ± 0.09 | 84.87 ± 0.08 | 74.26 ± 0.10 | 64.29 ± 0.08 | 68.95 ± 0.06 | 70.47 ± 0.07 | 56.71 ± 0.02 | 41.78 ± 0.02 | 84.43 ± 0.09 | 59.48 ± 0.07 | 53.93 ± 0.12 | 60.29 ± 0.14 | 70.58 ± 0.01 | |
| AdvPerturb [23] | 13.38 ± 0.12 | 14.08 ± 0.05 | 13.44 ± 0.04 | 4.43 ± 0.15 | 5.21 ± 0.14 | 11.48 ± 0.05 | 11.47 ± 0.13 | 17.17 ± 0.13 | 8.67 ± 0.10 | 26.80 ± 0.03 | 6.56 ± 0.16 | 11.99 ± 0.03 | 17.97 ± 0.03 | 19.11 ± 0.14 | 6.69 ± 0.19 | 12.56 ± 0.03 | |
| TENT [34] | AETTA | 4.88 ± 0.10 | 4.27 ± 0.02 | 4.93 ± 0.09 | 7.23 ± 0.11 | 5.03 ± 0.15 | 4.53 ± 0.09 | 4.72 ± 0.12 | 4.35 ± 0.13 | 4.37 ± 0.11 | 9.50 ± 0.12 | 8.88 ± 0.05 | 6.24 ± 0.02 | 7.34 ± 0.06 | 8.95 ± 0.21 | 6.82 ± 0.17 | 6.14 ± 0.03 |
| SrcValid | 50.34 ± 1.01 | 48.89 ± 0.88 | 49.88 ± 0.76 | 52.47 ± 0.59 | 51.11 ± 0.57 | 40.01 ± 0.83 | 28.80 ± 0.84 | 32.41 ± 0.71 | 35.23 ± 0.95 | 21.78 ± 0.93 | 8.88 ± 0.53 | 51.16 ± 0.97 | 23.11 ± 1.18 | 19.03 ± 0.72 | 25.30 ± 0.92 | 35.89 ± 0.79 | |
| SoftmaxScore [7] | 12.31 ± 0.08 | 13.18 ± 0.15 | 12.71 ± 0.04 | 10.26 ± 0.14 | 10.97 ± 0.05 | 19.72 ± 0.03 | 27.54 ± 0.10 | 23.79 ± 0.12 | 21.46 ± 0.08 | 30.90 ± 0.11 | 32.96 ± 0.08 | 10.51 ± 0.08 | 29.11 ± 0.07 | 31.61 ± 0.08 | 28.90 ± 0.04 | 21.06 ± 0.03 | |
| GDE [21] | 81.21 ± 0.16 | 79.99 ± 0.27 | 80.82 ± 0.03 | 77.04 ± 0.50 | 77.95 ± 0.07 | 70.22 ± 0.13 | 60.30 ± 0.02 | 64.37 ± 0.15 | 67.25 ± 0.16 | 53.43 ± 0.10 | 40.26 ± 0.01 | 76.64 ± 0.03 | 55.33 ± 0.09 | 50.67 ± 0.07 | 57.02 ± 0.03 | 66.17 ± 0.07 | |
| AdvPerturb [23] | 15.44 ± 0.07 | 16.26 ± 0.19 | 15.70 ± 0.07 | 4.89 ± 0.07 | 6.05 ± 0.14 | 13.36 ± 0.11 | 14.92 ± 0.09 | 20.93 ± 0.14 | 10.72 ± 0.22 | 29.38 ± 0.13 | 5.97 ± 0.17 | 13.31 ± 0.14 | 22.32 ± 0.09 | 21.23 ± 0.19 | 7.34 ± 0.14 | 14.52 ± 0.01 | |
| EATA [28] | AETTA | 5.28 ± 0.12 | 4.72 ± 0.05 | 5.28 ± 0.07 | 7.45 ± 0.09 | 5.12 ± 0.10 | 4.37 ± 0.07 | 5.23 ± 0.18 | 4.60 ± 0.13 | 4.73 ± 0.13 | 10.46 ± 0.12 | 9.22 ± 0.09 | 5.38 ± 0.09 | 8.25 ± 0.16 | 9.47 ± 0.10 | 7.68 ± 0.05 | 6.48 ± 0.02 |
| SrcValid | 39.53 ± 1.22 | 37.69 ± 1.46 | 39.79 ± 1.36 | 43.89 ± 1.00 | 43.75 ± 0.82 | 33.12 ± 0.77 | 25.52 ± 1.06 | 27.90 ± 0.86 | 31.43 ± 1.03 | 17.14 ± 0.46 | 9.03 ± 0.71 | 40.82 ± 0.33 | 19.89 ± 1.25 | 16.74 ± 0.89 | 20.27 ± 1.14 | 29.77 ± 0.94 | |
| SoftmaxScore [7] | 18.07 ± 0.26 | 19.20 ± 0.20 | 18.08 ± 0.21 | 14.90 ± 0.25 | 15.23 ± 0.29 | 24.02 ± 0.06 | 29.50 ± 0.06 | 26.57 ± 0.09 | 23.87 ± 0.16 | 33.16 ± 0.11 | 34.57 ± 0.09 | 12.88 ± 1.75 | 31.62 ± 0.09 | 33.20 ± 0.20 | 31.47 ± 0.02 | 24.42 ± 0.08 | |
| GDE [21] | 75.10 ± 0.28 | 73.20 ± 0.21 | 75.19 ± 0.25 | 77.65 ± 0.21 | 77.44 ± 0.28 | 66.24 ± 0.07 | 58.62 ± 0.07 | 61.48 ± 0.10 | 65.23 ± 0.16 | 50.56 ± 0.07 | 40.51 ± 0.12 | 74.62 ± 0.99 | 53.29 ± 0.08 | 49.16 ± 0.20 | 53.97 ± 0.02 | 63.48 ± 0.03 | |
| AdvPerturb [23] | 22.95 ± 0.27 | 24.15 ± 0.14 | 22.86 ± 0.25 | 7.84 ± 0.11 | 10.46 ± 0.36 | 18.99 ± 0.17 | 17.74 ± 0.13 | 24.62 ± 0.12 | 13.19 ± 0.07 | 32.89 ± 0.05 | 6.06 ± 0.06 | 21.28 ± 0.94 | 25.45 ± 0.13 | 23.36 ± 0.15 | 9.55 ± 0.11 | 18.76 ± 0.06 | |
| SAR [29] | AETTA | 5.38 ± 0.27 | 5.24 ± 0.16 | 5.11 ± 0.15 | 8.06 ± 0.04 | 6.19 ± 0.27 | 4.53 ± 0.08 | 5.17 ± 0.14 | 4.97 ± 0.11 | 4.71 ± 0.04 | 9.73 ± 0.16 | 8.68 ± 0.10 | 5.39 ± 0.33 | 7.76 ± 0.17 | 8.66 ± 0.19 | 6.89 ± 0.03 | 6.43 ± 0.09 |
| SrcValid | 55.20 ± 0.50 | 54.09 ± 0.55 | 54.87 ± 0.49 | 56.70 ± 0.86 | 55.43 ± 0.45 | 45.10 ± 0.55 | 34.91 ± 0.54 | 39.13 ± 0.55 | 40.12 ± 0.54 | 27.92 ± 0.56 | 10.68 ± 0.44 | 56.19 ± 0.65 | 29.77 ± 0.49 | 24.40 ± 0.41 | 31.80 ± 0.56 | 41.09 ± 0.53 | |
| SoftmaxScore [7] | 9.93 ± 0.07 | 10.66 ± 0.11 | 10.24 ± 0.03 | 8.36 ± 0.10 | 9.36 ± 0.05 | 17.69 ± 0.14 | 25.68 ± 0.03 | 21.47 ± 0.07 | 20.57 ± 0.05 | 30.40 ± 0.06 | 35.07 ± 0.08 | 7.79 ± 0.13 | 28.04 ± 0.03 | 31.69 ± 0.11 | 27.39 ± 0.08 | 19.62 ± 0.02 | |
| GDE [21] | 86.85 ± 0.06 | 85.76 ± 0.13 | 86.52 ± 0.02 | 88.18 ± 0.12 | 87.04 ± 0.05 | 76.83 ± 0.14 | 66.63 ± 0.03 | 70.86 ± 0.07 | 71.81 ± 0.06 | 59.64 ± 0.06 | 42.23 ± 0.09 | 87.87 ± 0.13 | 61.50 ± 0.03 | 56.13 ± 0.11 | 63.53 ± 0.08 | 72.76 ± 0.02 | |
| AdvPerturb [23] | 11.73 ± 0.07 | 12.19 ± 0.09 | 11.84 ± 0.03 | 3.81 ± 0.06 | 4.33 ± 0.03 | 9.70 ± 0.09 | 9.46 ± 0.06 | 15.50 ± 0.13 | 7.86 ± 0.13 | 24.07 ± 0.09 | 6.72 ± 0.20 | 9.11 ± 0.13 | 15.96 ± 0.09 | 17.56 ± 0.16 | 5.96 ± 0.34 | 11.05 ± 0.02 | |
| CoTTA [35] | AETTA | 4.76 ± 0.07 | 4.00 ± 0.04 | 4.79 ± 0.07 | 7.69 ± 0.18 | 5.04 ± 0.06 | 4.63 ± 0.08 | 4.49 ± 0.15 | 4.39 ± 0.08 | 4.25 ± 0.10 | 8.97 ± 0.12 | 8.81 ± 0.09 | 6.70 ± 0.18 | 7.00 ± 0.02 | 8.44 ± 0.19 | 6.27 ± 0.19 | 6.02 ± 0.03 |
| SrcValid | 15.32 ± 0.10 | 13.73 ± 0.68 | 15.71 ± 0.14 | 4.79 ± 0.54 | 17.18 ± 1.34 | 5.81 ± 0.55 | 9.04 ± 1.50 | 8.44 ± 0.80 | 5.54 ± 0.33 | 8.84 ± 1.21 | 10.68 ± 0.77 | 14.01 ± 0.55 | 7.27 ± 0.34 | 5.59 ± 0.27 | 12.32 ± 0.91 | 10.28 ± 0.28 | |
| SoftmaxScore [7] | 11.98 ± 0.07 | 12.84 ± 0.28 | 12.31 ± 0.13 | 9.96 ± 0.18 | 10.93 ± 0.12 | 19.51 ± 0.09 | 27.15 ± 0.18 | 23.28 ± 0.02 | 20.61 ± 0.11 | 31.75 ± 0.10 | 33.58 ± 0.05 | 11.05 ± 0.14 | 29.18 ± 0.04 | 32.08 ± 0.09 | 29.22 ± 0.10 | 21.03 ± 0.04 | |
| GDE [21] | 80.31 ± 0.05 | 79.07 ± 0.33 | 80.18 ± 0.21 | 82.25 ± 0.26 | 81.56 ± 0.12 | 70.30 ± 0.10 | 60.45 ± 0.17 | 64.30 ± 0.07 | 67.01 ± 0.25 | 52.64 ± 0.18 | 38.45 ± 0.03 | 77.50 ± 0.21 | 55.15 ± 0.07 | 50.24 ± 0.01 | 56.48 ± 0.20 | 66.39 ± 0.04 | |
| AdvPerturb [23] | 13.96 ± 0.07 | 14.55 ± 0.30 | 14.24 ± 0.13 | 4.68 ± 0.09 | 5.18 ± 0.05 | 11.83 ± 0.05 | 12.11 ± 0.12 | 17.54 ± 0.06 | 7.91 ± 0.12 | 27.54 ± 0.11 | 6.71 ± 0.08 | 12.27 ± 0.11 | 18.72 ± 0.11 | 19.66 ± 0.02 | 7.09 ± 0.19 | 12.93 ± 0.04 | |
| RoTTA [36] | AETTA | 14.33 ± 0.14 | 14.97 ± 0.22 | 14.49 ± 0.10 | 8.62 ± 0.48 | 7.53 ± 0.33 | 14.33 ± 0.27 | 13.02 ± 0.16 | 11.06 ± 0.16 | 12.36 ± 0.13 | 17.18 ± 0.13 | 16.82 ± 0.13 | 8.27 ± 0.27 | 15.24 ± 0.05 | 32.03 ± 0.07 | 22.07 ± 0.11 | 14.82 ± 0.01 |
| SrcValid | 28.39 ± 0.39 | 25.90 ± 0.41 | 28.46 ± 0.79 | 9.76 ± 2.10 | 7.02 ± 0.68 | 21.34 ± 2.88 | 12.78 ± 1.76 | 18.59 ± 0.86 | 6.08 ± 0.71 | 18.38 ± 0.76 | 12.63 ± 0.92 | 22.00 ± 0.98 | 13.36 ± 1.19 | 9.43 ± 0.81 | 5.84 ± 0.67 | 16.00 ± 0.33 | |
| SoftmaxScore [7] | 19.01 ± 0.14 | 20.58 ± 0.17 | 19.52 ± 0.27 | 16.57 ± 0.42 | 17.93 ± 0.07 | 24.41 ± 0.09 | 27.95 ± 0.15 | 26.76 ± 0.28 | 23.75 ± 0.09 | 30.23 ± 0.10 | 30.71 ± 0.14 | 6.66 ± 0.36 | 30.04 ± 0.14 | 30.52 ± 0.09 | 29.35 ± 0.21 | 23.60 ± 0.07 | |
| GDE [21] | 62.46 ± 0.16 | 60.09 ± 0.20 | 62.04 ± 0.18 | 64.31 ± 0.25 | 63.47 ± 0.16 | 53.92 ± 0.34 | 48.60 ± 0.35 | 50.02 ± 0.29 | 54.63 ± 0.18 | 42.15 ± 0.15 | 35.24 ± 0.17 | 64.78 ± 0.07 | 43.55 ± 0.18 | 40.82 ± 0.15 | 45.04 ± 0.07 | 52.74 ± 0.02 | |
| AdvPerturb [23] | 27.73 ± 0.10 | 29.55 ± 0.21 | 28.38 ± 0.31 | 12.10 ± 0.29 | 17.45 ± 0.17 | 24.33 ± 0.18 | 23.11 ± 0.23 | 30.31 ± 0.26 | 17.63 ± 0.08 | 36.11 ± 0.08 | 5.52 ± 0.12 | 21.22 ± 0.32 | 31.03 ± 0.08 | 26.34 ± 0.10 | 12.61 ± 0.06 | 22.90 ± 0.02 | |
| SoTTA [12] | AETTA | 17.92 ± 0.25 | 18.73 ± 0.95 | 16.32 ± 2.09 | 14.69 ± 1.33 | 7.64 ± 0.29 | 18.94 ± 0.59 | 17.21 ± 0.54 | 16.92 ± 0.51 | 14.49 ± 0.37 | 20.84 ± 0.02 | 18.54 ± 0.44 | 12.70 ± 1.06 | 20.46 ± 0.39 | 25.44 ± 0.42 | 20.13 ± 0.17 | 17.40 ± 0.26 |
| TTA Method | Acc. Estimation | Gau. | Shot | Imp. | Def. | Gla. | Mot. | Zoom | Snow | Fro. | Fog | Brit. | Cont. | Elas. | Pix. | JPEG | Avg.() |
| SrcValid | 24.85 ± 0.83 | 17.83 ± 1.52 | 22.28 ± 0.17 | 8.89 ± 1.17 | 19.20 ± 3.28 | 8.62 ± 3.45 | 7.16 ± 2.71 | 9.00 ± 3.73 | 8.13 ± 2.54 | 7.34 ± 2.32 | 4.44 ± 0.57 | 6.28 ± 1.89 | 7.70 ± 3.52 | 5.22 ± 1.67 | 5.68 ± 2.27 | 10.84 ± 1.83 | |
| SoftmaxScore [7] | 8.40 ± 0.10 | 12.84 ± 2.07 | 24.30 ± 4.53 | 20.45 ± 7.09 | 38.03 ± 11.59 | 37.45 ± 14.78 | 37.21 ± 16.96 | 42.53 ± 19.10 | 45.88 ± 18.10 | 49.95 ± 15.87 | 49.10 ± 14.58 | 56.89 ± 12.63 | 62.16 ± 13.50 | 63.30 ± 12.88 | 68.01 ± 12.02 | 41.10 ± 11.66 | |
| GDE [21] | 25.29 ± 0.67 | 22.33 ± 1.77 | 33.67 ± 4.42 | 25.64 ± 6.92 | 45.16 ± 10.64 | 41.70 ± 13.71 | 40.88 ± 16.32 | 46.23 ± 18.18 | 49.25 ± 16.91 | 52.99 ± 14.83 | 51.55 ± 13.76 | 59.15 ± 12.01 | 65.02 ± 12.36 | 65.40 ± 11.94 | 70.16 ± 11.23 | 46.29 ± 10.93 | |
| AdvPerturb [23] | 48.04 ± 2.26 | 44.46 ± 5.59 | 44.82 ± 7.11 | 15.98 ± 7.94 | 10.29 ± 2.90 | 6.10 ± 0.85 | 7.51 ± 4.79 | 4.17 ± 0.50 | 6.54 ± 2.69 | 9.16 ± 3.21 | 2.32 ± 0.35 | 17.84 ± 10.01 | 3.97 ± 0.58 | 8.40 ± 3.06 | 3.74 ± 0.23 | 15.56 ± 1.53 | |
| TENT [34] | AETTA | 4.12 ± 0.45 | 4.02 ± 0.26 | 4.63 ± 0.31 | 8.37 ± 3.30 | 6.92 ± 0.72 | 11.18 ± 4.48 | 10.40 ± 6.13 | 9.48 ± 2.58 | 12.23 ± 5.64 | 11.40 ± 5.47 | 13.30 ± 0.62 | 14.01 ± 5.38 | 14.17 ± 6.47 | 13.96 ± 4.59 | 12.58 ± 5.01 | 10.05 ± 1.69 |
| SrcValid | 18.53 ± 0.43 | 11.25 ± 0.30 | 17.43 ± 1.46 | 7.76 ± 0.72 | 20.95 ± 1.86 | 8.86 ± 0.99 | 7.02 ± 0.97 | 10.91 ± 1.06 | 9.68 ± 1.26 | 7.36 ± 1.45 | 4.34 ± 0.70 | 6.45 ± 0.16 | 16.05 ± 1.85 | 8.15 ± 0.85 | 11.16 ± 2.45 | 11.06 ± 0.11 | |
| SoftmaxScore [7] | 4.75 ± 0.62 | 6.20 ± 1.19 | 15.17 ± 1.79 | 10.01 ± 3.73 | 21.53 ± 3.27 | 18.50 ± 7.97 | 15.43 ± 6.98 | 16.81 ± 4.13 | 17.71 ± 7.04 | 15.33 ± 7.57 | 12.30 ± 5.92 | 14.49 ± 5.54 | 21.08 ± 4.63 | 18.07 ± 6.59 | 23.67 ± 6.32 | 15.40 ± 4.73 | |
| GDE [21] | 22.88 ± 0.72 | 20.96 ± 1.47 | 31.37 ± 2.07 | 21.28 ± 4.63 | 36.43 ± 3.32 | 29.58 ± 8.64 | 25.03 ± 7.81 | 26.76 ± 4.68 | 27.17 ± 7.62 | 23.91 ± 8.61 | 19.29 ± 6.98 | 21.44 ± 6.17 | 31.55 ± 4.68 | 26.22 ± 6.77 | 32.68 ± 5.87 | 26.44 ± 5.16 | |
| AdvPerturb [23] | 50.21 ± 4.36 | 45.51 ± 5.20 | 42.95 ± 5.29 | 23.78 ± 5.30 | 12.43 ± 0.75 | 11.88 ± 4.12 | 16.14 ± 4.75 | 4.38 ± 0.46 | 12.59 ± 3.26 | 9.28 ± 2.72 | 2.47 ± 0.07 | 44.14 ± 6.38 | 4.71 ± 0.28 | 28.64 ± 6.81 | 4.84 ± 0.67 | 20.93 ± 2.83 | |
| EATA [28] | AETTA | 3.86 ± 0.28 | 3.98 ± 0.12 | 5.96 ± 1.90 | 5.97 ± 2.48 | 9.89 ± 1.84 | 10.47 ± 6.25 | 8.03 ± 5.24 | 7.47 ± 3.19 | 7.79 ± 5.72 | 7.02 ± 4.80 | 5.59 ± 3.33 | 6.80 ± 3.37 | 6.69 ± 3.13 | 7.13 ± 4.33 | 10.22 ± 4.52 | 7.13 ± 3.33 |
| SrcValid | 32.05 ± 1.03 | 30.47 ± 0.76 | 37.42 ± 0.42 | 12.20 ± 0.20 | 33.88 ± 0.52 | 13.69 ± 0.12 | 12.62 ± 0.36 | 18.37 ± 0.36 | 19.73 ± 0.52 | 14.61 ± 0.57 | 9.26 ± 0.24 | 13.12 ± 0.43 | 23.28 ± 0.20 | 20.67 ± 0.02 | 28.03 ± 0.53 | 21.29 ± 0.26 | |
| SoftmaxScore [7] | 4.21 ± 0.33 | 4.04 ± 0.20 | 5.54 ± 0.53 | 6.28 ± 0.32 | 4.91 ± 0.14 | 5.93 ± 0.25 | 6.49 ± 0.52 | 4.85 ± 0.27 | 4.86 ± 0.29 | 5.80 ± 0.59 | 7.11 ± 0.48 | 5.34 ± 0.30 | 4.26 ± 0.24 | 4.55 ± 0.09 | 3.94 ± 0.11 | 5.21 ± 0.22 | |
| GDE [21] | 31.88 ± 1.08 | 30.35 ± 0.80 | 37.25 ± 0.49 | 12.19 ± 0.20 | 33.80 ± 0.52 | 13.68 ± 0.13 | 12.62 ± 0.36 | 18.37 ± 0.36 | 19.73 ± 0.52 | 14.61 ± 0.57 | 9.26 ± 0.24 | 13.12 ± 0.43 | 23.28 ± 0.20 | 20.67 ± 0.02 | 28.01 ± 0.52 | 21.25 ± 0.27 | |
| AdvPerturb [23] | 42.25 ± 2.34 | 37.75 ± 2.91 | 38.40 ± 4.24 | 30.55 ± 3.11 | 9.77 ± 1.93 | 18.20 ± 1.52 | 21.66 ± 2.37 | 4.60 ± 0.60 | 14.48 ± 2.98 | 11.73 ± 0.52 | 2.71 ± 0.14 | 52.81 ± 2.08 | 4.92 ± 0.04 | 31.36 ± 0.89 | 6.98 ± 0.45 | 21.88 ± 0.93 | |
| SAR [29] | AETTA | 4.91 ± 0.84 | 5.14 ± 0.85 | 4.77 ± 0.15 | 2.91 ± 0.14 | 5.45 ± 0.50 | 3.08 ± 0.06 | 3.18 ± 0.21 | 3.55 ± 0.37 | 3.65 ± 0.17 | 3.25 ± 0.34 | 2.81 ± 0.06 | 3.58 ± 0.61 | 3.87 ± 0.15 | 3.69 ± 0.43 | 4.48 ± 0.23 | 3.89 ± 0.06 |
| SrcValid | 23.70 ± 0.75 | 21.71 ± 0.16 | 28.09 ± 0.28 | 12.26 ± 0.05 | 28.88 ± 0.55 | 13.78 ± 0.09 | 12.46 ± 0.35 | 17.09 ± 0.59 | 17.19 ± 0.48 | 15.34 ± 0.36 | 9.18 ± 0.14 | 16.33 ± 0.42 | 21.34 ± 0.68 | 16.88 ± 0.25 | 20.29 ± 0.38 | 18.30 ± 0.25 | |
| SoftmaxScore [7] | 16.82 ± 0.51 | 16.82 ± 0.61 | 16.38 ± 0.27 | 8.79 ± 0.51 | 13.43 ± 0.32 | 9.90 ± 0.53 | 10.29 ± 0.48 | 12.04 ± 0.84 | 14.12 ± 0.52 | 10.76 ± 0.50 | 10.49 ± 0.65 | 9.82 ± 0.61 | 13.90 ± 0.44 | 15.08 ± 0.74 | 15.73 ± 0.81 | 12.96 ± 0.37 | |
| GDE [21] | 15.65 ± 0.77 | 14.46 ± 0.13 | 19.48 ± 0.59 | 11.93 ± 0.06 | 21.35 ± 0.41 | 13.05 ± 0.12 | 12.00 ± 0.21 | 14.71 ± 0.35 | 13.73 ± 0.30 | 14.20 ± 0.32 | 9.14 ± 0.13 | 14.62 ± 0.20 | 16.83 ± 0.33 | 13.66 ± 0.33 | 15.56 ± 0.37 | 14.69 ± 0.15 | |
| AdvPerturb [23] | 16.79 ± 0.32 | 15.00 ± 0.78 | 19.37 ± 3.92 | 31.13 ± 3.19 | 7.05 ± 0.41 | 20.30 ± 2.25 | 23.01 ± 2.44 | 5.86 ± 0.42 | 11.50 ± 1.57 | 16.32 ± 1.37 | 2.55 ± 0.09 | 53.39 ± 1.32 | 13.96 ± 1.62 | 23.41 ± 1.77 | 7.14 ± 0.62 | 17.79 ± 0.74 | |
| CoTTA [35] | AETTA | 15.34 ± 1.06 | 13.13 ± 1.39 | 12.06 ± 0.89 | 3.15 ± 0.12 | 5.08 ± 0.30 | 3.29 ± 0.04 | 3.18 ± 0.30 | 3.45 ± 0.05 | 3.92 ± 0.27 | 3.51 ± 0.21 | 2.75 ± 0.02 | 5.01 ± 0.15 | 4.15 ± 0.21 | 4.18 ± 0.37 | 5.06 ± 0.57 | 5.82 ± 0.30 |
| SrcValid | 27.12 ± 7.07 | 26.34 ± 6.79 | 9.26 ± 2.75 | 7.15 ± 1.06 | 24.37 ± 0.72 | 5.96 ± 0.94 | 4.82 ± 1.05 | 4.60 ± 0.29 | 17.57 ± 1.70 | 4.44 ± 0.77 | 4.69 ± 0.63 | 21.73 ± 4.14 | 16.11 ± 0.21 | 8.78 ± 0.75 | 17.58 ± 0.24 | 13.37 ± 0.89 | |
| SoftmaxScore [7] | 4.68 ± 0.46 | 5.10 ± 0.20 | 5.00 ± 0.09 | 11.86 ± 0.78 | 8.45 ± 0.59 | 13.92 ± 1.06 | 15.37 ± 0.84 | 14.95 ± 0.47 | 15.51 ± 0.36 | 16.15 ± 0.63 | 15.69 ± 0.45 | 15.48 ± 0.47 | 15.65 ± 0.13 | 15.52 ± 0.31 | 15.31 ± 0.30 | 12.57 ± 0.43 | |
| GDE [21] | 32.94 ± 0.75 | 27.97 ± 1.10 | 33.95 ± 0.74 | 13.61 ± 0.39 | 28.49 ± 0.73 | 11.81 ± 0.16 | 9.71 ± 0.21 | 13.20 ± 0.20 | 12.86 ± 0.46 | 11.37 ± 0.26 | 7.00 ± 0.28 | 11.11 ± 0.41 | 16.67 ± 0.31 | 13.76 ± 0.19 | 18.09 ± 0.36 | 17.50 ± 0.30 | |
| AdvPerturb [23] | 40.38 ± 2.57 | 39.03 ± 3.20 | 40.39 ± 3.88 | 29.63 ± 2.87 | 13.44 ± 2.20 | 18.72 ± 1.44 | 23.67 ± 3.12 | 6.03 ± 0.60 | 17.61 ± 3.15 | 13.01 ± 0.57 | 2.73 ± 0.09 | 53.28 ± 0.74 | 4.84 ± 0.13 | 36.60 ± 1.21 | 4.90 ± 0.44 | 22.95 ± 0.82 | |
| RoTTA [36] | AETTA | 13.47 ± 5.78 | 12.40 ± 5.05 | 10.05 ± 3.52 | 3.69 ± 0.21 | 5.45 ± 0.92 | 3.39 ± 0.15 | 3.24 ± 0.16 | 3.67 ± 0.69 | 3.90 ± 0.61 | 3.75 ± 0.44 | 2.77 ± 0.03 | 3.37 ± 0.36 | 4.00 ± 0.14 | 3.48 ± 0.22 | 3.73 ± 0.35 | 5.36 ± 1.22 |
| SrcValid | 11.98 ± 4.00 | 5.70 ± 1.02 | 9.03 ± 3.17 | 6.60 ± 2.08 | 21.16 ± 1.40 | 6.41 ± 0.73 | 3.82 ± 0.36 | 9.00 ± 1.38 | 5.61 ± 0.97 | 5.74 ± 0.40 | 3.94 ± 0.35 | 15.30 ± 2.22 | 15.65 ± 0.40 | 5.94 ± 0.52 | 15.07 ± 0.88 | 9.40 ± 0.85 | |
| SoftmaxScore [7] | 4.10 ± 0.13 | 4.13 ± 0.63 | 3.96 ± 0.62 | 4.79 ± 0.18 | 5.39 ± 1.27 | 3.72 ± 0.26 | 4.37 ± 0.89 | 3.67 ± 0.24 | 3.55 ± 0.36 | 4.41 ± 0.53 | 4.39 ± 0.81 | 6.63 ± 0.32 | 3.88 ± 0.22 | 4.35 ± 0.22 | 4.15 ± 0.57 | 4.37 ± 0.09 | |
| GDE [21] | 23.46 ± 0.77 | 17.63 ± 0.94 | 24.00 ± 0.97 | 14.12 ± 1.41 | 26.42 ± 1.21 | 15.42 ± 0.99 | 11.27 ± 0.58 | 15.05 ± 0.48 | 14.27 ± 0.48 | 13.33 ± 0.37 | 8.85 ± 0.15 | 15.49 ± 1.19 | 19.61 ± 1.30 | 15.91 ± 1.09 | 20.61 ± 1.00 | 17.03 ± 0.70 | |
| AdvPerturb [23] | 47.94 ± 3.36 | 47.49 ± 4.59 | 50.19 ± 5.41 | 26.66 ± 1.29 | 16.53 ± 1.72 | 15.64 ± 0.97 | 21.76 ± 2.19 | 4.96 ± 0.25 | 15.67 ± 3.26 | 10.46 ± 0.47 | 2.61 ± 0.19 | 48.72 ± 0.34 | 4.51 ± 0.34 | 35.66 ± 0.51 | 5.64 ± 0.52 | 23.63 ± 0.78 | |
| SoTTA [12] | AETTA | 7.91 ± 1.16 | 5.83 ± 0.56 | 5.76 ± 0.77 | 3.27 ± 0.06 | 4.58 ± 0.11 | 3.57 ± 0.19 | 3.28 ± 0.17 | 3.49 ± 0.10 | 3.66 ± 0.08 | 3.79 ± 0.13 | 2.94 ± 0.02 | 3.81 ± 0.21 | 4.20 ± 0.01 | 4.07 ± 0.07 | 3.87 ± 0.02 | 4.27 ± 0.12 |
| TTA Method | Acc. Estimation | Gau. | Shot | Imp. | Def. | Gla. | Mot. | Zoom | Snow | Fro. | Fog | Brit. | Cont. | Elas. | Pix. | JPEG | Avg.() |
| SrcValid | 46.38 ± 1.17 | 32.85 ± 3.59 | 28.45 ± 3.99 | 12.51 ± 0.84 | 16.92 ± 2.40 | 5.75 ± 0.60 | 3.84 ± 0.73 | 3.88 ± 1.45 | 2.77 ± 0.87 | 2.32 ± 0.35 | 2.12 ± 0.20 | 2.00 ± 0.13 | 1.87 ± 0.15 | 1.73 ± 0.30 | 1.65 ± 0.26 | 11.00 ± 0.58 | |
| SoftmaxScore [7] | 13.70 ± 0.41 | 5.34 ± 0.21 | 13.91 ± 0.58 | 21.16 ± 0.94 | 38.51 ± 1.59 | 50.42 ± 4.50 | 59.40 ± 6.35 | 70.82 ± 5.52 | 78.56 ± 3.43 | 82.11 ± 1.88 | 84.99 ± 1.14 | 89.52 ± 0.24 | 87.46 ± 1.72 | 88.87 ± 1.65 | 89.56 ± 0.63 | 58.29 ± 1.82 | |
| GDE [21] | 49.21 ± 0.79 | 48.12 ± 0.60 | 60.77 ± 0.20 | 56.99 ± 1.30 | 74.34 ± 1.15 | 77.88 ± 4.24 | 82.28 ± 5.11 | 90.14 ± 3.30 | 93.71 ± 1.63 | 95.33 ± 0.77 | 95.86 ± 0.45 | 96.93 ± 0.43 | 96.88 ± 0.62 | 97.25 ± 0.75 | 97.31 ± 0.82 | 80.87 ± 1.29 | |
| AdvPerturb [23] | 36.92 ± 1.76 | 36.25 ± 0.61 | 29.26 ± 1.31 | 13.91 ± 0.54 | 8.56 ± 2.77 | 3.79 ± 0.85 | 3.68 ± 1.01 | 3.08 ± 0.81 | 3.96 ± 2.12 | 2.58 ± 0.56 | 1.47 ± 0.13 | 2.10 ± 0.28 | 2.26 ± 1.07 | 2.46 ± 0.66 | 1.53 ± 0.06 | 10.12 ± 0.24 | |
| TENT [34] | AETTA | 6.55 ± 0.59 | 7.40 ± 0.10 | 7.52 ± 0.54 | 13.45 ± 0.40 | 6.30 ± 0.56 | 6.87 ± 0.81 | 8.36 ± 1.09 | 8.09 ± 2.80 | 5.08 ± 1.37 | 3.84 ± 0.58 | 3.53 ± 0.33 | 2.97 ± 0.32 | 2.73 ± 0.35 | 2.54 ± 0.51 | 2.51 ± 0.42 | 5.85 ± 0.36 |
| SrcValid | 7.65 ± 0.94 | 1.97 ± 0.17 | 1.59 ± 0.33 | 1.47 ± 0.43 | 1.24 ± 0.22 | 1.36 ± 0.26 | 1.31 ± 0.23 | 1.22 ± 0.20 | 1.07 ± 0.10 | 1.01 ± 0.08 | 0.94 ± 0.04 | 0.98 ± 0.11 | 1.13 ± 0.20 | 1.11 ± 0.11 | 1.09 ± 0.10 | 1.68 ± 0.18 | |
| SoftmaxScore [7] | 36.65 ± 1.55 | 64.29 ± 1.84 | 70.97 ± 1.45 | 75.02 ± 1.73 | 77.61 ± 1.85 | 78.47 ± 2.34 | 78.46 ± 0.61 | 79.04 ± 0.36 | 82.42 ± 0.71 | 81.35 ± 0.18 | 84.35 ± 0.31 | 89.83 ± 0.75 | 82.75 ± 0.91 | 83.33 ± 1.63 | 84.09 ± 1.09 | 76.58 ± 0.71 | |
| GDE [21] | 83.95 ± 1.83 | 94.00 ± 0.88 | 94.99 ± 0.74 | 94.52 ± 0.94 | 95.15 ± 0.50 | 94.73 ± 1.31 | 94.57 ± 1.16 | 93.63 ± 1.11 | 95.31 ± 1.51 | 95.46 ± 0.38 | 95.31 ± 0.51 | 94.60 ± 1.34 | 94.55 ± 0.70 | 94.51 ± 0.48 | 94.81 ± 1.49 | 94.01 ± 0.43 | |
| AdvPerturb [23] | 9.32 ± 0.83 | 4.85 ± 1.55 | 2.07 ± 0.54 | 1.55 ± 0.70 | 1.41 ± 0.20 | 1.31 ± 0.43 | 1.22 ± 0.16 | 1.21 ± 0.52 | 0.88 ± 0.36 | 0.89 ± 0.27 | 0.52 ± 0.07 | 1.08 ± 0.57 | 0.98 ± 0.25 | 1.27 ± 0.22 | 0.93 ± 0.14 | 1.97 ± 0.33 | |
| EATA [28] | AETTA | 18.86 ± 2.19 | 7.14 ± 2.67 | 2.59 ± 0.40 | 4.21 ± 3.24 | 3.33 ± 2.13 | 2.64 ± 1.35 | 2.03 ± 0.25 | 1.90 ± 0.14 | 1.78 ± 0.06 | 1.74 ± 0.06 | 1.97 ± 0.34 | 8.42 ± 10.00 | 2.10 ± 0.09 | 1.92 ± 0.10 | 2.04 ± 0.48 | 4.18 ± 0.82 |
| SrcValid | 53.44 ± 0.56 | 44.48 ± 0.19 | 50.08 ± 0.66 | 32.15 ± 0.18 | 47.60 ± 0.38 | 33.57 ± 0.57 | 30.57 ± 0.27 | 38.18 ± 0.81 | 36.38 ± 0.46 | 35.00 ± 0.48 | 27.36 ± 0.32 | 29.30 ± 0.55 | 39.09 ± 0.36 | 33.58 ± 0.22 | 42.22 ± 0.34 | 38.20 ± 0.22 | |
| SoftmaxScore [7] | 20.82 ± 0.65 | 23.48 ± 0.20 | 20.68 ± 0.05 | 25.76 ± 0.19 | 21.30 ± 0.50 | 24.92 ± 0.54 | 26.40 ± 0.30 | 23.71 ± 0.68 | 23.90 ± 0.26 | 25.12 ± 0.32 | 26.21 ± 0.19 | 25.49 ± 0.24 | 24.85 ± 0.45 | 25.13 ± 0.06 | 22.95 ± 0.60 | 24.05 ± 0.29 | |
| GDE [21] | 53.09 ± 0.53 | 44.65 ± 0.17 | 51.31 ± 0.41 | 33.64 ± 0.17 | 48.74 ± 0.41 | 34.68 ± 0.61 | 31.44 ± 0.31 | 39.11 ± 0.72 | 37.62 ± 0.29 | 36.45 ± 0.28 | 28.86 ± 0.08 | 30.48 ± 0.33 | 40.06 ± 0.27 | 34.55 ± 0.24 | 43.42 ± 0.28 | 39.21 ± 0.22 | |
| AdvPerturb [23] | 35.15 ± 1.78 | 42.48 ± 1.22 | 40.57 ± 0.60 | 29.46 ± 0.65 | 28.50 ± 1.19 | 16.57 ± 0.38 | 23.68 ± 0.46 | 8.75 ± 0.68 | 25.17 ± 0.46 | 18.91 ± 0.75 | 4.57 ± 0.42 | 49.75 ± 0.52 | 5.52 ± 0.24 | 38.29 ± 2.90 | 6.54 ± 0.50 | 24.93 ± 0.57 | |
| SAR [29] | AETTA | 5.75 ± 0.45 | 5.35 ± 0.22 | 6.31 ± 0.08 | 6.59 ± 0.22 | 9.11 ± 0.29 | 7.66 ± 0.31 | 6.16 ± 0.37 | 8.37 ± 0.47 | 7.06 ± 0.21 | 6.12 ± 0.09 | 5.78 ± 0.30 | 5.65 ± 0.01 | 6.32 ± 0.36 | 5.90 ± 0.35 | 7.93 ± 0.15 | 6.67 ± 0.12 |
| SrcValid | 53.11 ± 0.39 | 51.92 ± 0.46 | 57.00 ± 0.31 | 36.42 ± 0.36 | 54.13 ± 0.72 | 39.30 ± 0.46 | 38.28 ± 0.42 | 46.48 ± 0.48 | 46.81 ± 0.58 | 47.73 ± 0.89 | 33.94 ± 0.43 | 44.55 ± 1.25 | 49.18 ± 0.38 | 42.97 ± 0.08 | 49.48 ± 0.27 | 46.09 ± 0.38 | |
| SoftmaxScore [7] | 34.06 ± 0.49 | 34.58 ± 0.52 | 32.05 ± 0.53 | 33.14 ± 0.76 | 31.92 ± 0.80 | 34.68 ± 0.79 | 35.83 ± 0.82 | 36.94 ± 1.04 | 37.46 ± 0.85 | 36.13 ± 0.91 | 36.94 ± 1.03 | 40.90 ± 0.70 | 38.04 ± 0.86 | 42.67 ± 0.64 | 38.70 ± 0.68 | 36.27 ± 0.68 | |
| GDE [21] | 36.44 ± 0.63 | 36.25 ± 0.17 | 39.37 ± 0.40 | 31.48 ± 0.46 | 40.05 ± 0.54 | 32.73 ± 0.55 | 32.12 ± 0.19 | 34.87 ± 0.38 | 35.40 ± 0.79 | 36.28 ± 0.78 | 31.54 ± 0.36 | 37.31 ± 0.43 | 36.98 ± 0.26 | 32.82 ± 0.43 | 37.87 ± 0.69 | 35.43 ± 0.30 | |
| AdvPerturb [23] | 26.80 ± 0.88 | 26.08 ± 0.93 | 27.02 ± 0.54 | 32.75 ± 0.77 | 11.69 ± 0.89 | 23.72 ± 1.09 | 26.36 ± 0.40 | 5.63 ± 0.17 | 9.87 ± 0.12 | 27.10 ± 0.57 | 4.87 ± 0.27 | 44.56 ± 1.41 | 7.57 ± 0.44 | 14.56 ± 1.39 | 5.74 ± 0.25 | 19.62 ± 0.15 | |
| CoTTA [35] | AETTA | 9.24 ± 0.38 | 8.52 ± 0.55 | 6.75 ± 0.35 | 5.20 ± 0.13 | 5.06 ± 0.25 | 5.54 ± 0.16 | 5.70 ± 0.29 | 5.49 ± 0.31 | 5.88 ± 0.33 | 6.71 ± 0.59 | 7.38 ± 0.10 | 9.70 ± 0.72 | 6.33 ± 0.14 | 5.14 ± 0.27 | 5.66 ± 0.45 | 6.55 ± 0.17 |
| SrcValid | 28.06 ± 2.60 | 29.86 ± 2.79 | 13.52 ± 1.12 | 22.72 ± 0.61 | 18.32 ± 1.73 | 12.14 ± 0.85 | 5.78 ± 0.25 | 8.58 ± 0.39 | 23.32 ± 0.81 | 10.68 ± 2.60 | 6.52 ± 1.30 | 25.88 ± 4.11 | 33.45 ± 0.64 | 13.98 ± 3.80 | 38.61 ± 0.73 | 19.43 ± 1.17 | |
| SoftmaxScore [7] | 18.70 ± 0.62 | 21.28 ± 0.40 | 19.45 ± 0.34 | 28.25 ± 0.20 | 22.90 ± 0.62 | 29.05 ± 0.26 | 31.75 ± 0.27 | 28.49 ± 0.44 | 29.37 ± 0.19 | 30.03 ± 0.28 | 31.39 ± 0.69 | 28.52 ± 0.44 | 30.99 ± 0.70 | 29.72 ± 0.36 | 28.03 ± 0.41 | 27.19 ± 0.12 | |
| GDE [21] | 59.99 ± 1.07 | 57.35 ± 0.80 | 61.31 ± 0.96 | 36.40 ± 0.92 | 53.91 ± 0.73 | 34.73 ± 0.63 | 31.10 ± 0.63 | 39.01 ± 0.31 | 37.56 ± 0.48 | 37.15 ± 0.45 | 26.90 ± 0.24 | 33.56 ± 0.20 | 38.31 ± 0.64 | 34.69 ± 0.46 | 43.29 ± 0.95 | 41.68 ± 0.45 | |
| AdvPerturb [23] | 25.47 ± 1.49 | 28.60 ± 0.91 | 27.71 ± 0.81 | 26.38 ± 0.74 | 22.80 ± 1.70 | 15.78 ± 0.72 | 23.44 ± 0.96 | 8.93 ± 0.85 | 24.12 ± 0.74 | 16.68 ± 0.95 | 4.56 ± 0.43 | 44.85 ± 0.74 | 5.96 ± 0.33 | 36.17 ± 3.16 | 6.18 ± 0.16 | 21.18 ± 0.71 | |
| RoTTA [36] | AETTA | 6.37 ± 1.21 | 7.00 ± 0.80 | 4.77 ± 0.44 | 6.20 ± 0.32 | 6.54 ± 0.45 | 5.69 ± 0.27 | 4.89 ± 0.24 | 6.59 ± 0.15 | 4.83 ± 0.55 | 5.52 ± 0.25 | 4.78 ± 0.26 | 7.60 ± 0.80 | 5.40 ± 0.16 | 4.92 ± 0.69 | 6.84 ± 0.76 | 5.86 ± 0.10 |
| SrcValid | 13.43 ± 2.25 | 8.45 ± 1.26 | 9.32 ± 2.50 | 14.85 ± 2.02 | 23.51 ± 3.62 | 9.03 ± 1.89 | 6.22 ± 1.14 | 26.37 ± 2.50 | 10.83 ± 3.76 | 8.66 ± 1.84 | 20.27 ± 0.21 | 35.17 ± 2.57 | 29.05 ± 3.38 | 14.48 ± 4.68 | 33.72 ± 0.71 | 17.56 ± 1.57 | |
| SoftmaxScore [7] | 21.66 ± 0.49 | 22.56 ± 0.75 | 18.88 ± 0.55 | 21.70 ± 0.73 | 18.70 ± 1.01 | 22.58 ± 0.47 | 24.48 ± 0.34 | 21.62 ± 0.61 | 22.08 ± 0.10 | 22.18 ± 0.08 | 23.67 ± 0.48 | 21.86 ± 0.55 | 22.45 ± 0.65 | 22.42 ± 0.63 | 21.45 ± 0.49 | 21.89 ± 0.35 | |
| GDE [21] | 41.62 ± 0.27 | 37.46 ± 0.91 | 46.03 ± 0.18 | 33.39 ± 0.87 | 44.99 ± 1.03 | 32.05 ± 0.66 | 28.16 ± 0.28 | 35.19 ± 0.80 | 33.80 ± 0.28 | 32.74 ± 0.13 | 26.34 ± 0.48 | 29.23 ± 0.80 | 37.40 ± 0.78 | 31.99 ± 1.11 | 38.42 ± 0.57 | 35.25 ± 0.27 | |
| AdvPerturb [23] | 41.39 ± 1.33 | 45.03 ± 0.81 | 40.28 ± 1.21 | 25.84 ± 0.41 | 26.78 ± 1.90 | 16.58 ± 0.85 | 23.72 ± 0.36 | 9.68 ± 0.69 | 24.71 ± 0.74 | 19.14 ± 0.83 | 4.52 ± 0.20 | 47.12 ± 1.27 | 5.70 ± 0.02 | 37.97 ± 2.21 | 8.41 ± 0.72 | 25.12 ± 0.39 | |
| SoTTA [12] | AETTA | 8.11 ± 0.91 | 7.19 ± 0.44 | 7.34 ± 0.79 | 4.99 ± 0.31 | 4.97 ± 0.25 | 4.30 ± 0.19 | 4.33 ± 0.14 | 4.86 ± 0.24 | 4.90 ± 0.34 | 5.23 ± 0.46 | 4.24 ± 0.19 | 5.20 ± 0.32 | 4.61 ± 0.10 | 5.01 ± 0.27 | 4.58 ± 0.13 | 5.32 ± 0.18 |
| TTA Method | Acc. Estimation | Gau. | Shot | Imp. | Def. | Gla. | Mot. | Zoom | Snow | Fro. | Fog | Brit. | Cont. | Elas. | Pix. | JPEG | Avg.() |
| SrcValid | 53.54 ± 1.08 | 48.82 ± 1.21 | 47.13 ± 1.16 | 48.84 ± 1.07 | 44.94 ± 1.16 | 34.83 ± 1.25 | 26.16 ± 1.18 | 32.41 ± 1.21 | 31.80 ± 1.02 | 21.17 ± 1.05 | 8.93 ± 0.73 | 43.25 ± 0.72 | 20.57 ± 0.66 | 17.02 ± 0.49 | 20.10 ± 0.27 | 33.30 ± 0.93 | |
| SoftmaxScore [7] | 11.11 ± 0.14 | 13.76 ± 0.03 | 14.42 ± 0.09 | 11.60 ± 0.01 | 13.15 ± 0.12 | 19.04 ± 0.18 | 24.78 ± 0.06 | 19.82 ± 0.06 | 19.35 ± 0.11 | 26.70 ± 0.07 | 28.68 ± 0.08 | 9.97 ± 0.05 | 25.38 ± 0.09 | 26.50 ± 0.13 | 25.86 ± 0.07 | 19.34 ± 0.02 | |
| GDE [21] | 85.03 ± 0.14 | 80.80 ± 0.02 | 79.82 ± 0.06 | 82.06 ± 0.02 | 79.46 ± 0.13 | 70.43 ± 0.17 | 61.92 ± 0.06 | 68.34 ± 0.08 | 68.10 ± 0.10 | 57.45 ± 0.07 | 44.38 ± 0.07 | 79.03 ± 0.07 | 57.35 ± 0.07 | 53.54 ± 0.08 | 56.74 ± 0.08 | 68.30 ± 0.01 | |
| AdvPerturb [23] | 13.38 ± 0.12 | 16.92 ± 0.07 | 18.51 ± 0.08 | 5.92 ± 0.07 | 9.30 ± 0.16 | 15.03 ± 0.20 | 14.79 ± 0.06 | 18.37 ± 0.09 | 12.01 ± 0.04 | 26.75 ± 0.06 | 5.86 ± 0.09 | 17.02 ± 0.05 | 21.98 ± 0.12 | 18.40 ± 0.10 | 8.03 ± 0.09 | 14.82 ± 0.02 | |
| TENT [34] | AETTA | 4.88 ± 0.10 | 4.53 ± 0.06 | 5.19 ± 0.22 | 8.64 ± 0.11 | 5.99 ± 0.06 | 5.60 ± 0.25 | 4.74 ± 0.16 | 5.75 ± 0.20 | 4.81 ± 0.07 | 6.50 ± 0.13 | 5.62 ± 0.12 | 6.85 ± 0.13 | 5.43 ± 0.19 | 5.27 ± 0.12 | 5.12 ± 0.15 | 5.66 ± 0.05 |
| SrcValid | 50.34 ± 1.01 | 48.73 ± 0.91 | 49.54 ± 0.80 | 51.63 ± 0.70 | 50.92 ± 0.57 | 39.99 ± 0.75 | 30.20 ± 1.06 | 34.05 ± 0.72 | 36.29 ± 0.93 | 23.21 ± 0.69 | 9.74 ± 0.59 | 49.05 ± 0.79 | 25.37 ± 0.63 | 20.56 ± 0.80 | 26.64 ± 0.92 | 36.42 ± 0.76 | |
| SoftmaxScore [7] | 12.31 ± 0.08 | 12.95 ± 0.12 | 12.55 ± 0.06 | 10.51 ± 0.20 | 10.60 ± 0.07 | 19.20 ± 0.17 | 26.02 ± 0.02 | 22.11 ± 0.06 | 20.15 ± 0.11 | 29.26 ± 0.11 | 31.42 ± 0.05 | 11.22 ± 0.46 | 27.09 ± 0.14 | 29.88 ± 0.08 | 27.14 ± 0.07 | 20.16 ± 0.05 | |
| GDE [21] | 81.21 ± 0.16 | 80.02 ± 0.13 | 80.73 ± 0.07 | 76.16 ± 0.24 | 77.51 ± 0.44 | 69.92 ± 0.12 | 61.37 ± 0.06 | 65.81 ± 0.11 | 68.10 ± 0.07 | 54.61 ± 0.10 | 41.10 ± 0.05 | 74.94 ± 0.60 | 57.03 ± 0.17 | 51.96 ± 0.08 | 58.28 ± 0.06 | 66.58 ± 0.03 | |
| AdvPerturb [23] | 15.44 ± 0.07 | 16.25 ± 0.13 | 15.88 ± 0.10 | 5.13 ± 0.06 | 6.00 ± 0.03 | 13.33 ± 0.14 | 13.52 ± 0.19 | 19.48 ± 0.04 | 10.13 ± 0.08 | 28.15 ± 0.04 | 6.26 ± 0.18 | 15.43 ± 0.63 | 20.22 ± 0.19 | 20.08 ± 0.17 | 6.95 ± 0.11 | 14.15 ± 0.06 | |
| EATA [28] | AETTA | 5.28 ± 0.12 | 4.75 ± 0.05 | 5.43 ± 0.05 | 7.19 ± 0.11 | 4.93 ± 0.06 | 4.28 ± 0.10 | 5.39 ± 0.18 | 4.53 ± 0.09 | 5.01 ± 0.06 | 11.19 ± 0.08 | 10.40 ± 0.13 | 4.79 ± 0.20 | 8.85 ± 0.21 | 10.46 ± 0.22 | 8.41 ± 0.07 | 6.73 ± 0.03 |
| SrcValid | 39.53 ± 1.22 | 26.07 ± 1.15 | 24.30 ± 1.02 | 33.06 ± 0.50 | 26.55 ± 1.30 | 23.04 ± 0.42 | 18.50 ± 0.11 | 24.48 ± 0.14 | 24.45 ± 0.62 | 15.04 ± 0.55 | 6.99 ± 0.44 | 32.56 ± 0.97 | 14.51 ± 1.34 | 11.73 ± 0.83 | 13.62 ± 0.68 | 22.30 ± 0.55 | |
| SoftmaxScore [7] | 18.07 ± 0.26 | 22.21 ± 0.25 | 21.62 ± 0.20 | 13.92 ± 0.16 | 16.91 ± 0.29 | 19.36 ± 0.28 | 23.96 ± 0.21 | 20.32 ± 0.16 | 20.23 ± 0.08 | 27.65 ± 0.07 | 29.54 ± 0.02 | 11.81 ± 0.70 | 26.78 ± 0.17 | 28.10 ± 0.06 | 28.13 ± 0.07 | 21.91 ± 0.16 | |
| GDE [21] | 75.10 ± 0.28 | 67.51 ± 0.30 | 68.29 ± 0.23 | 77.94 ± 0.10 | 73.27 ± 0.31 | 69.21 ± 0.32 | 62.70 ± 0.22 | 67.53 ± 0.16 | 66.89 ± 0.10 | 55.50 ± 0.09 | 45.27 ± 0.05 | 73.24 ± 0.29 | 56.67 ± 0.16 | 51.98 ± 0.09 | 54.24 ± 0.09 | 64.36 ± 0.15 | |
| AdvPerturb [23] | 22.95 ± 0.27 | 30.05 ± 0.34 | 30.19 ± 0.24 | 7.97 ± 0.03 | 16.05 ± 0.38 | 17.26 ± 0.23 | 16.44 ± 0.14 | 20.51 ± 0.21 | 14.11 ± 0.12 | 28.50 ± 0.04 | 5.37 ± 0.20 | 22.67 ± 0.25 | 24.31 ± 0.11 | 20.91 ± 0.10 | 10.33 ± 0.17 | 19.17 ± 0.14 | |
| SAR [29] | AETTA | 5.38 ± 0.27 | 4.83 ± 0.05 | 4.67 ± 0.12 | 13.98 ± 0.07 | 9.91 ± 0.30 | 9.50 ± 0.15 | 6.54 ± 0.15 | 7.50 ± 0.05 | 5.88 ± 0.14 | 5.58 ± 0.11 | 4.96 ± 0.02 | 6.59 ± 0.11 | 4.97 ± 0.01 | 5.01 ± 0.06 | 4.94 ± 0.02 | 6.68 ± 0.04 |
| SrcValid | 55.20 ± 0.50 | 54.08 ± 0.55 | 54.85 ± 0.50 | 56.48 ± 0.54 | 55.35 ± 0.61 | 45.25 ± 0.55 | 34.90 ± 0.55 | 39.10 ± 0.60 | 40.10 ± 0.57 | 27.96 ± 0.51 | 10.73 ± 0.40 | 56.36 ± 0.45 | 29.61 ± 0.71 | 24.28 ± 0.56 | 31.70 ± 0.66 | 41.06 ± 0.54 | |
| SoftmaxScore [7] | 9.92 ± 0.07 | 10.66 ± 0.11 | 10.25 ± 0.03 | 8.45 ± 0.02 | 9.39 ± 0.03 | 17.61 ± 0.12 | 25.68 ± 0.05 | 21.49 ± 0.12 | 20.60 ± 0.10 | 30.40 ± 0.06 | 35.08 ± 0.08 | 7.74 ± 0.18 | 28.08 ± 0.08 | 31.71 ± 0.09 | 27.43 ± 0.07 | 19.63 ± 0.01 | |
| GDE [21] | 86.92 ± 0.11 | 85.84 ± 0.09 | 86.59 ± 0.05 | 88.22 ± 0.10 | 87.15 ± 0.11 | 77.00 ± 0.10 | 66.67 ± 0.08 | 70.86 ± 0.17 | 71.83 ± 0.17 | 59.67 ± 0.13 | 42.25 ± 0.07 | 88.09 ± 0.04 | 61.51 ± 0.10 | 56.11 ± 0.10 | 63.50 ± 0.14 | 72.81 ± 0.07 | |
| AdvPerturb [23] | 11.72 ± 0.07 | 12.20 ± 0.09 | 11.85 ± 0.03 | 3.88 ± 0.15 | 4.36 ± 0.10 | 9.61 ± 0.09 | 9.48 ± 0.11 | 15.52 ± 0.17 | 7.89 ± 0.14 | 24.08 ± 0.08 | 6.72 ± 0.21 | 9.07 ± 0.17 | 15.97 ± 0.09 | 17.59 ± 0.15 | 5.98 ± 0.33 | 11.06 ± 0.02 | |
| CoTTA [35] | AETTA | 4.75 ± 0.07 | 4.01 ± 0.03 | 4.80 ± 0.07 | 7.44 ± 0.20 | 5.06 ± 0.22 | 4.66 ± 0.06 | 4.51 ± 0.13 | 4.42 ± 0.03 | 4.24 ± 0.08 | 8.98 ± 0.13 | 8.83 ± 0.09 | 6.46 ± 0.44 | 6.96 ± 0.07 | 8.36 ± 0.24 | 6.26 ± 0.19 | 5.98 ± 0.04 |
| SrcValid | 15.32 ± 0.10 | 18.63 ± 0.24 | 21.33 ± 0.24 | 7.87 ± 0.64 | 4.26 ± 0.10 | 4.70 ± 0.33 | 9.33 ± 0.78 | 7.02 ± 0.35 | 4.60 ± 0.14 | 7.37 ± 0.56 | 5.56 ± 0.51 | 19.87 ± 3.35 | 5.95 ± 0.65 | 5.32 ± 0.25 | 6.34 ± 0.60 | 9.56 ± 0.26 | |
| SoftmaxScore [7] | 11.98 ± 0.07 | 16.57 ± 0.16 | 17.30 ± 0.14 | 13.34 ± 0.22 | 16.79 ± 0.35 | 17.72 ± 0.39 | 20.62 ± 0.14 | 17.70 ± 0.17 | 17.19 ± 0.08 | 18.56 ± 0.23 | 26.66 ± 0.07 | 7.63 ± 1.41 | 21.56 ± 0.24 | 20.65 ± 0.15 | 19.14 ± 0.11 | 17.56 ± 0.08 | |
| GDE [21] | 80.31 ± 0.05 | 75.64 ± 0.34 | 75.58 ± 0.12 | 78.75 ± 0.45 | 75.50 ± 0.41 | 73.86 ± 0.52 | 70.37 ± 0.27 | 73.65 ± 0.16 | 73.73 ± 0.24 | 73.21 ± 0.33 | 60.84 ± 0.08 | 85.80 ± 2.29 | 68.56 ± 0.12 | 69.35 ± 0.37 | 71.30 ± 0.26 | 73.76 ± 0.22 | |
| AdvPerturb [23] | 13.96 ± 0.07 | 18.59 ± 0.21 | 20.19 ± 0.19 | 6.39 ± 0.09 | 12.37 ± 0.49 | 10.70 ± 0.43 | 9.35 ± 0.04 | 12.77 ± 0.09 | 9.00 ± 0.05 | 12.01 ± 0.13 | 4.08 ± 0.04 | 9.25 ± 1.09 | 15.19 ± 0.13 | 7.64 ± 0.24 | 4.28 ± 0.21 | 11.05 ± 0.05 | |
| RoTTA [36] | AETTA | 14.33 ± 0.14 | 12.64 ± 0.40 | 9.38 ± 0.71 | 7.12 ± 0.97 | 5.32 ± 0.83 | 6.73 ± 0.13 | 9.97 ± 0.43 | 14.78 ± 0.30 | 13.99 ± 0.19 | 10.84 ± 0.07 | 12.30 ± 0.07 | 11.51 ± 2.42 | 11.92 ± 0.35 | 11.48 ± 1.03 | 15.47 ± 0.56 | 11.19 ± 0.12 |
| SrcValid | 28.39 ± 0.39 | 24.64 ± 2.41 | 21.33 ± 2.05 | 11.91 ± 0.91 | 6.16 ± 0.22 | 12.34 ± 1.06 | 7.23 ± 1.43 | 14.57 ± 1.82 | 8.24 ± 0.60 | 19.17 ± 0.97 | 9.67 ± 0.83 | 23.36 ± 1.46 | 11.31 ± 0.68 | 9.89 ± 0.84 | 5.92 ± 0.43 | 14.28 ± 0.28 | |
| SoftmaxScore [7] | 19.01 ± 0.14 | 20.35 ± 0.14 | 19.30 ± 0.32 | 10.82 ± 0.52 | 10.91 ± 1.19 | 11.64 ± 2.29 | 19.47 ± 1.35 | 20.00 ± 0.74 | 19.98 ± 0.16 | 27.16 ± 0.13 | 28.53 ± 0.16 | 6.86 ± 0.57 | 25.73 ± 0.50 | 27.97 ± 0.24 | 27.39 ± 0.25 | 19.67 ± 0.50 | |
| GDE [21] | 62.46 ± 0.16 | 58.40 ± 0.17 | 59.83 ± 0.27 | 68.57 ± 0.46 | 67.82 ± 1.14 | 65.51 ± 2.04 | 56.52 ± 1.44 | 56.27 ± 0.64 | 57.53 ± 0.16 | 44.74 ± 0.34 | 38.05 ± 0.20 | 63.36 ± 0.63 | 48.33 ± 0.37 | 43.13 ± 0.26 | 45.89 ± 0.28 | 55.76 ± 0.45 | |
| AdvPerturb [23] | 27.73 ± 0.10 | 31.55 ± 0.15 | 30.82 ± 0.31 | 9.56 ± 0.42 | 14.54 ± 0.85 | 14.59 ± 1.72 | 17.39 ± 0.85 | 24.67 ± 0.45 | 16.20 ± 0.32 | 33.31 ± 0.21 | 5.19 ± 0.08 | 23.24 ± 0.93 | 27.07 ± 0.24 | 24.12 ± 0.30 | 12.45 ± 0.09 | 20.83 ± 0.39 | |
| SoTTA [12] | AETTA | 17.92 ± 0.25 | 16.51 ± 0.62 | 18.41 ± 0.09 | 20.63 ± 0.51 | 16.50 ± 0.53 | 18.76 ± 4.82 | 16.27 ± 4.31 | 18.90 ± 1.16 | 19.99 ± 1.58 | 25.06 ± 1.90 | 21.37 ± 1.10 | 19.28 ± 1.51 | 17.33 ± 1.16 | 23.02 ± 1.12 | 18.30 ± 0.88 | 19.22 ± 0.79 |
| Gau. | Shot | Imp. | Def. | Gla. | Mot. | Zoom | Snow | Fro. | Fog | Brit. | Cont. | Elas. | Pix. | JPEG | Avg.() | ||
| Episodic [37] | -10.41 ± 0.85 | -10.27 ± 0.40 | -4.58 ± 0.93 | 22.41 ± 1.13 | 14.47 ± 0.72 | 38.62 ± 2.00 | 44.44 ± 2.82 | 41.68 ± 2.66 | 44.55 ± 3.61 | 51.44 ± 2.92 | 62.95 ± 1.48 | 61.34 ± 1.23 | 50.74 ± 1.07 | 53.72 ± 0.45 | 42.53 ± 0.57 | 33.58 ± 1.04 | |
| MRS [29] | 0.00 ± 0.00 | 0.00 ± 0.00 | 0.00 ± 0.00 | 0.00 ± 0.00 | 0.00 ± 0.00 | 0.00 ± 0.00 | 0.00 ± 0.00 | 20.38 ± 18.28 | 44.40 ± 13.41 | 53.45 ± 1.36 | 59.25 ± 1.04 | 58.27 ± 3.48 | 44.38 ± 3.80 | 46.87 ± 5.07 | 34.81 ± 6.96 | 24.12 ± 2.11 | |
| Stochastic [35] | -0.48 ± 0.48 | 2.40 ± 0.63 | 6.59 ± 0.56 | 20.81 ± 1.10 | 19.07 ± 1.31 | 37.15 ± 1.75 | 44.49 ± 2.82 | 43.04 ± 1.88 | 46.81 ± 2.67 | 51.22 ± 1.81 | 61.12 ± 1.34 | 59.45 ± 0.53 | 48.60 ± 1.16 | 53.83 ± 1.09 | 44.89 ± 1.82 | 35.93 ± 0.78 | |
| FisherStochastic [3] | 0.45 ± 0.59 | 4.13 ± 0.91 | 7.91 ± 0.88 | 23.24 ± 0.83 | 21.79 ± 0.45 | 41.00 ± 1.72 | 47.98 ± 2.94 | 47.45 ± 3.31 | 51.60 ± 3.74 | 57.52 ± 3.38 | 65.52 ± 1.51 | 66.03 ± 0.45 | 55.12 ± 1.64 | 61.53 ± 0.59 | 52.85 ± 0.45 | 40.27 ± 1.29 | |
| DistShift | 0.00 ± 0.00 | 0.52 ± 0.73 | 5.11 ± 0.08 | 23.92 ± 0.83 | 20.31 ± 0.73 | 40.73 ± 2.29 | 47.28 ± 2.44 | 46.85 ± 3.02 | 49.87 ± 3.51 | 56.18 ± 2.86 | 65.19 ± 1.73 | 63.53 ± 1.44 | 53.79 ± 1.10 | 60.17 ± 0.53 | 50.53 ± 0.41 | 38.93 ± 1.15 | |
| TENT [34] | AETTA | -3.27 ± 0.91 | -1.57 ± 0.76 | 1.50 ± 0.45 | 23.05 ± 0.89 | 17.29 ± 1.24 | 39.66 ± 2.39 | 46.02 ± 2.71 | 44.59 ± 2.61 | 46.55 ± 3.93 | 54.21 ± 2.72 | 63.87 ± 1.58 | 62.71 ± 1.21 | 52.67 ± 0.81 | 56.91 ± 1.16 | 47.67 ± 1.46 | 36.79 ± 1.20 |
| Episodic [37] | 28.27 ± 2.76 | 37.60 ± 1.31 | 31.76 ± 0.81 | 63.90 ± 0.48 | 40.46 ± 0.52 | 61.49 ± 1.03 | 63.09 ± 0.42 | 52.08 ± 0.59 | 52.18 ± 0.62 | 56.85 ± 0.84 | 66.88 ± 0.36 | 63.27 ± 0.17 | 52.45 ± 0.56 | 55.18 ± 0.54 | 43.79 ± 0.46 | 51.28 ± 0.52 | |
| MRS [29] | 0.00 ± 0.00 | 0.00 ± 0.00 | 0.00 ± 0.00 | 0.00 ± 0.00 | 0.00 ± 0.00 | 0.00 ± 0.00 | 0.00 ± 0.00 | 0.00 ± 0.00 | 0.00 ± 0.00 | 0.00 ± 0.00 | 0.00 ± 0.00 | 0.00 ± 0.00 | 0.00 ± 0.00 | 0.00 ± 0.00 | 0.00 ± 0.00 | 0.00 ± 0.00 | |
| Stochastic [35] | 1.28 ± 0.79 | -0.43 ± 1.00 | 0.01 ± 1.27 | -0.03 ± 0.76 | -0.06 ± 0.75 | -0.74 ± 0.46 | 0.03 ± 0.34 | -0.20 ± 0.80 | 0.35 ± 0.70 | 0.16 ± 0.77 | 0.14 ± 0.89 | 0.10 ± 0.66 | -0.21 ± 0.31 | -0.21 ± 0.49 | -0.29 ± 0.06 | -0.01 ± 0.47 | |
| FisherStochastic [3] | 1.27 ± 1.08 | 0.16 ± 1.79 | 0.55 ± 1.53 | -0.09 ± 1.35 | -0.30 ± 1.15 | -0.44 ± 1.27 | -0.14 ± 1.14 | -0.07 ± 1.11 | 0.00 ± 1.27 | 0.11 ± 1.38 | 0.39 ± 1.54 | 0.47 ± 1.13 | 0.06 ± 0.81 | 0.01 ± 1.07 | -0.17 ± 0.62 | 0.12 ± 1.16 | |
| DistShift | 0.00 ± 0.00 | 8.72 ± 1.54 | 5.02 ± 1.00 | 34.33 ± 7.43 | 8.69 ± 1.25 | 30.29 ± 8.46 | 37.89 ± 1.08 | 18.97 ± 1.48 | 16.83 ± 0.86 | 24.31 ± 3.47 | 54.64 ± 4.55 | 43.38 ± 8.46 | 13.47 ± 1.74 | 22.46 ± 3.63 | 13.61 ± 2.30 | 22.17 ± 2.38 | |
| EATA [28] | AETTA | 25.52 ± 2.94 | 35.73 ± 1.87 | 27.52 ± 1.66 | 59.91 ± 2.41 | 32.61 ± 3.46 | 57.93 ± 1.86 | 60.50 ± 0.21 | 50.05 ± 0.52 | 49.48 ± 0.59 | 56.00 ± 0.55 | 64.97 ± 0.95 | 62.84 ± 0.28 | 49.02 ± 0.75 | 54.48 ± 1.30 | 43.01 ± 0.97 | 48.64 ± 0.74 |
| Episodic [37] | -7.28 ± 0.41 | -14.44 ± 0.47 | -14.37 ± 0.37 | -0.14 ± 0.27 | -8.55 ± 0.48 | -1.79 ± 0.11 | -3.65 ± 0.26 | -6.93 ± 0.67 | -8.78 ± 0.34 | -5.24 ± 0.20 | -2.85 ± 0.37 | -4.94 ± 0.27 | -5.93 ± 0.54 | -8.75 ± 0.63 | -11.33 ± 0.51 | -7.00 ± 0.26 | |
| MRS [29] | 0.00 ± 0.00 | 0.00 ± 0.00 | 0.00 ± 0.00 | 0.00 ± 0.00 | 0.00 ± 0.00 | 0.00 ± 0.00 | 0.00 ± 0.00 | 0.00 ± 0.00 | 0.00 ± 0.00 | 0.00 ± 0.00 | 0.00 ± 0.00 | 0.00 ± 0.00 | 0.00 ± 0.00 | 0.00 ± 0.00 | 0.00 ± 0.00 | 0.00 ± 0.00 | |
| Stochastic [35] | -2.16 ± 0.29 | -5.38 ± 0.65 | -4.81 ± 0.57 | 1.07 ± 0.26 | -3.35 ± 0.76 | 0.10 ± 0.50 | -0.77 ± 0.30 | -1.89 ± 1.06 | -3.17 ± 0.82 | -1.22 ± 0.40 | 0.05 ± 0.45 | -1.98 ± 0.21 | -1.26 ± 0.06 | -2.40 ± 0.91 | -2.77 ± 0.92 | -2.00 ± 0.48 | |
| FisherStochastic [3] | -3.68 ± 0.55 | -9.44 ± 0.30 | -9.95 ± 0.22 | 0.84 ± 0.29 | -6.57 ± 0.48 | -0.80 ± 0.28 | -2.69 ± 0.28 | -5.41 ± 0.41 | -7.03 ± 0.28 | -3.79 ± 0.27 | -1.84 ± 0.37 | -3.63 ± 0.14 | -4.48 ± 0.47 | -6.21 ± 0.36 | -8.02 ± 0.59 | -4.85 ± 0.13 | |
| DistShift | 0.00 ± 0.00 | -6.23 ± 0.40 | -7.32 ± 0.23 | 1.20 ± 0.05 | -4.93 ± 0.43 | -0.34 ± 0.27 | -2.05 ± 0.31 | -3.68 ± 0.37 | -5.70 ± 0.31 | -1.99 ± 0.27 | -1.20 ± 0.34 | -2.58 ± 0.19 | -3.51 ± 0.43 | -4.84 ± 0.41 | -5.58 ± 0.38 | -3.25 ± 0.10 | |
| SAR [29] | AETTA | -4.81 ± 0.79 | -10.45 ± 0.79 | -11.13 ± 0.30 | 0.26 ± 0.32 | -7.17 ± 0.81 | -1.19 ± 0.29 | -3.23 ± 0.31 | -6.24 ± 0.67 | -8.02 ± 0.39 | -4.33 ± 0.10 | -2.33 ± 0.33 | -4.51 ± 0.23 | -4.73 ± 0.63 | -7.71 ± 0.90 | -9.28 ± 0.75 | -5.66 ± 0.20 |
| Episodic [37] | 0.04 ± 0.15 | 0.04 ± 0.08 | -0.16 ± 0.10 | 0.11 ± 0.16 | 0.40 ± 0.54 | 0.86 ± 0.14 | 1.09 ± 0.07 | 1.77 ± 0.17 | 2.67 ± 0.42 | 4.14 ± 0.60 | 1.77 ± 0.40 | 3.28 ± 0.47 | 3.55 ± 0.39 | 2.71 ± 0.24 | 2.44 ± 0.24 | 1.65 ± 0.10 | |
| MRS [29] | 0.00 ± 0.00 | 0.00 ± 0.00 | 0.00 ± 0.00 | 0.00 ± 0.00 | 0.00 ± 0.00 | 0.00 ± 0.00 | 0.00 ± 0.00 | 0.00 ± 0.00 | 0.00 ± 0.00 | 0.00 ± 0.00 | 0.00 ± 0.00 | 0.00 ± 0.00 | 0.00 ± 0.00 | 0.00 ± 0.00 | 0.00 ± 0.00 | 0.00 ± 0.00 | |
| Stochastic [35] | 0.00 ± 0.00 | 0.00 ± 0.00 | 0.00 ± 0.00 | 0.00 ± 0.00 | 0.00 ± 0.00 | 0.00 ± 0.00 | 0.00 ± 0.00 | 0.00 ± 0.00 | 0.00 ± 0.00 | 0.00 ± 0.00 | 0.00 ± 0.00 | 0.00 ± 0.00 | 0.00 ± 0.00 | 0.00 ± 0.00 | 0.00 ± 0.00 | 0.00 ± 0.00 | |
| FisherStochastic [3] | 0.00 ± 0.01 | -0.01 ± 0.10 | 0.01 ± 0.06 | 0.08 ± 0.08 | -0.12 ± 0.12 | 0.10 ± 0.12 | 0.06 ± 0.14 | 0.13 ± 0.10 | 0.17 ± 0.18 | 0.25 ± 0.09 | 0.11 ± 0.08 | 0.26 ± 0.11 | 0.16 ± 0.13 | 0.39 ± 0.08 | 0.34 ± 0.08 | 0.13 ± 0.03 | |
| DistShift | 0.00 ± 0.00 | 0.03 ± 0.12 | -0.15 ± 0.11 | 0.06 ± 0.13 | 0.23 ± 0.50 | 0.70 ± 0.14 | 0.94 ± 0.06 | 1.58 ± 0.12 | 2.49 ± 0.40 | 3.75 ± 0.67 | 1.75 ± 0.39 | 3.03 ± 0.53 | 3.33 ± 0.35 | 2.51 ± 0.13 | 2.39 ± 0.34 | 1.51 ± 0.09 | |
| CoTTA [35] | AETTA | 0.04 ± 0.12 | 0.01 ± 0.08 | -0.20 ± 0.10 | 0.10 ± 0.17 | 0.36 ± 0.54 | 0.84 ± 0.11 | 1.08 ± 0.08 | 1.77 ± 0.15 | 2.66 ± 0.40 | 4.12 ± 0.62 | 1.75 ± 0.40 | 3.28 ± 0.50 | 3.57 ± 0.40 | 2.71 ± 0.25 | 2.46 ± 0.25 | 1.64 ± 0.11 |
| Episodic [37] | -24.93 ± 2.06 | -27.94 ± 1.45 | -28.25 ± 1.39 | -25.30 ± 1.05 | -22.52 ± 1.12 | -18.68 ± 0.41 | -25.71 ± 0.90 | -12.13 ± 0.62 | -26.39 ± 0.71 | -19.78 ± 1.40 | -4.26 ± 0.02 | -45.54 ± 0.81 | -9.18 ± 0.69 | -38.08 ± 2.90 | -9.80 ± 0.68 | -22.57 ± 0.85 | |
| MRS [29] | 0.00 ± 0.00 | 0.00 ± 0.00 | 0.00 ± 0.00 | 0.00 ± 0.00 | -1.45 ± 2.50 | -0.71 ± 1.24 | -0.71 ± 1.23 | -1.32 ± 2.29 | -1.61 ± 2.79 | -0.26 ± 0.45 | -1.80 ± 3.24 | -10.03 ± 15.10 | -4.13 ± 6.75 | -3.90 ± 6.62 | -3.60 ± 5.15 | -1.97 ± 2.23 | |
| Stochastic [35] | -0.01 ± 0.05 | -1.11 ± 0.41 | -1.49 ± 0.48 | -0.80 ± 0.40 | -2.59 ± 0.80 | -1.11 ± 0.44 | -1.34 ± 0.14 | -3.34 ± 0.16 | -4.90 ± 1.24 | -2.12 ± 0.61 | -1.24 ± 0.42 | -8.43 ± 2.16 | -2.90 ± 0.73 | -3.71 ± 1.02 | -3.13 ± 0.14 | -2.55 ± 0.49 | |
| FisherStochastic [3] | 0.06 ± 0.02 | -0.53 ± 0.20 | -1.09 ± 0.08 | -0.43 ± 0.17 | -1.67 ± 0.10 | -0.79 ± 0.19 | -0.92 ± 0.26 | -2.74 ± 0.30 | -4.86 ± 0.49 | -1.10 ± 0.59 | -1.30 ± 0.58 | -14.10 ± 3.20 | -5.25 ± 1.02 | -4.39 ± 0.55 | -4.26 ± 0.17 | -2.89 ± 0.13 | |
| DistShift | 0.00 ± 0.00 | -3.39 ± 0.63 | -4.32 ± 0.33 | 2.12 ± 0.80 | -3.61 ± 0.31 | -1.38 ± 0.26 | -4.71 ± 0.45 | -7.69 ± 0.11 | -16.56 ± 0.46 | -4.50 ± 0.68 | -5.47 ± 0.53 | -34.53 ± 2.13 | -7.52 ± 1.34 | -11.48 ± 0.46 | -11.39 ± 0.32 | -7.63 ± 0.23 | |
| RoTTA [36] | AETTA | -1.65 ± 1.34 | -4.18 ± 0.72 | -21.72 ± 11.69 | -0.19 ± 1.08 | -4.32 ± 0.81 | -2.65 ± 0.86 | -4.63 ± 1.03 | -4.04 ± 0.70 | -7.17 ± 0.41 | -4.57 ± 0.57 | -0.09 ± 0.23 | -9.63 ± 1.20 | -4.96 ± 0.95 | -13.39 ± 0.64 | -7.30 ± 0.71 | -6.03 ± 0.89 |
| Episodic [37] | -41.21 ± 1.71 | -45.52 ± 0.96 | -41.25 ± 0.82 | -26.70 ± 0.44 | -28.23 ± 1.84 | -18.73 ± 0.68 | -26.11 ± 0.25 | -13.13 ± 0.53 | -27.12 ± 0.69 | -21.52 ± 0.24 | -2.35 ± 0.35 | -47.36 ± 1.01 | -7.10 ± 0.90 | -37.60 ± 2.26 | -12.16 ± 0.42 | -26.40 ± 0.51 | |
| MRS [29] | 0.00 ± 0.00 | 0.00 ± 0.00 | 0.00 ± 0.00 | 0.00 ± 0.00 | 0.00 ± 0.00 | 0.00 ± 0.00 | 0.00 ± 0.00 | 0.00 ± 0.00 | 0.00 ± 0.00 | 0.00 ± 0.00 | 0.00 ± 0.00 | 0.00 ± 0.00 | 0.00 ± 0.00 | 0.00 ± 0.00 | 0.00 ± 0.00 | 0.00 ± 0.00 | |
| Stochastic [35] | -1.39 ± 0.46 | -1.88 ± 0.81 | -1.05 ± 0.13 | 3.72 ± 0.28 | -1.21 ± 1.64 | 2.05 ± 0.76 | 1.04 ± 0.54 | 0.36 ± 0.96 | -0.15 ± 0.61 | 1.43 ± 1.19 | 1.48 ± 0.34 | 1.35 ± 0.51 | -0.11 ± 0.29 | 0.50 ± 1.04 | -0.83 ± 0.49 | 0.35 ± 0.51 | |
| FisherStochastic [3] | -3.33 ± 1.05 | -5.23 ± 0.91 | -4.51 ± 0.40 | 4.22 ± 0.43 | -4.15 ± 1.61 | 1.65 ± 0.71 | 0.42 ± 1.03 | -1.37 ± 0.24 | -2.01 ± 0.21 | -0.24 ± 0.72 | 1.21 ± 0.84 | -0.55 ± 1.59 | -1.85 ± 0.84 | -1.01 ± 1.07 | -3.73 ± 0.11 | -1.36 ± 0.51 | |
| DistShift | 0.00 ± 0.00 | -4.06 ± 0.34 | -3.60 ± 0.37 | 6.17 ± 0.58 | 0.01 ± 1.65 | 3.94 ± 0.76 | 0.90 ± 0.38 | 1.75 ± 0.13 | -0.92 ± 0.26 | 2.28 ± 0.42 | 2.83 ± 0.66 | 1.94 ± 0.58 | 0.52 ± 0.95 | 0.25 ± 0.82 | -1.87 ± 0.54 | 0.68 ± 0.19 | |
| SoTTA [12] | AETTA | -7.58 ± 1.91 | -10.51 ± 2.83 | -18.71 ± 18.80 | 1.54 ± 0.35 | -5.16 ± 1.00 | 0.43 ± 1.14 | -2.90 ± 1.49 | -2.25 ± 1.29 | -6.29 ± 0.51 | -2.56 ± 0.85 | 0.88 ± 0.32 | -8.40 ± 0.60 | -1.87 ± 0.78 | -4.69 ± 0.23 | -6.53 ± 0.75 | -4.97 ± 1.58 |