Percolation without trapping: how Ostwald ripening during two-phase displacement in porous media alters capillary pressure and relative permeability
Abstract
Conventional measurements of gas-liquid flow in subsurface gas storage and recovery do not allow for Ostwald ripening, significantly over-estimating the amount of trapping and hysteresis. When there is transport of dissolved species, local capillary equilibrium is achieved, and two-phase displacement in porous media needs to be modelled as percolation without trapping. A pore network model is used to demonstrate how to scale trapped saturation, capillary pressure and relative permeability to account for Ostwald ripening.
Since the seminal work of Wilkinson & Willemnsen [1] and Lernomand et al. [2], immiscible multiphase flow in porous media has been described as a percolation-like process, including trapping when one phase is completely surrounded by another. However, in many natural and engineered settings, including subsurface gas storage and recovery, water table movement and transport through gas diffusion layers in electrolysers and fuel cells, there is also transport of dissolved components leading to Ostwald ripening [3]. In equilibrium of both capillary forces and dissolved concentration, the correct model of displacement is percolation without trapping. Nonetheless, phases can still be trapped. Most experimental measurements are conducted out of equilibrium, and are not representative of slow subsurface flow where equilibrium can be reached. We demonstrate how to correct the residual (trapped) saturations, capillary pressures and relative permeabilities, including the effect of hysteresis, to account for Ostwald ripening.
Consider two fluid phases in the pore space, a denser phase, labelled 1, and a less dense phase, 2. The capillary pressure, , is imposed by setting the pressures in each phase: for infinitesimal flow rates, where the phases are connected to the inlet or outlet, the capillary pressure is constant. The pore space can be conceptualized as a network of wide regions, pores, connected by restrictions, called throats [4]. Let us assume that phase 1 is wetting and phase 2 non-wetting. Drainage, the displacement of a wetting phase by a non-wetting phase during which the capillary pressure increases, is invasion percolation, where the non-wetting phase fills the largest throat that is available for filling through a connected pathway of non-wetting phase from the inlet [1]. The adjacent pore, being larger than the throat, is also filled. If it is assumed that there are connected wetting layer in roughness and corners in the pore space, the wetting phase is not trapped. The reverse process, imbibition, is displacement of the non-wetting phase by a wetting phase as the capillary pressure decreases. This is an ordinary percolation process since the wetting phase has access to the whole pore space through wetting layers [5]: the wetting phase occupies throats in order of size, from the smallest upwards, by snap-off [6]. However, once the non-wetting phase is completely surrounded by the wetting phase, it is trapped, and hence imbibition is percolation with trapping. When a cluster of the non-wetting phase is trapped, it assumes a local capillary pressure that may be different from the prevailing capillary pressure imposed on the continuous phases [7]. While there are additional subtleties, including complex filling dynamics and Haines jumps in drainage [8, 9], intermittency [10], and cooperative pore filling in imbibition [2, 5], this model of quasi-static displacement has remained unchallenged for 40 years. With an accurate representation of the pore-space geometry, and including the percolation-like processes mentioned above in a pore network model, qualitative predictions of the multiphase flow properties, capillary pressure and relative permeability, can be made (see, for instance, [11, 12]).
If the two fluids are not completely immiscible, for instance if phase 2 is a gas (air, natural gas, carbon dioxide or hydrogen), displacement is also accompanied by mass transport of dissolved species through phase 1 (usually water, but can be oil in the presence of carbon dioxide or natural gas). This facilitates Ostwald ripening, where diffusive transport in the aqueous phase acts to make the local capillary pressure uniform [13, 14, 15, 16]. Ostwald ripening in porous media has been studied experimentally, theoretically and numerically: it leads to rearrangement of the phases in the pore space with an overall trend of increasing connectivity [17, 18]. The time-scales to see significant changes in pore occupancy are days to months at the centimetre-scale at which measurements of averaged properties are usually made [19].
If we consider slow displacement, what is the correct equilibrium model if Ostwald ripening leads to a constant capillary pressure, even for disconnected phases? Ostwald ripening ensures that locally the capillary pressure is uniform, even in disconnected clusters. Consider the displacement of phase 2 by phase 1 where the capillary pressure decreases. A cluster of phase 2 is first trapped when it is completely surrounded by phase 1, and its capillary pressure is the value imposed on the connected phases. As displacement proceeds, and the capillary pressure drops, the capillary pressure in the trapped cluster is now higher than in the connected phases. If we allow Ostwald ripening, this means, from Henry’s law, that the concentration of dissolved gas adjacent to the cluster is slightly higher than next to the connected phase, creating a concentration gradient. If we allow sufficient time for mass transport by diffusion, material from the trapped cluster will dissolve and be transferred to the connected phase 2. Now imagine a displacement event possible at the prevailing capillary pressure, but which occurs in a trapped cluster that would be forbidden in a conventional model with trapping. Ostwald ripening will mean that removal of gas is possible, albeit through diffusion through phase 1, rather than by immiscible displacement. In the end this is simply a percolation-like model where trapping is ignored.
Phase 2 does remain trapped at the end of the displacement. Displacement stops when we can no longer impose a capillary pressure through connected phases: this occurs when all of phase 2 is first disconnected.
The same argument pertains for subsequent injection of phase 2, allowing for the reconnection of previously-trapped clusters. Displacement is possible, without trapping of phase 1, from any cluster containing phase 2, even if it is disconnected. We assume, however, that Ostwald ripening does not allow clusters of phase 2 to nucleate in parts of the pore space occupied by phase 1. When phase 1 is wetting, this has a less significant impact on the behaviour, as phase 1 is not trapped anyway, thanks to layer flow; however, unlike a traditional invasion percolation model, phase 2 can displace phase 1 from a disconnected cluster.
We now explore the consequences of this model on predictions of trapping, capillary pressure and relative permeability using a pore network model that can simulate an arbitrary sequence of displacement both with trapping (the conventional model) and without (considering Ostwald ripening). The input is an unstructured network of pores connected by throats extracted from pore-space images by the maximal ball method [20, 21]. The model, with trapping, is identical in terms of algorithm to previous work [12].
As a base case we simulated displacement through a network derived from a micro-tomography image of Bentheimer sandstone [22] that has been widely used as a benchmark [23]. To explore the sensitivity of our results to pore structure, we also studied networks derived from two images of Estaillades limestone [24, 25], Ketton, an oolithic limestone [26], and a reservoir carbonate sample [27]. In all cases the receding contact angle (measured through phase 1) was zero for drainage and distributed uniformly for imbibition. This value was chosen based on measurements of contact angle during displacement and previous modelling studies [28, 23, 29].
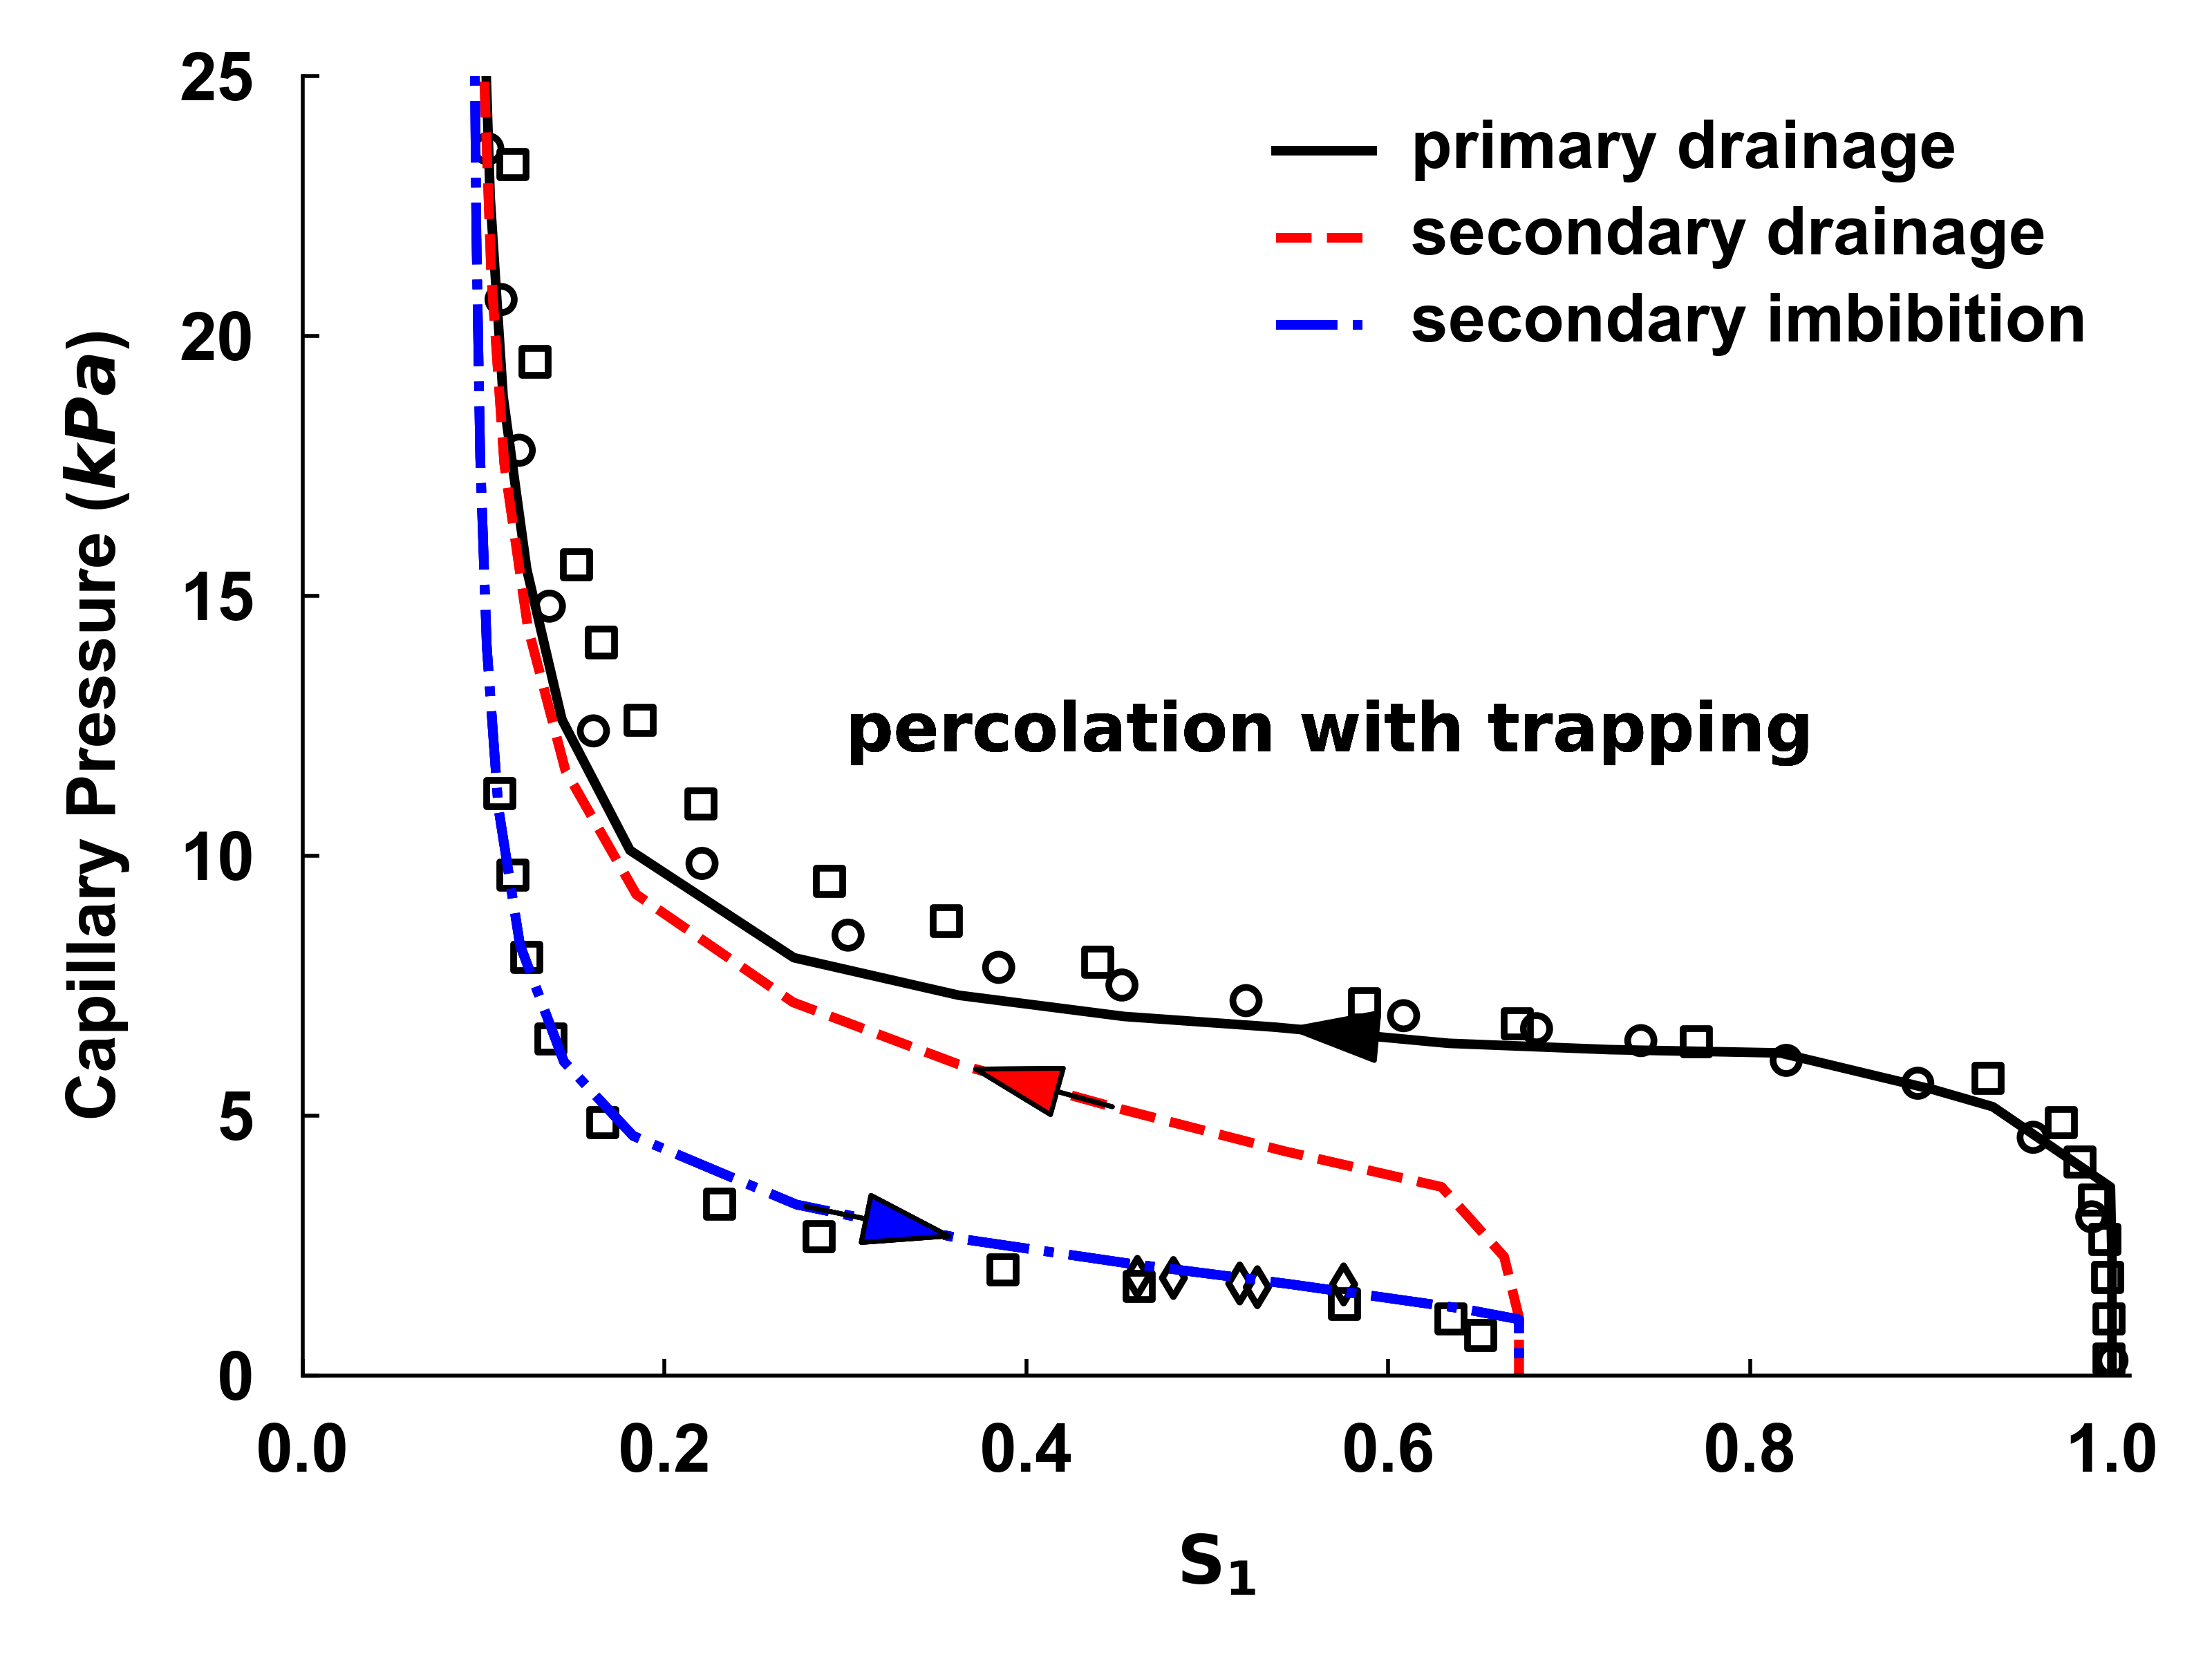
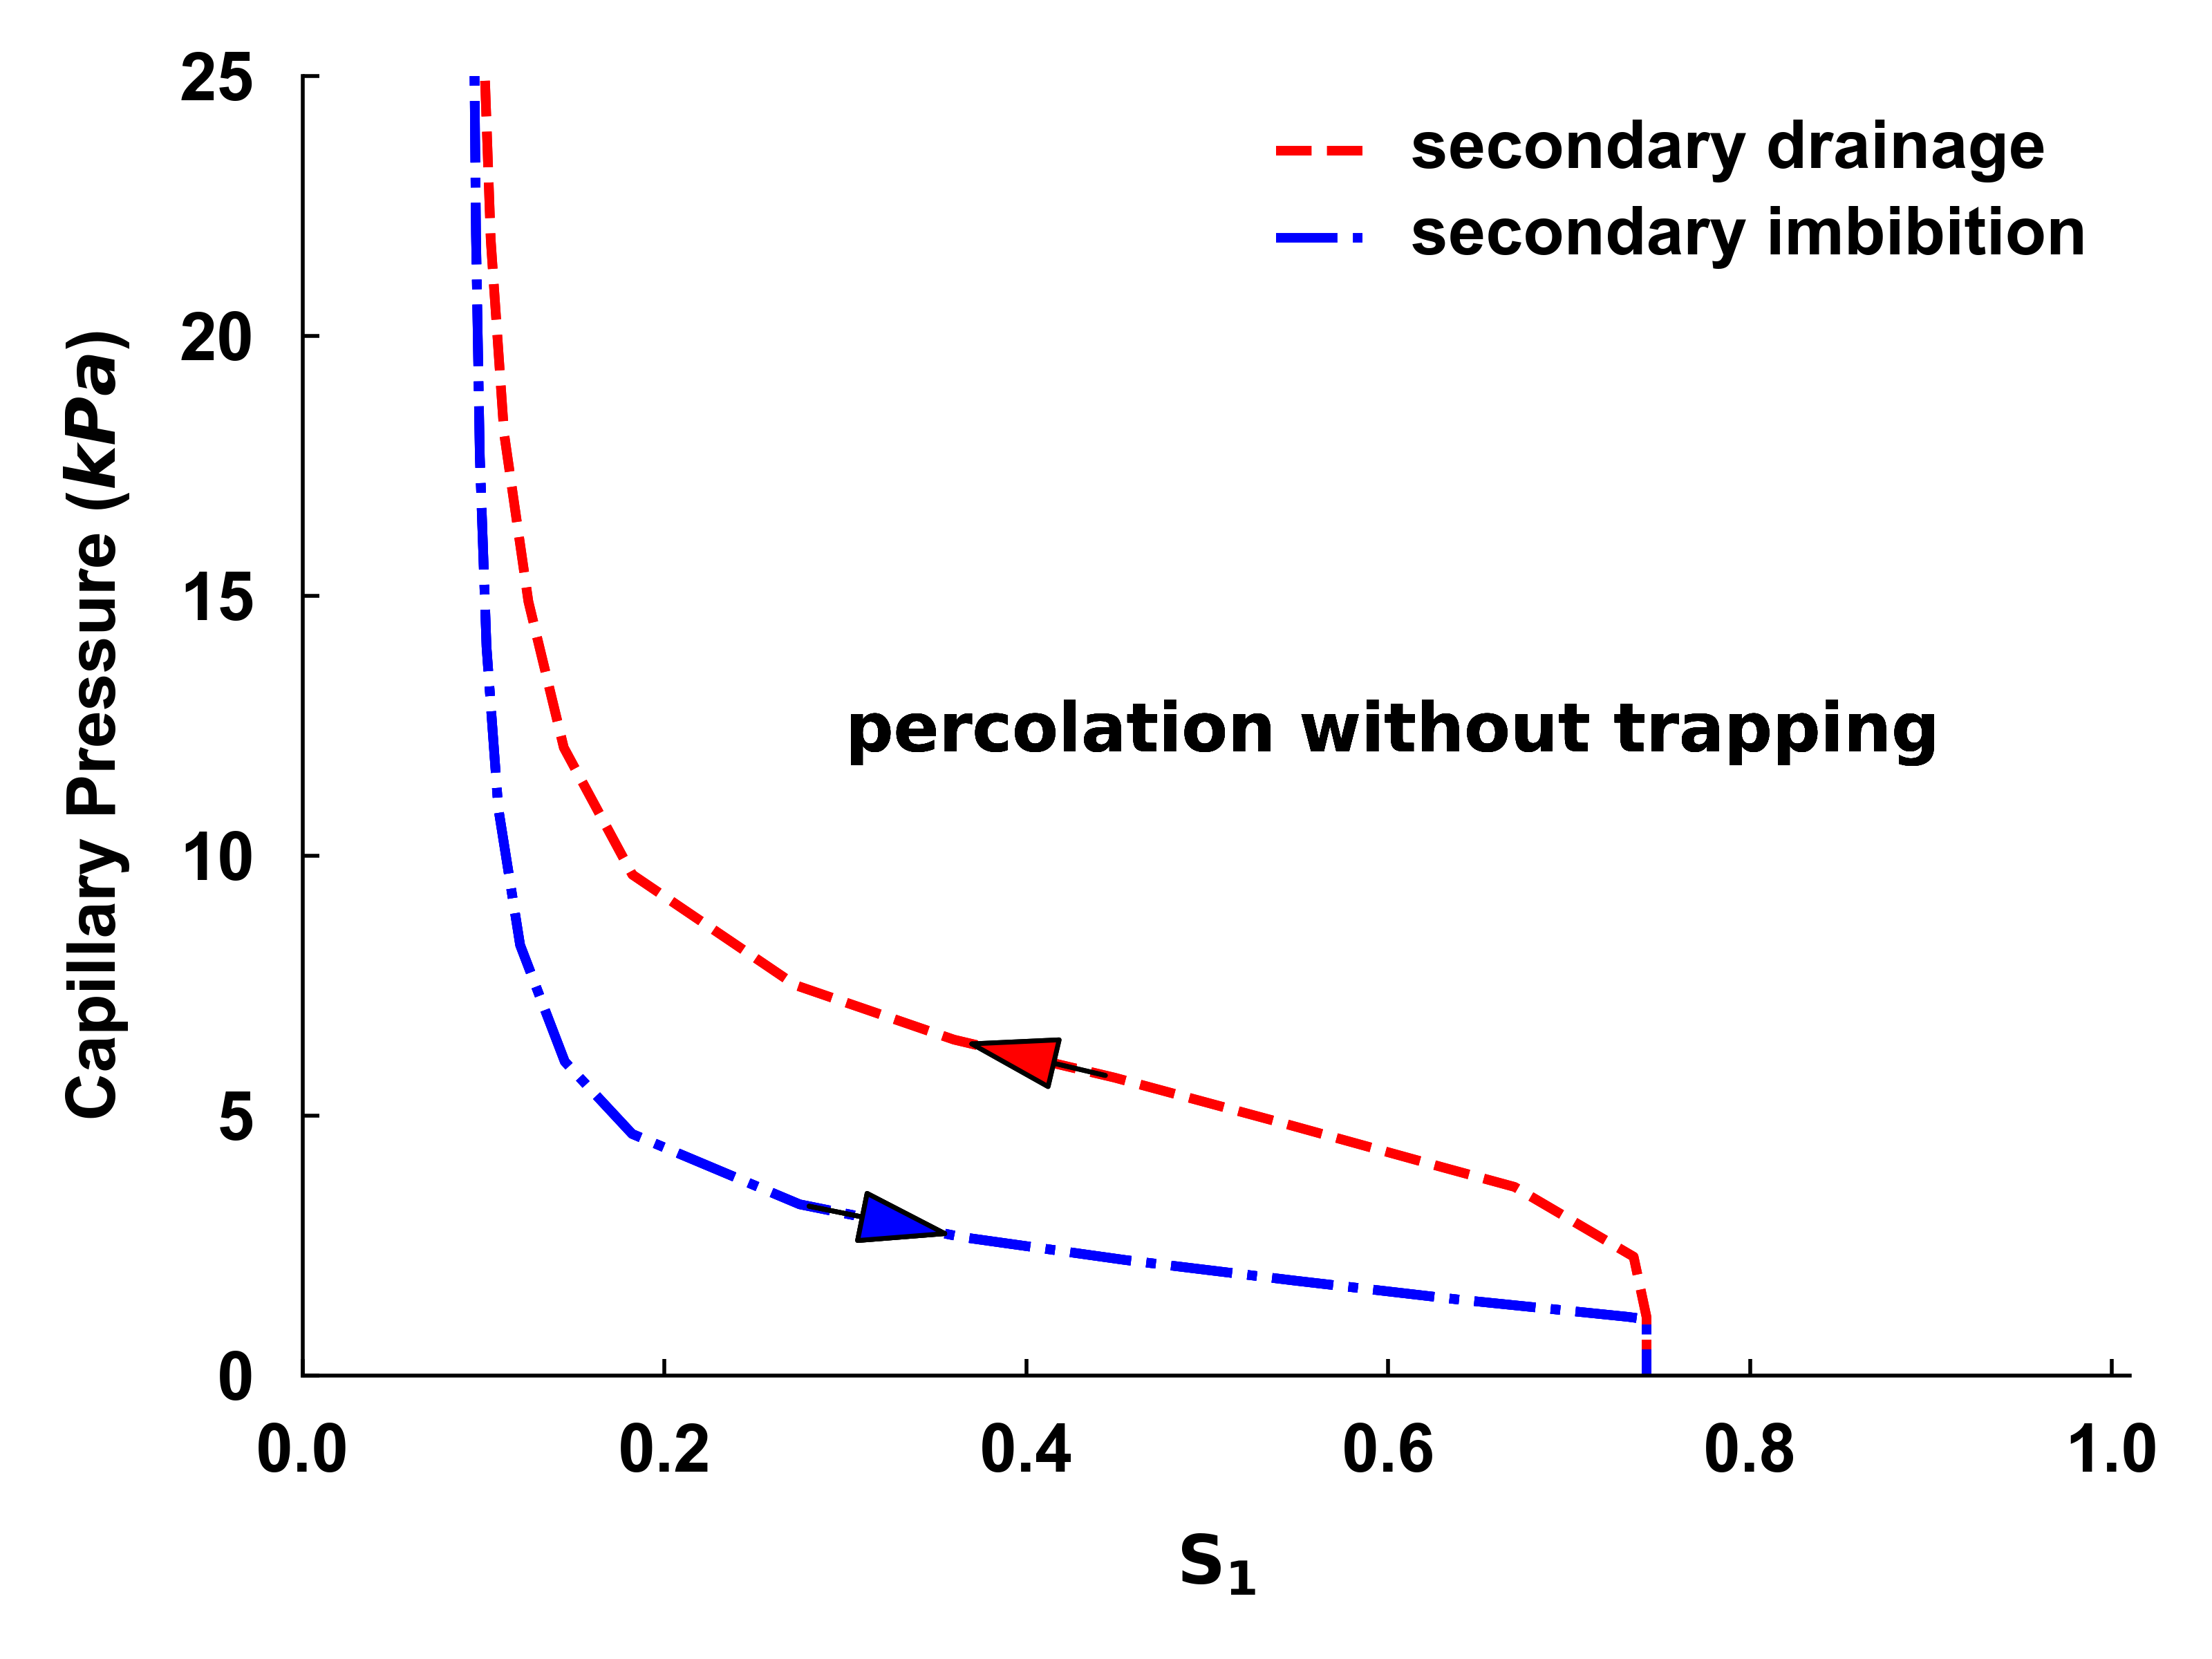
Fig. 1 shows the predicted capillary pressure for primary drainage, secondary imbibition and secondary drainage with and without trapping in imbibition. For the case with trapping, the model predictions are compared to experimental measurements of primary drainage using mercury injection [23], where Ostwald ripening does not occur, and nitrogen/water experiments for both primary drainage and imbibition [30] where the entire imbibition cycle was performed in 5 to 48 hours. We suggest that this is insufficient time for Ostwald ripening to reach equilibrium. There is a good agreement between the model predictions and experiment, including the trapped saturation .
Fig. 1(b) presents model predictions when Ostwald ripening is considered. Here we see a decrease in trapped saturation from approximately 0.36 to 0.28 (see Table 1): the capillary pressure for secondary displacement cycles appears stretched along the saturation axis compared to the case with trapping.
.
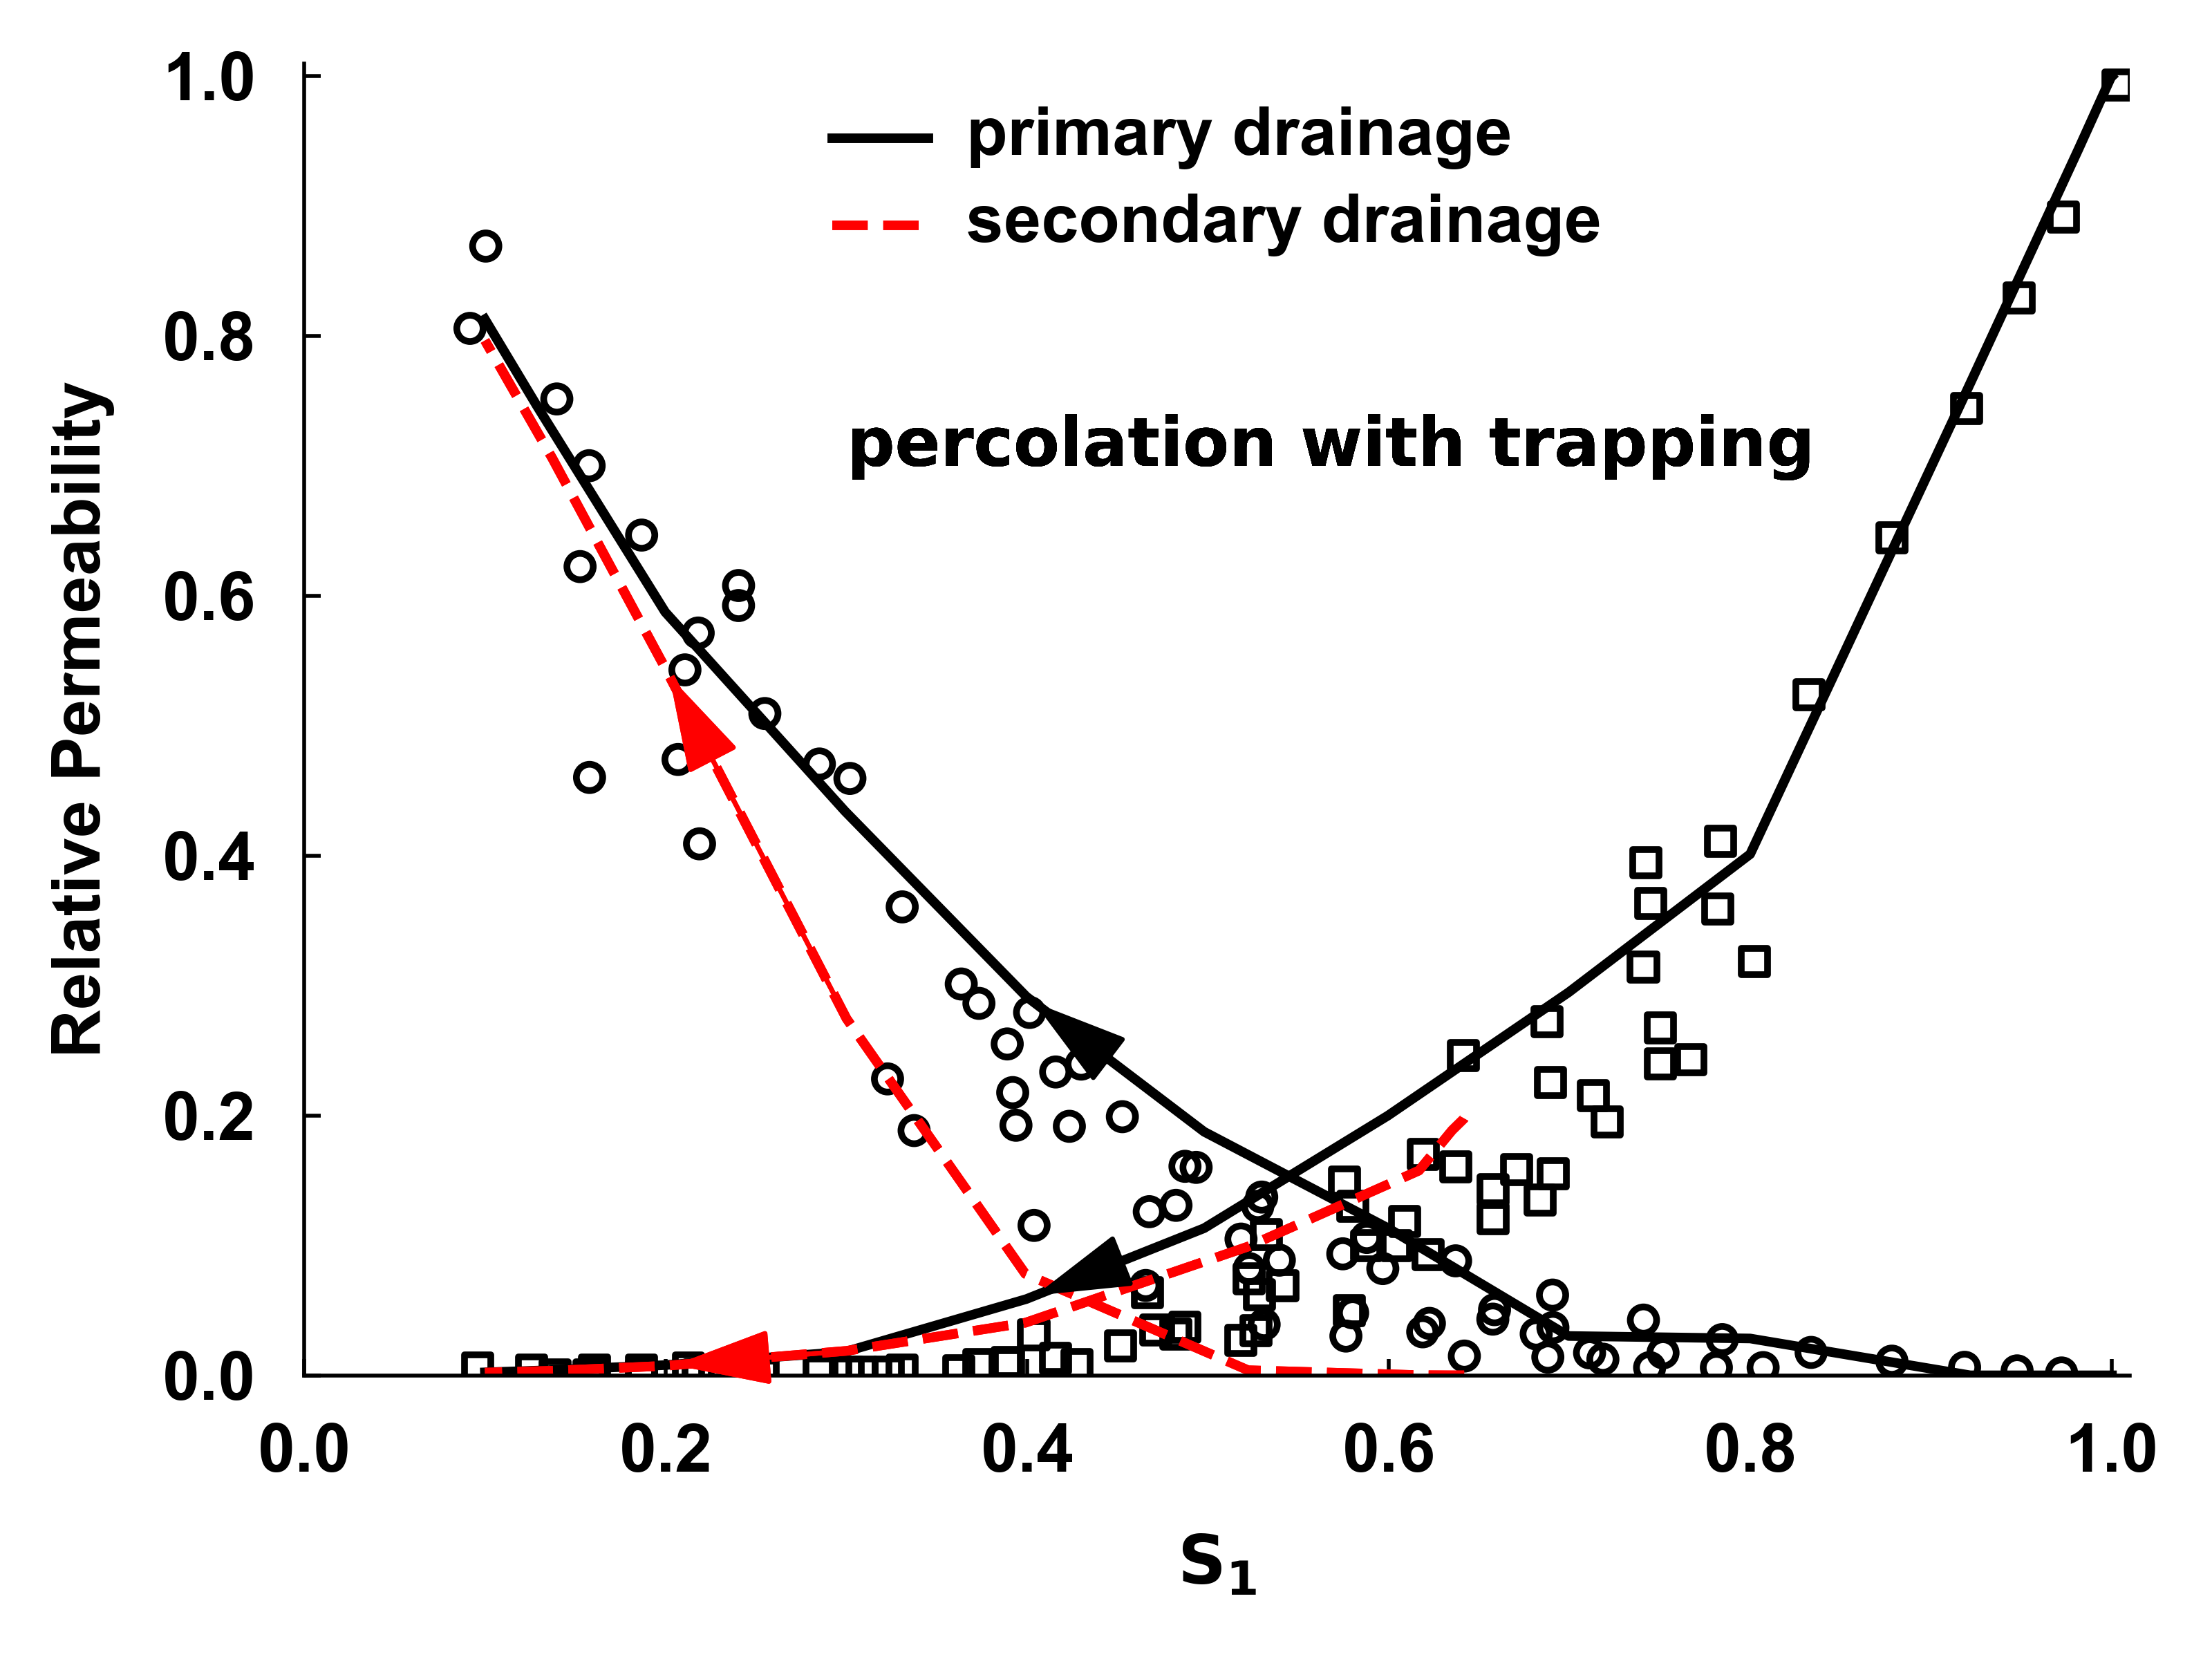
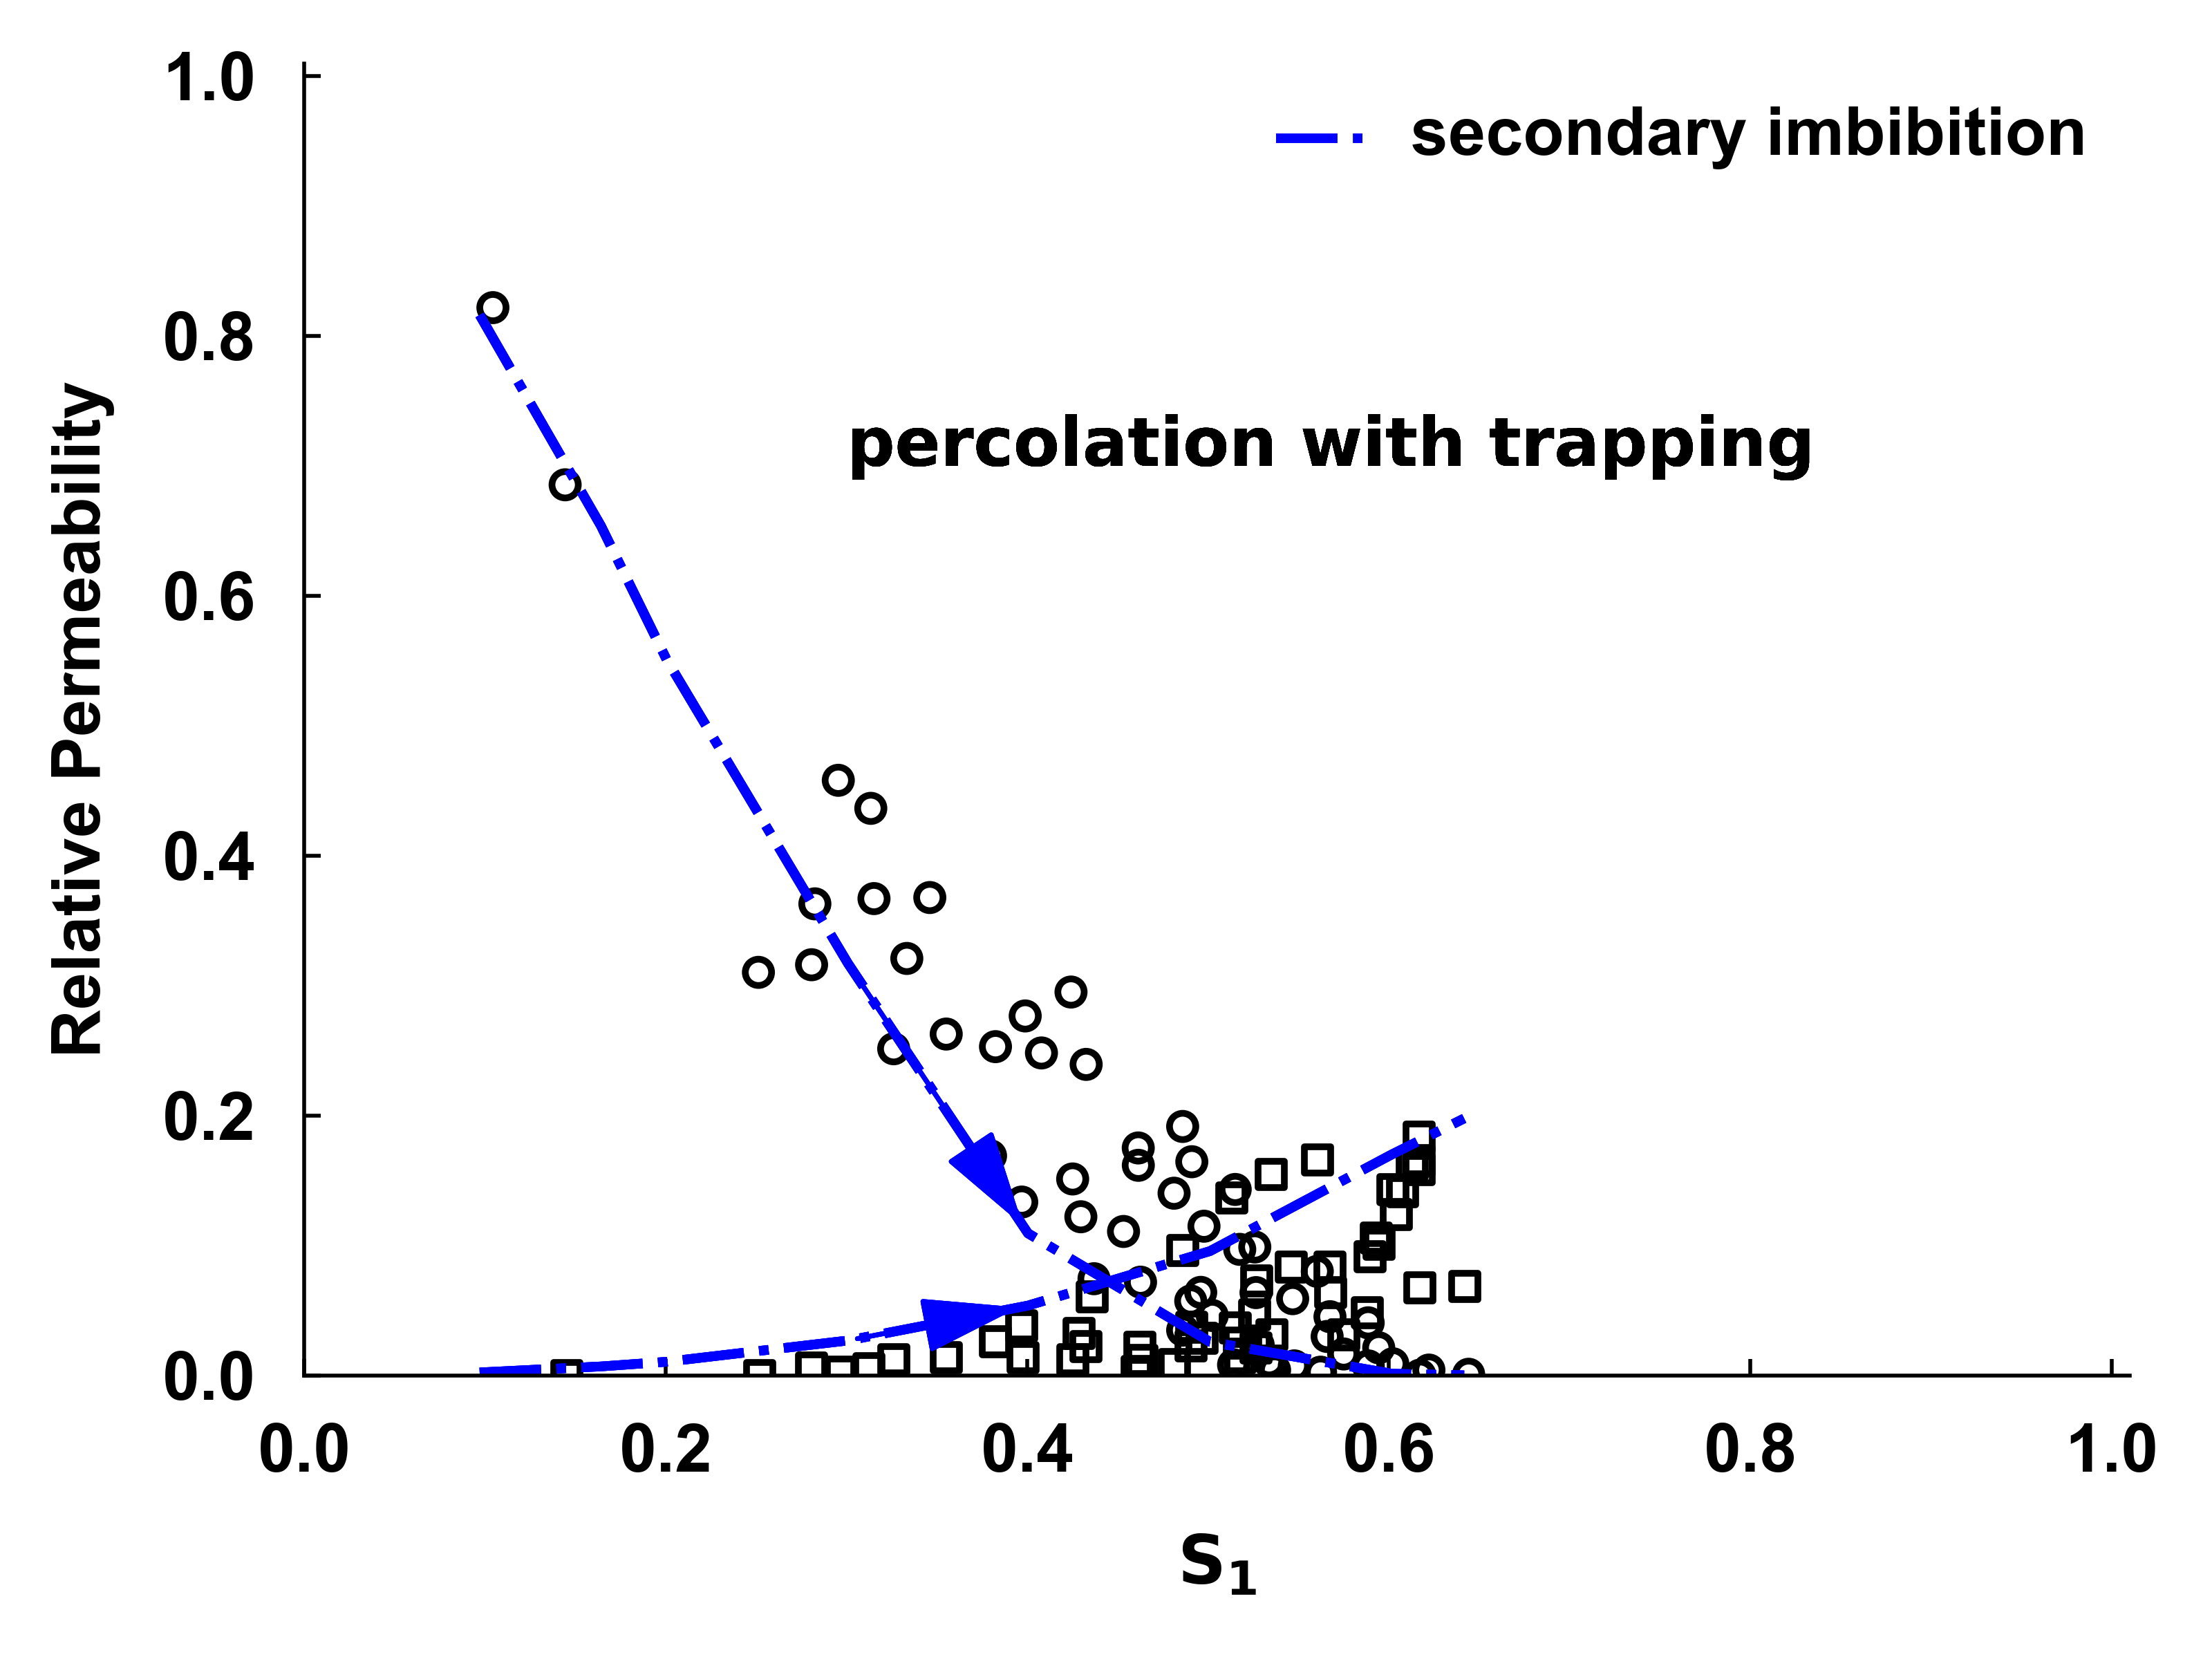
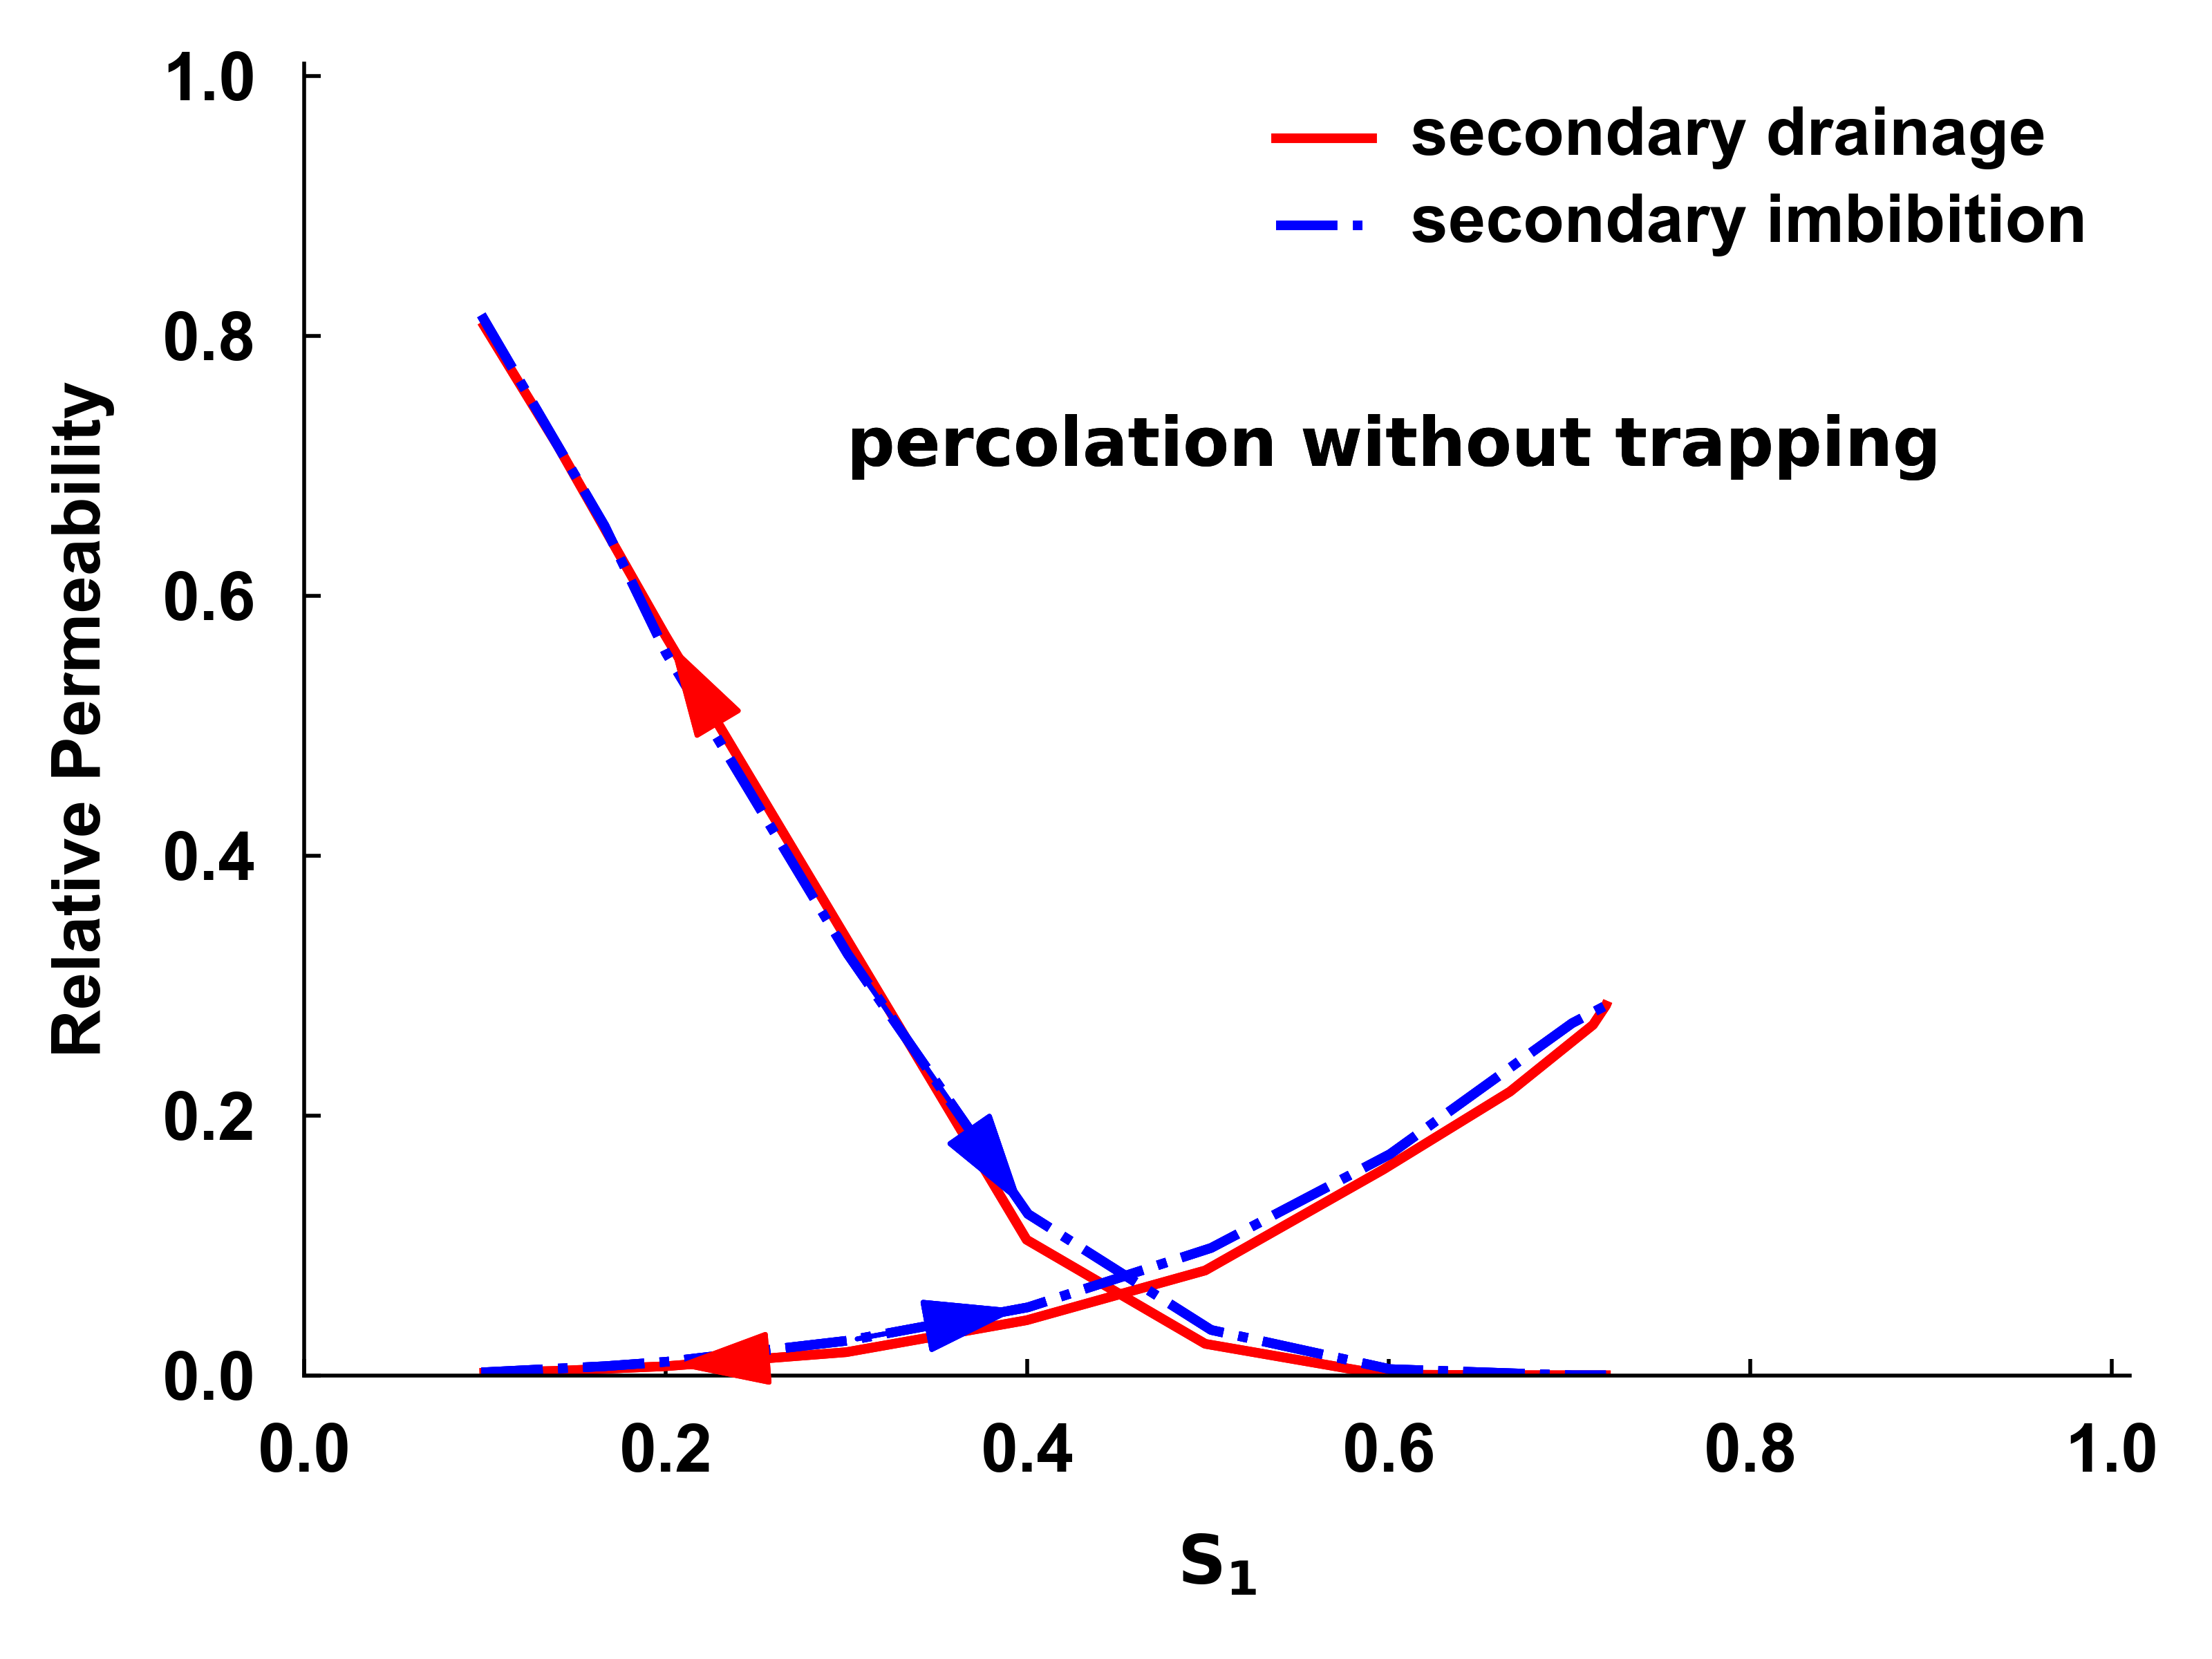
Predictions of relative permeability are compared with experimental data [11, 31] in Fig. 2: here the measurements were made with oil/water systems where the impact of Ostwald ripening is negligible. The model predictions fall within the considerable scatter of the data, consistent with other work using algorithmically similar network models [12, 29]. However, when Ostwald ripening is considered, although the non-wetting phase relative permeability is similar it reaches a lower residual saturation, while the wetting phase relative permeability reaches a higher maximum value, following the trend in primary drainage: the wetting phase occupies the smallest regions of the pore space, as well as corners and roughness, and reaches a higher conductance as the saturation increases.
Most experimental measurements of capillary pressure and relative permeability are not conducted at equilibrium, in terms of Ostwald ripening, and hence are not representative of most subsurface flows involving gases. This is either because mercury or oil/water systems are used, or the experiment is performed too rapidly to allow diffusive transport to rearrange the gaseous phase. We now propose how to convert measurements made out of equilibrium (with trapping) to account for Ostwald ripening.
We define a normalized saturation :
| (1) |
where is the initial (irreducible) saturation of phase 1 at the end of primary drainage and is the trapped saturation of phase 2.
.
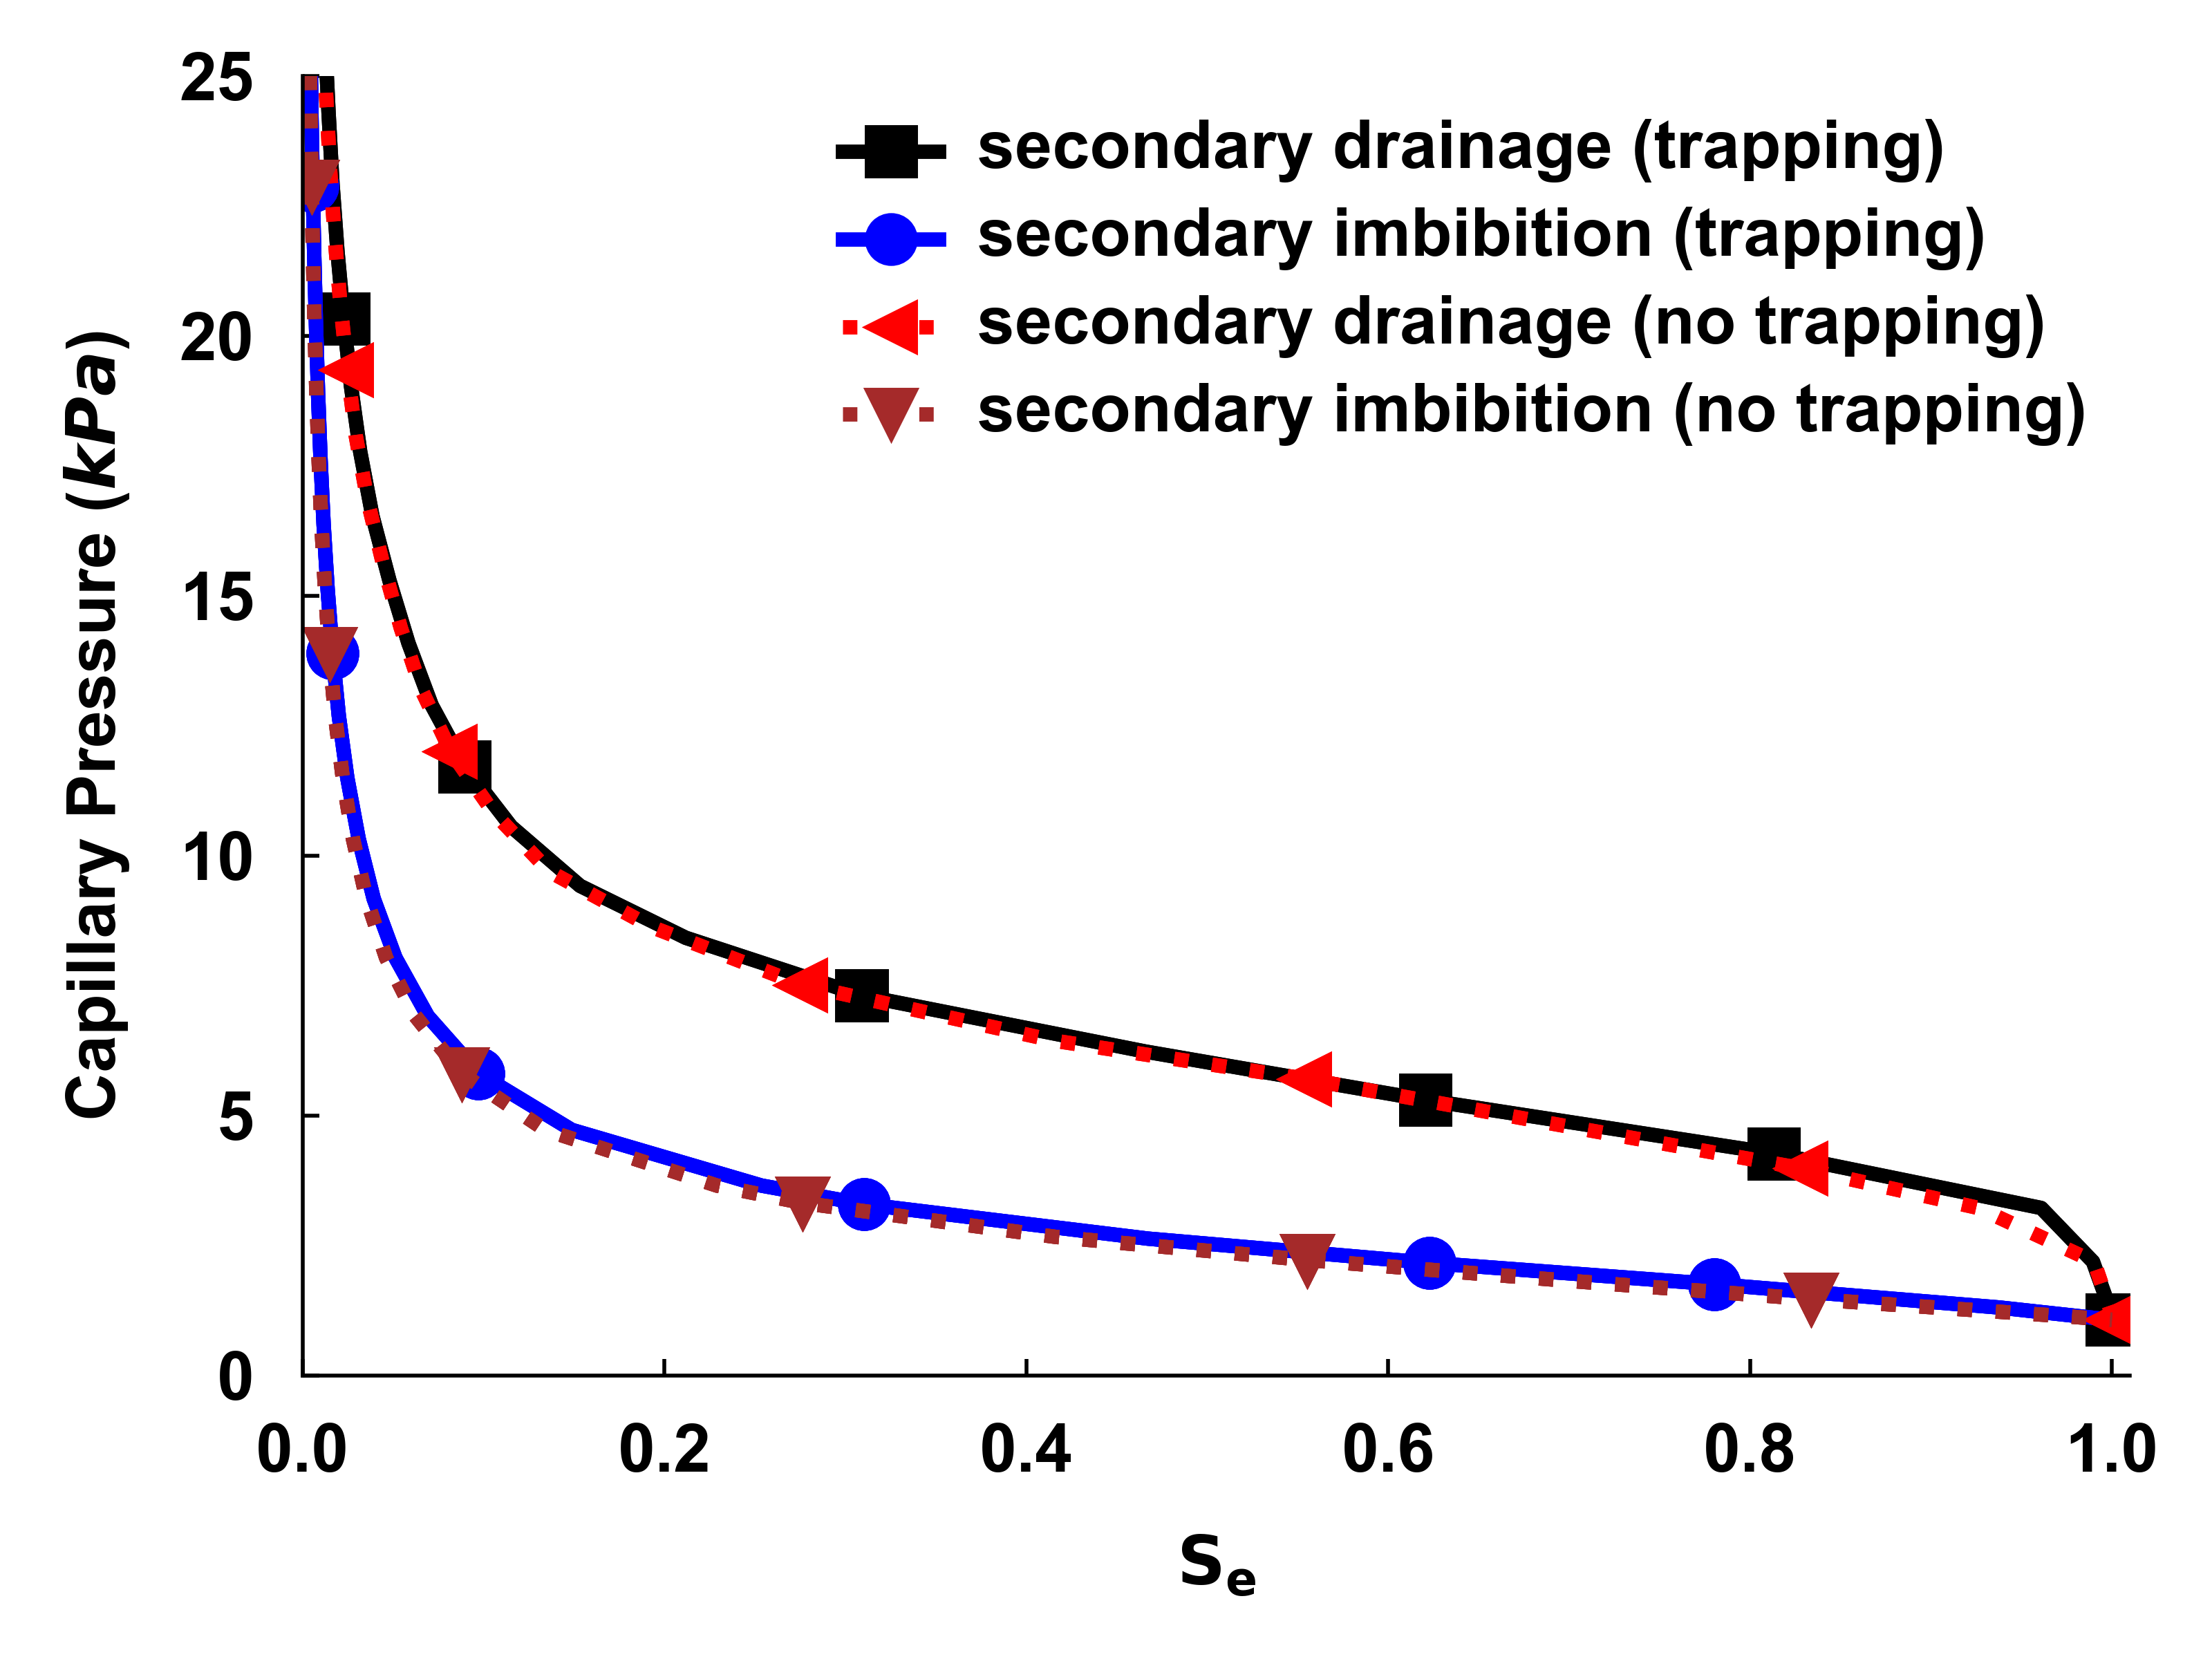
We hypothesize that the capillary pressures for displacement cycles after primary drainage with and without trapping are similar when plotted as a function of with appropriate (and different) values for . This is tested in Fig. 3 which demonstrates that this concept does provide an accurate representation of the capillary pressure hysteresis.
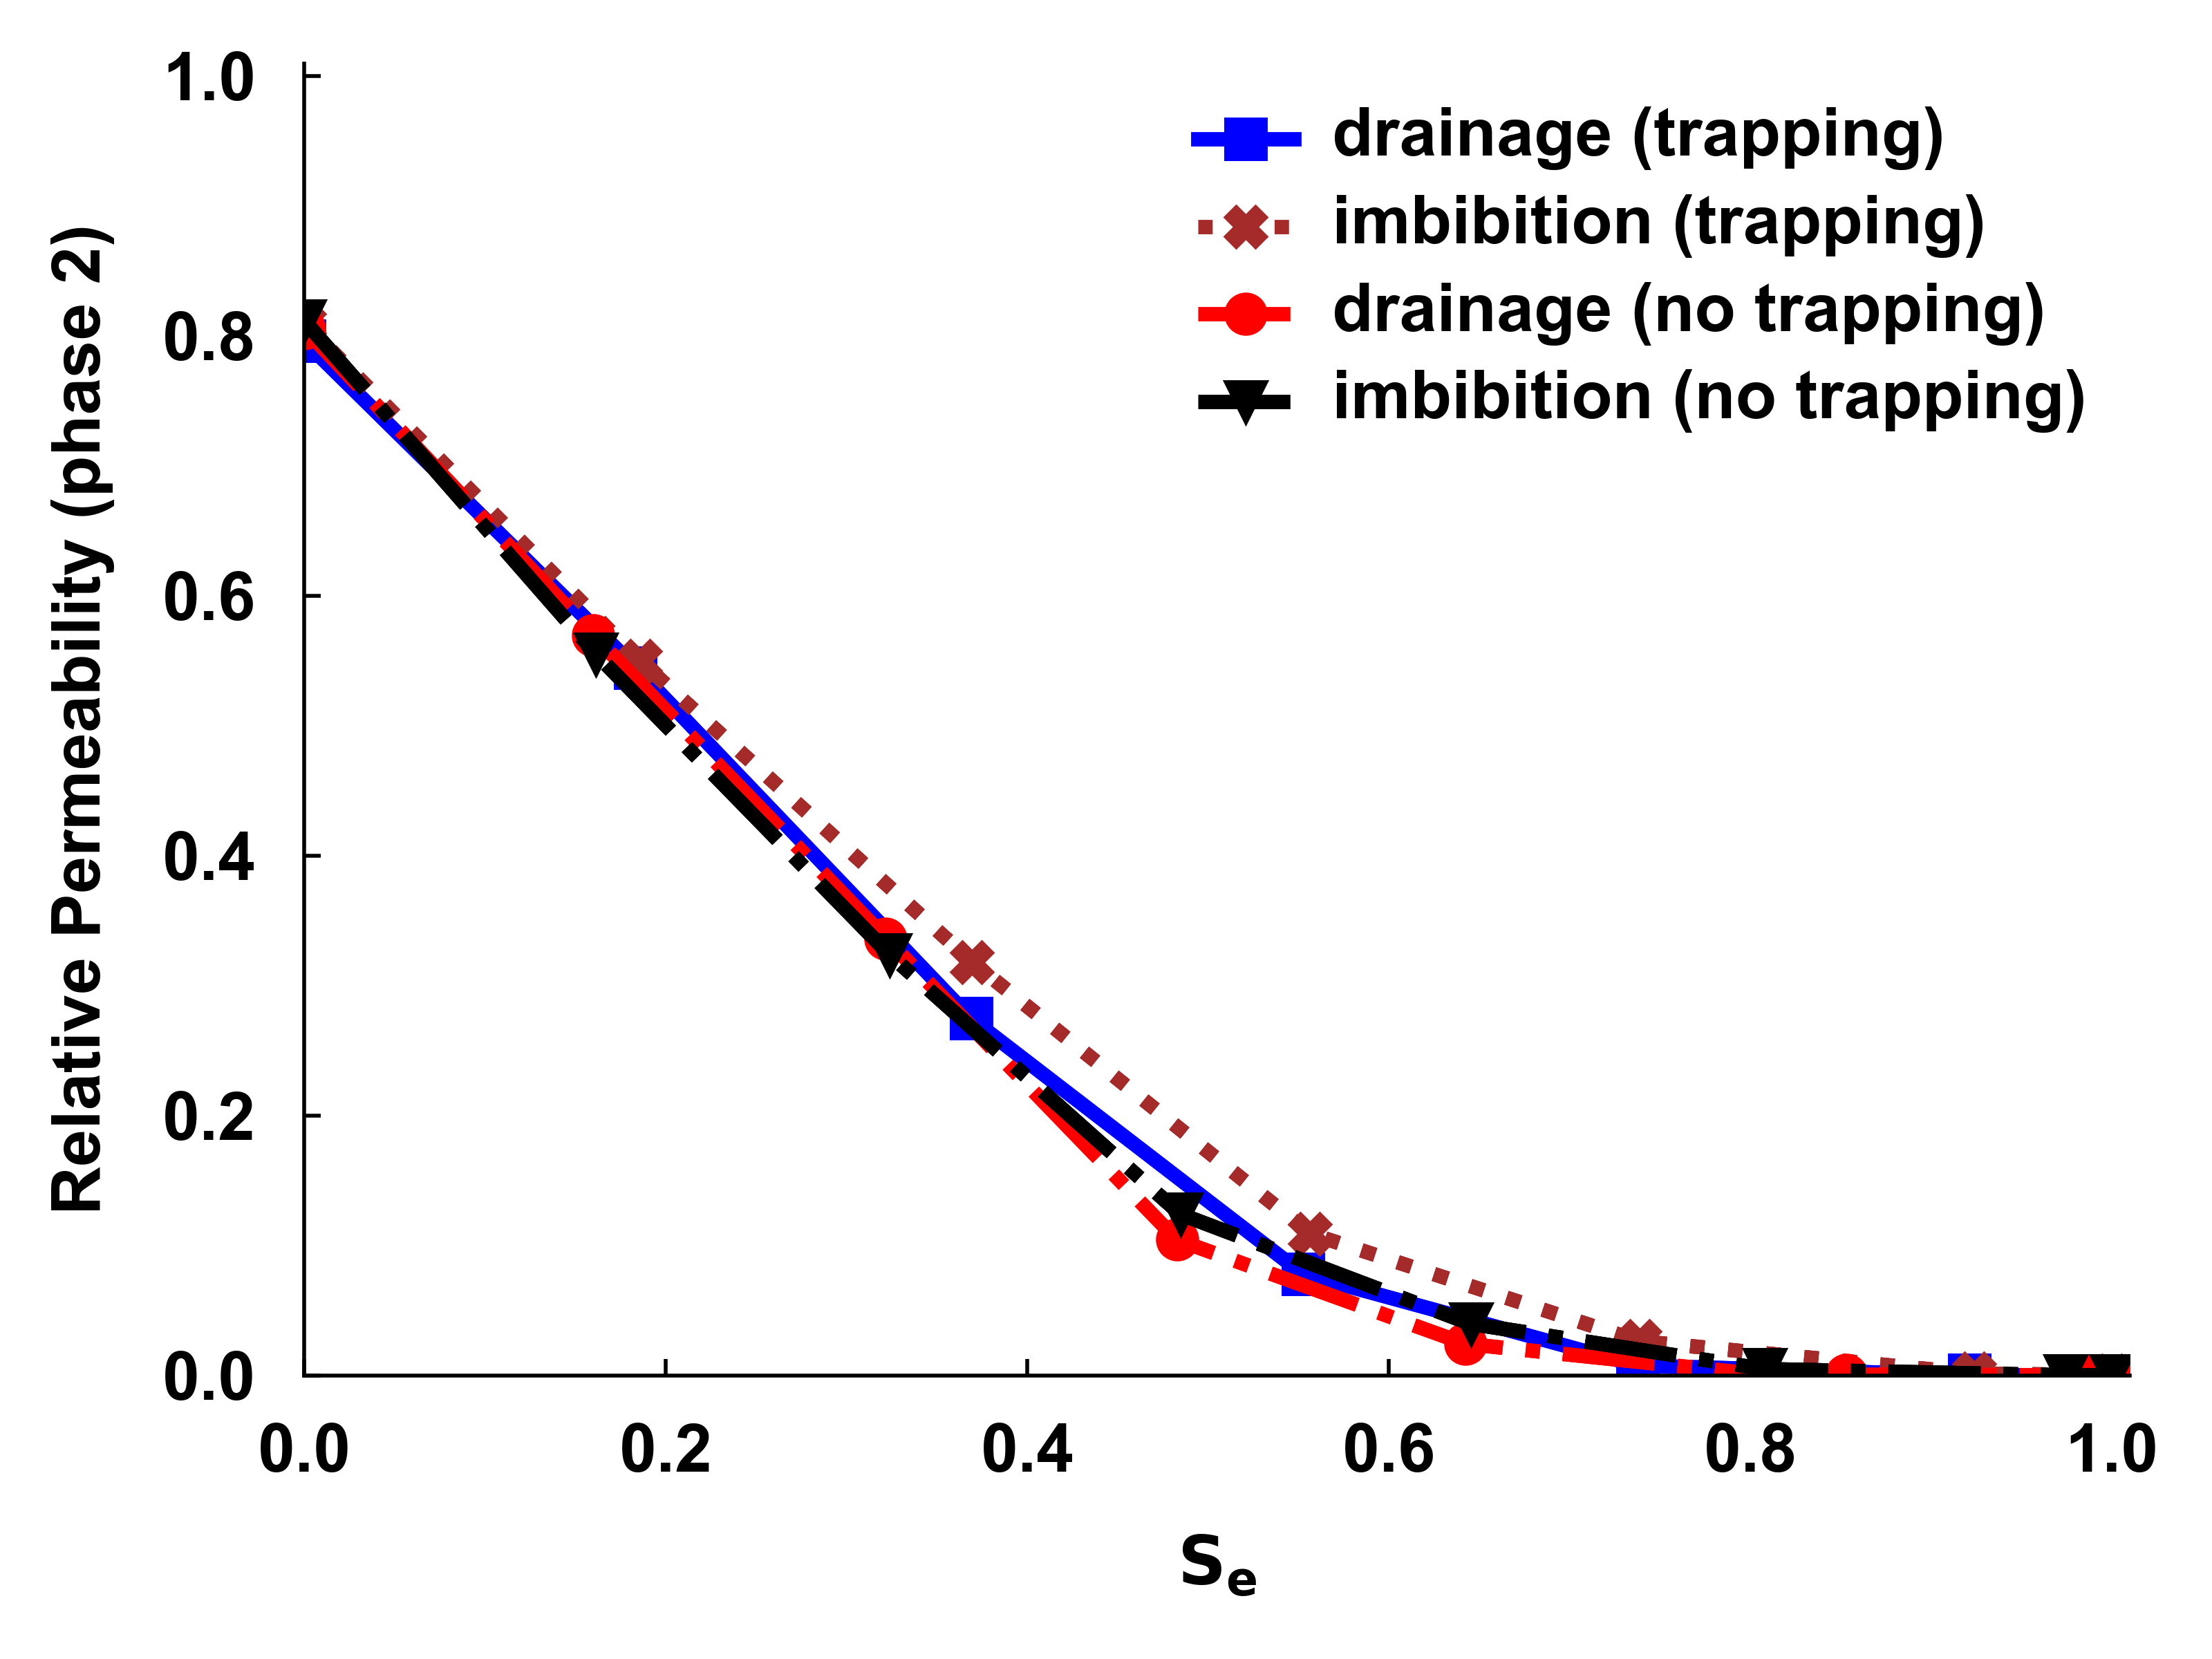
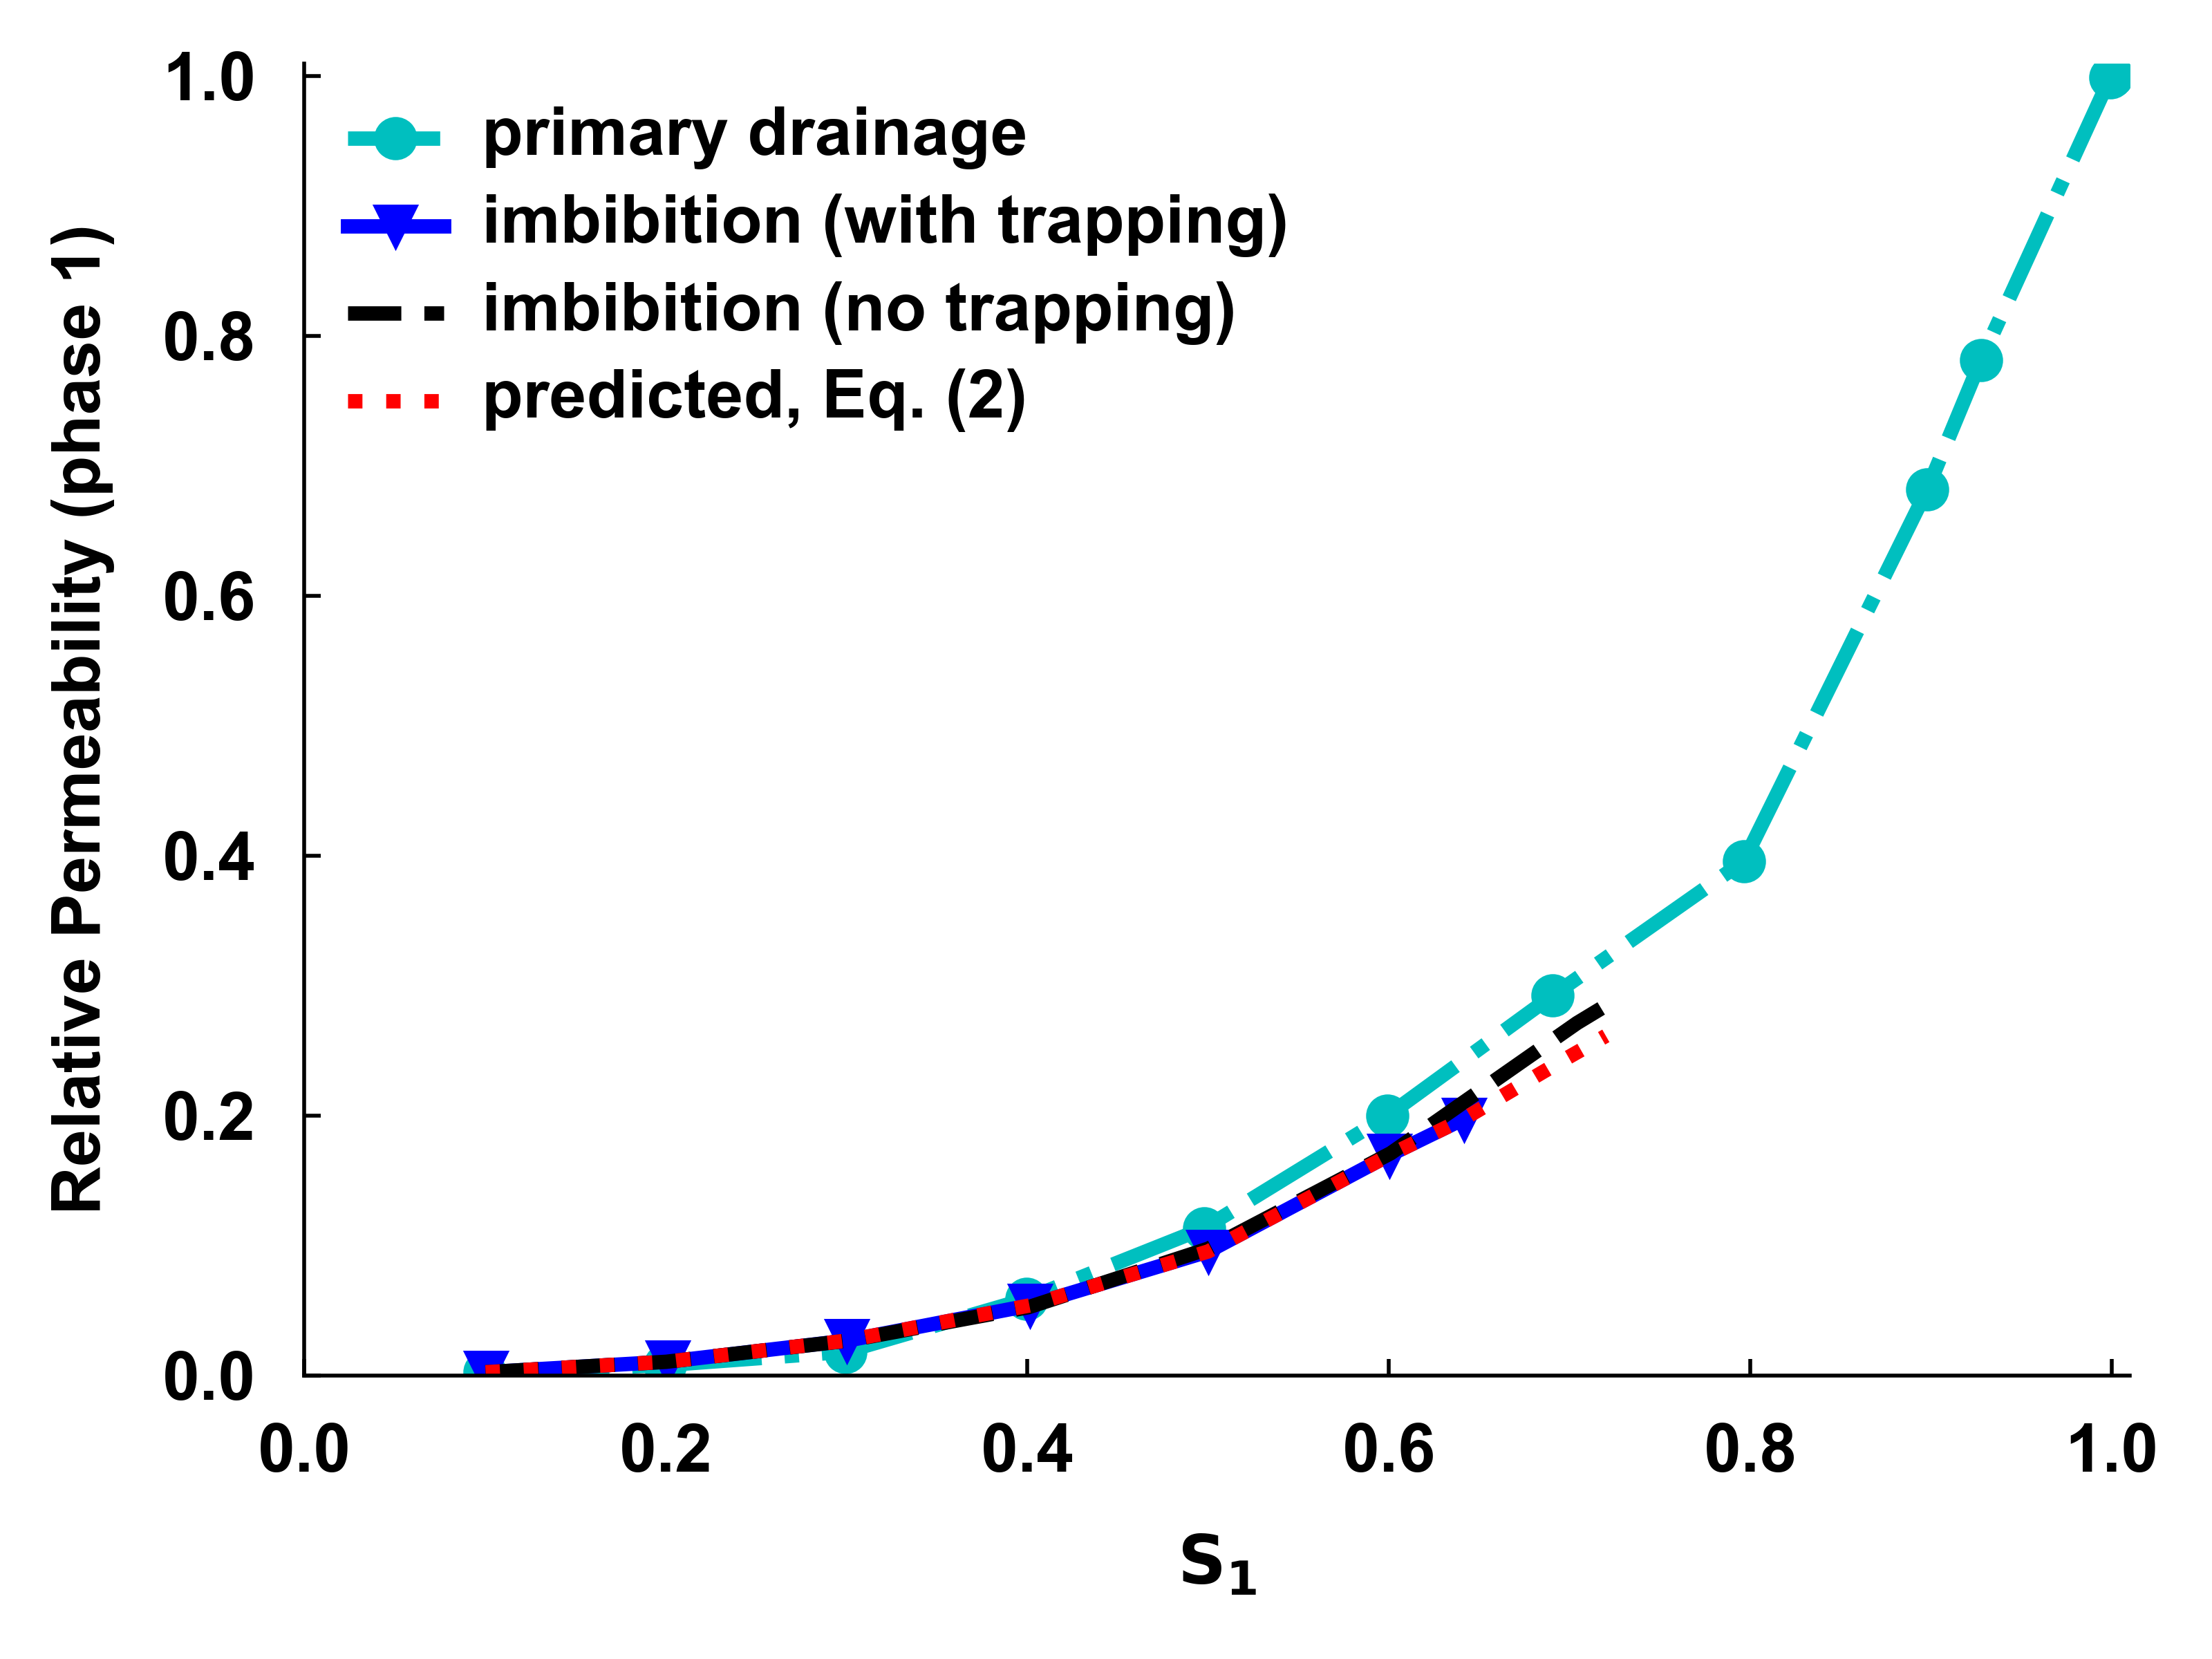
For the wetting phase relative permeability, a larger value is reached without trapping, since the saturation is higher at the end of imbibition. Here the approach is as follows. For ; while for ; we propose:
| (2) |
where the superscript refers to the case with no Ostwald ripening (trapping), with Ostwald ripening (the no-trapping model), and refers to primary drainage.
Fig. 3 suggests that the scaling proposed in Eq. (2) gives a good prediction of the wetting phase relative permeability including Ostwald ripening. For the other networks studied, see Table 1, our proposed scaling of capillary pressure and relative permeability also works well.
The remaining parameter required to convert measurements without Ostwald ripening is the change in trapped saturation. This can be found experimentally, by waiting at the end of imbibition for equilibrium to be reached, followed by further injection of phase 1 to allow any connected phase 2 to be displaced.
In the absence of experimental evidence, Table 1 shows the change in trapped saturation for the cases we have studied: Bentheimer sandstone, Estaillades limestone and a reservoir sample. We see that the reduction in trapped saturation accounting for Ostwald ripening is approximately and this factor could be used to find an initial estimate of .
| Network | Porosity | (m2) | (%) | ||
|---|---|---|---|---|---|
| Bentheimer | 0.220 | 2.792 | 0.358 | 0.280 | 21.8 |
| Estaillades 1 | 0.127 | 1.651 | 0.532 | 0.413 | 22.4 |
| Estaillades 2 | 0.102 | 2.643 | 0.579 | 0.454 | 21.6 |
| Ketton | 0.074 | 1.108 | 0.393 | 0.300 | 23.7 |
| Reservoir sample | 0.133 | 2.339 | 0.464 | 0.366 | 21.1 |
.
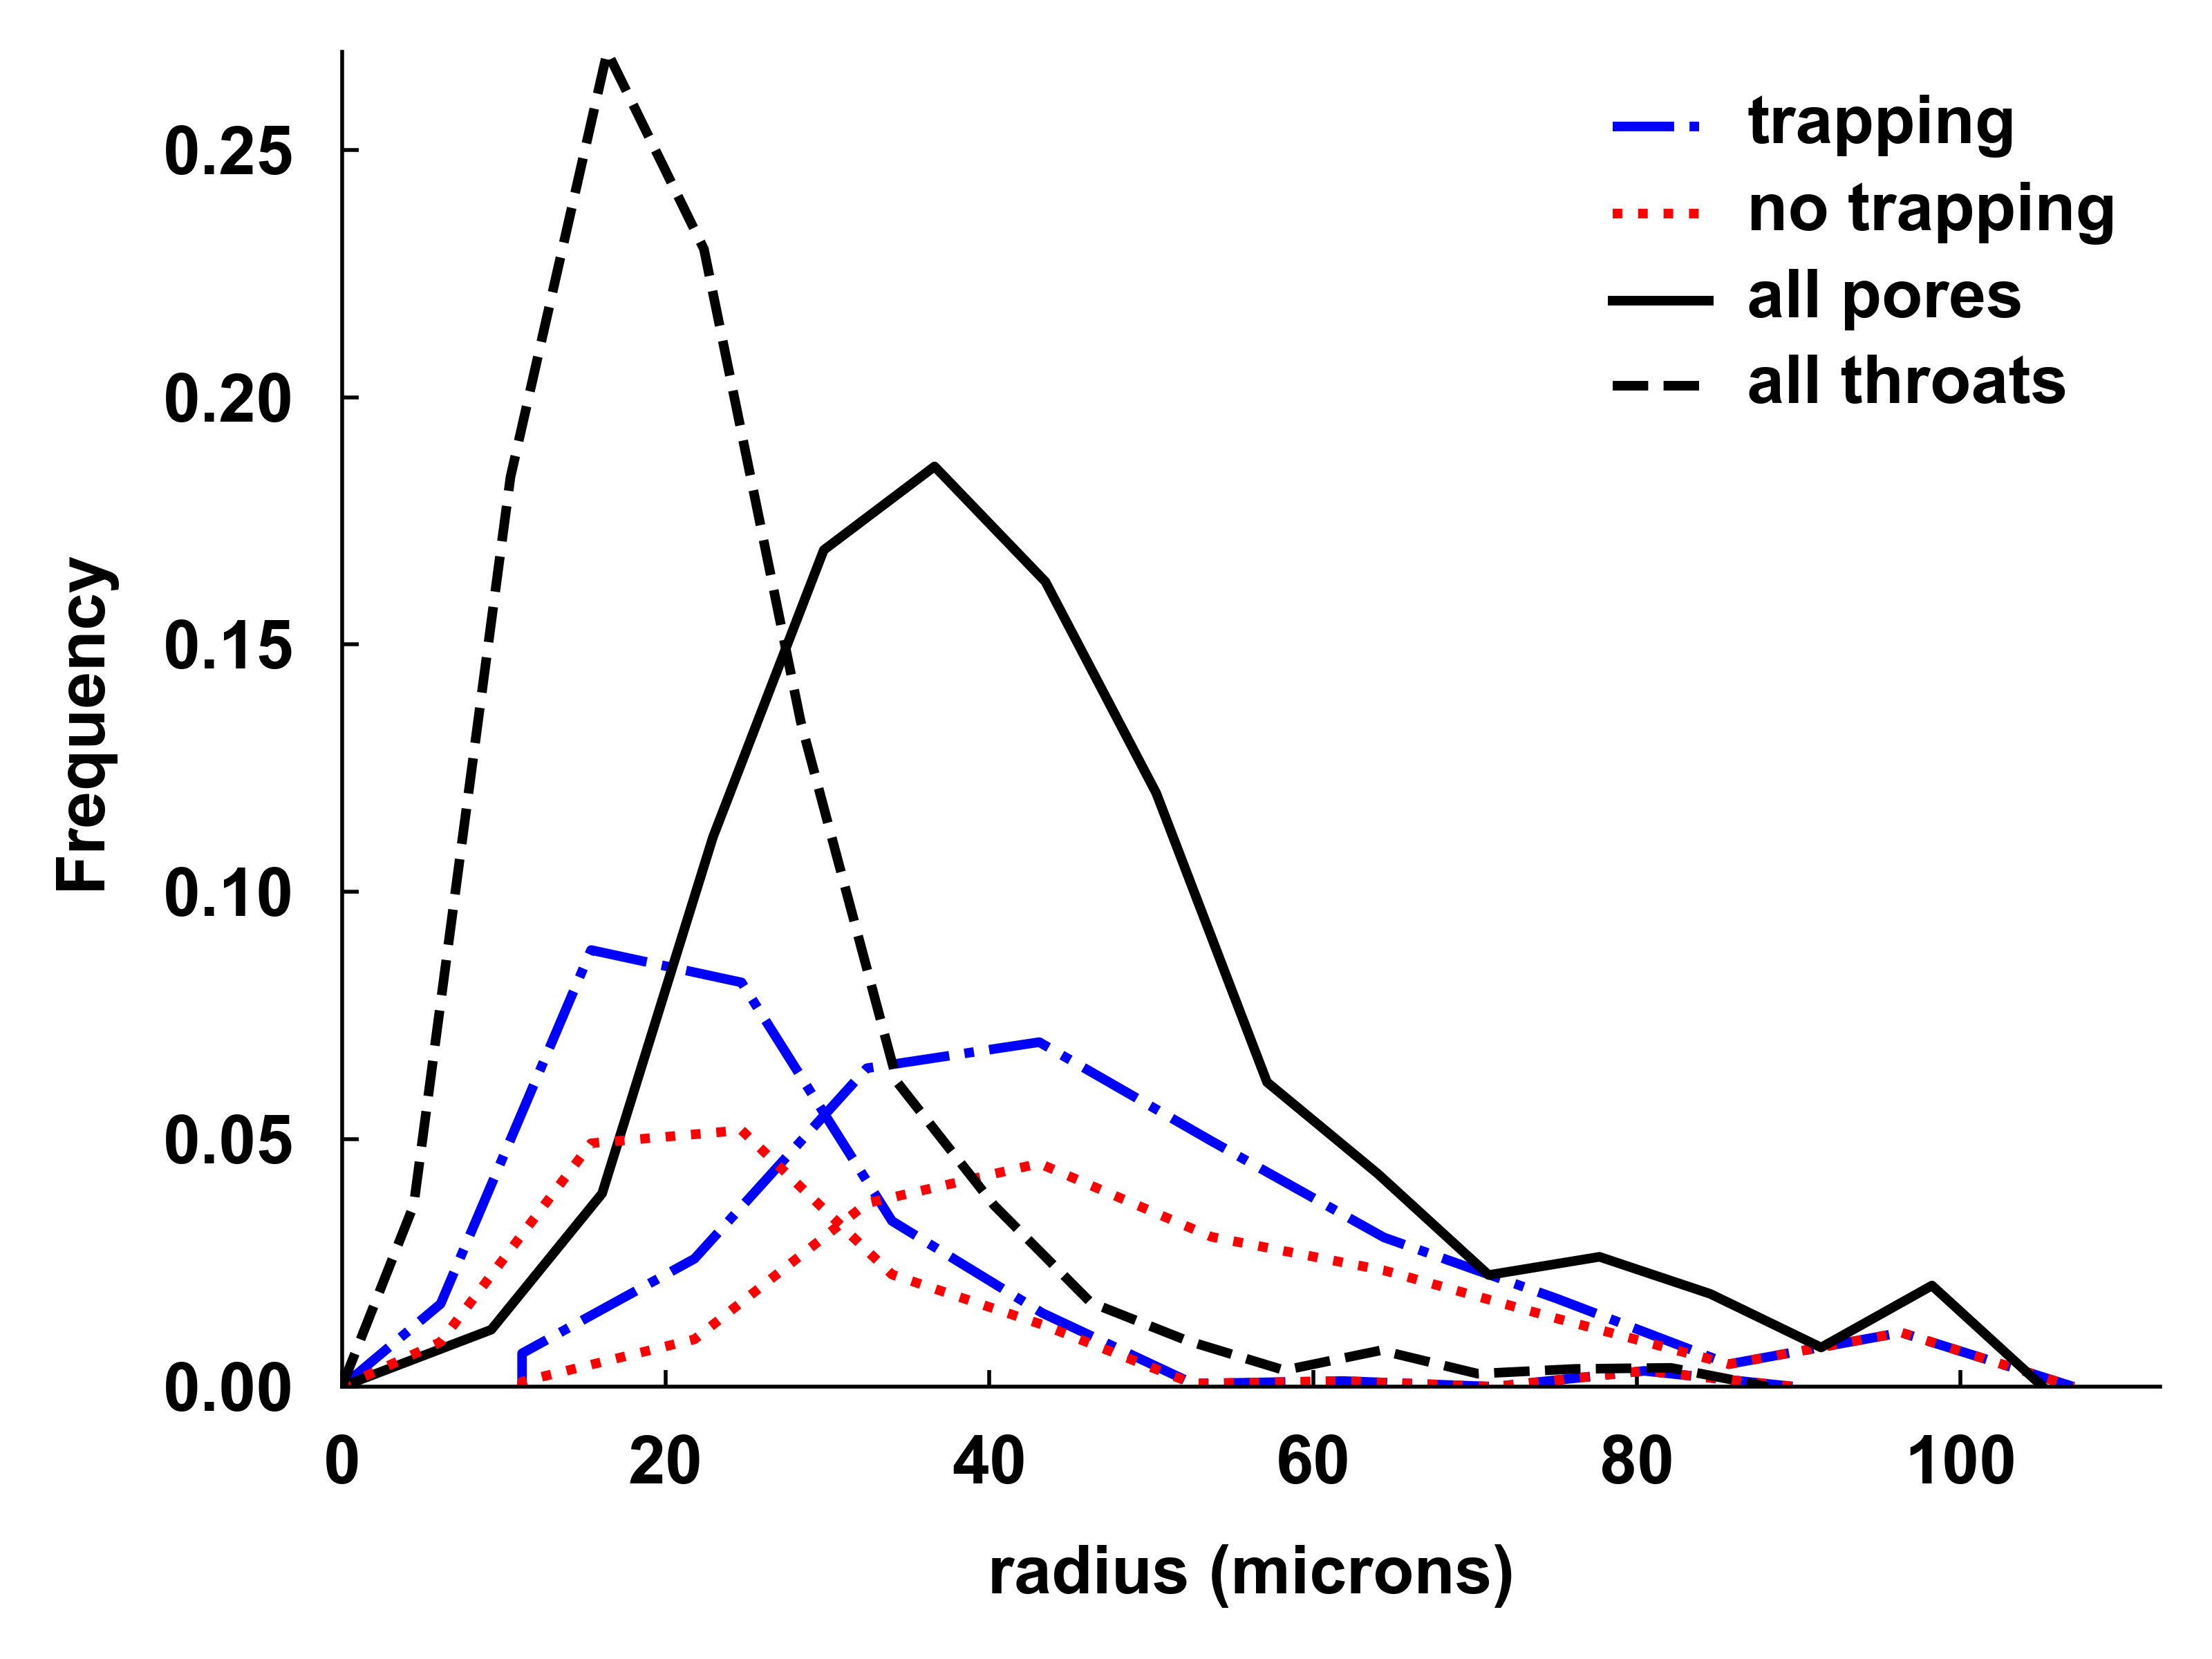
Fig. 4 illustrates the fraction of pores and throats of different radius filled at the end of imbibition for both models. Allowing for Ostwald ripening leads to a more strictly percolation-like process with a sharp transition from small throats, filled with phase 1, and larger throats occupied by phase 2. When trapping is accommodated, some smaller throats can remain filled with phase 1, leading to a less steep transition in occupancy. The resultant difference in trapped saturation will be a function of contact angle (wettability) and pore structure and hence is difficult to predict a priori.
In summary, two-phase displacement where transport of dissolved species allows local capillary equilibrium is a percolation process with trapping, overturning current conventional models [2]. Experimental measurements on gas/water systems that have not yet reached equilibrium – which is likely to take days to months [19] – over-estimate the amount of trapping and the extent of capillary pressure hysteresis. This is significant for assessments of geological carbon dioxide storage, for instance, where capillary trapping allows secure long-term storage, but whose impact, if based on laboratory experiments, may have been exaggerated [32]; on the other hand, the reduction in trapping with Ostwald ripening is favourable for hydrogen and natural gas storage and retrieval.
Future work could extend these predictions to systems of arbitrary wettability and to provide direct experimental tests of the changes in multiphase flow properties predicted here.
The code used to generate the results in this paper, together with associated data can be found in github.com/ImperialCollegeLondon/porescale/OstRipening.
AIA would like to thank the Petroleum Technology Development Fund (Nigeria) for funding his PhD.
References
- Wilkinson and Willemsen [1983] D. Wilkinson and J. F. Willemsen, Journal of Physics A: Mathematical and General 16, 3365 (1983).
- Lenormand et al. [1983] R. Lenormand, C. Zarcone, and A. Sarr, Journal of Fluid Mechanics 135, 337 (1983).
- Ostwald [1897] W. Ostwald, Zeitschrift für physikalische Chemie 22, 289 (1897).
- Blunt [2017] M. J. Blunt, Multiphase Flow in Permeable Media: a Pore-Scale Perspective (Cambridge University Press, 2017).
- Lenormand and Zarcone [1984] R. Lenormand and C. Zarcone (1984) sPE 13264, proceedings of the 59th SPE Annual Technical Conference and Exhibition, Houston, Texas, 16–19 September.
- Pickell et al. [1966] J. J. Pickell, B. F. Swanson, and W. B. Hickmann, SPE Journal 6, 55– (1966).
- Andrew et al. [2015] M. Andrew, H. Menke, M. J. Blunt, and B. Bijeljic, Transport in Porous Media 110, 1 (2015).
- Haines [1930] W. B. Haines, The Journal of Agricultural Science 20, 97 (1930).
- Berg et al. [2013] S. Berg, H. Ott, S. A. Klapp, A. Schwing, R. Neiteler, N. Brussee, A. Makurat, L. Leu, F. Enzmann, J. O. Schwarz, M. Kersten, S. Irvine, and M. Stampanoni, Proceedings of the National Academy of Sciences 110, 3755 (2013), http://www.pnas.org/content/110/10/3755.full.pdf .
- Reynolds et al. [2017] C. A. Reynolds, H. Menke, M. Andrew, M. J. Blunt, and S. Krevor, Proceedings of the National Academy of Sciences 114, 8187 (2017).
- Øren et al. [1998] P. E. Øren, S. Bakke, and O. J. Arntzen, SPE Journal 3, 324 (1998).
- Valvatne and Blunt [2004] P. H. Valvatne and M. J. Blunt, Water Resources Research 40, W07406 (2004).
- Xu et al. [2017] K. Xu, R. Bonnecaze, and M. Balhoff, Physical Review Letters 119, 264502 (2017).
- Garing et al. [2017] C. Garing, J. A. de Chalendar, M. Voltolini, J. B. Ajo-Franklin, and S. M. Benson, Advances in Water Resources 104, 223 (2017).
- de Chalendar et al. [2018] J. A. de Chalendar, C. Garing, and S. M. Benson, Journal of Fluid Mechanics 835, 363 (2018).
- Singh et al. [2022] K. Singh, T. Bultreys, A. Q. Raeini, M. Shams, and M. J. Blunt, Journal of Colloid and Interface Science 609, 384 (2022).
- Zhang et al. [2023] Y. Zhang, B. Bijeljic, Y. Gao, S. Goodarzi, S. Foroughi, and M. J. Blunt, Geophysical Research Letters 50, e2022GL102383 (2023).
- Goodarzi et al. [2024] S. Goodarzi, Y. Zhang, S. Foroughi, B. Bijeljic, and M. J. Blunt, International Journal of Hydrogen Energy 56, 1139 (2024).
- Blunt [2022] M. J. Blunt, Physical Review E 106, 045103 (2022).
- Dong and Blunt [2009] H. Dong and M. J. Blunt, Physical Review E 80, 036307 (2009).
- Raeini et al. [2017] A. Q. Raeini, B. Bijeljic, and M. J. Blunt, Physical Review E 96, 013312 (2017).
- Porescale Modelling Group [2015a] I. C. L. Porescale Modelling Group, Micro-ct images and networks (2015a).
- Lin et al. [2018] Q. Lin, B. Bijeljic, R. Pini, M. J. Blunt, and S. Krevor, Water Resources Research 54, 7046– (2018).
- Porescale Modelling Group [2015b] I. C. L. Porescale Modelling Group, High-resolution x-ray image of estaillades carbonate (2015b).
- Gao et al. [2023] Y. Gao, S. Foroughi, B. Bijeljic, and M. J. Blunt, Estaillades carbonate: High-resolution x-ray imaging of steady-state oil-brine flow in microporous rock. figshare. media. (2023).
- Scanziani et al. [2020] A. Scanziani, Q. Lin, A. Alhosani, M. J. Blunt, and B. Bijeljic, Proceedings of the Royal Society A 476, 20200040 (2020).
- Alhosani et al. [2020] A. Alhosani, A. Scanziani, Q. Lin, S. Foroughi, A. M. Alhammadi, M. J. Blunt, and B. Bijeljic, Physical Review E 102, 023110 (2020).
- Blunt et al. [2019] M. J. Blunt, Q. Lin, T. Akai, and B. Bijeljic, Journal of Colloid and Interface Science 552, 59 (2019).
- Raeini et al. [2018] A. Q. Raeini, B. Bijeljic, and M. J. Blunt, Physical Review E 97, 023308 (2018).
- Raeesi et al. [2014] B. Raeesi, N. R. Morrow, and G. Mason, Vadose Zone Journal 13, https://doi.org/10.2136/vzj2013.06.0097 (2014).
- Alizadeh and Piri [2014] A. H. Alizadeh and M. Piri, Water Resources Research 50, 1636 (2014).
- Benson and Cole [2008] S. M. Benson and D. R. Cole, Elements 4, 325 (2008).