![[Uncaptioned image]](/html/2403.20279/assets/x1.png) Luq: Long-text Uncertainty Quantification for LLMs
Luq: Long-text Uncertainty Quantification for LLMs
Abstract
Large Language Models (LLMs) have demonstrated remarkable capability in a variety of NLP tasks. Despite their effectiveness, these models are prone to generate nonfactual content. Uncertainty Quantification (UQ) is pivotal in enhancing our understanding of a model’s confidence in its generated content, thereby aiding in the mitigation of nonfactual outputs. Existing research on UQ predominantly targets short text generation, typically yielding brief, word-limited responses. However, real-world applications frequently necessitate much longer responses. Our study first highlights the limitations of current UQ methods in handling long text generation. We then introduce Luq, a novel sampling-based UQ approach specifically designed for long text. Our findings reveal that Luq outperforms existing baseline methods in correlating with the model’s factuality scores (negative coefficient of -0.85 observed for Gemini Pro). With Luq as the tool for UQ, we investigate behavior patterns of several popular LLMs’ response confidence spectrum and how that interplays with the response’ factuality. We identify that LLMs lack confidence in generating long text for rare facts and a factually strong model (i.e. GPT-4) tends to reject questions it is not sure about. To further improve the factual accuracy of LLM responses, we propose a method called Luq-Ensemble that ensembles responses from multiple models and selects the response with the least uncertainty. The ensembling method greatly improves the response factuality upon the best standalone LLM.
Luq: Long-text Uncertainty Quantification for LLMs
Caiqi Zhang1, Fangyu Liu1††thanks: Now at Google DeepMind., Marco Basaldella, Nigel Collier1 1Language Technology Lab, University of Cambridge 2Amazon AGI {cz391, fl399, nhc30}@cam.ac.uk mbbasald@amazon.co.uk
1 Introduction
Large Language Models (LLMs) have demonstrated significant prowess across a wide range of NLP tasks and are increasingly being used in various downstream applications (Zhao et al., 2023; Chang et al., 2023). However, existing LLMs are susceptible to hallucination, often resulting in the generation of nonfactual or fabricated content (Manakul et al., 2023; Zhang et al., 2023). One way to predict the factuality of an LLM’s output without resorting to resource-intensive fact-checking procedures is by examining its uncertainty over a user query. Moreover, accurate measurement of a model’s confidence in its generated responses can enable the rejection of answers with high uncertainty, potentially reducing hallucinations and improving the factuality of the output (Geng et al., 2023; Wang et al., 2023).
Although Uncertainty Quantification (UQ) is a well-researched area in the broader field of machine learning (Gawlikowski et al., 2023), its application in the context of LLMs remains relatively under-explored. One primary limitation is that previous studies on UQ mostly require access to a model’s internal states (e.g. logits) (Murray and Chiang, 2018; Kuhn et al., 2022; Vazhentsev et al., 2023; Duan et al., 2023). However, many of the most advanced LLMs, such as GPT-4 (OpenAI, 2023), Gemini Pro (Gemini Team, 2023), and Claude 2.1 (Anthropic, 2023), are closed-source and only accessible via API calls. This limits the ability to directly analyze their internal processes. Another challenge is that existing research on modeling uncertainty predominantly focuses on short responses, typically less than 10 words in length (Kuhn et al., 2022; Duan et al., 2023; Lin et al., 2023). This is in stark contrast to the more common use cases of LLMs, where responses to queries often far exceed this length, sometimes reaching hundreds of words. Such disparity points to a need for new UQ methods tailored for long-form text generated by LLMs. Therefore, in this study we aim to answer the following research questions: RQ1: Are existing UQ methods still effective in the context of long-text generation? RQ2: If not, how can we effectively quantify LLMs’ uncertainty for long-form answers? RQ3: In what ways can uncertainty scores be utilized to enhance the factuality of model outputs?
Our experiments primarily focus on black-box LLMs, with an emphasis on using factuality as the key metric to evaluate the models’ performance. The main contributions of this paper are:
-
•
We first highlight the limitations of existing UQ methods for long text generation and subsequently propose Luq (Long-text Uncertainty Quantification; pronounced as “luck”), a novel UQ method that computes sentence-level consistency in long text scenarios.
-
•
Through extensive experiments on the FActScore dataset, we demonstrate that our proposed Luq consistently shows strong negative correlations with the responses’ factuality over 6 popular LLMs, outperforming all the baseline methods.
-
•
We propose an ensemble modeling approach that selects responses from the model exhibiting the lowest Luq uncertainty score, observing an improvement of up to 5% in the overall factuality scores. Additionally, we enhance the model’s uncertainty awareness by implementing a selective answering strategy.
2 Background
2.1 Uncertainty and Confidence
Confidence and uncertainty in the context of machine learning models pertain to the level of assurance or certainty associated with a prediction or decision (Geng et al., 2023). While many studies treat confidence and uncertainty as antonyms and use them interchangeably (Xiao et al., 2022; Chen and Mueller, 2023), Lin et al. (2023) provide a clear distinction: uncertainty denotes the dispersion of potential predictions for a given input, whereas confidence pertains to the degree of confidence in a specific prediction or output. We will adopt this terminology in the following sections.
Currently, a formal and universally accepted definition of uncertainty levels in language generation tasks remains elusive. Common practice in existing literature involves measuring uncertainty through the entropy of predictions, akin to approaches in classification tasks (Kuhn et al., 2022; Lin et al., 2023). Predictive entropy is formally expressed as , which captures the uncertainty associated with a prediction for a given input . In the context of NLG, where denotes all possible generations and is a specific response, the uncertainty score can thus be conceptualized as:
Similarly, the concept of confidence within NLG frequently adopts methodologies from classification tasks. In these tasks, confidence for a specific prediction is quantified using the predicted probability, represented as (Geifman and El-Yaniv, 2017; Hendrycks and Gimpel, 2016). In the context of NLG, the confidence score for a given response is represented by the joint probability of the tokens in the response:
2.2 Uncertainty for Long Text Generation
There are two main limitations in applying traditional uncertainty and confidence definitions to long text generation. Firstly, while these definitions mostly rely on calculating predictive entropy to estimate the model’s uncertainty, this approach is not the only option and may not always be appropriate. Secondly, they depend heavily on accessing the model’s internal states, which can be difficult to obtain.
In our study, we adopt a more flexible definition of uncertainty and confidence. We move away from the assumption that confidence must directly reflect the model’s true accuracy in real-world scenarios—a benchmark that, particularly for long text generation, may often be unattainable. Instead, our approach places a premium on the model’s ability to rank samples effectively, distinguishing between correct and incorrect predictions.
From a practical perspective, we aim for the uncertainty score to serve as a reliable indicator of the model’s performance. This performance encompasses several dimensions of generation quality, including factuality, coherence, and creativity. Notably, our study prioritizes factuality and the truthfulness of responses, adopting these as our primary metrics. The factuality of the responses given a specific query is denoted as . Considering two inputs and , we explore the relationship between the model’s uncertainty, denoted as , and the factuality. Our goal is to have:
Correspondingly, for a given input , the model’s confidence in generating a specific response is represented as . Thus, we aim to establish the following relationship:
3 Luq
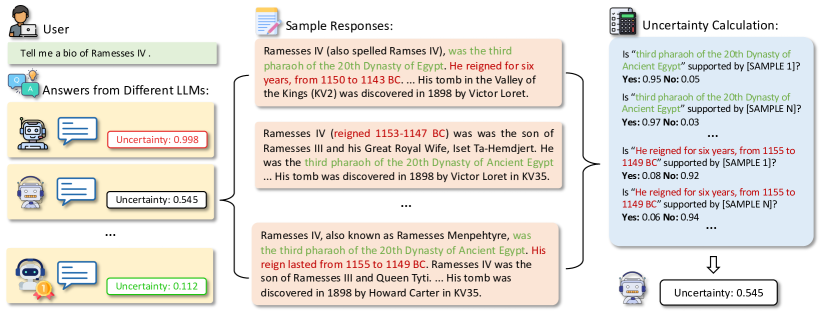
In this section, we introduce our Luq method for estimating uncertainty in long text generation. The framework is illustrated in Figure 1. Our underlying assumption posits that the greater the model’s uncertainty regarding a given question , the more diverse its responses to question will be. For instance, as shown in Figure 1, the term “third pharaoh of the 20th Dynasty of Egypt” is frequently supported by other sample responses, indicating the model’s high confidence in this information. However, the samples suggest different reign periods for Ramesses IV; the inconsistency shows the model is uncertain about this information. We begin by highlighting the limitations of previous UQ methods on dealing with long text, then formally define our Luq method that overcomes these issues.
Motivation
Following the generation of responses, traditional UQ methods for short text commonly calculate the pairwise similarity among the responses, employing either Jaccard Similarity or calculating Natural Language Inference (NLI) scores (Kuhn et al., 2022; Lin et al., 2023). These pairwise similarity scores indicate the consistency between a pair of responses and play a vital role in subsequent uncertainty estimation.
However, responses to certain queries are brief, making it relatively straightforward to distinguish between different answers. For example, for the question “What is the capital of France?”, the answers often consists of just a few words and can be easily examined. In contrast, answers to other questions such as “Give me an introduction of …” and “Tell me something about …” may extend to hundreds of words. Longer text leads to an unexpected high similarity across all response pairs when applying previous methods. To address this issue and achieve a more nuanced similarity assessment, we propose the Luq uncertainty measurement with sentence-level similarity computation. Inspired by the hallucination detection method in Manakul et al. (2023), we split each response to sentences, and check whether each sentence can be supported by other samples.
Notation
Let represent the response generated by a LLM to a user query . We generate an additional stochastic LLM sample responses using the same query. The set encompasses all outputs from the model.
For any given response , the first objective is to determine how often it is supported (or entailed) by other samples. To this end, we employ a NLI classifier to assess the similarity between and each . The output from an NLI classifier normally includes classifications of entailment, neutral, and contradiction, along with their respective logit values. It is important to note that we focus exclusively on the “entailment” and “contradiction” classes, as sentences labeled as “neutral” generally do not impact the overall factuality of a response. We calculate the NLI score for each sentence within a response , and then average these scores. Formally, the similarity score between and is defined as:
where and are the logits of the “entailment” and “contradiction” classes, respectively. We opt to calculate over because non-contradictory responses can still be largely irrelevant, indicating higher uncertainty (Lin et al., 2023). The model’s confidence in response and the overall uncertainty is therefore defined as:
Unlike Kuhn et al. (2022)’s method of applying an off-the-shelf DeBERTa model, we apply the DeBERTa-v3-large model (He et al., 2022), fine-tuned on the MultiNLI (Williams et al., 2018) dataset. This choice is due to our input being a concatenation of short hypothesis (sentence ) and a comparatively longer premises (reference response ). The format of the input aligns with the task in MultiNLI dataset, ensuring an effective assessment of consistency among the responses.
4 Experiments
| Methods | GPT-4 | GPT-3.5 | Yi-34B-Chat | Tulu-2-70B | Gemini Pro | Vicuna-33B | ||||||
|---|---|---|---|---|---|---|---|---|---|---|---|---|
| PCC | SCC | PCC | SCC | PCC | SCC | PCC | SCC | PCC | SCC | PCC | SCC | |
| LexSimilarity | -45.25 | -35.97 | -67.75 | -52.45 | -70.09 | -68.23 | -55.69 | -61.84 | -67.24 | -63.73 | -38.28 | -50.62 |
| Eccentricity | -24.83 | -12.74 | -10.61 | -26.46 | -27.63 | -44.97 | -2.13 | 10.12 | -50.27 | -57.79 | -18.72 | -13.98 |
| NumSemSets | -8.24 | 4.18 | -11.90 | -17.02 | -25.69 | -31.34 | -20.68 | -18.07 | -52.98 | -57.02 | -20.04 | -16.65 |
| EigValLaplacian | -36.94 | -18.72 | -30.30 | -34.60 | -48.97 | -51.12 | -50.08 | -50.29 | -72.73 | -69.68 | -60.49 | -61.74 |
| DegMat | -3.78 | 6.73 | -22.44 | -22.85 | -39.82 | -38.94 | -53.39 | -53.97 | -64.37 | -67.69 | -58.25 | -62.38 |
| SelfCheckNLI | -53.12 | -41.79 | -65.14 | -61.07 | -70.34 | -72.69 | -75.63 | -76.89 | -84.49 | -82.37 | -66.82 | -66.48 |
| Luq | -60.37 | -45.28 | -71.30 | -66.62 | -73.78 | -74.59 | -77.58 | -75.39 | -85.09 | -81.29 | -71.79 | -70.78 |
4.1 Dataset, Metric, and LLM Selection
Dataset
We use FActScore (Min et al., 2023) to assess the generated text’s factuality. We chose it as the dataset for two main reasons: firstly, we emphasize the critical importance of factuality in text generation, arguing that LLMs generated text should prioritize truthfulness. We hypothesize that increased uncertainty in a model correlates with the production of factually inaccurate information. Secondly, FActScore allows for automated evaluation with a low error rate (below 2%), making it scalable for applying to a wide array of new LLMs without human annotation. The dataset includes 500 individuals from Wikidata with corresponding Wikipedia entries.
Metrics
For each generated response, FActScore calculates a factuality score (FS). It first breaks down the response into a series of atomic facts, which are concise statements that capture a single piece of information. It then assigns a binary label to each atomic fact and calculate the precision as the response’s factuality score. We apply FActScore for the first generated response (). As the LLMs may sometime refuse to answer certain questions, to have a fair comparison, we introduce a penalized factuality score (PFS) and penalized uncertainty score (PUS). To calculate PFS and PUS, we assign a factuality score of zero and uncertainty score of one to questions that models opt not to answer.
We then proceed to calculate both the Pearson Correlation Coefficient (PCC) and Spearman Correlation Coefficient (SCC) between the factuality scores and uncertainty scores. Following the criteria proposed by Schober et al. (2018), we classify the correlation coefficients into five categories based on their absolute values: over 0.9 indicates a very strong correlation; 0.7 to 0.9 signifies strong; 0.5 to 0.7 suggests moderate; 0.3 to 0.5 denotes weak; 0.1 to 0.3 implies very weak; and below 0.1 means negligible correlation.
LLMs
We selected six top-performing LLMs from the Arena Leaderboard (Zheng et al., 2023) for our experiments. Within our access rights, we chose three closed-sourced models: GPT-4 (OpenAI, 2023), GPT-3.5 (OpenAI, 2022), and Gemini Pro (Gemini Team, 2023); and three open-sourced models: Yi-34B-Chat (01.ai, 2023), Tulu-2-70B (Ivison et al., 2023), and Vicuna-33B (Zheng et al., 2023). For each LLM, we include the following baseline UQ methods for comparison. Our implementation is based on the LM-Polygraph framework as proposed by Fadeeva et al. (2023). More details are provided in Appendix A.
4.2 Baselines for UQ
LexicalSimilarity (Fomicheva et al., 2020): it computes the similarity between two phrases using metrics like ROUGE scores and BLEU. For our experiment, we utilize BERTScore (Zhang et al., 2020) to enhance performance, computing the average similarity score with other answers.
NumSemSets (Lin et al., 2023): it clusters semantically equivalent answers into the same sets. Initially, the number of semantic sets equals the total number of generated answers. Then it sequentially examines responses, making pairwise comparisons between them, and combines different answers. One of the limitation of this method is that the uncertainty score can only take integer values. EigValLaplacian is therefore designed to overcome this problem.
EigValLaplacian (Lin et al., 2023): For a similarity matrix , it calculates the Normalized Graph Laplacian of using , where is a diagonal matrix and ( is the number of responses). Consequently, the uncertainty score is defined as . This value is a continuous analogue of . In extreme case if adjacency matrix is binary these two measures will coincide.
DegMat (Lin et al., 2023): it is based on the idea that the total uncertainty of the answers might be measured as a corrected trace of the diagonal matrix . This is because elements on the diagonal of matrix D are sums of similarities between the given answer and other answers. We thus define uncertainty estimate .
Eccentricity (Lin et al., 2023): A drawback of previously considered methods is the limited knowledge of the actual embedding space for the different answers since we only have measures of their similarities. The graph Laplacian, however, can provide us with coordinates for the responses. Denote as the eigenvectors of that correspond to smallest eigenvalues. We can efficiently construct an informative embedding for an answer . Then it uses the average distance from center as the uncertainty measure, defined as : , where .
SelfCheckNLI
4.3 Uncertainty Quantification Results
| FS | PFS | US | PUS | RR | |
|---|---|---|---|---|---|
| GPT-4 | 80.76 | 72.37 | 20.75 | 28.98 | 86.62 |
| GPT-3.5 | 68.25 | 67.31 | 25.71 | 25.71 | 100 |
| Yi-34B-Chat | 55.71 | 55.71 | 41.25 | 41.25 | 100 |
| Tulu-2-70B | 47.19 | 47.19 | 55.83 | 55.83 | 100 |
| Gemini Pro | 43.20 | 42.73 | 61.74 | 62.17 | 98.90 |
| Vicuna-33B | 42.47 | 42.47 | 55.31 | 55.31 | 100 |
Effectiveness of Luq
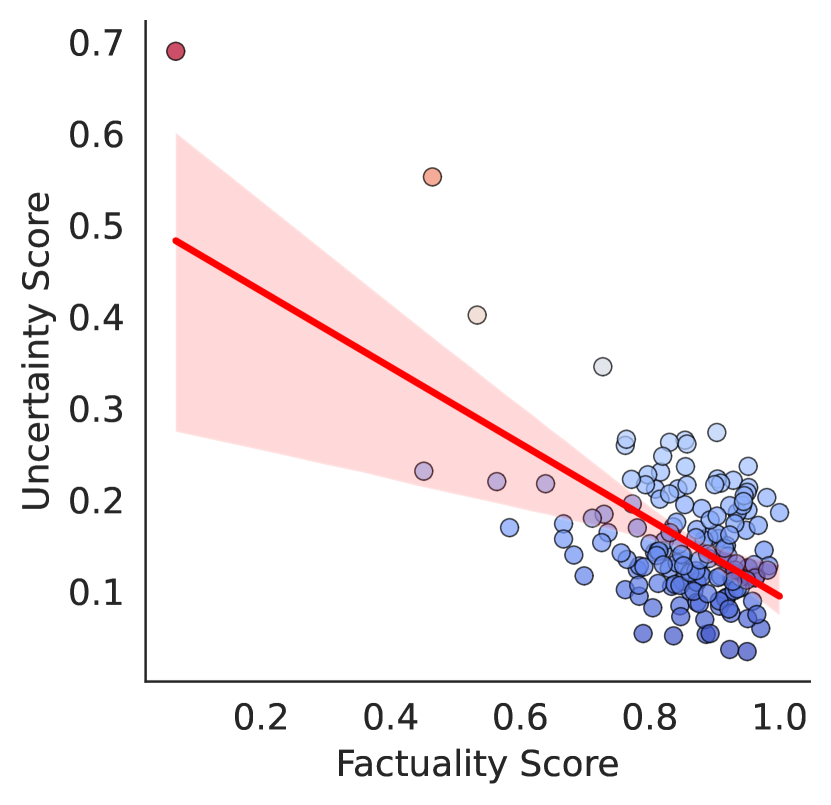
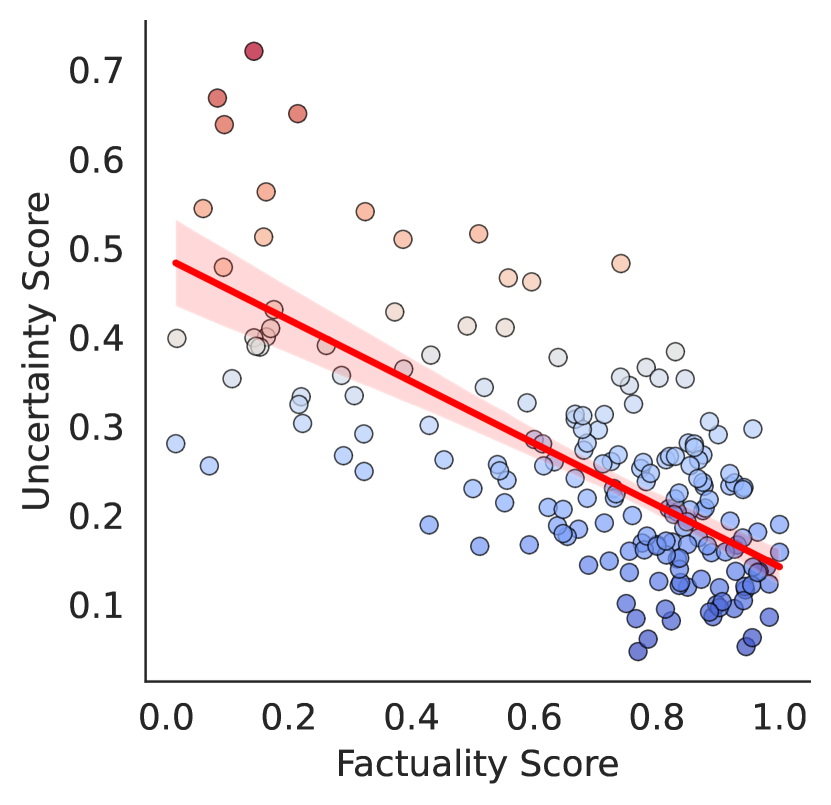
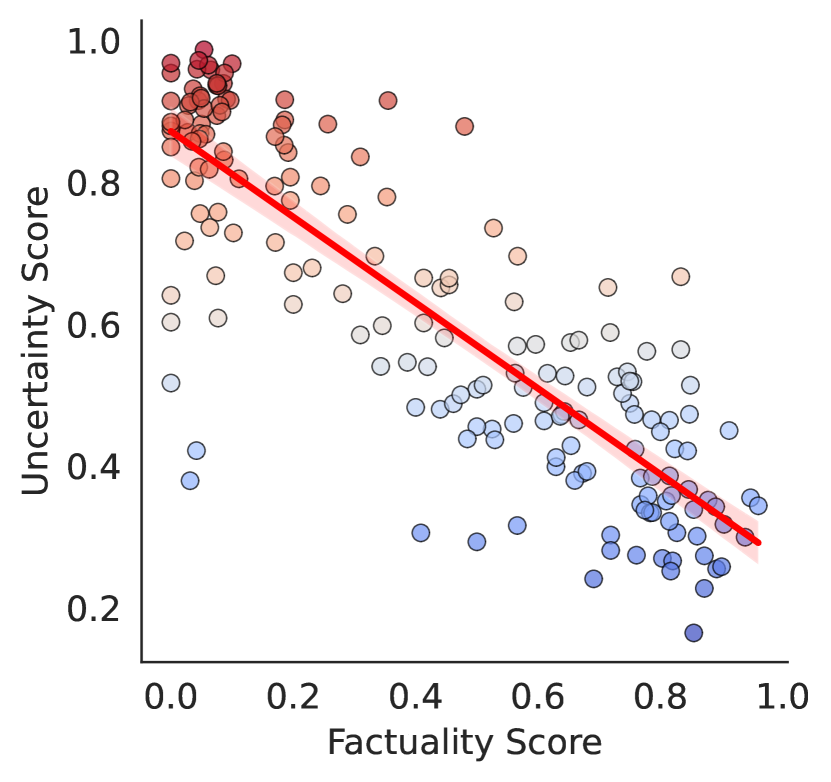
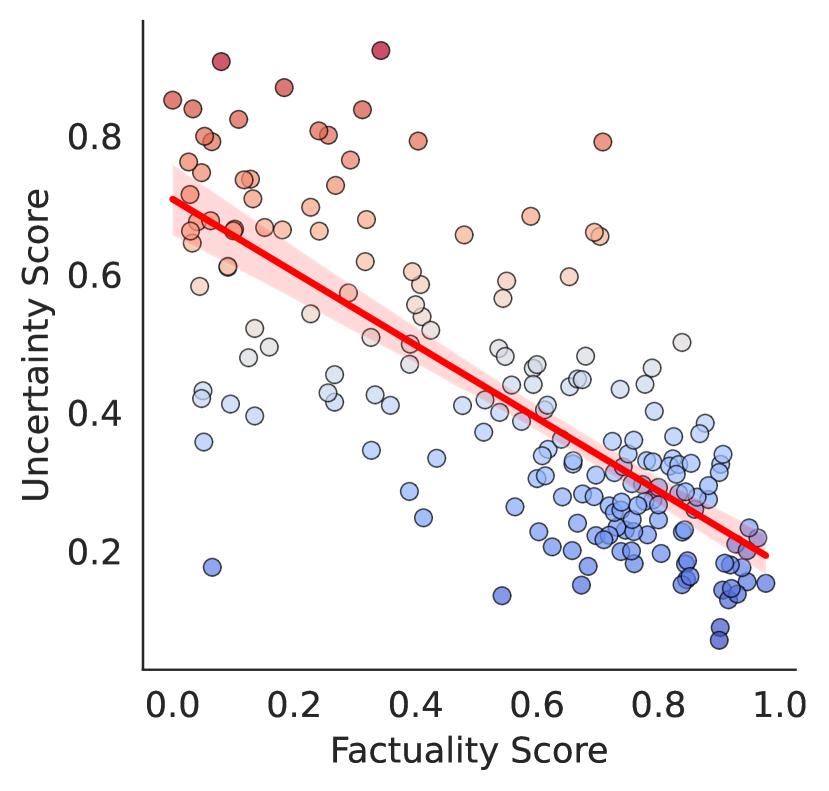
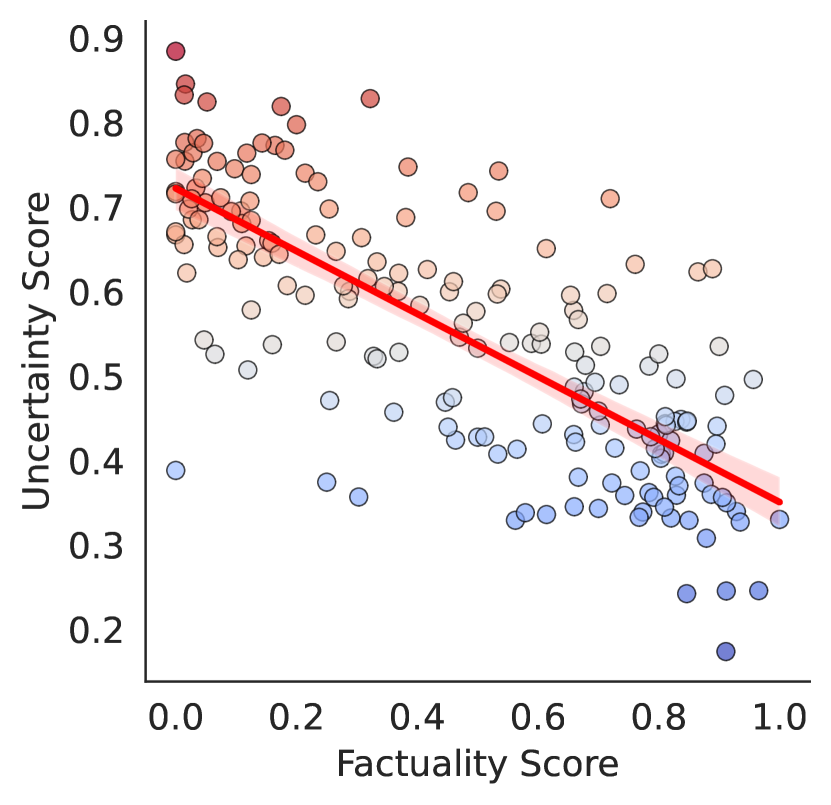
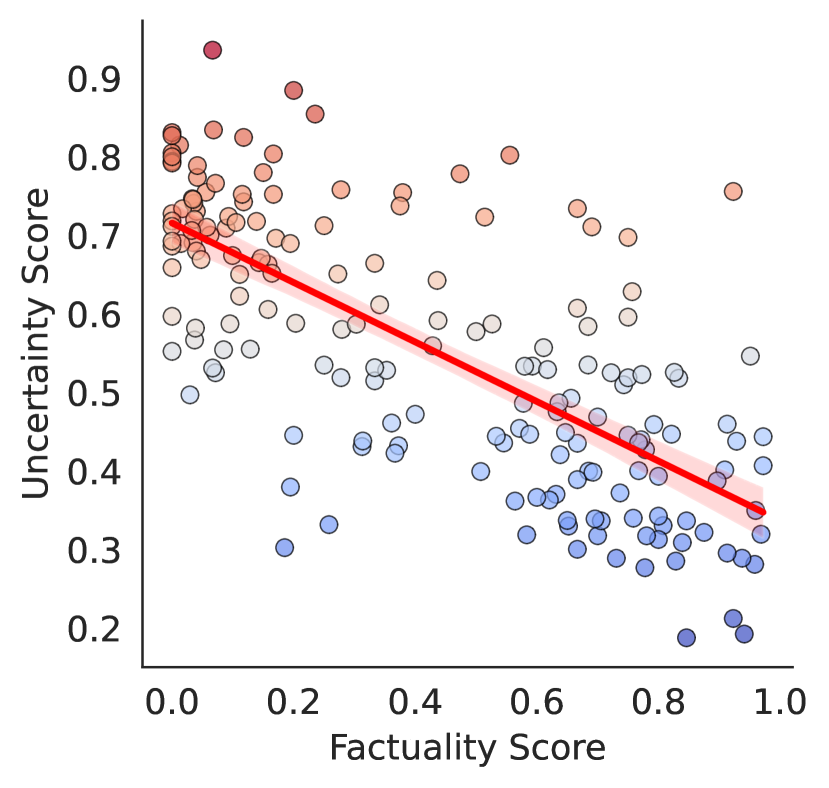
Table 1 and Figure 2 illustrate the correlation between factuality scores and uncertainty scores. The results highlight Luq’s effectiveness as an indicator of model factuality in long text generation tasks. Luq demonstrates a strong negative correlation for GPT-3.5, Gemini Pro, Yi-34B-Chat, Vicuna-33B, and Tulu-2-70B, with the strongest Pearson correlation being -0.8509.
For the baseline methods, LexSimilarity emerges as a robust baseline offering lower computational demands. EigValLaplacian have competing performance with LexSimilarity in models like Gemini Pro and Vicuna-33B. The confidence-based SelfCheckNLI method demonstrates the best Spearman correlation in models such as Gemini Pro and Tulu-2-70B. Other baselines such as Eccentricity, NumSemSets and DegMat yield unsatisfactory results, occasionally exhibiting even positive correlations.
We also observe that Luq is better suited for models with relatively lower factuality and a lack of self-awareness regarding uncertainty. For models with high factuality capabilities, such as GPT-4, Luq only demonstrates a moderate correlation with factuality scores. As indicated in Table 2 and Figure 2(a), among all models, GPT-4 exhibits the highest overall factuality scores and the lowest average uncertainty scores. The data points are tightly clustered with only few instances of uncertainty. Moreover, GPT-4’s self-awareness of uncertainty may also impact external UQ efficiency, as it tends to abstain from answering questions more often compared to other models, highlighting its heightened internal uncertainty awareness. This observation does not influence the effectiveness of our method, as in real life models with lower factuality and unable to express uncertainty are in greater need of external uncertainty measurements.
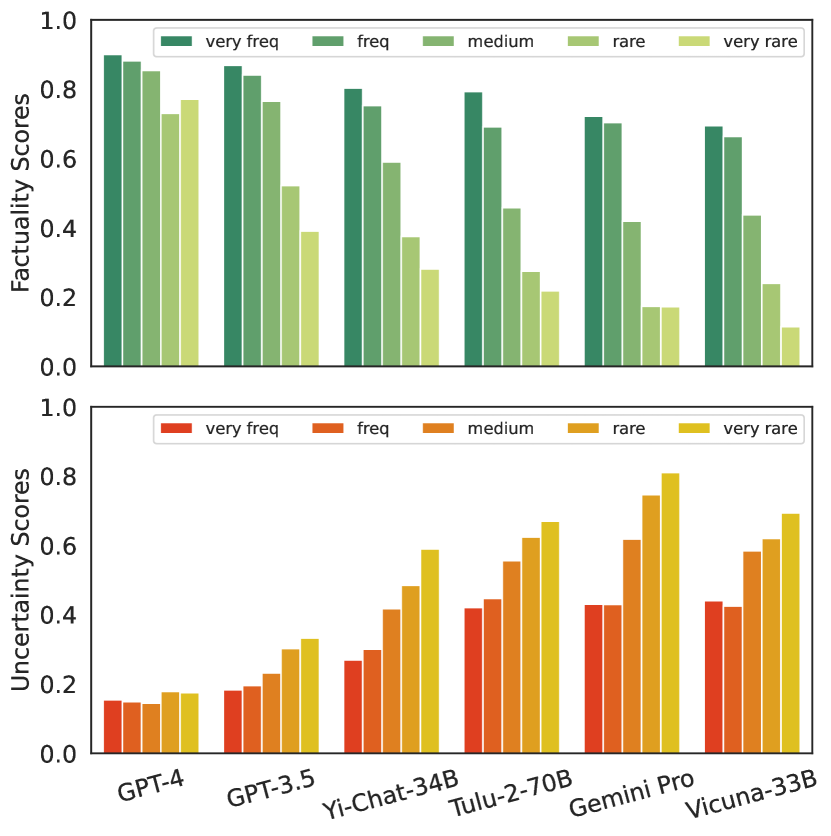
Higher frequency leads to higher factuality and lower uncertainty.
In Figure 3, we compare the factuality and uncertainty scores across different entity frequencies. The original FActScore dataset provides the frequency of each entity in Wikipedia, categorizing them based on page views and co-occurrence within the training set (Min et al., 2023). Frequencies are classified into five categories, ranging from “very rare” to “very frequent.” Our observations suggest that questions associated with higher entity frequencies tend to yield more factual responses, alongside decreased model uncertainty. Notably, GPT-4 demonstrates consistent performance regarding uncertainty and factuality across varying frequencies, potentially attributable to its selective response strategy. Although it answers all the questions in the “very frequent,” “frequent,” and “medium” categories, it refuses to answer around 25% of “rare” questions and 30% of “very rare” questions.
| GPT-3.5 | Yi-34B-Chat | Tulu-2-70B | Vicuna-33B | Gemini-Pro | ||||||
|---|---|---|---|---|---|---|---|---|---|---|
| Percentile | FS | US | FS | US | FS | US | FS | US | FS | US |
| 0 | 68.25 | 25.71 | 55.71 | 41.25 | 47.19 | 55.83 | 42.47 | 55.31 | 43.20 | 61.74 |
| 2.5 | 69.80 | 24.07 | 56.91 | 40.24 | 48.28 | 53.86 | 43.59 | 54.41 | 44.28 | 60.05 |
| 5 | 70.82 | 23.40 | 57.99 | 39.28 | 49.35 | 53.13 | 44.54 | 53.76 | 45.20 | 59.23 |
| 7.5 | 71.52 | 22.66 | 58.86 | 38.12 | 50.27 | 52.57 | 45.54 | 52.97 | 46.34 | 58.19 |
| 10 | 72.30 | 22.18 | 60.21 | 36.79 | 51.45 | 51.87 | 46.14 | 52.34 | 47.25 | 57.73 |
| 12.5 | 74.13 | 21.61 | 61.69 | 35.04 | 52.13 | 51.31 | 46.53 | 51.58 | 48.41 | 56.29 |
| 15 | 75.04 | 21.17 | 62.91 | 34.18 | 53.29 | 50.63 | 47.52 | 50.96 | 49.51 | 55.40 |
| Methods | PFS | PUS | AD |
|---|---|---|---|
| Tulu-2-70B | 47.19 | 55.83 | 42.08 |
| Gemini Pro | 42.73 | 62.17 | 29.51 |
| Vicuna-33B | 42.47 | 58.06 | 28.41 |
| Luq-Ensemble | 52.83 | 45.83 | 100 |
| Yi-34B-Chat | 55.71 | 41.25 | 66.12 |
| Tulu-2-70B | 47.19 | 55.83 | 21.31 |
| Gemini Pro | 42.73 | 62.17 | 12.57 |
| Luq-Ensemble | 58.75 | 37.60 | 100 |
| GPT-3.5 | 67.31 | 25.71 | 92.35 |
| Gemini Pro | 42.73 | 62.17 | 1.64 |
| Vicuna-33B | 42.47 | 58.06 | 6.01 |
| Luq-Ensemble | 67.37 | 24.75 | 100 |
| GPT-4 | 72.11 | 28.98 | 60.11 |
| GPT-3.5 | 67.31 | 25.71 | 32.79 |
| Yi-34B-Chat | 55.71 | 41.25 | 7.10 |
| Luq-Ensemble | 76.61 | 17.27 | 100 |
4.4 Luq-Ensemble
Given the variance in training corpus, different LLMs may possess varying levels of knowledge for a specific question, leading to discrepancies in uncertainty levels across models. Utilizing the Luq uncertainty score as a reliable indicator of factuality, we enhance overall performance through an ensemble approach. In this method, the model exhibiting the lowest Luq score for a given question is chosen as the final answer. Experimental results (Table 4) affirm the superiority of the Luq-Ensemble over its constituent counterparts.
Furthermore, we observe that ensembling models with similar factuality scores can notably enhance performance. For instance, in the combination of Tulu-2-70B, Gemini Pro, and Vicuna-33B, the PFS increases by 5% compared to the originally top-performing Tulu-2-70B, which scored 47.19%. Combining more comparable models also results in a more balanced answer distribution. In contrast, integrating a model with substantially superior performance, as seen in the combination of GPT-3.5, Gemini Pro, and Vicuna-33B, predominantly favors answers from GPT-3.5 (92.35%), leading to marginal improvement (0.06%) in the ensemble method.
To provide a more detailed analysis, Table 4 includes an ensemble of the top three models with the highest factuality scores: GPT-4, GPT-3.5, and Yi-34B-Chat. The results indicate that the majority of answers are generated by GPT-4 and GPT-3.5, accounting for 92.90%. However, the improvement in PFS primarily stems from questions that GPT-4 refuses to answer. They are given a factuality score of zero and an uncertainty score of one for penalty. This underscores a pivotal decision point for practitioners regarding model behavior in the face of uncertainty: whether the model should attempt to answer even though it is uncertain or opt to abstain.
4.5 Selective Question Answering
From Table 2, it is observed that while GPT-4 opts not to respond to some queries, other models generally attempt to answer all questions. The limited refusal by Gemini Pro primarily stems from considerations of sensitive content and regulatory constraints, rather than uncertainty111Gemini Pro API returns the reasons of refusing to answer certain questions.. Therefore, we investigate the application of the Luq score to equip these models with the capability for selective question answering—that is, to enable them to decline responses when uncertain. Contrary to the traditional aim of responding correctly to every question, the objective in a selective question answering framework is to preserve accuracy while maximizing the number of questions answered (Kamath et al., 2020; Cole et al., 2023; Yang et al., 2023).
Table 3 presents the results of selective question answering. The models are permitted to refrain from answering questions with high uncertainty. The percentiles indicate the proportion of questions each model abstained from answering. The findings demonstrate that adopting a selective answering approach enhances the models’ factuality by allowing for more question rejections. By declining to answer a similar proportion of questions (approximately 15%) as GPT-4, the models typically achieve an improvement of over 5% in overall factuality scores. Notably, when implementing this selective answering strategy in practical applications, it is essential for practitioners to tailor the uncertainty thresholds to the specific models and tasks at hand.
4.6 Ablation Study
Temperature
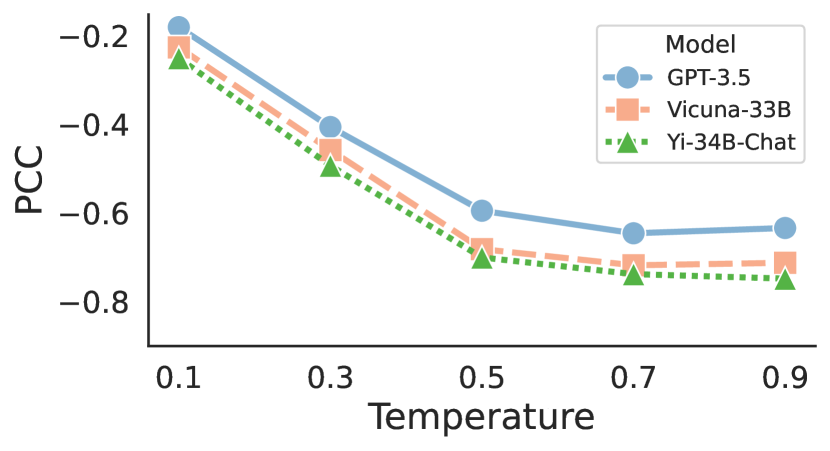
As the diversity of content generated by LLMs may be influenced by the temperature setting, we adjust the temperature to test the robustness of our methods. Due to limitations in computational resources and API budget constraints, we selected GPT-3.5, Yi-34B-Chat, and Vicuna-33B for our experiments (refer to Figure 4). Our findings indicate that a lower temperature leads to a weaker correlation score, likely because the generated responses are more uniform, providing limited information for the self-consistency test. As the temperature increases, we observe a strengthening in correlation. However, beyond a certain point, further increases in temperature lead to diminishing improvements and can even result in a weaker correlation. We hypothesize that excessively diverse responses may complicate the NLI process, as a greater number of sentences fail to be supported by other samples.
Number of Samples
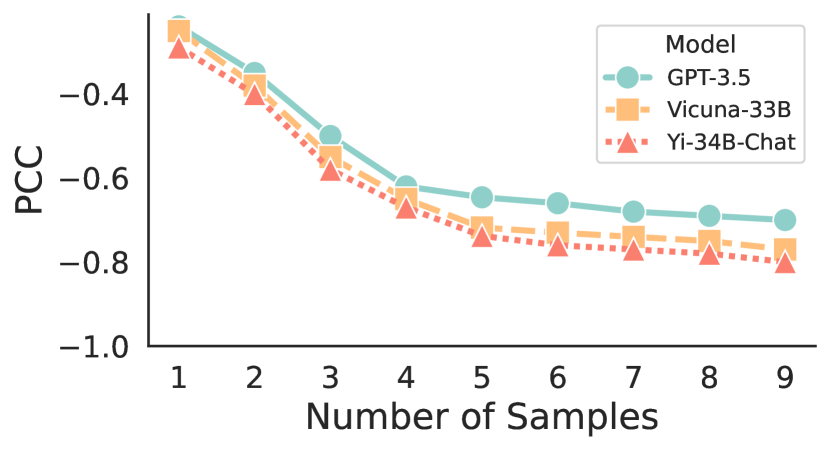
Previous research on short answer generation (Kuhn et al., 2022; Lin et al., 2023) has demonstrated that an increase in the number of samples correlates with enhanced performance. We investigate whether it also applies to long-text generation and find that with more samples, Luq shows better performance and PCC scores, which corroborates with previous observations in short-text generation, as depicted in Figure4. Providing a greater number of samples enables the NLI process to predict sentence factuality with higher accuracy. However, a notable drawback of increasing the sample size is the associated rise in computational costs.
5 Related Work
UQ in Machine Learning
Prior to LLMs, UQ has been extensively explored within the field of machine learning (Gawlikowski et al., 2023). According to the source of uncertainty, it is typically categorized into two types: aleatoric and epistemic uncertainty(Hora, 1996; Der Kiureghian and Ditlevsen, 2009). Aleatoric uncertainty, also known as statistical uncertainty, pertains to the inherent randomness in experimental outcomes due to stochastic effects (Hüllermeier and Waegeman, 2021). In contrast, epistemic uncertainty stems from incomplete knowledge, potentially including uncertainties in a machine learning model’s parameters or the lack of certain training data (Hüllermeier and Waegeman, 2021; Huang et al., 2023). Our focus is primarily on epistemic uncertainty.
Gawlikowski et al. (2023) categorized uncertainty estimation into four types: (1) Single deterministic methods use a single pass in a deterministic network for predictions (Oberdiek et al., 2018; Lee and AlRegib, 2020); (2) Bayesian methods encompass various types of stochastic neural networks, where predictions are stochastic, each determined by differing model weights (Gal and Ghahramani, 2016; Welling and Teh, 2011; Lee et al., 2020); (3) Ensemble methods merge outputs from several deterministic networks, valuing model diversity (Wen et al., 2019; Lakshminarayanan et al., 2017); (4) Test-time augmentation methods generate multiple predictions through input data augmentation at test-time in a deterministic network (Lyzhov et al., 2020; Kim et al., 2020). Our method aligns with test-time augmentation but repeats identical questions at inference without data augmentation.
UQ in LLMs
In contrast to discriminative models, which readily provide probability scores for specific categories, uncertainty estimation in generative LLMs presents unique challenges: (1) There is an exponential increase in the output space as sentence length grows, rendering the evaluation of all possible predictions impractical (Geng et al., 2023; Wang et al., 2023). (2) The significance of semantic nuances and their inherent uncertainties, which diverges from the fixed category labels typical of discriminative models, complicates matters further (Kuhn et al., 2022). Generally, UQ methods for LLMs can be categorized based on the accessibility of the model’s internal states, distinguishing between black-box and white-box approaches. White-box LLMs often rely on logit-based evaluations, assessing sentence uncertainty through token-level probabilities or entropy (Murray and Chiang, 2018; Kuhn et al., 2022; Vazhentsev et al., 2023; Duan et al., 2023).
However, as access to LLMs increasingly relies on API calls, research has pivoted towards black-box methods. These can be further categorized into: (i) verbalized methods, which prompt LLMs to articulate their uncertainty in the output, using phrases like “I am sure" or “I do not know" (Mielke et al., 2022). Nonetheless, a practical mismatch between the expressed and actual uncertainty levels has been noted (Lin et al., 2022; Xiong et al., 2023). Xiong et al. (2023) highlight that LLMs often display excessive confidence when verbalizing their certainty. (ii) Consistency-based (sampling-based) estimation premises on the assumption that increased uncertainty in a model corresponds to greater diversity in its outputs, frequently resulting in hallucinatory outputs (Manakul et al., 2023; Lin et al., 2023). Our proposed method, MutualNLI, follows this consistency-based approach. There are also efforts on integrating verbalized methods with consistency-based approaches (Xiong et al., 2023; Rivera et al., 2024).
6 Conclusion
In this work, we first identify that existing UQ methods are ineffective on long text generation. We therefore introduce Luq, a novel UQ method tailored for long-form text generation in LLMs. It overcomes the limitation of previous methods by calculating sentence level consistency. We conduct extensive experiments over six popular LLMs, such as GPT-4 and Gemini Pro. Our findings demonstrate that Luq significantly improves the correlation with models’ factuality scores over previous methods. Luq serves as a reliable indicator of model’s factuality performance. Additionally, we present Luq-Ensemble, a model ensembling and selective question answering strategy, which showcases a promising avenue for enhancing the factual accuracy of LLM outputs. This research not only advances our understanding of UQ in the context of LLMs but also offers practical tools for improving the reliability and trustworthiness of AI-generated content.
Limitation
The limitations of this study include the following: (1) A primary challenge in studying uncertainty quantification for long text generation lies in the difficulty of evaluating the generated text. Unlike classification tasks and short-answer QA, there is no straightforward metric for assessing the quality of generated text. In this study, we employ the factuality score as the primary evaluation metric, thereby leaving other text aspects, such as coherence, cohesion, and creativity, under-explored. Future work could investigate uncertainty scores using more comprehensive evaluation metrics. (2) Fact-checking for long text generation is costly, especially when involving human annotation. While we utilized FActScore as an automated evaluation tool, it still requires numerous API calls to fact-check each piece of information. The development of more cost-effective evaluation metrics or datasets could allow for the expansion of the experimental scope. (3) We discovered that temperature plays a crucial role in measuring uncertainty. A common limitation among all consistency-based uncertainty quantification methods is their effectiveness only at high temperatures. In practice, if some scenarios necessitate a fixed low temperature, these consistency-based UQ methods may not perform effectively.
Ethics Statement
Our research strictly follows ethical guidelines, focusing on data privacy, bias mitigation, and societal impact. We use the publicly available FActScore dataset, which ensures a balanced representation of different nationalities. Our code usage complies with original licensing agreements and is strictly for academic purposes, reflecting our commitment to ethical research standards.
References
- 01.ai (2023) 01.ai. 2023. Building the next generation of open-source and bilingual llms. https://huggingface.co/01-ai/Yi-34B-Chat. Accessed: 2024-02-05.
- Anthropic (2023) Anthropic. 2023. Introducing claude 2.1. Available from Anthropic: https://www.anthropic.com/news/claude-2-1.
- Chang et al. (2023) Yupeng Chang, Xu Wang, Jindong Wang, Yuan Wu, Linyi Yang, Kaijie Zhu, Hao Chen, Xiaoyuan Yi, Cunxiang Wang, Yidong Wang, et al. 2023. A survey on evaluation of large language models. ACM Transactions on Intelligent Systems and Technology.
- Chen and Mueller (2023) Jiuhai Chen and Jonas Mueller. 2023. Quantifying uncertainty in answers from any language model and enhancing their trustworthiness.
- Cole et al. (2023) Jeremy Cole, Michael Zhang, Daniel Gillick, Julian Eisenschlos, Bhuwan Dhingra, and Jacob Eisenstein. 2023. Selectively answering ambiguous questions. In Proceedings of the 2023 Conference on Empirical Methods in Natural Language Processing, pages 530–543, Singapore. Association for Computational Linguistics.
- Der Kiureghian and Ditlevsen (2009) Armen Der Kiureghian and Ove Ditlevsen. 2009. Aleatory or epistemic? does it matter? Structural safety, 31(2):105–112.
- Duan et al. (2023) Jinhao Duan, Hao Cheng, Shiqi Wang, Chenan Wang, Alex Zavalny, Renjing Xu, Bhavya Kailkhura, and Kaidi Xu. 2023. Shifting attention to relevance: Towards the uncertainty estimation of large language models. arXiv preprint arXiv:2307.01379.
- Fadeeva et al. (2023) Ekaterina Fadeeva, Roman Vashurin, Akim Tsvigun, Artem Vazhentsev, Sergey Petrakov, Kirill Fedyanin, Daniil Vasilev, Elizaveta Goncharova, Alexander Panchenko, Maxim Panov, Timothy Baldwin, and Artem Shelmanov. 2023. LM-polygraph: Uncertainty estimation for language models. In Proceedings of the 2023 Conference on Empirical Methods in Natural Language Processing: System Demonstrations, pages 446–461, Singapore. Association for Computational Linguistics.
- Fomicheva et al. (2020) Marina Fomicheva, Shuo Sun, Lisa Yankovskaya, Frédéric Blain, Francisco Guzmán, Mark Fishel, Nikolaos Aletras, Vishrav Chaudhary, and Lucia Specia. 2020. Unsupervised quality estimation for neural machine translation. Transactions of the Association for Computational Linguistics, 8:539–555.
- Gal and Ghahramani (2016) Yarin Gal and Zoubin Ghahramani. 2016. Dropout as a bayesian approximation: Representing model uncertainty in deep learning. In international conference on machine learning, pages 1050–1059. PMLR.
- Gawlikowski et al. (2023) Jakob Gawlikowski, Cedrique Rovile Njieutcheu Tassi, Mohsin Ali, Jongseok Lee, Matthias Humt, Jianxiang Feng, Anna Kruspe, Rudolph Triebel, Peter Jung, Ribana Roscher, et al. 2023. A survey of uncertainty in deep neural networks. Artificial Intelligence Review, 56(Suppl 1):1513–1589.
- Geifman and El-Yaniv (2017) Yonatan Geifman and Ran El-Yaniv. 2017. Selective classification for deep neural networks. Advances in neural information processing systems, 30.
- Gemini Team (2023) Gemini Team. 2023. Gemini: A family of highly capable multimodal models. Technical report, Google.
- Geng et al. (2023) Jiahui Geng, Fengyu Cai, Yuxia Wang, Heinz Koeppl, Preslav Nakov, and Iryna Gurevych. 2023. A survey of language model confidence estimation and calibration. arXiv preprint arXiv:2311.08298.
- He et al. (2022) Pengcheng He, Jianfeng Gao, and Weizhu Chen. 2022. Debertav3: Improving deberta using electra-style pre-training with gradient-disentangled embedding sharing. In The Eleventh International Conference on Learning Representations.
- Hendrycks and Gimpel (2016) Dan Hendrycks and Kevin Gimpel. 2016. A baseline for detecting misclassified and out-of-distribution examples in neural networks. arXiv preprint arXiv:1610.02136.
- Hora (1996) Stephen C Hora. 1996. Aleatory and epistemic uncertainty in probability elicitation with an example from hazardous waste management. Reliability Engineering & System Safety, 54(2-3):217–223.
- Huang et al. (2023) Yuheng Huang, Jiayang Song, Zhijie Wang, Huaming Chen, and Lei Ma. 2023. Look before you leap: An exploratory study of uncertainty measurement for large language models. arXiv preprint arXiv:2307.10236.
- Hüllermeier and Waegeman (2021) Eyke Hüllermeier and Willem Waegeman. 2021. Aleatoric and epistemic uncertainty in machine learning: An introduction to concepts and methods. Machine Learning, 110:457–506.
- Ivison et al. (2023) Hamish Ivison, Yizhong Wang, Valentina Pyatkin, Nathan Lambert, Matthew Peters, Pradeep Dasigi, Joel Jang, David Wadden, Noah A. Smith, Iz Beltagy, and Hannaneh Hajishirzi. 2023. Camels in a changing climate: Enhancing lm adaptation with tulu 2.
- Kamath et al. (2020) Amita Kamath, Robin Jia, and Percy Liang. 2020. Selective question answering under domain shift. In Proceedings of the 58th Annual Meeting of the Association for Computational Linguistics, pages 5684–5696, Online. Association for Computational Linguistics.
- Kim et al. (2020) Ildoo Kim, Younghoon Kim, and Sungwoong Kim. 2020. Learning loss for test-time augmentation. Advances in Neural Information Processing Systems, 33:4163–4174.
- Kuhn et al. (2022) Lorenz Kuhn, Yarin Gal, and Sebastian Farquhar. 2022. Semantic uncertainty: Linguistic invariances for uncertainty estimation in natural language generation. In The Eleventh International Conference on Learning Representations.
- Lakshminarayanan et al. (2017) Balaji Lakshminarayanan, Alexander Pritzel, and Charles Blundell. 2017. Simple and scalable predictive uncertainty estimation using deep ensembles. Advances in neural information processing systems, 30.
- Lee and AlRegib (2020) Jinsol Lee and Ghassan AlRegib. 2020. Gradients as a measure of uncertainty in neural networks. In 2020 IEEE International Conference on Image Processing (ICIP), pages 2416–2420. IEEE.
- Lee et al. (2020) Jongseok Lee, Matthias Humt, Jianxiang Feng, and Rudolph Triebel. 2020. Estimating model uncertainty of neural networks in sparse information form. In International Conference on Machine Learning, pages 5702–5713. PMLR.
- Lin et al. (2022) Stephanie Lin, Jacob Hilton, and Owain Evans. 2022. Teaching models to express their uncertainty in words. arXiv preprint arXiv:2205.14334.
- Lin et al. (2023) Zhen Lin, Shubhendu Trivedi, and Jimeng Sun. 2023. Generating with confidence: Uncertainty quantification for black-box large language models.
- Lyzhov et al. (2020) Alexander Lyzhov, Yuliya Molchanova, Arsenii Ashukha, Dmitry Molchanov, and Dmitry Vetrov. 2020. Greedy policy search: A simple baseline for learnable test-time augmentation. In Conference on Uncertainty in Artificial Intelligence, pages 1308–1317. PMLR.
- Manakul et al. (2023) Potsawee Manakul, Adian Liusie, and Mark Gales. 2023. SelfCheckGPT: Zero-resource black-box hallucination detection for generative large language models. In Proceedings of the 2023 Conference on Empirical Methods in Natural Language Processing, pages 9004–9017, Singapore. Association for Computational Linguistics.
- Mielke et al. (2022) Sabrina J. Mielke, Arthur Szlam, Emily Dinan, and Y-Lan Boureau. 2022. Reducing conversational agents’ overconfidence through linguistic calibration. Transactions of the Association for Computational Linguistics, 10:857–872.
- Min et al. (2023) Sewon Min, Kalpesh Krishna, Xinxi Lyu, Mike Lewis, Wen-tau Yih, Pang Koh, Mohit Iyyer, Luke Zettlemoyer, and Hannaneh Hajishirzi. 2023. FActScore: Fine-grained atomic evaluation of factual precision in long form text generation. In Proceedings of the 2023 Conference on Empirical Methods in Natural Language Processing, pages 12076–12100, Singapore. Association for Computational Linguistics.
- Murray and Chiang (2018) Kenton Murray and David Chiang. 2018. Correcting length bias in neural machine translation. In Proceedings of the Third Conference on Machine Translation: Research Papers, pages 212–223, Brussels, Belgium. Association for Computational Linguistics.
- Oberdiek et al. (2018) Philipp Oberdiek, Matthias Rottmann, and Hanno Gottschalk. 2018. Classification uncertainty of deep neural networks based on gradient information. In Artificial Neural Networks in Pattern Recognition: 8th IAPR TC3 Workshop, ANNPR 2018, Siena, Italy, September 19–21, 2018, Proceedings 8, pages 113–125. Springer.
- OpenAI (2022) OpenAI. 2022. Chatgpt blog post.
- OpenAI (2023) OpenAI. 2023. Gpt-4 technical report.
- Rivera et al. (2024) Mauricio Rivera, Jean-François Godbout, Reihaneh Rabbany, and Kellin Pelrine. 2024. Combining confidence elicitation and sample-based methods for uncertainty quantification in misinformation mitigation.
- Schober et al. (2018) Patrick Schober, Christa Boer, and Lothar A Schwarte. 2018. Correlation coefficients: appropriate use and interpretation. Anesthesia & analgesia, 126(5):1763–1768.
- Vazhentsev et al. (2023) Artem Vazhentsev, Akim Tsvigun, Roman Vashurin, Sergey Petrakov, Daniil Vasilev, Maxim Panov, Alexander Panchenko, and Artem Shelmanov. 2023. Efficient out-of-domain detection for sequence to sequence models. In Findings of the Association for Computational Linguistics: ACL 2023, pages 1430–1454, Toronto, Canada. Association for Computational Linguistics.
- Wang et al. (2023) Cunxiang Wang, Xiaoze Liu, Yuanhao Yue, Xiangru Tang, Tianhang Zhang, Cheng Jiayang, Yunzhi Yao, Wenyang Gao, Xuming Hu, Zehan Qi, Yidong Wang, Linyi Yang, Jindong Wang, Xing Xie, Zheng Zhang, and Yue Zhang. 2023. Survey on factuality in large language models: Knowledge, retrieval and domain-specificity.
- Welling and Teh (2011) Max Welling and Yee W Teh. 2011. Bayesian learning via stochastic gradient langevin dynamics. In Proceedings of the 28th international conference on machine learning (ICML-11), pages 681–688. Citeseer.
- Wen et al. (2019) Yeming Wen, Dustin Tran, and Jimmy Ba. 2019. Batchensemble: an alternative approach to efficient ensemble and lifelong learning. In International Conference on Learning Representations.
- Williams et al. (2018) Adina Williams, Nikita Nangia, and Samuel Bowman. 2018. A broad-coverage challenge corpus for sentence understanding through inference. In Proceedings of the 2018 Conference of the North American Chapter of the Association for Computational Linguistics: Human Language Technologies, Volume 1 (Long Papers), pages 1112–1122. Association for Computational Linguistics.
- Xiao et al. (2022) Yuxin Xiao, Paul Pu Liang, Umang Bhatt, Willie Neiswanger, Ruslan Salakhutdinov, and Louis-Philippe Morency. 2022. Uncertainty quantification with pre-trained language models: A large-scale empirical analysis. In Findings of the Association for Computational Linguistics: EMNLP 2022, pages 7273–7284, Abu Dhabi, United Arab Emirates. Association for Computational Linguistics.
- Xiong et al. (2023) Miao Xiong, Zhiyuan Hu, Xinyang Lu, Yifei Li, Jie Fu, Junxian He, and Bryan Hooi. 2023. Can llms express their uncertainty? an empirical evaluation of confidence elicitation in llms.
- Yang et al. (2023) Qi Yang, Shreya Ravikumar, Fynn Schmitt-Ulms, Satvik Lolla, Ege Demir, Iaroslav Elistratov, Alex Lavaee, Sadhana Lolla, Elaheh Ahmadi, Daniela Rus, Alexander Amini, and Alejandro Perez. 2023. Uncertainty-aware language modeling for selective question answering.
- Zhang et al. (2020) Tianyi Zhang, Varsha Kishore, Felix Wu, Kilian Q. Weinberger, and Yoav Artzi. 2020. Bertscore: Evaluating text generation with bert. In International Conference on Learning Representations.
- Zhang et al. (2023) Yue Zhang, Yafu Li, Leyang Cui, Deng Cai, Lemao Liu, Tingchen Fu, Xinting Huang, Enbo Zhao, Yu Zhang, Yulong Chen, et al. 2023. Siren’s song in the ai ocean: A survey on hallucination in large language models. arXiv preprint arXiv:2309.01219.
- Zhao et al. (2023) Wayne Xin Zhao, Kun Zhou, Junyi Li, Tianyi Tang, Xiaolei Wang, Yupeng Hou, Yingqian Min, Beichen Zhang, Junjie Zhang, Zican Dong, Yifan Du, Chen Yang, Yushuo Chen, Zhipeng Chen, Jinhao Jiang, Ruiyang Ren, Yifan Li, Xinyu Tang, Zikang Liu, Peiyu Liu, Jian-Yun Nie, and Ji-Rong Wen. 2023. A survey of large language models. arXiv preprint arXiv:2303.18223.
- Zheng et al. (2023) Lianmin Zheng, Wei-Lin Chiang, Ying Sheng, Siyuan Zhuang, Zhanghao Wu, Yonghao Zhuang, Zi Lin, Zhuohan Li, Dacheng Li, Eric. P Xing, Hao Zhang, Joseph E. Gonzalez, and Ion Stoica. 2023. Judging llm-as-a-judge with mt-bench and chatbot arena.
Appendix A Experiment Setup
For GPT-4 and GPT-3.5, we use the OpenAI API, with specific version gpt-4-turbo-0125-preview and gpt-3.5-turbo-0613. For Gemini Pro, we call the API for developers. For Yi-34B-Chat, Tulu-2-70B (tulu-2-dpo-70b), and Vicuna-33B (vicuna-33b-v1.3), we use them off-the-shelf and only for inference. We run our uncertainty measurement experiments on A100-SXM-80GB GPUs. For our experiments, we use the following prompt:
Appendix B Number of Facts in a Response
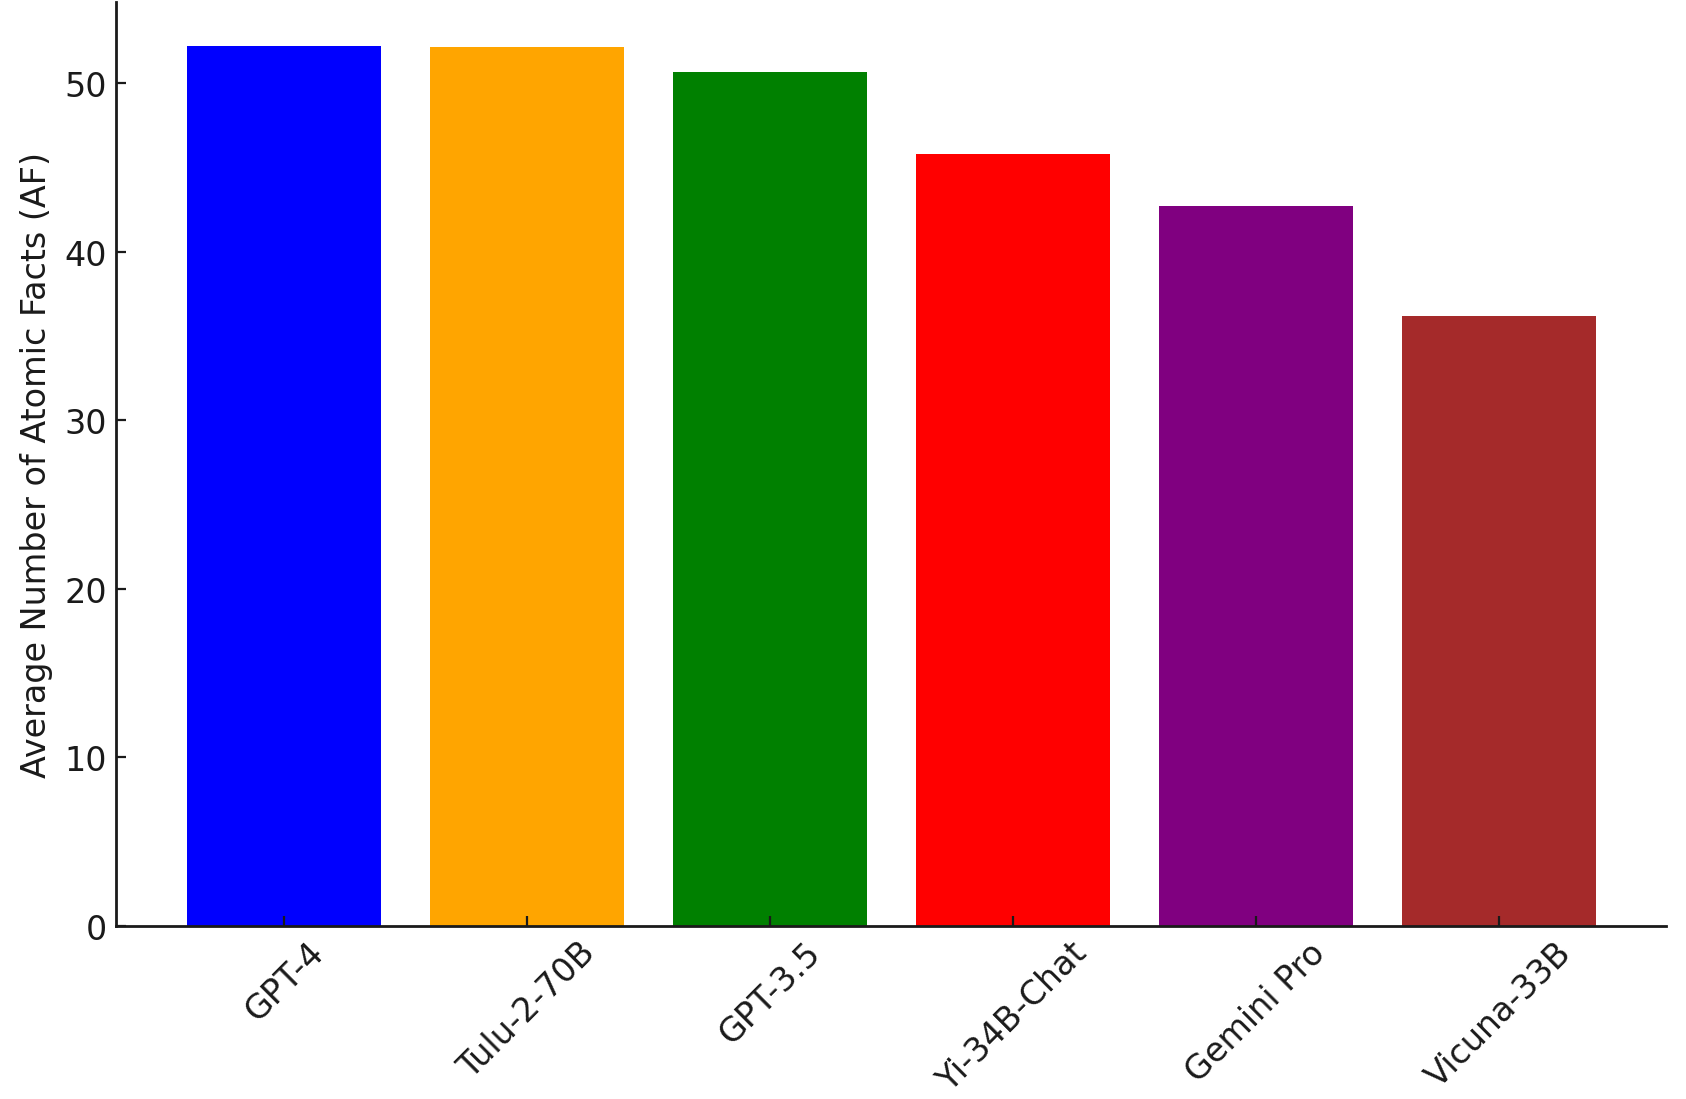
Figure 5 shows the average factual content provided by various AI models in the FactScore dataset. GPT-4 has the highest average of atomic facts at 52.24, indicating it provides the most detailed factual responses. Tulu-2-70B follows with an average of 52.17, nearly matching GPT-4 in factual detail. GPT-3.5 has an AF of 50.67, showing it also delivers a high level of factual detail in its responses. Yi-34B-Chat and Gemini Pro have lower averages, at 45.80 and 42.72 respectively. Vicuna-33B has the lowest AF at 36.20, indicating it offers the least amount of factual information in its responses. Generally, these models provide similar number of atomic facts in their responses.