Quantifying Uncertainty: All We Need is the Bootstrap?
Abstract
Standard errors, confidence intervals, hypothesis tests, and other quantifications of uncertainty are essential to statistical practice. However, they feature a plethora of different methods, mathematical formulas, and concepts. Could we not just replace them all with the general and relatively easy-to-understand non-parametric bootstrap? We contribute to answering this question with a review of related work and a simulation study of one- and two-sided confidence intervals over several different sample sizes, confidence levels, data generating processes, and functionals. Results show that double bootstrap is the overall best method and a viable alternative to typically used approaches in all but the smallest sample sizes.
keywords:
and
1 Introduction
University curricula in the social sciences, medicine, life sciences, and other fields that heavily utilize statistical methodology typically include only one or two applied statistics courses. However, it is these practitioners, rather than professional statisticians, who end up conducting most of the statistical analyses. The disparity between the level of training received and the demand for statistical analysis leads to an over-reliance on rote learning and formulaic application of statistical methods, which likely contributes to the replication crisis in science. As such, investigating all opportunities for simplifying aspects of current statistical practice is worthwhile. Such simplification could not only improve understanding and reduce mistakes but also make room in curricula for other parts of statistical methodology.
In this paper we focus on quantification of uncertainty. Standard errors, confidence intervals, and hypothesis tests are essential to statistical practice, but this part of statistical methodology typically features advanced concepts, such as test statistics and sampling distributions, and a plethora of different methods. One methods stands out, however. The bootstrap has several advantages over other methods for quantifying uncertainty. It is conceptually simple, it illustrates the central role of sampling in statistics, we can work directly with estimates and their distributions, and it can be applied to most practical tasks without having to learn new concepts or mathematical formulas. This gives bootstrapping high pedagogical value [25] and makes it an ideal candidate for a one-size-fits-all approach to quantifying uncertainty for practitioners that will receive a limited amount of statistical training.
Historically, bootstrapping was underutilized because it was computationally prohibitive. Today, that is no longer the case, yet introductory applied statistics books and courses where the bootstrap takes central stage are still rare. From our experience, this is mostly due to the convenience of following established practices, which do have better instructional materials and software (something that bootstrapping lacked [25] and still does). However, evidence that bootstrapping is indeed a viable one-size-fits-all approach to quantifying uncertainty is also too sparse to be convincing.
1.1 Related work
Theoretical cases where bootstrap fails are pathological with limited implications for practice (see [7] and [10, Ch.2.6]). Large sample properties of common bootstrap approaches have also been established (see [7] for a summary). Unfortunately, large sample theory is not always a reliable predictor of finite sample performance, so we have to turn to empirical work.
| Ref. | DGP | n | n | Functional | Evaluating | Methods | Summary of results |
| [16] | normal | 14 | 200 | mean | SE | PB, SB (B = 128, 512) | SB better than PB |
| [42] | normal | 20-100 | 1600 | variance | 90% CI | BC, PB (B = 1000) | bootstrap coverage below nominal |
| [19] | normal, exponential | 15 | 200 | trimmed mean | SE | PB (B = 200) | PB better than jackknife |
| [40] | normal, non-normal | 5-60 | 1000 | mean | 95%, 99% CI | baseline; PB (B = 500) | baseline better than PB |
| [44] | normal | 14-100 | 200 | mean | SE | PB, SB (B = 200) | SB better than PB |
| [14] | exponential | 5 | 1 | corr | 95% CI | BC, BCa, PB (B = ?) | BCa good; PB and BC poor |
| bivariate non-normal | 5 | 1 | ratio | 95% CI | BC, BCa, PB (B = ?) | BCa good; PB and BC poor | |
| normal | 8 | 1 | mean | 95% CI | B-t, BC, PB (B = ?) | BC and PB perform similarly, B-t is worse | |
| [17] | normal | 100 | 100 | mean | several CI | baseline; PB, SB (B = 2000) | PB similar to baseline; SB better than PB |
| [36] | chi-squared | 20 | 1000 | corr | 90% CI | baseline; hybrid, B-t, BC, BCa, PB (B = 1000) | hybrid, B-t, and PB perform similarly; BC and BCa have lower than nominal coverage |
| [15] | (see paper) | 13, 15 | 500 | regression | 90% CI | baseline; BC, BCa, PB (B = 500) | baseline better than bootstrap; bootstrap methods similar to each other |
| [47] | normal, exponential | 10, 20 | 1000 | corr | several CI | PB (B = 50000) | PB is biased |
| [37] | normal, exponential, log-normal, mixture of normal, student, triangular, uniform | 3-20 | 1000 | corr | 95% CI | baseline; B-t, BCa, PB (B = 1000) | B-t performs well |
| [34] | chi-squared, mixture of normal | 20 | 10000 | corr | several CI | baseline; B-t, PB (B = 1000) | bootstrap similar to baseline; B-t is best |
| [43] | normal, Poisson, t, Weibull | 20 | 500 | corr | 90% CI | baseline; B-t, BCa, DB, PB (B = 500) | DB and B-t perform best |
| [46] | normal, exponential | 5-25 | 1000 | corr | 95% CI | baseline; DB, PB (B = 1000) | DB as good or better than baseline, except for ; PB is worst |
| [30] | normal, exponential, beta, gamma, t | 10, 100 | 500 | median | SE | PB, SB (B = 200) | smoothing improves performance |
| [12] | normal | 20 | 1 | mean | 90% CI | baseline; ABC, BCa, B-t (B = 2000) | bootstrap better than baseline |
| [31] | normal, folded normal, exponential, log-normal | 15, 30 | 1600 | corr | 90% CI | ABC, DB, DB-ABC, PB (B = 1000) | DB better than ABC and calibrated ABC |
| [32] | (see paper) | 13, 15 | 500 | regression | 90% CI | DB, PB (B = 1999) | DB better than PB |
| [7] | inverse exponential | 20 | 10000 | corr | 99% CI | baseline; B-t, BC, BCa, PB (B = 4999) | baseline, B-t, and BCa perform similarly; BCa poor for small n |
| [18] | normal | 15 | 1 | mean | 90% CI | baseline; ABC | bootstrap better than baseline |
| [48] | log-normal, gamma | 10-50 | 10000 | diff. in means | 95% CI | baseline; B-t, BCa (B = 1000) | B-t performs well and better than BCa |
| [2] | bivariate normal (censored) | 25-400 | 2000 | (see paper) | 90%, 95% CI | B-t, BCa, PB (B = 520) | jackknife performs best; PB performs worst |
| [8] | normal, log-normal, gamma, t, uniform | 10-3600 | 1000-64000 | variance | several CI | baseline; ABC, BC, BCa, PB (B = 1000, 16000) | 2nd order accurate methods can converge slowly and perform worse than PB |
| [9] | (see paper) | 50-500 | 5000 | regression | 95% CI | baseline; BC, PB (B = 2000) | BC and PB perform well |
| [24] | exponential, Pareto | 10-25 | 2000 | 80%, 90% CI | baseline; PB, DB (B = 699) | DB is best | |
| [28] | (see paper) | 50-500 | 5000 | regression | 95% CI | baseline; BCa, PB (B = 10000) | BCa and PB perform well |
| [29] | (see paper) | 10-50 | 1000 | capture-recapture | 95% CI | baseline; B-t, PB (B = 100, 250) | B-t performs best |
| [1] | log-logistic with censored data | 25-50 | 1000 | (see paper) | 90%, 95% CI | baseline; B-t, DB, DB-t, PB (B = ?) | PB poor; other bootstrap methods good and similar to each other |
| [38] | normal, uniform, triangular, beta, Laplace, Pareto | 50?-300? | 1000 | mean | 95% CI | BCa, PB (B = 2000) | BCa slightly better than PB; good coverage except on Pareto |
| [25] | normal, exponential | 5-4000 | 10000 | corr | 95% CI | baseline; B-t, PB, reverse PB (B = 10000) | bootstrapped CI narrow, especially for small n; PB worse than baseline for small n; reverse PB poor; B-t best |
| [33] | log-logistic with censored data | 25-60 | 1000 | (see paper) | 90%, 95% CI | baseline, JK; DB, PB (B = 1000) | DB best; PB poor |
| [39] | normal | 10-100 | 10000 | mean | 95% CI | baseline; B-n, B-t, BC, BCa, PB (B = 10000) | baseline better than bootstrap on small n; BCa performs well |
| [21] | (see paper) | ? | 1000 | quantiles | 95% CI | modified B-n, BC, BCa, PB (B = 1999) | bootstrap methods perform similarly |
| [26] | log-normal | 20-120 | 100 | quantiles | 95% CI | baseline; BCa, PB (B = 10000) | baseline better than bootstrap for small n |
| [11] | 26 pairs | 20-600 | 1000 | corr | 95% CI | baseline; BCa, PB (B = 2000) | BCa better than PB on small n; PB better than BCa for large n; poor coverage for uniform-chi-squared |
Table 1 lists empirical work on bootstrap methods. Most of the early work was on Pearson correlation and the mean, while later work includes other functionals, mostly quantiles and regression parameters. We focus on non-parametric bootstrap methods and on methods that are most commonly taught and used for that task (from now on, baseline methods). For example, Fisher confidence intervals (CIs) for Pearson correlation and t-intervals for the mean.
Most but far from all related work includes such a baseline. Excluding an early study where the best bootstrap was the 1st-order accurate percentile bootstrap (PB) [40], there are only 3 studies where the baseline outperforms the best bootstrap method. Dorfman et al. [15] showed that Fieller and Taylor series-based intervals for elasticities and flexibilities outperform bias-corrected and accelerated (BCa), bias-corrected (BC), and PB, albeit modestly and on relatively small sample sizes (). Puth et al. [39] show for Pearson correlation and the bivariate normal with three different correlation coefficients that Fisher intervals achieve coverage close to nominal 95%, while BCa achieves coverage around 93% and 94% for sample sizes 20 and 10, respectively. And Ialongo [27] showed for the log-normal distribution that the baseline attained nominal coverage at lower samples sizes than BCa, but only if log-normality was assumed.
The most common recommendation propagated through literature is to use BCa, based mostly on theoretical results. Empirical results also often recommend BCa, with the exception of the mean, where studentized bootstrap (also bootstrap-t, B-t) is better. However, some studies suggest that BCa does not perform well with small sample sizes [7, 8, 36]. Double or iterated (also calibrated) bootstrap (DB) appears in only 7 studies. When it does, it performs as well as or better than other methods.
To summarize, most related work is limited to a single functional, a single data generating process (DGP), and/or a single confidence level. The most commonly used method(s) are not always included as a baseline for comparison. And DB deserves more attention. So, while the results are encouraging, it is difficult to gauge the practical consequences of using only bootstrapping.
2 Simulation Study
We ran an experiment for each possible combination of sample size from {4, 8, 16, 32, 64, 128, 256}, intervals with endpoints from {0.025, 0.05, 0.25, 0.75, 0.95, 0.975}, statistical functional from {mean, median, standard deviation, and percentile, and Pearson correlation}, and data generating process from
-
•
normal with and ,
-
•
exponential with ,
-
•
uniform from 0 to 1,
-
•
beta with and ,
-
•
log-normal with and ,
-
•
Laplace with and , and
-
•
bi-normal with and .
Note that the bi-normal and Pearson correlation appear only in combination with each other.
We used replications for every experiment, to limit coverage standard error to in the worst case, and bootstrap replications. More bootstrap replications is better, so we do not consider a dimension. We only report results for , but we would reach the same conclusions with . For the performance of bootstrap methods is noticeably worse. Recommendations [8, 10, 20] and choices of in related work also suggest that is enough.
| overall | 4 | 8 | 16 | 32 | 64 | 128 | 256 | corr | mean | median | Q(0.05) | Q(0.95) | std | |
|---|---|---|---|---|---|---|---|---|---|---|---|---|---|---|
| B-n | ||||||||||||||
| B-t | ||||||||||||||
| BB | ||||||||||||||
| SB | ||||||||||||||
| DB | ||||||||||||||
| BCa | ||||||||||||||
| BC | ||||||||||||||
| PB |
2.1 Methods
With a one-size-fits-all method in mind, we include only non-parametric bootstrap methods that do not require user input: basic bootstrap (BB) [20, chap. 13.4], standard bootstrap (B-n) [20, chap. 13], B-t [20, chap. 14], BC [20, chap. 14], BCa [20, chap. 14], DB [22, chap. 3.11], PB [20, chap. 13], and smoothed bootstrap (SB) [10].
As a baseline for comparison, we include the CIs produced by the following commonly used methods: for the mean we use the t-based CIs from the commonly used t-test (t-test). For the median we use CIs from the Wilcoxon signed rank test (wilcoxon) [3]. For standard deviation, we use the chi-squared CIs (chi-sq) [45]. For Pearson correlation we use Fisher CIs (fisher) [4]. For quantiles we use parametric CIs based on normal assumption (q-par), non-parametric CI (q-nonpar) (see [27] for both), and the Maritz-Jarrett method (m-j) [35].
2.2 Measuring the quality of confidence intervals
Most related work measures only coverage, with only a few studies measuring interval length [7, 11, 18, 21, 26, 37, 39] or comparing CIs with exact intervals [12, 14, 18]. While we also focus on coverage, we measure and report some results for interval length for two-sided CIs and the absolute distance from exact intervals for one-sided intervals. The exact interval for endpoint and parameter is defined as , where is the cumulative distribution function of [13]. We approximate with 100000 samples.
Note that two-sided coverage can be misleading regarding a method’s coverage, because good two-sided coverage can be, and in practice often is, a result of substantial but opposite errors in the two one-sided intervals (see DiCiccio and Efron [13] for an example). That is, while two-sided error can be studied from one-sided CIs, the converse is not true.
We argue that the practical meaning of coverage error depends on nominal coverage and is not symmetric. For example, 51% coverage at 50% nominal coverage is not the same as 96% coverage at 95% nominal coverage. And 85% coverage is not the same as 95% coverage at 90% nominal coverage. To aggregate results and for a threshold-based criterion that can be applied to all confidence levels, we use Kullback-Leibler divergence - the information loss if we assume nominal coverage when actual coverage is :
For a threshold-based criterion of what we consider good enough we modify Bradley’s criterion , where is the nominal coverage [5]. Common choices for are 10 (stringent), 4 (intermediate), 2 (liberal), and 0.75 (very liberal). Note that the intermediate and very liberal were introduced by Robey and Barcikowski [41]). At nominal coverage, the KL divergences for the Bradley lower bounds (), (), (), and () are approximately , , , and . We adopt as the stringent criterion and a factor of 5 as an order of magnitude worse/better performance. For nominal coverage 95% this leads to criteria very similar to Bradley’s: vs (intermediate), vs (liberal), and vs (very liberal). However, for nominal coverage further away from 95% our approach gives more sensible criteria and does not produce endpoints outside of the unit interval.
3 Results
The simulation study consists of 1302 combinations and it is infeasible to list them all. We will focus on identifying if a bootstrap method is a viable one-size-fits-all approach. Inevitably, some details that are relevant to the reader will be left out. We prepared a visualization tool to browse the results of the experiments zrimseku.github.io/bootstrap-simulation/.
The raw results (aggregated over 10000 replications) and the source code for the tool, simulation framework, pre-processing, and analysis can be found here: github.com/zrimseku/bootstrap-simulation. The library with all the bootstrap methods can be found here: github.com/zrimseku/bootstrap-ci.
3.1 When methods fail to produce a CI
There are only a few cases where a method fails to produce a CI. All bootstrap methods fail to produce a CI for Pearson correlation for , due to division by zero variance. It can also happen for , but rarely. BC and BCa do not produce a CI for the percentile for . For the percentile, B-t does not produce an interval in most cases when for the Laplace distribution. m-j is unable to produce CIs for small sample sizes and extreme percentiles ( percentile for and the percentile for ). Method q-nonpar fails to produce the percentile for and , for and , for and and for and . When predicting CIs for the median, it fails at and . And, although wilcoxon returns CIs for asymmetric distributions, they are not useful CIs for location.
3.2 Coverage of bootstrap methods
Table 2 shows a comparison of bootstrap methods in mean KL. As expected, coverage improves with sample size and the two extreme percentiles and standard deviation are the most difficult functionals. For Pearson correlation, mean, and median, DB is best. For the percentiles, B-n is best. And for standard deviation, B-t is best. B-n and B-t perform the best overall. Because coverage gets wors with smaller sample size, the overall results are biased towards methods that perform well on small . DB and BCa, which we would expect to perform best, perform relatively poorly for small , but are best and second best for sample sizes .
| overall | 4 | 8 | 16 | 32 | 64 | 128 | 256 | corr | mean | median | Q(0.05) | Q(0.95) | std | |
|---|---|---|---|---|---|---|---|---|---|---|---|---|---|---|
| DB | ||||||||||||||
| BCa | ||||||||||||||
| B-n | ||||||||||||||
| SB | ||||||||||||||
| PB | ||||||||||||||
| BC | ||||||||||||||
| B-t | ||||||||||||||
| BB |
Table 3 shows how often methods fail to meet the stringent criterion. DB outperforms other methods overall and on all sample sizes except . It is the best method or relatively close to the best on all functionals, except on one of the two extreme percentiles. BCa is second-best overall. The results so far suggest that overall DB is best, but can have very poor coverage in some cases, especially for the two extreme percentiles at small sample sizes. While a more liberal criterion will result in fewer failures for all methods, the ordering does not change.
From the six confidence levels in our experiments we derive results for the two most common two-sided CIs (95%, 90%). Table 4 shows how often the methods fail to meet the liberal criterion for these two-sided intervals. These and results for other thresholds and KL are similar for one-sided and two-sided intervals. Most bootstrap methods meet the liberal criterion in almost all cases when ( for DB), but even at there are still two cases where even DB does not (standard deviation for log-normal). Excluding these, DB meets the very liberal criterion for all experiments for .
| overall | 4 | 8 | 16 | 32 | 64 | 128 | 256 | corr | mean | median | Q(0.05) | Q(0.95) | std | |
|---|---|---|---|---|---|---|---|---|---|---|---|---|---|---|
| DB | ||||||||||||||
| SB | ||||||||||||||
| B-n | ||||||||||||||
| BCa | ||||||||||||||
| PB | ||||||||||||||
| BC | ||||||||||||||
| B-t | ||||||||||||||
| BB |
3.3 Coverage comparison with baseline methods
Note that all the results in this section are for one-sided CIs. Results for two-sided CIs are similar.
We start with the premise that if we are limited to a single method, DB is the best choice. Now we take a closer look at where DB is clearly outperformed by another method. The criterion we use is that method A outperforms method B if B does not meet the stringent criterion and A is at least an order of magnitude better than method B. If a method is not able to produce CIs, it is outperformed by any method that can.
| n | functional | baseline DB | DB baseline |
|---|---|---|---|
| 4 | corr | fisher (6) | |
| 4 | mean | t-test (8); wilcoxon (1) | DB (4) |
| 4 | median | m-j (8); q-par (3) | |
| 4 | Q(0.05) | q-nonpar (12); q-par (22) | |
| 4 | Q(0.95) | q-par (21) | DB (4) |
| 4 | std | chi-sq (14) | DB (6) |
| 8 | corr | fisher (6) | |
| 8 | mean | t-test (4); wilcoxon (6) | DB (4) |
| 8 | median | m-j (2); q-par (1); wilcoxon (3) | DB (4) |
| 8 | Q(0.05) | q-nonpar (12); q-par (22) | DB (3) |
| 8 | Q(0.95) | q-nonpar (12); q-par (21) | |
| 8 | std | chi-sq (8) | DB (11) |
| 16 | mean | t-test (8); wilcoxon (8) | DB (13) |
| 16 | median | wilcoxon (1) | DB (7) |
| 16 | Q(0.05) | q-nonpar (17); q-par (15) | |
| 16 | Q(0.95) | m-j (11); q-par (11) | DB (5) |
| 16 | std | chi-sq (2) | DB (12) |
| 32 | mean | t-test (3); wilcoxon (3) | DB (14) |
| 32 | median | m-j (1) | DB (3) |
| 32 | Q(0.05) | m-j (6); q-nonpar (17); q-par (5) | |
| 32 | Q(0.95) | m-j (18); q-par (6) | |
| 32 | std | chi-sq (2) | DB (15) |
| 64 | mean | DB (12) | |
| 64 | median | DB (1) | |
| 64 | Q(0.05) | m-j (6); q-nonpar (3) | |
| 64 | Q(0.95) | m-j (5) | DB (11) |
| 64 | std | chi-sq (1) | DB (20) |
| 128 | mean | DB (14) | |
| 128 | Q(0.05) | m-j (9) | DB (1) |
| 128 | Q(0.95) | m-j (5) | DB (1) |
| 128 | std | DB (28) | |
| 256 | mean | DB (10) | |
| 256 | Q(0.05) | DB (4) | |
| 256 | Q(0.95) | DB (10) | |
| 256 | std | DB (27) |
Table 5 adds detail to the results from Section 3.2. For Pearson correlation DB does not produce CIs for and performs poorly for . It performs poorly on the two extreme percentiles for and in some cases on the other functionals, mostly for . For Q(0.05) and Q(0.95), we would do better by choosing q-par for the smaller sample sizes and m-j for sample size . For the other functionals and ( for Pearson correlation) there is no clear advantage of using baseline methods. Note that for Q(0.05) and Q(0.95) and B-n is as good as or better than baseline. However, for even B-n is worse than the baseline, but less so than DB.
Note that BCa behaves similarly to DB, but DB is the better choice. For example, DB is at least an order of magnitude better than BCa in 17% of all cases while BCa is better than DB in 4% of the cases.
3.4 Absolute distance from exact CIs
Coverage by itself is not enough - we would also like the CI endpoints to match the exact. An extreme example would be to generate a very large endpoint (wide two-sided interval) with probability and a very small endpoint (narrow two-sided interval) with probability . This would result in nominal coverage but useles CIs.
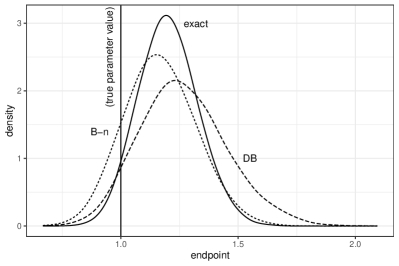
Table 6 shows that B-n has lowest distance from exact, while DB and BCa perform relatively poorly across all groups. This result cannot be interpreted in isolation, because there is typically a trade-off between coverage and distance (see Figure 1 for an illustrative example).
| overall | 4 | 8 | 16 | 32 | 64 | 128 | 256 | corr | mean | median | Q(0.05) | Q(0.95) | std | |
|---|---|---|---|---|---|---|---|---|---|---|---|---|---|---|
| B-n | ||||||||||||||
| BB | ||||||||||||||
| BC | ||||||||||||||
| SB | ||||||||||||||
| BCa | ||||||||||||||
| DB | ||||||||||||||
| PB | ||||||||||||||
| B-t |
Table 7 shows where a baseline method has better distance from exact than DB, but only for cases where its coverage is not an order of magnitude worse. We included B-n as the bootstrap method that performs best in distance from exact. Results are similar to those in Table 5 - baseline methods and B-n outperform DB for the two extreme percentiles. That is, in most cases, lower distance from exact comes at the expense of worse coverage.
| n | functional | baseline DB | |
|---|---|---|---|
| 4 | corr | fisher (6) | |
| 4 | mean | B-n (9); t-test (9); wilcoxon (9) | |
| 4 | median | B-n (5); m-j (5); q-nonpar (4); q-par (5); wilcoxon (5) | |
| 4 | Q(0.05) | B-n (27); q-nonpar (27); q-par (24) | |
| 4 | Q(0.95) | B-n (21); q-nonpar (10); q-par (21) | |
| 4 | std | B-n (14); chi-sq (14) | |
| 8 | corr | fisher (6) | |
| 8 | mean | B-n (3); t-test (3); wilcoxon (3) | |
| 8 | median | B-n (1); m-j (1); q-nonpar (1); q-par (1); wilcoxon (1) | |
| 8 | Q(0.05) | B-n (30); q-nonpar (28); q-par (24) | |
| 8 | Q(0.95) | B-n (27); q-nonpar (15); q-par (23) | |
| 8 | std | B-n (7); chi-sq (7) | |
| 16 | Q(0.05) | B-n (35); q-nonpar (35); q-par (27) | |
| 16 | Q(0.95) | B-n (16); m-j (16); q-nonpar (2); q-par (16) | |
| 16 | std | B-n (2); chi-sq (2) | |
| 32 | Q(0.05) | B-n (29); m-j (29); q-nonpar (26); q-par (15) | |
| 32 | Q(0.95) | B-n (30); m-j (30); q-nonpar (13); q-par (20) | |
| 64 | Q(0.05) | B-n (8); m-j (8); q-nonpar (8); q-par (4) | |
| 64 | std | B-n (1); chi-sq (1) | |
| 128 | Q(0.05) | B-n (2); m-j (2); q-nonpar (2); q-par (1) |
4 Discussion
We identify DB as the overall best method, contrary to some recommendations of BCa for general cases [7], but in line with other recommendations [23, 31] and the few empirical studies that included DB. These results are also in line with related work: PB performs relatively poorly. For small B-t performs best for the mean and BCa best for Pearson correlation, although DB performs similarly. B-t relies on an estimate of variance and can produce very long CIs. Bootstrapping can perform poorly compared do chi-squared CIs on variance for small and normal distribution, however, as we demonstrated, chi-squared performs poorly on non-normal distributions and DB is comparable or better for .
DB has two weaknesses. It can perform relatively poorly when and on extreme percentiles for . The latter can be mitigated by using B-n but also raises the question if DB can be modified to deal with these cases, while still preserving most of its simplicity. This leaves us with , where we have to acknowledge that a non-parametric approach is often worse than a parametric approach even when the assumptions of the parametric method are violated. However, we would argue that these are extremely small and of little relevance to most practitioners. We did not investigate to what extent bootstrap diagnostics (see [6] and [10, Ch.3.10]) could further mitigate these issues.
The dimensions of our experiment can be improved. We omit categorical data with commonly used baselines such as the binomial test for proportions. We only include one DGP for Pearson correlation, which is not nearly as comprehensive as the recent study by [11], who, unfortunately, did not include DB. Other commonly used functionals could also be included, such as regression model coefficients, non-parametric correlation, and distances between distributions. However, we believe that the dimensions our simulation study were diverse enough to reveal the most important results.
We focused on independent data. Related work on hierarchical, temporal, spatial, and other dependencies is sparse, but mostly in favor of bootstrapping. And in more complex problems bootstrapping is often the only viable approach. From a pedagogical perspective, the bootstrap on dependent data is more difficult, but the most of the difficulties arise from understanding the dependencies and adjusting how to resample accordingly.
There is no substitute for thoroughly understanding the statistical task at hand, carefully choosing the most appropriate method, and correctly applying it. In practice, however, these come at a training cost that is prohibitive for most practitioners. Any simplification is welcome and we identify the bootstrap as a viable one-size-fits-all method for quantifying uncertainty, at least in the independent data case. We would argue that using a single and conceptually more simple method outweighs even a moderate drop in performance compared to methods that are most commonly taught and used today. However, we show that bootstrapping even performs as well if not better on all but the smallest sample sizes.
Arguably, the lack of adoption of the bootstrap as a one-size-fits-all method might not be due to performance issues but for a lack of software, materials, and legitimate concerns for backwards compatibility. The logical next step appears to be to develop and test a first course in applied statistics that relies solely on the bootstrap.
[Acknowledgments] We thank Gregor Sočan for his helpful comments.
Erik Štrumbelj was funded by the Slovenian Research and Innovation Agency research core funding P2-0442.
References
- [1] {barticle}[author] \bauthor\bsnmArasan, \bfnmJayanthi\binitsJ. and \bauthor\bsnmAdam, \bfnmMohd B\binitsM. B. (\byear2014). \btitleDouble bootstrap confidence interval estimates with censored and truncated data. \bjournalJournal of Modern Applied Statistical Methods \bvolume13 \bpages22. \endbibitem
- [2] {barticle}[author] \bauthor\bsnmArasan, \bfnmJayanthi\binitsJ. and \bauthor\bsnmLunn, \bfnmMary\binitsM. (\byear2008). \btitleAlternative interval estimation for parameters of bivariate exponential model with time varying covariate. \bjournalComputational Statistics \bvolume23 \bpages605–622. \endbibitem
- [3] {barticle}[author] \bauthor\bsnmBauer, \bfnmDavid F\binitsD. F. (\byear1972). \btitleConstructing confidence sets using rank statistics. \bjournalJournal of the American Statistical Association \bvolume67 \bpages687–690. \endbibitem
- [4] {barticle}[author] \bauthor\bsnmBonett, \bfnmDouglas G\binitsD. G. and \bauthor\bsnmWright, \bfnmThomas A\binitsT. A. (\byear2000). \btitleSample size requirements for estimating Pearson, Kendall and Spearman correlations. \bjournalPsychometrika \bvolume65 \bpages23–28. \endbibitem
- [5] {barticle}[author] \bauthor\bsnmBradley, \bfnmJames V\binitsJ. V. (\byear1978). \btitleRobustness? \bjournalBritish Journal of Mathematical and Statistical Psychology \bvolume31 \bpages144–152. \endbibitem
- [6] {barticle}[author] \bauthor\bsnmCanty, \bfnmAngelo J\binitsA. J., \bauthor\bsnmDavison, \bfnmAnthony C\binitsA. C., \bauthor\bsnmHinkley, \bfnmDavid V\binitsD. V. and \bauthor\bsnmVentura, \bfnmValérie\binitsV. (\byear2006). \btitleBootstrap diagnostics and remedies. \bjournalCanadian Journal of Statistics \bvolume34 \bpages5–27. \endbibitem
- [7] {barticle}[author] \bauthor\bsnmCarpenter, \bfnmJames\binitsJ. and \bauthor\bsnmBithell, \bfnmJohn\binitsJ. (\byear2000). \btitleBootstrap confidence intervals: when, which, what? A practical guide for medical statisticians. \bjournalStatistics in medicine \bvolume19 \bpages1141–1164. \endbibitem
- [8] {barticle}[author] \bauthor\bsnmChernick, \bfnmMichael R\binitsM. R. and \bauthor\bsnmLabudde, \bfnmRobert A\binitsR. A. (\byear2009). \btitleRevisiting qualms about bootstrap confidence intervals. \bjournalAmerican Journal of Mathematical and Management Sciences \bvolume29 \bpages437–456. \endbibitem
- [9] {barticle}[author] \bauthor\bsnmCheung, \bfnmMike WL\binitsM. W. (\byear2009). \btitleComparison of methods for constructing confidence intervals of standardized indirect effects. \bjournalBehavior research methods \bvolume41 \bpages425–438. \endbibitem
- [10] {bbook}[author] \bauthor\bsnmDavison, \bfnmAnthony Christopher\binitsA. C. and \bauthor\bsnmHinkley, \bfnmDavid Victor\binitsD. V. (\byear1997). \btitleBootstrap methods and their application \bvolume1. \bpublisherCambridge university press. \endbibitem
- [11] {barticle}[author] \bauthor\bsnmDelosReyes, \bfnmJohn Mart V.\binitsJ. M. V. and \bauthor\bsnmPadilla, \bfnmMiguel A.\binitsM. A. (\byear2023). \btitleBootstrap Correlation Confidence Interval Estimation: The Positive Impact of a Symmetric Distribution. \bjournalThe Journal of Experimental Education \bvolume0 \bpages1-21. \endbibitem
- [12] {barticle}[author] \bauthor\bsnmDiCiccio, \bfnmThomas J\binitsT. J. and \bauthor\bsnmEfron, \bfnmBradley\binitsB. (\byear1996). \btitleBootstrap confidence intervals. \bjournalStatistical science \bvolume11 \bpages189–228. \endbibitem
- [13] {barticle}[author] \bauthor\bsnmDiCiccio, \bfnmThomas J.\binitsT. J. and \bauthor\bsnmEfron, \bfnmBradley\binitsB. (\byear1996). \btitle[Bootstrap Confidence Intervals]: Rejoinder. \bjournalStatistical Science \bvolume11 \bpages223–228. \endbibitem
- [14] {barticle}[author] \bauthor\bsnmDiciccio, \bfnmThomas J\binitsT. J. and \bauthor\bsnmRomano, \bfnmJoseph P\binitsJ. P. (\byear1988). \btitleA review of bootstrap confidence intervals. \bjournalJournal of the Royal Statistical Society: Series B (Methodological) \bvolume50 \bpages338–354. \endbibitem
- [15] {barticle}[author] \bauthor\bsnmDorfman, \bfnmJeffrey H.\binitsJ. H., \bauthor\bsnmKling, \bfnmCatherine L.\binitsC. L. and \bauthor\bsnmSexton, \bfnmRichard J.\binitsR. J. (\byear1990). \btitleConfidence Intervals for Elasticities and Flexibilities: Reevaluating the Ratios of Normals Case. \bjournalAmerican Journal of Agricultural Economics \bvolume72 \bpages1006–1017. \endbibitem
- [16] {barticle}[author] \bauthor\bsnmEfron, \bfnmBradley\binitsB. (\byear1981). \btitleNonparametric estimates of standard error: the jackknife, the bootstrap and other methods. \bjournalBiometrika \bvolume68 \bpages589–599. \endbibitem
- [17] {barticle}[author] \bauthor\bsnmEfron, \bfnmBradley\binitsB. (\byear1988). \btitleBootstrap confidence intervals: good or bad? \bjournalPsychological bulletin \bvolume104 \bpages293. \endbibitem
- [18] {barticle}[author] \bauthor\bsnmEfron, \bfnmBradley\binitsB. (\byear2003). \btitleSecond thoughts on the bootstrap. \bjournalStatistical science \bpages135–140. \endbibitem
- [19] {barticle}[author] \bauthor\bsnmEfron, \bfnmBradley\binitsB. and \bauthor\bsnmTibshirani, \bfnmRobert\binitsR. (\byear1986). \btitleBootstrap methods for standard errors, confidence intervals, and other measures of statistical accuracy. \bjournalStatistical science \bpages54–75. \endbibitem
- [20] {bbook}[author] \bauthor\bsnmEfron, \bfnmBradley\binitsB. and \bauthor\bsnmTibshirani, \bfnmRobert J\binitsR. J. (\byear1994). \btitleAn introduction to the bootstrap. \bpublisherCRC press. \endbibitem
- [21] {barticle}[author] \bauthor\bsnmFlowers-Cano, \bfnmRoberto S\binitsR. S., \bauthor\bsnmOrtiz-Gómez, \bfnmRuperto\binitsR., \bauthor\bsnmLeón-Jiménez, \bfnmJesús Enrique\binitsJ. E., \bauthor\bsnmLópez Rivera, \bfnmRaúl\binitsR. and \bauthor\bsnmPerera Cruz, \bfnmLuis A\binitsL. A. (\byear2018). \btitleComparison of bootstrap confidence intervals using Monte Carlo simulations. \bjournalWater \bvolume10 \bpages166. \endbibitem
- [22] {bbook}[author] \bauthor\bsnmHall, \bfnmPeter\binitsP. (\byear2013). \btitleThe bootstrap and Edgeworth expansion. \bpublisherSpringer Science & Business Media. \endbibitem
- [23] {barticle}[author] \bauthor\bsnmHall, \bfnmPeter\binitsP. and \bauthor\bsnmMartin, \bfnmMichael A.\binitsM. A. (\byear1996). \btitle[Bootstrap Confidence Intervals]: Comment. \bjournalStatistical Science \bvolume11 \bpages212–214. \endbibitem
- [24] {barticle}[author] \bauthor\bsnmHall, \bfnmPeter\binitsP. and \bauthor\bsnmMiller, \bfnmHugh\binitsH. (\byear2010). \btitleBootstrap confidence intervals and hypothesis tests for extrema of parameters. \bjournalBiometrika \bvolume97 \bpages881–892. \endbibitem
- [25] {barticle}[author] \bauthor\bsnmHesterberg, \bfnmTim C.\binitsT. C. (\byear2015). \btitleWhat Teachers Should Know About the Bootstrap: Resampling in the Undergraduate Statistics Curriculum. \bjournalThe American Statistician \bvolume69 \bpages371-386. \endbibitem
- [26] {barticle}[author] \bauthor\bsnmIalongo, \bfnmCristiano\binitsC. (\byear2019). \btitleConfidence interval of percentiles in skewed distribution: The importance of the actual coverage probability in practical quality applications for laboratory medicine. \bjournalBiochemia Medica \bvolume29 \bpages471–482. \endbibitem
- [27] {barticle}[author] \bauthor\bsnmIalongo, \bfnmCristiano\binitsC. (\byear2019). \btitleConfidence interval for quantiles and percentiles. \bjournalBiochemia medica \bvolume29 \bpages5–17. \endbibitem
- [28] {barticle}[author] \bauthor\bsnmJones, \bfnmJeff A\binitsJ. A. and \bauthor\bsnmWaller, \bfnmNiels G\binitsN. G. (\byear2013). \btitleComputing confidence intervals for standardized regression coefficients. \bjournalPsychological methods \bvolume18 \bpages435. \endbibitem
- [29] {barticle}[author] \bauthor\bsnmKaravarsamis, \bfnmNatalie\binitsN., \bauthor\bsnmRobinson, \bfnmAndrew P\binitsA. P., \bauthor\bsnmHepworth, \bfnmGraham\binitsG., \bauthor\bsnmHamilton, \bfnmAndrew J\binitsA. J. and \bauthor\bsnmHeard, \bfnmGeoffrey W\binitsG. W. (\byear2013). \btitleComparison of four bootstrap-based interval estimators of species occupancy and detection probabilities. \bjournalAustralian & New Zealand Journal of Statistics \bvolume55 \bpages235–252. \endbibitem
- [30] {barticle}[author] \bauthor\bsnmLee, \bfnmStephen\binitsS. and \bauthor\bsnmYoung, \bfnmG. Alastair\binitsG. A. (\byear1994). \btitlePractical higher-order smoothing of the bootstrap. \bjournalStatistica Sinica \bvolume4 \bpages445–459. \endbibitem
- [31] {barticle}[author] \bauthor\bsnmLee, \bfnmStephen M. S.\binitsS. M. S. and \bauthor\bsnmYoung, \bfnmG. Alastair\binitsG. A. (\byear1996). \btitle[Bootstrap Confidence Intervals]: Comment. \bjournalStatistical Science \bvolume11 \bpages221–223. \endbibitem
- [32] {barticle}[author] \bauthor\bsnmLetson, \bfnmDavid\binitsD. and \bauthor\bsnmMcCullough, \bfnmB. D.\binitsB. D. (\byear1998). \btitleBetter Confidence Intervals: The Double Bootstrap with No Pivot. \bjournalAmerican Journal of Agricultural Economics \bvolume80 \bpages552–559. \endbibitem
- [33] {barticle}[author] \bauthor\bsnmLoh, \bfnmYue Fang\binitsY. F., \bauthor\bsnmArasan, \bfnmJayanthi\binitsJ., \bauthor\bsnmMidi, \bfnmHabshah\binitsH. and \bauthor\bsnmBakar, \bfnmMohd Rizam Abu\binitsM. R. A. (\byear2015). \btitleInferential procedures based on the double bootstrap for log logistic regression model with censored data. \bjournalMalaysian Journal of Science \bvolume34 \bpages199–207. \endbibitem
- [34] {bbook}[author] \bauthor\bsnmMammen, \bfnmEnno\binitsE. (\byear1992). \btitleWhen does bootstrap work?: asymptotic results and simulations \bvolume77. \bpublisherSpringer Science & Business Media. \endbibitem
- [35] {barticle}[author] \bauthor\bsnmMaritz, \bfnmJS\binitsJ. and \bauthor\bsnmJarrett, \bfnmRG\binitsR. (\byear1978). \btitleA note on estimating the variance of the sample median. \bjournalJournal of the American Statistical Association \bvolume73 \bpages194–196. \endbibitem
- [36] {barticle}[author] \bauthor\bsnmOwen, \bfnmArt B\binitsA. B. (\byear1988). \btitleEmpirical likelihood ratio confidence intervals for a single functional. \bjournalBiometrika \bvolume75 \bpages237–249. \endbibitem
- [37] {bincollection}[author] \bauthor\bsnmOwen, \bfnmArt B\binitsA. B. (\byear1992). \btitleEmpirical likelihood and small samples. In \bbooktitleComputing Science and statistics \bpages79–88. \bpublisherSpringer. \endbibitem
- [38] {barticle}[author] \bauthor\bsnmPadilla, \bfnmMiguel A\binitsM. A. and \bauthor\bsnmVeprinsky, \bfnmAnna\binitsA. (\byear2014). \btitleBootstrapped deattenuated correlation: Nonnormal distributions. \bjournalEducational and Psychological Measurement \bvolume74 \bpages823–830. \endbibitem
- [39] {barticle}[author] \bauthor\bsnmPuth, \bfnmMarie-Therese\binitsM.-T., \bauthor\bsnmNeuhäuser, \bfnmMarkus\binitsM. and \bauthor\bsnmRuxton, \bfnmGraeme D.\binitsG. D. (\byear2015). \btitleOn the variety of methods for calculating confidence intervals by bootstrapping. \bjournalJournal of Animal Ecology \bvolume84 \bpages892-897. \endbibitem
- [40] {barticle}[author] \bauthor\bsnmRasmussen, \bfnmJeffrey L\binitsJ. L. (\byear1987). \btitleEstimating correlation coefficients: Bootstrap and parametric approaches. \bjournalPsychological Bulletin \bvolume101 \bpages136. \endbibitem
- [41] {barticle}[author] \bauthor\bsnmRobey, \bfnmRandall R\binitsR. R. and \bauthor\bsnmBarcikowski, \bfnmRobert S\binitsR. S. (\byear1992). \btitleType I error and the number of iterations in Monte Carlo studies of robustness. \bjournalBritish Journal of Mathematical and Statistical Psychology \bvolume45 \bpages283–288. \endbibitem
- [42] {barticle}[author] \bauthor\bsnmSchenker, \bfnmNathaniel\binitsN. (\byear1985). \btitleQualms about bootstrap confidence intervals. \bjournalJournal of the American Statistical Association \bvolume80 \bpages360–361. \endbibitem
- [43] {barticle}[author] \bauthor\bsnmShi, \bfnmSheng G\binitsS. G. (\byear1992). \btitleAccurate and efficient double-bootstrap confidence limit method. \bjournalComputational statistics & data analysis \bvolume13 \bpages21–32. \endbibitem
- [44] {barticle}[author] \bauthor\bsnmSilverman, \bfnmB. W.\binitsB. W. and \bauthor\bsnmYoung, \bfnmG. A.\binitsG. A. (\byear1987). \btitleThe Bootstrap: To Smooth or Not to Smooth? \bjournalBiometrika \bvolume74 \bpages469–479. \endbibitem
- [45] {barticle}[author] \bauthor\bsnmSnedecor, \bfnmGeorge W\binitsG. W. and \bauthor\bsnmCochran, \bfnmWilliam G\binitsW. G. (\byear1989). \btitleStatistical Methods, eight edition. \bjournalIowa state University press, Ames, Iowa \bvolume1191. \endbibitem
- [46] {bbook}[author] \bauthor\bsnmStanny, \bfnmRR\binitsR. (\byear1993). \btitleIterated-bootstrap Confidence Intervals for the Mean. \bpublisherNaval Aerospace Medical Research Laboratory. \endbibitem
- [47] {barticle}[author] \bauthor\bsnmYoung, \bfnmGA\binitsG. and \bauthor\bsnmDaniels, \bfnmHE\binitsH. (\byear1990). \btitleBootstrap bias. \bjournalBiometrika \bvolume77 \bpages179–185. \endbibitem
- [48] {barticle}[author] \bauthor\bsnmZhou, \bfnmXiao Hua\binitsX. H. and \bauthor\bsnmDinh, \bfnmPhillip\binitsP. (\byear2005). \btitleNonparametric confidence intervals for the one-and two-sample problems. \bjournalBiostatistics \bvolume6 \bpages187–200. \endbibitem