Maximum Expected Reward Line If Non Specialist - Law (for darts)
Abstract
Different levels of expertise in playing darts can be well described simply by the likeliness of a player to really hit the field he is aiming for. We characterise this ability by introducing a spread to hit the targeted field whose width scales inversely with the players skill and determine which field to aim for to find the highest expectation value for the score depending on the players’ proficiency.
I Introduction
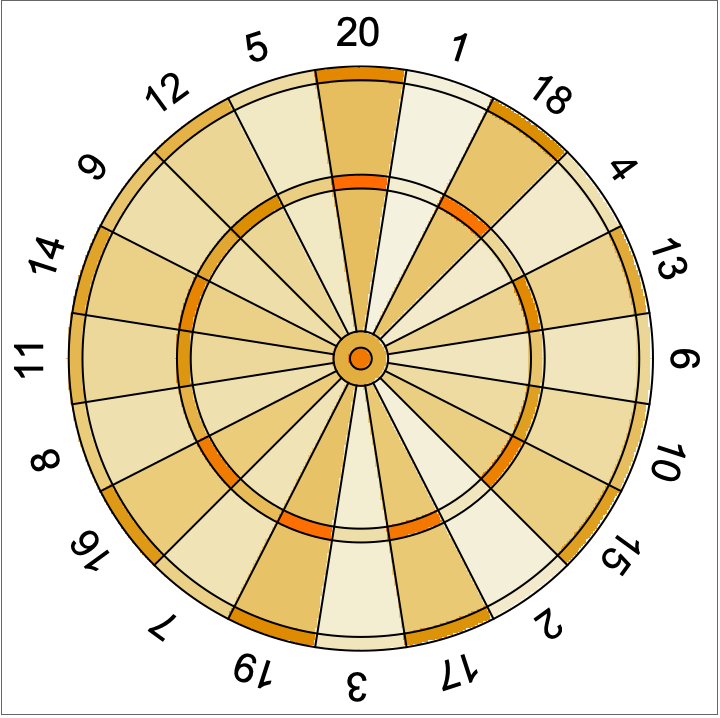
Everyone who has tried to throw darts has found out that hitting the intended field on the board turns out to be substantially more difficult than it seems on TV. Moreover due to the design of the dart board [1, 2], see Fig. 1, it is not evident whether there are regions where, given a certain imprecision of the throw, you can expect higher scores than in others.
We model these imprecisions by different kinds of normal distributions [3] and determine the position for which to aim in order to maximise the expected reward as well as tracking this position along the increasing width of the spread underlying the throw. Moreover we formulate an illustrative criterion serving as an aid to dartists on whether an adjustment of the aim is favourable or not, given that the quality of the throw in terms of the spread does not change across the boards.
Finally we conclude by investigating whether the strategy we put forward yields a significant improvement as opposed to always aiming at the highest field on the board, the triple-20 (T20), or simply targeting the middle of the board, the bulls eye (BE).
II Our model
In order to investigate how different spreads influence the expected reward of the throw we first need to concretise how we model the throw. Assuming a normal distribution in the plane of the board which shall be parametrised by , we compute the reward function as the convolution [4, 5] of the kernel given by
| (1) |
with the board . The board itself is a scalar function whose values are specified in the darts rulebook [1, 2]. In Fig. 1 we depict the board which for our numerical purposes was set up as a matrix.
Modelling the deviation within a throw allows for various free parameters. For example one might argue that some players are better at gauging their throw in horizontal or vertical direction respectively which would result in fixed ratios for or that the distinction between left- and right-handed dartists causes tilted spread patterns. In this work we study the three simplest cases by investigating the isotropic case, where the spread in the horizontal and vertical direction are assumed to be equal, i.e. , and where a player is better at adjusting in one of these directions. To this end we study normal distributions where one standard deviation is twice as large as the other one. We dub these cases horizontal and vertical, indicating in which direction the spread is larger, i.e. or for horizontal and vertical respectively. Sketches for these kernels are depicted in Fig. 2.
Having set up the machinery we proceed by computing the expectation value landscape (EVL) via
| (2) | ||||
for various spread widths .


III Results
We compute the expectation value landscape for spreads ranging from cm to cm. For the anisotropic cases we write . For small the EVL essentially coincides with the mere board whereas it smears out as the spread in the throw grows, i.e. the aim of the player gets worse. This process is shown in Fig. 3 at the example of the isotropic case.


The natural question arising now is what field to aim for in order to maximise the expected score. For professional players who throw very precisely, i.e. have a very small spread, it is to expect that the highest field of the board (triple 20) will also result in the highest outcome. For newcomers who have a hard time hitting the board, it is presumably wisest to aim for the middle of the board, i.e. the bulls eye, in an effort to make sure to score at all. However, this reasoning up to now is solely qualitatively and lacks numerical support. Moreover it is unclear what favourable fields in between these two extremes are and how these vary in dependence of the spread .
In order to answer these questions we determine the exact position of the maxima of each EVL . We depict its trajectory, the eponymous maximum expected reward line (MERL) as a curve on in Figs. 4 and 5.
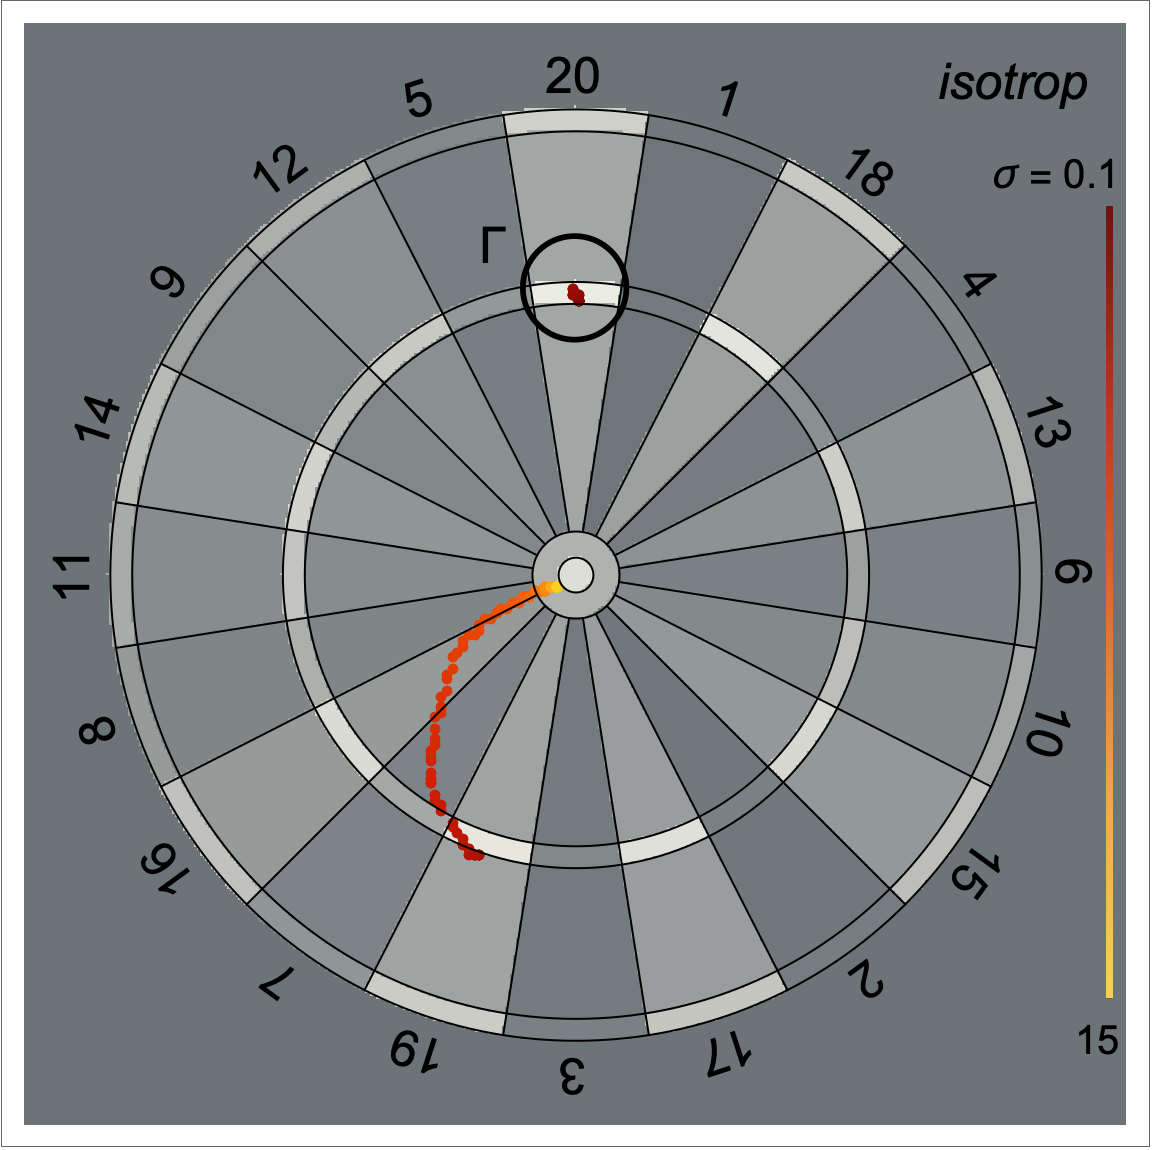


In accordance with our previous reasoning the two extremes for highly accurate players as well as for absolute greenhorns lie on the triple-20 and close to the bulls eye respectively.
Interestingly however we find that with increasing spread of the profiles every case exhibits discontinuities in the respective MERL, associated to jumps of the critical highest-expectation value neighbourhoods (CHEN). Before delving into the question how the abstract quantity effectively can be used to advocate for different aims, we discuss the qualitative structure of the MERLs.
For the isotropic case we find upon exceeding cm the maximum of the respective EVL jumping from within the triple-20 segment to triple-19 before following an arc across the 7 and 16 heading towards the bulls eye. In the horizontal case the picture is similar with the MERL starting within the triple-20 before jumping to the triple-19 at cm. Upon then the MERL follows on in the direction of the 7 before turning back to the centre of the 19 segment while steadily moving towards the bulls eye. The MERL of the vertical case exhibits the most features. It starts of at the triple-20 from which it jumps to the triple-19 at cm. Moving slightly upwards it exhibits another jump at cm ending in the 11 segment. Heading towards the bulls eye it follows an arc through the 8.
Without any interpretation, remains abstract and lacks applicability. To address this apparent shortcoming we define regions centered around each point of the MERL satisfying the condition that some fixed percentage of all thrown darts fall into this region, allowing a feasible understanding of jumps of the CHEN. For our purposes we focus on the case that 50 hit . Moreover we are still free to set the geometry of the region. In consideration of the underlying probability distribution we set up as ellipses, i.e. we determine such that
| (3) | ||||
| (4) |
For the isotropic case we require to also be radially symmetrical, i.e. a circle with radius . For the other spread profiles we set and for the horizontal and vertical cases respectively. Denoting the small half axes by , we find cm for the isotropic case, cm for the horizontal one and for the vertical spread profile cm and cm. The respective regions are depicted in Fig. 4 and 5 and visualize how well the players’ aim at least needs to be before switching according to the jump in the MERL.
Lastly we study whether following the MERL can actually give rise to a significant improvement concerning the expected outcome of the throw opposed to simply always aiming at triple-20 which yields an expectation value we denote . With we denote the expectation value for the most cautious strategy of always aiming the bulls eye. We depict the expected return following the different strategies in Fig. 6.


Until the first jump the MERL is in the triple-20 section and both strategies coincide. After that the lines fan out, the MERL turns to higher rewards than simply aiming for triple-20 up to the point where the spread is so broad that hitting the board in the first place becomes a challenge and the precise aim becomes subordinate. In this process the MERL and the line corresponding to bulls eye-strategy converge.
Measuring the difference between following the MERL and consistently throwing at triple-20 we find in Fig. 7 a) that adjusting the strategy according our suggestion can give rise to up to points per three darts.
Studying the advantage of the MERL over (see Fig. 7 b)) we find that especially at low our strategy to give rise to higher rewards in the order of 10 per throw across all three considered spread models. Also at intermediate width from 2cm to 4cm, following the MERL promises an increased reward of up to 6 points per three darts. However for a spread width cm the inaccuracies are so large that benefits from following a strategy such as the one put forward in this paper become negligible as the MERL and converge.


IV Conclusion and outlook
In this paper we studied how the ideal aim on a dart board changes when the spread of the underlying throw grows. To do so we assumed that the throws obey a normal distribution for the imprecisions in horizontal and vertical directions. We discovered that the resulting ideal aims gives rise to a discontinuous curve on the dart board. With this we propose a strategy which allows the player to maximise the reward of each throw. Comparing with the approach of always aiming at T20 we find an increased score of up to 7.5 points per turn.
However, we wish to stress that all findings in this paper are based on the underlying assumptions that the spread can be described by a normal distribution as well as that the spread is identical for all aims, i.e. there are no regions on with the throw is more accurate than on others. Hence we encourage every interested reader to go ahead and probe our model themselves. In this sense: Game on!
V Acknowledgement
We would like to thank Robin Steinigeweg for fruitful discussions on the numerical aspects of this project. Special thanks also go to Mariel Kempa, Markus Kraft and Jiaozi Wang for helping us to assess the content of this paper in an empirical manner in the margin of the DPG spring meeting 2024 in Berlin. MF would also like to thank Daniel Westerfeld for interesting discussions on darts in general as well as Simon Sperlich and Felix Schäfer for insightful comments on an earlier version of this project.
References
- PDC Europe [2024] PDC Europe, PDC Europe Rules (https://www.pdc-europe.tv/rules/, last visited March 26, 2024).
- Departement of Local Goverment, Sport and Cultural Industry, Government of Western Australia [2024] Departement of Local Goverment, Sport and Cultural Industry, Government of Western Australia, Sports Dimensions Guide Dart (https://www.dlgsc.wa.gov.au/sport-and-recreation/sports-dimensions-guide/darts, last visited March 26, 2024).
- Gauß [1809] C. F. Gauß, Theoria Motus Corporum Coelestium in Sectionibus Conicis Solem Ambientium (Cambridge Library Collection - Mathematical Sciences, 1809).
- d’Alembert [1754] J.-B. L. R. d’Alembert, Recherches Sur Differens Points Importans Du Systeme Du Monde (Kessinger Publishing, 1754).
- Lacroix [1800] S. F. Lacroix, Traité du calcul différentiel et du calcul intégral (Chez Courcier, Paris, 1797–1800).