A novel decision fusion approach for sale price prediction using Elastic Net and MOPSO
Abstract
Price prediction algorithms propose prices for every product or service according to market trends, projected demand, and other characteristics, including government rules, international transactions, and speculation and expectation. As the dependent variable in price prediction, it is affected by several independent and correlated variables which may challenge the price prediction. In order to overcome this challenge, machine learning algorithms allow more accurate price prediction without explicitly modeling the relatedness between variables. However, as inputs increase, it challenges the existing machine learning approaches regarding computing efficiency and prediction effectiveness. Hence, this study introduces a novel decision-level fusion approach to select informative variables in price prediction. The suggested meta-heuristic algorithm balances two competitive objective functions, which are defined to improve the prediction’s utilized variables and reduce the error rate simultaneously. In order to generate Pareto-optimal solutions, an Elastic net approach is employed to eliminate unrelated and redundant variables to increase the accuracy. Afterward, we propose a novel method for combining solutions and ensuring that a subset of features is optimal. Two various real data sets evaluate the proposed price prediction method. The results support the suggested model’s superiority concerning its relative root mean square error and adjusted correlation coefficient.
keywords:
Elastic Net, MOPSO, High-dimensional regression problem , Decision-level fusion.1 Introduction
Intelligent price prediction is a vital function of machine learning and pattern recognition techniques [Zhang et al., 2018]. Researchers have sought to establish more accurate price prediction models to enhance price prediction accuracy. Methodologies range from mathematical models such as linear regression and statistical analysis [Ma et al., 2016, Bhargava et al., 2017, Chandrasekaran et al., 2021, Amik et al., 2021, Cho et al., 2021, Zheng and He, 2021] to alternative techniques employing artificial intelligence, such as expert systems [Kim and Kim, 2010, Kim et al., 2005]), neural networks [Hsu, 2011, Kim et al., 2005, Bhargava et al., 2017, Juszczyk, 2017, Odeck, 2019, Hao et al., 2020, Amik et al., 2021, Zhang and Ma, 2021], and deep learning Wang and Wang [2020], Haq et al. [2021], Zheng and He [2021], Critien et al. [2022].Hence, forecasting prices is essential for every stakeholder in the business to mitigate risks and make well-informed decisions.
Many characteristics are usually considered when a price prediction is made using machine learning techniques[Asghar et al., 2021]. However, it is hard to identify the most relevant characteristics of a product/service to its price and ignore the others in real-life applications. The presence of unrelated and insignificant features complicates the learning process and impacts the reliability of results. As shown in table LABEL:tab:SalepriceLiteratureTable and Li and Becker [2021], Yun et al. [2021], the prediction accuracy rely heavily on feature selection methods because it provides a powerful solution against the dimensionally cursed phenomena. By excluding the overlapping and unnecessary features from the data, the important and relevant ones are selected for any data mining process [Ayesha et al., 2020, Eesa et al., 2013].
Methods for selecting features are initially classified into several categories. The filter, wrapper, and embedded methods are the most prevalent[Abd-Alsabour, 2018, Verleysen and François, 2005, Padmaja and Vishnuvardhan, 2016], and hybrid [Eesa et al., 2015, Leung and Hung, 2008], and ensemble [Lazar et al., 2012, Mahmood and Abdulazeez, 2017] are the most recent. In filter methods, candidate subsets are evaluated by using statistics measurements such as mutual information and rough set theory [Chandrashekar and Sahin, 2014, Swiniarski and Skowron, 2003]. Through the use of this approach, features can be selected without relying on any learning models. An added advantage of this technique is its effectiveness and working well with high-dimensional data sets, and it outperforms wrapper methods.
Moreover, using this method has the principal disadvantage of neglecting the selected subsets’ integration and the learning models’ performance[Abd-Alsabour, 2018, Jindal and Kumar, 2017, Teng, 2003]. The wrapper methods assess the quality of features after the most valuable ones are chosen for prediction. It is more accurate than the filter methods [Jain and Singh, 2018, Jindal and Kumar, 2017, Zhao et al., 2013]. The principal disadvantages of the wrapper methods include computing complexity and greater exposure to over-fitting. In general, wrapper methods require large amounts of computation time to achieve convergence and can be intractable for more extensive data sets [Zeebaree et al., 2019, Jain and Singh, 2018]. The embedded methods employs a mechanism that guides feature evaluation based on the properties embedded within its learning. Regularization, sometimes referred to as penalization, is the most prevalent embedded method. The embedded methods eliminate the features with coefficients less than a threshold, and thus the model will be less complex[Kabir et al., 2010]. Hence, the embedded method is computationally more efficient and tractable without sacrificing performance than the wrapper and filter methods[Cilia et al., 2019]. Moreover, it can be argued that embedding methods rely on linear correlations between features and response variables, which may not be valid for high-dimensional data setsAmini and Hu [2021].Hence,hybrid methods illustrate recent developments in the feature selection field by combining at least two methods from different approaches (e.g., wrapper, filter, and embedded), procedures that meet the same criteria, or two feature selection methods. A hybrid methodology combines the benefits of both methodologies by combining their complementary characteristics [Kabir et al., 2010, Peng et al., 2010].Moreover, ensemble approaches have recently been developed [Hashemi et al., 2021]. These methods derive a subset of features by aggregating the results of several feature selection algorithms. Incorporating numerous procedures allows the methodology for selecting the features to operate better than using one. Moreover, it is possible to treat the feature selection problem as a multi-objective optimization problem Al-Tashi et al. [2020].However, various multi-objective algorithms may find different feature subsets[Vickers, 2017].Hence, this paper introduces a hybrid procedure to concern this challenge. A multi-objective particle swarm optimization algorithm is utilized in the wrapper approach to lesson the root-mean-square error(RMSE) during the Elastic net(EN) training. Since there is no guarantee that meta-heuristic algorithms achieve the best solution, the EN is implemented to the smaller subset of data to exclude features that are still irrelevant. Then, a new fusion algorithm is developed to achieve the optimal and stable feature subset. Utilization of the fusion algorithm may lead to achieving a more stable subset of features that guarantee the optimal selected features. The model’s efficiency is investigated for predicting sale prices in two real data sets. Following is an outline of the main contributions of this paper:
-
1.
We develop the fitness functions to incorporate the number of features and relative RMSE minimization concurrently.
-
2.
We develop a novel decision-level fusion algorithm to achieve a more reliable and stable subset of features.
-
3.
Real case studies of price predictions validate the performance of the proposed method.
The rest of this article is organized in the following manner. Section 2 discusses the relevant literature ,and the critical ideas employed in the suggested approach are presented in section 3. Section 4 introduces the sales price data sets and examines the effectiveness of the proposed approach in price prediction. Finally, section 5 concludes the study and makes suggestions for further research.
2 Related Works
2.1 Sale price prediction
Studies related to price prediction have been conducted in several economic areas, such as stock markets[Zhang et al., 2017a], oil prices [Cen and Wang, 2019], electricity loads[Bicego et al., 2018], and electricity prices [Qiu et al., 2018], real estates [Crosby et al., 2016], and airfare [Tziridis et al., 2017], which provide essential information for decision making. Hence, the importance of this issue cannot be overstated in the design of today’s economic systems. As a result, developing a forecasting prices method is essential for every business stakeholder as it helps reduce risks and make informed business decisions. It is generally possible to classify price prediction methods into two categories based on the task they are intended to perform[Ma et al., 2020]. The first method involves predicting the price trend over a specific time, such as stock and oil prices. Another method involves estimating a particular item’s price based on its characteristics, for example, the price of an old automobile or a house. Specifically, this paper discusses the second kind of price prediction task in house and old car price prediction as two real case studies. Table LABEL:tab:SalepriceLiteratureTable reviews the recent studies on price prediction models in various fields. Herein, we investigate all types of price prediction, including cost price, wholesale price, retail price, and sale price, estimated by a data prediction model based on several features. Table LABEL:tab:SalepriceLiteratureTable shows that most studies employ machine learning techniques by considering a few features.
| Author(s)-Year | Research objectives | No. of Features | Case study | Prediction Technique |
| Kim et al. [2005] | Estimating the initial costs of residential buildings using a hybrid model | 8 | Residential buildings | Neural network and genetic algorithm |
| Kim and Kim [2010] | Developing an estimation model for construction costs | 10 | Residential building | Case-based reasoning and genetic algorithm |
| Hsu [2011] | Presenting a hybrid model that can be used to predict stock prices | 16 | Stock price prediction | Self-organizing feature map and genetic programming |
| Gao and Zhang [2013] | Designing a multi-objective Markov model aimed at minimizing maintenance costs and users’ costs | 5 | Maintenance | Markov model |
| Fereshtehnejad and Shafieezadeh [2016] | Introducing a methodology for the evaluation of the life-cycle costs of infrastructure subject to multiple hazards | 5 | Infrastructure project | Dynamic programming procedure |
| Ma et al. [2016] | Utilizing an ontology to establish a practical method of formalizing construction costs | 6 | Construction buildings | Specification ontology approach |
| Bhargava et al. [2017] | Assessing the likelihood of cost escalation and the severity of deviations in infrastructure projects | 34 | Infrastructure projects | Monte Carlo simulation and statistical models |
| Juszczyk [2017] | Using artificial neural networks to estimate construction costs in a non-parametric manner | Not defined | Construction projects | Neural network |
| Wang and Wang [2020] | Proposing a multi-hybrid neural network model based on a complex deep learning algorithm for predicting crude oil prices | 12 | Crude oil price | Deep neural network and wavelet transform |
| Hao et al. [2020] | Proposing a hybrid model for carbon price forecasting using feature selection and multi-objective optimization | 30 | Carbon price prediction | Extreme machine learning and grasshopper optimization algorithm |
| Haq et al. [2021] | Developing a two-stage stock price prediction model | 44 | Stock price prediction | Deep generative model |
| Amik et al. [2021] | Providing a system to estimate the price of a pre-owned vehicle for a prospective buyer | 10 | Car price prediction | Linear regression,LASSO, decision tree,random forest |
| Cho et al. [2021] | Developing a hybrid cryptocurrency price prediction market | 12 | Predicting a stock market index and cryptocurrency price | Genetic algorithms, regression functions |
| Li and Becker [2021] | Analyzing the influence of market coupling on the prediction of electricity prices | 62 | Energy prediction | LSTM deep neural network |
| Yun et al. [2021] | Developing an enhanced feature engineering process for stock price direction prediction is proposed | 67 | Stock price prediction | GA-XGBoost algorithm |
| Zhang and Ma [2021] | Developing a learning model for accurate evaluation of used car prices | 19 | Car price prediction | Support vector regression |
| Zheng and He [2021] | Using advanced machine learning techniques to improve the accuracy of share price predictions in the aerospace industry | 15 | Predictions for aerospace share prices | Recurrent Neural Networks and principle component analysis |
| Critien et al. [2022] | Proposing a sentiment analysis approach to predict the Bitcoin price | 5 | Cryptocurrency price prediction | Convolutional neural networks |
2.2 Home price prediction
Human settlement is characterized by the price of houses being highly correlated with socioeconomic activities [Chen et al., 2016]. Researchers and stakeholders in residential construction, urban design, and infrastructure planning can benefit from being aware of the changes in housing prices in addition to house buyers[Kang et al., 2021]. Researchers have made considerable efforts in economics, econometrics, geography, and public policy to understand how property values affect socioeconomic environments over the last several decades[Archer et al., 1996, Cao et al., 2019, Fu et al., 2019, Hu et al., 2019]. Hence, house prices increase yearly due to increased demand[Zulkifley et al., 2020]. The house-price model provides numerous benefits for home buyers, investors, and builders. Through this model, home-buyers, lenders, and builders will access valuable information, such as current home prices, enabling them to estimate a house’s price. Additionally, this model can assist purchasers in choosing a house based on their budget[Febrita et al., 2017]. As a result, it is imperative to develop a new predictive model that estimates the house price with the highest accuracy and reliability. A problem arises when the house price is affected by multiple factors, such as location and property demand. Therefore, most stakeholders, including purchasers, investors, contractors, and the real estate industry, are interested in knowing the exact factors affecting house prices, enabling investors to make informed decisions and assist builders in determining the house price.
A paradigm for evaluating housing prices can be classified as conventional or advanced, according to [Pagourtzi et al., 2003]. Some traditional methods include step-wise analysis and multiple regression, while recent methods include hedonic pricing tools, artificial neural networks, and spatial analysis [Zulkifley et al., 2020].
Various models are available for predicting house prices, so it is essential to select the best model. Among the studies in this field, regression analysis is widely used in several studies [Alfiyatin et al., 2017, Chang et al., 2019]
. Support Vector Regression is another standard model for predicting house prices [Lin and Chen, 2011, Chen et al., 2017, Phan, 2018]. Since house price prediction involves many non-linear features, artificial neural networks can model complex non-linear relationships. Hence, [Mukhlishin et al., 2017, Wu et al., 2018] provide an analysis of home price prediction by artificial neural networks that yields a positive result. In this regard, it can provide an exact prediction model.
Moreover, advanced computer vision techniques have enabled extracting information from images of urban environments. Recently, several studies have demonstrated the effectiveness of visual data in predicting house prices and analyzing neighborhood culture and socioeconomic characteristics [Gebru et al., 2017, You et al., 2017, Yao et al., 2018, Law et al., 2019, Fu et al., 2019, Chen et al., 2020, Zhang et al., 2020].
2.3 Old car price prediction
Vehicles in different categories, like cars, sedans, coupes, support cars, station wagons, hatchbacks, convertible sport-utility vehicles (SUV), minivans, and Pick-up trucks, play a crucial role in human lives[Berry et al., 2004]. Moreover, the growing demand for private cars has increased the demand for used cars, creating a market opportunity for both the buyer and seller. Many countries recommend that customers purchase a used car as the price is reasonable and affordable[Monburinon et al., 2018]. As they are used for a few years, reselling them at a profit may be possible. Nevertheless, several factors contribute to the price of a used vehicle, including its age and condition. Generally, used car pricing does not remain constant. As a result, a predictive model for forecasting car prices is necessary as a supporting tool in the trading process[Gajera et al., 2021].
Predicting used car prices has been the subject of several previous studies. The literature presents a variety of price-prediction models, including multiple linear regression[Noor and Jan, 2017], support vector regression[Peerun et al., 2015], and gradient-boosted regression trees[Sun et al., 2017]. Moreover, each prediction model is based on data collected from an online marketplace to identify the most accurate model for predicting used car prices[Struyf et al., ].
2.4 An overview of feature selection methods
The pricing of old cars or houses using machine learning directly relates to the process by which technical systems acquire their information, resulting a high-dimensional data [Camero et al., 2018]. Thus, when the information has a significant number of features, the precision of the prediction model and its execution time might be adversely affected, known as the dimensionality curse [Gegic et al., 2019]. However, a variety of these features are partial/inappropriate or irrelevant to the sale price [Myers, 2016, Rafiei and Adeli, 2018]. Therefore, if the information consists of excessive features, resulting (1) the requirement of ample storage capacity and (2) decreased prediction speed and accuracy. Thus, preprocessing of data aimed at dimensionality reduction is crucial. In this vein, instance and feature selection models are widely used [Pérez-Rodríguez et al., 2015].
Feature selection is an NP-hard problem with states, where is the number of features. It is becoming increasingly complex as increasesAl-Tashi et al. [2020].
Our investigation of feature selection literature demonstrates that most studies focus on classification problems (see Table LABEL:tab:LiteratureTable, last columns). That is maybe most real-world classification problems often lack sufficient information about relevant features. Thus, numerous features are presented to demonstrate the domain, resulting in redundant or irrelevant information. It is possible to significantly reduce the number of irrelevant/redundant features while yielding a more general classifier. This is beneficial for understanding the underlying concept of real-world classification issues [Tang et al., 2014]. For classification problems, the choice of features can take place independently of the learning algorithm, such as filter models [Tian et al., 2020, Hoque et al., 2018, Nguyen et al., 2016, Xue et al., 2013] or the evaluation of the quality of selected features by utilizing the learning algorithm, such as wrapper models [Kozodoi et al., 2019, González et al., 2019]. In embedded models, features are selected during training so that the model becomes less complex by discarding features whose coefficients are below a certain level [Zhang et al., 2017b, Marafino et al., 2015, Zheng and Liu, 2011, Ma et al., 2007]. Hybrid models integrate two or more well-studied models to create a novel approach to solving feature selection challenges in classification [Zhou et al., 2020, Nguyen et al., 2016, Khan and Baig, 2016, Xue et al., 2012, Ma et al., 2007].Compared with traditional techniques, the hybrid approach frequently capitalizes on the sub-models advantages and is more robust [Got et al., 2021, Lu et al., 2017, Khan and Baig, 2016]. In the ensemble models, the output of many feature selection strategies is assembled to get the ultimate feature set [Tsai and Sung, 2020, Ng et al., 2020, Drotár et al., 2019, Ansari et al., 2019, Brahim and Limam, 2018, Seijo-Pardo et al., 2017, Das et al., 2017, Ebrahimpour and Eftekhari, 2017]. Moreover, in the hybrid and ensemble models proposed for classification problems, various meta-heuristic algorithms are applied for feature selection problems. NSGA-II [Kozodoi et al., 2019, Li et al., 2016, González et al., 2019], MOPSO [Amoozegar and Minaei-Bidgoli, 2018, Ng et al., 2020, Xue et al., 2012], SPEA-II [Xue et al., 2013], MOEAD [Zhou et al., 2020] are the most common algorithms which applied to solve this issue since they have lower computational cost and convergence more rapidly than other algorithms.
As shown in Table LABEL:tab:LiteratureTable, most of the hybrid or ensemble-based feature selection models target this problem for classification and have not been adequately considered in regression problems.This is a major motivation for this study.
It is often possible to describe a regression model using a linear combination of the most informative characteristics using a regression model based on an ordinary least squares (OLS) approach and a statistical regularizer[Zhang et al., 2017b]. Therefore, regression models retain information regarding the initial feature space and allow us to determine the most relevant ones. The most known embedded models are Lasso [Muthukrishnan and Rohini, 2016, Zhang et al., 2017b, Zheng and Liu, 2011] and Elastic net(EN) [Amini and Hu, 2021, Marafino et al., 2015, Panagakis and Kotropoulos, 2014], owing to their ability to modify penalty terms within the regularization method and time-savings.
Table LABEL:tab:LiteratureTable also illustrates that the most recent relevant study in this field is by Amini and Hu [2021], in which a two-stage approach with a genetic algorithm is developed in the first stage to eliminate the irrelevant features. Then, the EN algorithm is implemented to omit the redundant features. In this study, the regularization parameters of EN algorithm is tuned manually after the first stage and the authors claim that the algorithm achieves sub-optimal solutions for any regression problem.
Moreover, inAmini and Hu [2021], the feature selection problem is formulated as a single-objective optimization problem that does not guarantee the best solution. In contrast, in our paper, the regularization parameters are tuned with the MOPSO algorithm simultaneously to guarantee the optimal solution. Hence, the problem is solved by modeling the feature selection problem as a multi-objective optimization problem. We adopt the MOPSO to boost the search quality since it can achieve superior results and prevent a thorough search for the Pareto feature subsets. Then, to achieve the stable subset of the optimal feature, a new algorithm has been proposed, which lies in getting the final optimal feature subset. In this stage, the proposed method as a decision-level fusion procedure has been applied to merge the Pareto subset of features to achieve a stable and reliable subset. Hence, the proposed method may improve the accuracy and prediction error in regression problems.
| Author(s) | Research objectives | Feature selection approach | Case study | Problem Type | |||||
|
Filter |
Wrapper |
Embedding |
Hybrid |
Ensemble |
Classification |
Regression |
|||
| Ma et al. [2007] | Proposing a new Lasso classifier | - | - | ✓ | ✓ | - | Micro-array gene expression data | ✓ | - |
| Zheng and Liu [2011] | Developing a new feature selection method based on Lasso algorithm | - | - | ✓ | - | - | Cancer data | ✓ | - |
| Xue et al. [2012] | Proposing two feature selection methods using MOPSO | ✓ | - | - | ✓ | - | UCI data sets | ✓ | - |
| Xue et al. [2013] | Designing a filter-based feature selection method using mutual information and entropy metrics | ✓ | - | - | - | - | UCI data sets | ✓ | - |
| Panagakis and Kotropoulos [2014] | Developing a new feature selection using the Elastic net regularization method | - | - | ✓ | - | - | Audio data | - | ✓ |
| Marafino et al. [2015] | Developing an effective feature selection method for text classification | - | - | ✓ | ✓ | - | Text data | ✓ | - |
| Khan and Baig [2016] | Proposing a hybrid feature selection method | - | - | - | ✓ | - | UCI data sets | ✓ | - |
| Nguyen et al. [2016] | Proposing two feature selection methods by inserting swapping and non-dominating strategy to improve local search | ✓ | - | - | ✓ | - | UCI data sets | ✓ | - |
| Muthukrishnan and Rohini [2016] | Exploring the performance of the traditional feature selection method and Lasso | - | - | ✓ | - | - | Real data in R packages | - | ✓ |
| Zhang et al. [2017b] | Devising a new regularization based on Lasso regression for feature selection problem | - | - | ✓ | - | - | The USPS handwriting digit data set/UCI data sets | ✓ | - |
| Seijo-Pardo et al. [2017] | Proposing two different homogeneous and non-homogeneous feature selection methods | - | - | - | - | ✓ | UCI data sets | ✓ | - |
| Das et al. [2017] | Proposing a new ensemble feature selection method | - | - | - | - | ✓ | UCI data sets | ✓ | - |
| Ebrahimpour and Eftekhari [2017] | Proposing an ensemble feature selection method based on maximum relevance and minimum redundancy | ✓ | - | - | ✓ | ✓ | Micro array high-dimensional data sets | ✓ | - |
| Sohrabi and Tajik [2017] | Predicting the dose of Warfarin | - | - | - | ✓ | - | Warfarin data set | - | ✓ |
| Hoque et al. [2018] | Suggesting a new feature selection algorithm using filter feature ranking methods | ✓ | - | - | - | ✓ | Network data set /UCI data sets | ✓ | - |
| Brahim and Limam [2018] | Designing an ensemble feature selection method using various features ranker methods | - | - | - | - | ✓ | Lymphoma data sets | ✓ | - |
| Ansari et al. [2019] | Proposing an ensemble feature selection method for sentiment classification | - | - | - | - | ✓ | Movie review datasets/Amazon product data set | ✓ | - |
| Kozodoi et al. [2019] | Proposing a wrapper method based on NSGA-II | - | ✓ | - | - | - | Credit scoring data | ✓ | - |
| González et al. [2019] | Proposing a new wrapper method based on NSGA-II | - | ✓ | - | - | - | Motor imagery data | ✓ | - |
| Drotár et al. [2019] | Proposing several ensemble techniques for feature selection problem | - | - | - | - | ✓ | Madelon data sets | ✓ | - |
| Tian et al. [2020] | Proposing a heterogeneous ensemble approach | ✓ | - | - | - | ✓ | Sensor based human activity data | ✓ | - |
| Zhou et al. [2020] | Designing a two-level strategy method for feature selection problem using MOPSO and MOEA/D | ✓ | - | - | - | ✓ | Sensor based human activity data | ✓ | - |
| Ng et al. [2020] | Proposing a training error and sensitivity based ensemble feature selection method using NSGA-II | - | - | - | - | ✓ | UCI data sets | ✓ | - |
| Tsai and Sung [2020] | Proposing an ensemble feature selection using parallel techniques | - | - | - | - | ✓ | UCI data sets | ✓ | - |
| Amini and Hu [2021] | Proposing a new hybrid GA-EN feature selection approach for regression problems | - | - | - | ✓ | - | US-NAM parent data sets | - | ✓ |
| Kenney et al. [2021] | Developing a mixed integer programming feature selection method for regression problems | - | - | - | ✓ | - | simulated data | - | ✓ |
| Got et al. [2021] | Devising a novel hybrid filter-wrapper feature selection strategy using the whale optimization algorithm | ✓ | ✓ | - | ✓ | - | UCI data sets | ✓ | - |
| Hashemi et al. [2021] | Proposing a Pareto-based ensemble feature selection method | - | - | - | - | ✓ | UCI data sets | ✓ | - |
| This Study | Proposing a decision-level fusion method for Pareto-based ensemble feature selection | - | ✓ | ✓ | ✓ | ✓ | Two high-dimensional price prediction data sets | - | ✓ |
3 Model building
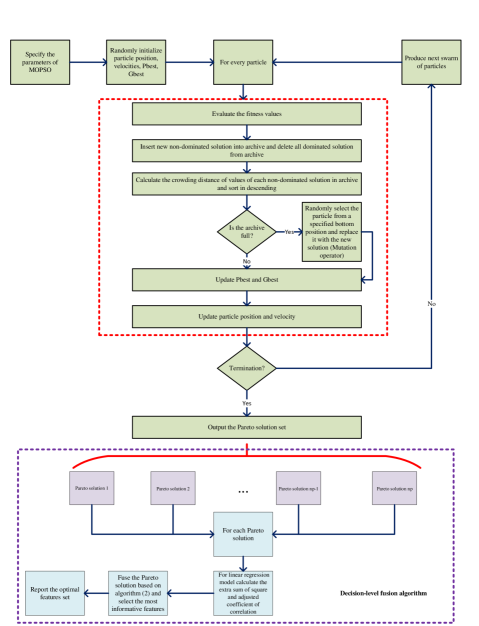
This section describes the proposed approach for selecting features in regression problems. Initially, a wrapper-embedded method is developed to identify the feature set that provides the best prediction accuracy while it consists of the least possible cardinality. Meta-heuristic search strategies and EN are used simultaneously in this process. Through the use of the subset of features determined by the meta-heuristic algorithm, EN has been used to eliminate remaining unrelated features for enhancing forecasting accuracy. The outcome of this step is the subsets of features chosen by the wrapper-embedded approach. Then, we apply a new fusion method to achieve a more accurate and stable optimal solution set. Hence, the fusion algorithm is utilized as a decision-level fusion mechanism to integrate the Pareto-optimal solutions and improve accuracy and error prediction.
3.1 Elastic Net
The EN is a model that integrates Ridge regression and Lasso regularization. Like Lasso, EN can construct a simplified version of the regression model by making coefficients with zero values. Studies have shown that the EN model can improve upon Lasso on highly correlated data [Park and Mazer, 2018]. For an between 0 and 1, and a non-negative , EN solves the following problem [Simon et al., 2013]:
| (1) |
where,
| (2) |
In this model, refers to the cardinality of data, is the corresponding dependent variable at data, refers to the variable, corresponds to a value of the regularization parameter, while and are scalar, and the vector, respectively. EN produces the same results as Lasso when , and once shrinks toward ; EN becomes closer to Ridge regression; otherwise, the penalty term ranges between the norm of and the norm of .
3.2 The MOPSO algorithm
Meta-heuristic algorithms can be utilized to select features based on their capabilities. MOPSO is chosen in this article because it is compatible with many problems associated with feature selection. If the objectives are complicated, the MOPSO is an appropriate tool. Following is a description of the suggested algorithm:
-
1.
Encoding and decoding particle: In MOPSO, developing an appropriate coding/decoding approach is crucial to represent a possible solution. Typically, a binary strategy is utilized to create a solution [Chuang et al., 2011, Unler and Murat, 2010, Wang et al., 2007].The structure of the proposed solution is regarded as a vector with elements, where indicates the number of features,and the last part of the solution is a real number between 0 and 1, denoted by the regularization parameter of EN (). This part of the solution is used for tuning the hyper-parameters of EN. In the decoding stage, the solution is converted into a solution as follows:
(3) where, reveals that the feature is included in the feature subset .
-
2.
Fitness evaluation: This paper regards two objective conflict functions to select the feature sets that provide high prediction accuracy while using a minimum cardinality. Thus, the solutions identified through the search process are archived in a manner that maintains the solutions with the most significant features and the lowest prediction error.
-
3.
Update the archive:This paper uses the crowding distance to determine the number of new individuals. Because the crowding distance has no parameters, this article employs it to eliminate or update the full archive. Several multi-objective evolutionary algorithms have used the crowding distance[Xue et al., 2012, Deb et al., 2002, Hamdani et al., 2007, Chaleshtori et al., 2020].Assuming that the archive at iteration t is At and the new swarm is St. First, we select all solutions that are non-dominated in the combined swarm . Then, the non-dominated solutions are added to replace their prior contents. Upon reaching the maximum size of the archive, only those with the most significant crowding distance are preserved (the number of solutions(), also called archive size).
-
4.
Update the personal and global best position: represents the particle’s best position. This paper utilizes a domination-based strategy proposed by Reyes-Sierra et al. [2006]to update the particles’ best positions. The old particle’s memory is kept if the decoded solution is dominant; otherwise, the decoded solution is changed with the old one. is the best solution derived from the particle neighbors. Due to the conflicting nature of multi-objective optimization problems, selecting the best solution can take time and effort. Hence, based on the diversity of non-dominated solutions in the archive, we employ the crowding distance proposed by Coello et al. [2007] to evaluate the diversity of non-dominated solutions. Moreover, the binary tournament is applied with these crowding distances to identify each particle’s . A higher crowding distance denotes a higher probability of selection as the .
-
5.
Mutation Operator:After exploring the solution space, if some particles locate a suitable position, the others will fly toward that position. This location may be a local optimum, so particles will not re-explore the entire solution space. Furthermore, the algorithm will get stocked into local optima due to a loss of diversity of particles [Cheng et al., 2011]. Hence, a hybrid mutation based on two efficient operators is presented in this article to avoid the above limitations. The first is the reset operator, intended to preserve the diversity of the swarm. This operator allows some particles to reset their velocity periodically. The other is hop mutation, which enhances searching in general. As a result of this operator, each particle has a uniform jump probability in any dimensional space. Generally, not all components are requested by the hop operator, which can be regarded as a partial particle reset. Thus, unlike the first operator, it permits more exploration in solution space. Using the two operators in combination does not significantly increase processing time compared to the conventional MOPSO.
-
6.
Termination condition: Stop conditions are a set of criteria satisfying the viability of a solution. This study considers the maximum iteration number for stopping the MOPSO algorithm.
In detail, the proposed algorithm is described in algorithm 1. represents set and is the set. The coefficients and act as constants that control the effect of and within the exploration. serves as an initial weight to handle particle exploration. The and are random values between zero to one, and is the velocity of the swarm within the search space. For a MOPSO algorithm, Chakraborty et al. [2011] introduces its criteria for convergence based on objective functions. In the following, we will now restate the theorem.
Theorem 3.1.
Consider as the initial population. Under the restrictions formulated in equation (4), MOPSO will ensure that the mean swarm converges to the Pareto optimal set . If is the mean of the population after iterations, then where denotes the Pareto optimal point.
| (4) |
In the presented algorithm, the inertia weight is adjusted to .The acceleration coefficients are determined by equation (5), where is the number of iterations performed. Since these coefficients satisfy equation (4); thus, the swarm converges to the center of the Pareto optimal set as the iteration number grows.
| (5) |
There is evidence that members of the Pareto set may disagree with their choice of features. Hence, the present study proposes a novel method that considers the level of support and the importance of features for prediction accuracy in feature selection. The steps of the proposed approach are explained as a new fusion approach.
3.3 The proposed fusion approach
In the decision-level fusion process, the conflict arising from multiple models must be addressed in the final decision. In the feature selection problem, different models may choose various feature subsets. Hence, it is crucial to integrate their decisions to achieve a more reliable subset of features. This article presents a feature selection method and explains thoroughly for regression problems. In the proposed fusion approach, the adjusted coefficient of determination indicates the accuracy level of each Pareto member, and the normalized indicates the degree of support for each of them. In addition, the extra sum of squares assesses the level of uncertainty in prediction accuracy. The assigns the initial weight to each selected feature. Then, we apply a simple additive weighing algorithm to calculate the final weight. The final score of the features is utilized to identify the best ones. Therefore, a subset of features is selected using the given scores calculated by the proposed weighting method. The proposed approach is much more reasonable in handling conflicts of Pareto members in selecting the features by MOPSO for regression problems. The suggested technique contains three parts: the calculation of the degree of support of Pareto members using the normalized , the calculation of the uncertainty in prediction accuracy using , and the calculation of the final score of features using the simple additive weighting method.
3.3.1 The adjusted coefficient of determination
The adjusted coefficient of determination is an extension of , in which the non-essential explanatory variables are penalized [Ramsey and Schafer, 2012]. In this way, it is possible to judge whether adding an explanatory variable provides a better fit. This article uses this criterion to determine the weight assigned to each Pareto member in the regression model. The summation of assigned weights must equal one. Therefore, the normalized is considered as the weight of each Pareto member, formulated as follows:
| (6) |
| (7) |
where is the number of Pareto fronts, is the cardinality of observations, and is the number of features.
3.3.2 The extra sum of squares(ESS)
The is the difference between two regression models’ error sum of squares. The measures the marginal reduction in when another set of features is included in the model. Hence, this assesses the importance level of features in explaining the response variable. Assume that the regression model contains one feature, . If we add another feature, , to the regression model, defines the proportional variation explained by . This can be expressed as .Therefore, the extra sum of squares explains the part of not explained by the original variable [Ramsey and Schafer, 2012]. The can be considered as the confidence/importance degree for the presence of a specified feature in the regression model, calculated as follows:
| (8) |
Generally, the formula for calculation of of an specified variable can be written as follows:
| (9) |
3.3.3 The simple additive weighting method(SAW)
The method is the most commonly used technique, also called the weighted linear combination or scoring method. According to the method, a new weighting approach is suggested to compute the final weight of features. The steps involved in the approach are:
-
1.
Define a Feature-Pareto comparison matrix with elements, where indicates the cardinality of selected features and is the size of Pareto front.
-
2.
Calculate the weight of each Pareto set according to equation (7).
-
3.
Compute the related to each feature of the Pareto members, and then assign a score based on equation (9) to show how crucial it is. Note that the score of features that do not exist in the specified Pareto member equals zero.
-
4.
Evaluate the final score of each feature by equation (10):
(10) -
5.
High-scoring features are considered members of the final feature set.
Steps involved in the proposed procedure are summarized in algorithm 2. The structure of the proposed approach is illustrated in figure(1).
-
1.
According to Equation (7), calculate the weight of each Pareto member,
-
2.
Compute the importance of each feature regarding to Equation (9)
4 Model evaluation
This section assesses the suggested feature selection approach. We employ two real price prediction data sets, and tuning the hyper-parameters should be done before model evaluation.
4.1 Data sets description
Predicting the price of houses is crucial for every national economic forecast. We apply the proposed features selection approach to a data set collected for 372 residential apartments built between 1993 and 2008 in Tehran, Iran Rafiei and Adeli [2016], Dua and Graff [2017]. The data set contains building costs, sale prices, and project and economic variables to analyze individual residential apartments. The total features equal 105, and two output variables: construction costs and sale prices. Overall, the number of instances is equal to 372. The presented method has been utilized to evaluate the performance of predicting housing sale prices as the response variable. Because the features have different ranges, they are normalized to the scale range zero to one.
The second data set predicts the selling price of used cars based on their features and current condition. The problem is to model the sale price of used cars using the features provided in the data set. The client could use it to estimate the price of a particular car. This data set includes categorical variables such as the number of seats, fuel type, vehicle type, and owner type.
Moreover, some continuous variables include the year of the model car, mileage driven, the company’s standard mileage, the engine displacement volume, and maximum power. Records containing missing values are eliminated first to pre-process the data set. Then, a binary variable is created from the categorical variables, and the continuous variables are converted from zero to one range due to their different ranges. After doing the pre-processing steps, the total features equals 37, and the total instances equal 823.
4.2 The performance metrics
Since this study’s response variables are continuous, the and the cardinality of selected features constitute the evaluation metrics. Moreover, a 10-fold cross-validation process is employed to calculate the first objective. The second one is calculated by counting the cardinality of selected features.
4.3 Hyper-parameters tuning
It is important to note that the MOPSO has no standard fixed parameters. They significantly impact the MOPSO performance, so they must be adjusted for each problem to achieve the highest exploitation. Theorem 3.1 specifies that the MOPSO must determine the optimal solution early in the search process. As a result, to increase the likelihood of a rapid enhancement in the MOPSO’s response, a high level of elitism, a small swarm size, an archive size, and a pretty high mutation probability are used. The parameters for the MOPSO tuned for this study can be found in table 3.
| Parameters | Values/Method | |
|---|---|---|
| Car data set | House data set | |
| Maximum number of iteration | 50 | 80 |
| Swarm size | 20 | 35 |
| Archive size | 15 | 20 |
| Inertia weight | 0.4 | 0.4 |
| Initial personal learning coefficient∗ | 1 | 1 |
| Initial global learning coefficient∗ | 2 | 2 |
| Mutation rate | 0.1 | 0.1 |
| Mutation function | Initialized-jumping operator | |
∗ These hyper-parameters are updated by Equation (5) at each iteration
4.4 Model validation
This section compares some classical and advanced feature selection algorithms with the proposed method.
4.4.1 Comparison between the decision-level fusion method and feature selection method based on MOPSO-EN
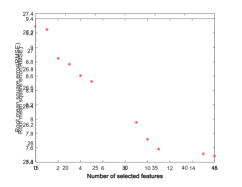
We evaluate the proposed method by randomly dividing each dataset into two sets, 70% for training and 30% for testing. The train data set undergoes a 10-fold cross-validation process to boost its reliability. The proposed method is run in a software program using a laptop with a Corei7 processor and 8 GB of RAM. The overall performance of each Pareto and acquired features set merged with algorithm 2 is evaluated by and metrics. MOPSO-EN is also run for each data set, and the Performance metrics for each Pareto set are reported in table 4. The Pareto set for each data set is illustrated in figures2(a) and 2(b). According to the performance metrics for the House data set, the sale price of the houses can be predicted accurately by at least 15 independent features (Pareto set 5) up to 40 independent features (Pareto set 8).
Moreover, at each Pareto set, about 98% of the variability of the response variable is explained by specific characteristics.
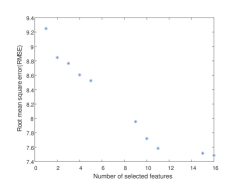
Regarding the performance metrics for the car data set, the selling price of the used car can be predicted by one independent feature (Pareto set 5) up to 16 independent features (Pareto set 1). Moreover, at each Pareto set, at least 80% of the variability of the selling price as a response variable can be explained by selected features. As evident in both data sets, the variability of the target variable can be modeled by different feature sets. Hence, to obtain the more reliable independent features set for each data set, algorithm 2 is applied to the corresponding Pareto features set, and the regression model is built by fused features. According to table 5, for each benchmark data, the overall performance of the regression model built with the fused features set is higher than the ones in each Pareto set in training data. Furthermore, the model built by fused features can predict the response variable with high accuracy in test data. Our findings indicate that the suggested approach is superior in training and testing data for two benchmark data sets.
| House dataset | Car dataset | ||||||
|---|---|---|---|---|---|---|---|
| Pareto set | # selected features | Pareto set | # selected features | ||||
| 1 | 43 | 25.85 | 98.48 | 1 | 16 | 7.48 | 85.03 |
| 2 | 44 | 26.13 | 98.43 | 2 | 15 | 7.51 | 84.88 |
| 3 | 17 | 27.07 | 98.32 | 3 | 5 | 8.52 | 81.49 |
| 4 | 42 | 26.01 | 98.47 | 4 | 4 | 8.60 | 81.04 |
| 5 | 15 | 27.10 | 98.32 | 5 | 1 | 9.2 | 79.85 |
| 6 | 38 | 26.59 | 98.43 | 6 | 9 | 7.95 | 82.92 |
| 7 | 37 | 26.66 | 98.41 | 7 | 2 | 8.84 | 80.32 |
| 8 | 40 | 26.08 | 98.48 | 8 | 3 | 8.76 | 80.68 |
| 9 | 19 | 27.06 | 98.34 | 9 | 11 | 7.58 | 84.73 |
| 10 | 10 | 7.71 | 84.16 | ||||
| House dataset | Car dataset | |||||
|---|---|---|---|---|---|---|
| # fusion features | # fusion features | |||||
| Train data | 46 | 26.33 | 98.41 | 15 | 6.368 | 88.45 |
| Test data | 19.66 | 98.74 | 7.22 | 85.38 | ||
4.4.2 Comparison between the decision-level fusion method and benchmark feature selection methods
This subsection compares the suggested approach with the Elastic net(EN) and the genetic algorithm combined with linear regression(GA-LR) as benchmarks. In comparison with other meta-heuristic algorithms, GA is a highly adaptable algorithm, which is the primary reason for choosing it as a wrapper method benchmark. Moreover, the GA algorithm employs linear regression without incorporating feature selection. An individual is represented as a binary vector with a length of , where expresses that the feature pi is selected for the individual, if the feature
is absent in the individual . We generate an initial population consisting of predetermined numbers of individuals and randomly select numbers 0 and 1 for each entry. The solution with the lowest prediction error and fewer features have been nominated for the next iteration. Equation (11) describes how fitness values for each individual are determined based on the applied fitness function of GA(, which evaluates the fitness value based on the linear regression model. Also, the weights and must be adjusted separately for each data set. These coefficients have been applied to assign the weight to each objective function to transform a multi-objective problem into a single objective. In this paper, four scenarios for these weights are considered using a grid search method.
| (11) |
The elite are chosen as parents according to their fitness value to produce children via crossover and mutation operators. This study’s crossover and mutation operators are similar to those presented in Amini and Hu [2021]. Because GA parameters are not universally fixed and may impact the GA’s performance, it is important to adjust them to the particular problem. Hence, GA parameters can be adjusted to maximize exploitation in this regard. An elitist approach, a small initial population size, and an extremely high mutation probability are applied to ensure a rapid improvement in the GA’s performance. Additionally, random individuals are included in each generation to maintain a diverse population.
Moreover, the number of generations must also be kept low to satisfy the time constraint. Table 6 summarizes the GA parameters tuned in this paper.
Several scenarios are presented in table 7, in which the higher the weight, the greater the importance placed on minimizing the related term. In this study, the scenario with () is ignored because this study intends to enhance prediction accuracy. Table 7 shows each original and selected number of features related to each scenario. In addition, table 7 shows the performance metrics related to each scenario. For both data sets, the wrapper method shows the most significant feature reduction and the minimum . As a result, this method not only reduces the size and complexity of data but also results in minor predicted errors. However, for the last scenario, GA-LR produces the lowest prediction error, although it specifies the most significant subset. The outcomes in tables 5 and 7 indicate that the suggested featured selection method enhances the prediction model’s performance by excluding irrelevant and unnecessary features. Although our proposed method extracts more features than others, resulting in a more accurate prediction and a higher adjusted coefficient for the benchmark data sets. Based on the comparison of performance metrics, the proposed method enhances the prediction accuracy for regression problems.
| GA parameters | House data set | Car data set |
|---|---|---|
| Values/Method | ||
| number of iterations | 100 | 80 |
| Population size | 50 | 60 |
| Crossover rate | 0.7 | 0.8 |
| Mutation rate | 0.1 | 0.2 |
| Scenario | House dataset | Car dataset | |||||
|---|---|---|---|---|---|---|---|
| # selected features | # selected features | ||||||
| (0.3-0.7) | train | 8 | 30.51 | 98.14 | 1 | 10.02 | 77.43 |
| test | 29.02 | 98.35 | 7.66 | 79.16 | |||
| (0.5-0.5) | train | 9 | 23.75 | 98.73 | 1 | 10.04 | 76.57 |
| test | 31.57 | 98.41 | 7.35 | 83.06 | |||
| (0.7-0.3) | train | 12 | 27.41 | 98.62 | 1 | 9.54 | 78.64 |
| test | 22.63 | 98.65 | 9.04 | 74.14 | |||
| (1-0) | train | 62 | 19.88 | 98.99 | 27 | 7.22 | 84.23 |
| test | 21.08 | 98.19 | 9.67 | 80.68 | |||
In addition, Elastic net has been established as the embedded method since it represents a generalized version of Lasso and Ridge regression. The EN method would achieve optimal results through the careful selection of hyperparameters. Therefore, four regularization parameter values are considered in the grid search subset.
| House dataset | Car dataset | ||||||
|---|---|---|---|---|---|---|---|
| # selected features | # selected features | ||||||
| 0 | train | 103 | 427.2 | 97.73 | 33 | 203.28 | 83.85 |
| test | 278.44 | 84.72 | 123.23 | 77.58 | |||
| 0.25 | train | 99 | 430.49 | 97.89 | 12 | 222.24 | 80 |
| test | 286.46 | 80.61 | 126.6 | 74.94 | |||
| 0.5 | train | 37 | 433 | 97.8 | 6 | 239.27 | 77.11 |
| test | 302.11 | 81.73 | 134.79 | 74.99 | |||
| 1 | train | 27 | 436.28 | 97.62 | 4 | 268.14 | 61.28 |
| test | 310.39 | 81.11 | 219.12 | 52.76 | |||
Table 8 shows the related to each scenario and its selected features. This table shows that increasing the regularization parameter leads to lower selected features and higher for both benchmark data sets. Moreover, the highest variability explained by the EN has been achieved when no regularization exists in the embedded model . Tables 5 and 8 compare the proposed and wrapping methods, showing the proposed method’s performance in enhancing the regression’s prediction accuracy. As evident, For both data sets, our proposed method can lead to better performance metrics with the performance obtained by the wrapper method.
4.5 Statistical analysis of results
In this section, we perform a non-parametric test called Wilcoxon with a confidence level of 0.9 to identify which algorithms are substantially more efficient than the others Jahani et al. [2022]. The outcomes of the test are provided in table 9. The findings demonstrate that the suggested method outperforms the other two benchmark algorithms. Nevertheless, the red values in the table indicate that the presented approach cannot perform as well as the algorithm pair method. However, despite the uncertainty in the benchmark algorithm, all tests have shown that the offered method is superior to the others and appears error-free.
| House dataset | Car dataset | ||||
|---|---|---|---|---|---|
| Proposed Alg vs GA-LR | Proposed Alg vs EN | Proposed Alg vs GA-LR | Proposed Alg vs EN | ||
| P-value(Train data-Test data) | (0.05-0.05) | (0.05-0.05) | ((0.978-0.977) | (0.05-0.05) | |
| (0.978-0.978) | (0.978-0.05) | (0.05-0.05) | (0.05-0.05) | ||
5 Conclusions and future directions
This paper proposes an innovative procedure for selecting the most significant subset of features to enhance regression model accuracy. It includes two stages: a hybrid wrapper embedded method and a decision-level fusion technique. Initially, the MOPSO-EN explores the solution space to identify the subsets of features with the slightest prediction error and minimum cardinality. It can minimize the process of finding the optimal features by circumventing an exhaustive search across all possible solutions. Then, a novel decision-level fusion algorithm is used to obtain more accurate and reliable optimal features, improving accuracy and prediction error and getting more reliable and stable features for a regression problem. The superiority of the presented method has been discussed on two real data sets. According to the outcomes, compared to the other methods, the presented method effectively reduces the number of features and minimum . Hence, combining wrapped features with decision-level fusion reduces the dimension of feature space without compromising accuracy. There are a few limitations to this study that suggest directions for future research. Even though the MOPSO is superior to exhaustive search methods, it still requires much computing power, especially for large data sets. Moreover, the Elastic net can complement other algorithms to settle this concern in future studies. The suggested method can also be implemented for various data sets not covered in this study. An examination of other fusion-level approaches could be considered for future studies.
Acknowledgements
This article’s research, authorship, or publication does not involve any conflicts of interest on the part of the authors.
References
- Abd-Alsabour [2018] Abd-Alsabour, N., 2018. On the role of dimensionality reduction. J. Comput. 13, 571–579.
- Al-Tashi et al. [2020] Al-Tashi, Q., Abdulkadir, S.J., Rais, H.M., Mirjalili, S., Alhussian, H., 2020. Approaches to multi-objective feature selection: A systematic literature review. IEEE Access 8, 125076–125096.
- Alfiyatin et al. [2017] Alfiyatin, A.N., Febrita, R.E., Taufiq, H., Mahmudy, W.F., 2017. Modeling house price prediction using regression analysis and particle swarm optimization case study: Malang, east java, indonesia. International Journal of Advanced Computer Science and Applications 8.
- Amik et al. [2021] Amik, F.R., Lanard, A., Ismat, A., Momen, S., 2021. Application of machine learning techniques to predict the price of pre-owned cars in bangladesh. Information 12, 514.
- Amini and Hu [2021] Amini, F., Hu, G., 2021. A two-layer feature selection method using genetic algorithm and elastic net. Expert Systems with Applications 166, 114072.
- Amoozegar and Minaei-Bidgoli [2018] Amoozegar, M., Minaei-Bidgoli, B., 2018. Optimizing multi-objective pso based feature selection method using a feature elitism mechanism. Expert Systems with Applications 113, 499–514.
- Ansari et al. [2019] Ansari, G., Ahmad, T., Doja, M.N., 2019. Ensemble of feature ranking methods using hesitant fuzzy sets for sentiment classification. International Journal of Machine Learning and Computing 9, 599–608.
- Archer et al. [1996] Archer, W.R., Gatzlaff, D.H., Ling, D.C., 1996. Measuring the importance of location in house price appreciation. Journal of Urban Economics 40, 334–353.
- Asghar et al. [2021] Asghar, M., Mehmood, K., Yasin, S., Khan, Z.M., 2021. Used cars price prediction using machine learning with optimal features. Pakistan Journal of Engineering and Technology 4, 113–119.
- Ayesha et al. [2020] Ayesha, S., Hanif, M.K., Talib, R., 2020. Overview and comparative study of dimensionality reduction techniques for high dimensional data. Information Fusion 59, 44–58.
- Berry et al. [2004] Berry, S., Levinsohn, J., Pakes, A., 2004. Differentiated products demand systems from a combination of micro and macro data: The new car market. Journal of political Economy 112, 68–105.
- Bhargava et al. [2017] Bhargava, A., Labi, S., Chen, S., Saeed, T.U., Sinha, K.C., 2017. Predicting cost escalation pathways and deviation severities of infrastructure projects using risk-based econometric models and monte carlo simulation. Computer-Aided Civil and Infrastructure Engineering 32, 620–640.
- Bicego et al. [2018] Bicego, M., Farinelli, A., Grosso, E., Paolini, D., Ramchurn, S.D., 2018. On the distinctiveness of the electricity load profile. Pattern Recognition 74, 317–325.
- Brahim and Limam [2018] Brahim, A.B., Limam, M., 2018. Ensemble feature selection for high dimensional data: a new method and a comparative study. Advances in Data Analysis and Classification 12, 937–952.
- Camero et al. [2018] Camero, A., Toutouh, J., Stolfi, D.H., Alba, E., 2018. Evolutionary deep learning for car park occupancy prediction in smart cities, in: International conference on learning and intelligent optimization, Springer. pp. 386–401.
- Cao et al. [2019] Cao, K., Diao, M., Wu, B., 2019. A big data–based geographically weighted regression model for public housing prices: A case study in singapore. Annals of the American Association of Geographers 109, 173–186.
- Cen and Wang [2019] Cen, Z., Wang, J., 2019. Crude oil price prediction model with long short term memory deep learning based on prior knowledge data transfer. Energy 169, 160–171.
- Chakraborty et al. [2011] Chakraborty, P., Das, S., Roy, G.G., Abraham, A., 2011. Erratum to” on convergence of the multi-objective particle swarm optimizers”[inform. sci. 181 (2011) 1411-1425]. Information Sciences—Informatics and Computer Science, Intelligent Systems, Applications: An International Journal 181, 3533.
- Chaleshtori et al. [2020] Chaleshtori, A.E., Jahani, H., Aghaie, A., 2020. Bi-objective optimization approach to a multi-layer location–allocation problem with jockeying. Computers & Industrial Engineering 149, 106740.
- Chandrasekaran et al. [2021] Chandrasekaran, K.S., Mahalakshmi, V., Anathapadmanabhan, M.R., 2021. Forecasting parameter strategy using data analytics in supply chain management. Ingénierie des Systèmes d’Information 26.
- Chandrashekar and Sahin [2014] Chandrashekar, G., Sahin, F., 2014. A survey on feature selection methods. Computers & Electrical Engineering 40, 16–28.
- Chang et al. [2019] Chang, Y.F., Choong, W.C., Looi, S.Y., Pan, W.Y., Goh, H.L., 2019. Analysis of housing prices in petaling district, malaysia using functional relationship model. International Journal of Housing Markets and Analysis .
- Chen et al. [2017] Chen, J.H., Ong, C.F., Zheng, L., Hsu, S.C., 2017. Forecasting spatial dynamics of the housing market using support vector machine. International Journal of Strategic Property Management 21, 273–283.
- Chen et al. [2020] Chen, L., Yao, X., Liu, Y., Zhu, Y., Chen, W., Zhao, X., Chi, T., 2020. Measuring impacts of urban environmental elements on housing prices based on multisource data—a case study of shanghai, china. ISPRS International Journal of Geo-Information 9, 106.
- Chen et al. [2016] Chen, M., Liu, W., Lu, D., 2016. Challenges and the way forward in china’s new-type urbanization. Land use policy 55, 334–339.
- Cheng et al. [2011] Cheng, S., Shi, Y., Qin, Q., 2011. Promoting diversity in particle swarm optimization to solve multimodal problems, in: International Conference on Neural Information Processing, Springer. pp. 228–237.
- Cho et al. [2021] Cho, D.H., Moon, S.H., Kim, Y.H., 2021. Genetic feature selection applied to kospi and cryptocurrency price prediction. Mathematics 9, 2574.
- Chuang et al. [2011] Chuang, L.Y., Yang, C.H., Li, J.C., 2011. Chaotic maps based on binary particle swarm optimization for feature selection. Applied Soft Computing 11, 239–248.
- Cilia et al. [2019] Cilia, N.D., De Stefano, C., Fontanella, F., di Freca, A.S., 2019. Variable-length representation for ec-based feature selection in high-dimensional data, in: International conference on the applications of evolutionary computation (Part of EvoStar), Springer. pp. 325–340.
- Coello et al. [2007] Coello, C.A.C., Lamont, G.B., Van Veldhuizen, D.A., et al., 2007. Evolutionary algorithms for solving multi-objective problems. volume 5. Springer.
- Critien et al. [2022] Critien, J.V., Gatt, A., Ellul, J., 2022. Bitcoin price change and trend prediction through twitter sentiment and data volume. Financial Innovation 8, 1–20.
- Crosby et al. [2016] Crosby, H., Davis, P., Damoulas, T., Jarvis, S.A., 2016. A spatio-temporal, gaussian process regression, real-estate price predictor, in: Proceedings of the 24th ACM SIGSPATIAL International Conference on Advances in Geographic Information Systems, pp. 1–4.
- Das et al. [2017] Das, A.K., Das, S., Ghosh, A., 2017. Ensemble feature selection using bi-objective genetic algorithm. Knowledge-Based Systems 123, 116–127.
- Deb et al. [2002] Deb, K., Pratap, A., Agarwal, S., Meyarivan, T., 2002. A fast and elitist multiobjective genetic algorithm: Nsga-ii. IEEE transactions on evolutionary computation 6, 182–197.
- Drotár et al. [2019] Drotár, P., Gazda, M., Vokorokos, L., 2019. Ensemble feature selection using election methods and ranker clustering. Information Sciences 480, 365–380.
- Dua and Graff [2017] Dua, D., Graff, C., 2017. UCI machine learning repository. URL: http://archive.ics.uci.edu/ml.
- Ebrahimpour and Eftekhari [2017] Ebrahimpour, M.K., Eftekhari, M., 2017. Ensemble of feature selection methods: A hesitant fuzzy sets approach. Applied Soft Computing 50, 300–312.
- Eesa et al. [2013] Eesa, A.S., Brifcani, A.M.A., Orman, Z., 2013. Cuttlefish algorithm-a novel bio-inspired optimization algorithm. International Journal of Scientific & Engineering Research 4, 1978–1986.
- Eesa et al. [2015] Eesa, A.S., Orman, Z., Brifcani, A.M.A., 2015. A novel feature-selection approach based on the cuttlefish optimization algorithm for intrusion detection systems. Expert systems with applications 42, 2670–2679.
- Febrita et al. [2017] Febrita, R.E., Alfiyatin, A.N., Taufiq, H., Mahmudy, W.F., 2017. Data-driven fuzzy rule extraction for housing price prediction in malang, east java, in: 2017 International Conference on Advanced Computer Science and Information Systems (ICACSIS), IEEE. pp. 351–358.
- Fereshtehnejad and Shafieezadeh [2016] Fereshtehnejad, E., Shafieezadeh, A., 2016. Multiple hazard incidents lifecycle cost assessment of structural systems considering state-dependent repair times and fragility curves. Earthquake engineering & structural dynamics 45, 2327–2347.
- Fu et al. [2019] Fu, X., Jia, T., Zhang, X., Li, S., Zhang, Y., 2019. Do street-level scene perceptions affect housing prices in chinese megacities? an analysis using open access datasets and deep learning. PloS one 14, e0217505.
- Gajera et al. [2021] Gajera, P., Gondaliya, A., Kavathiya, J., 2021. Old car price prediction with machine learning. Int. Res. J. Mod. Eng. Technol. Sci 3, 284–290.
- Gao and Zhang [2013] Gao, H., Zhang, X., 2013. A markov-based road maintenance optimization model considering user costs. Computer-Aided Civil and Infrastructure Engineering 28, 451–464.
- Gebru et al. [2017] Gebru, T., Krause, J., Wang, Y., Chen, D., Deng, J., Aiden, E.L., Fei-Fei, L., 2017. Using deep learning and google street view to estimate the demographic makeup of neighborhoods across the united states. Proceedings of the National Academy of Sciences 114, 13108–13113.
- Gegic et al. [2019] Gegic, E., Isakovic, B., Keco, D., Masetic, Z., Kevric, J., 2019. Car price prediction using machine learning techniques. TEM Journal 8, 113.
- González et al. [2019] González, J., Ortega, J., Damas, M., Martín-Smith, P., Gan, J.Q., 2019. A new multi-objective wrapper method for feature selection–accuracy and stability analysis for bci. Neurocomputing 333, 407–418.
- Got et al. [2021] Got, A., Moussaoui, A., Zouache, D., 2021. Hybrid filter-wrapper feature selection using whale optimization algorithm: A multi-objective approach. Expert Systems with Applications , 115312.
- Hamdani et al. [2007] Hamdani, T.M., Won, J.M., Alimi, A.M., Karray, F., 2007. Multi-objective feature selection with nsga ii, in: International conference on adaptive and natural computing algorithms, Springer. pp. 240–247.
- Hao et al. [2020] Hao, Y., Tian, C., Wu, C., 2020. Modelling of carbon price in two real carbon trading markets. Journal of Cleaner Production 244, 118556.
- Haq et al. [2021] Haq, A.U., Zeb, A., Lei, Z., Zhang, D., 2021. Forecasting daily stock trend using multi-filter feature selection and deep learning. Expert Systems with Applications 168, 114444.
- Hashemi et al. [2021] Hashemi, A., Dowlatshahi, M.B., Nezamabadi-pour, H., 2021. A pareto-based ensemble of feature selection algorithms. Expert Systems with Applications 180, 115130.
- Hoque et al. [2018] Hoque, N., Singh, M., Bhattacharyya, D.K., 2018. Efs-mi: an ensemble feature selection method for classification. Complex & Intelligent Systems 4, 105–118.
- Hsu [2011] Hsu, C.M., 2011. A hybrid procedure for stock price prediction by integrating self-organizing map and genetic programming. Expert Systems with Applications 38, 14026–14036.
- Hu et al. [2019] Hu, L., He, S., Han, Z., Xiao, H., Su, S., Weng, M., Cai, Z., 2019. Monitoring housing rental prices based on social media: An integrated approach of machine-learning algorithms and hedonic modeling to inform equitable housing policies. Land use policy 82, 657–673.
- Jahani et al. [2022] Jahani, H., Chaleshtori, A.E., Khaksar, S.M.S., Aghaie, A., Sheu, J.B., 2022. Covid-19 vaccine distribution planning using a congested queuing system—a real case from australia. Transportation Research Part E: Logistics and Transportation Review 163, 102749.
- Jain and Singh [2018] Jain, D., Singh, V., 2018. Feature selection and classification systems for chronic disease prediction: A review. Egyptian Informatics Journal 19, 179–189.
- Jindal and Kumar [2017] Jindal, P., Kumar, D., 2017. A review on dimensionality reduction techniques. International journal of computer applications 173, 42–46.
- Juszczyk [2017] Juszczyk, M., 2017. The challenges of nonparametric cost estimation of construction works with the use of artificial intelligence tools. Procedia engineering 196, 415–422.
- Kabir et al. [2010] Kabir, M.M., Islam, M.M., Murase, K., 2010. A new wrapper feature selection approach using neural network. Neurocomputing 73, 3273–3283.
- Kang et al. [2021] Kang, Y., Zhang, F., Peng, W., Gao, S., Rao, J., Duarte, F., Ratti, C., 2021. Understanding house price appreciation using multi-source big geo-data and machine learning. Land Use Policy 111, 104919.
- Kenney et al. [2021] Kenney, A., Chiaromonte, F., Felici, G., 2021. Mip-boost: Efficient and effective l 0 feature selection for linear regression. Journal of Computational and Graphical Statistics , 1–12.
- Khan and Baig [2016] Khan, A., Baig, A.R., 2016. Multi-objective feature subset selection using mrmr based enhanced ant colony optimization algorithm (mrmr-eaco). Journal of Experimental & Theoretical Artificial Intelligence 28, 1061–1073.
- Kim et al. [2005] Kim, G., Seo, D., Kang, K.I., 2005. Hybrid models of neural networks and genetic algorithms for predicting preliminary cost estimates. Journal of Computing in Civil Engineering 19, 208–211.
- Kim and Kim [2010] Kim, K.J., Kim, K., 2010. Preliminary cost estimation model using case-based reasoning and genetic algorithms. Journal of Computing in Civil Engineering 24, 499–505.
- Kozodoi et al. [2019] Kozodoi, N., Lessmann, S., Papakonstantinou, K., Gatsoulis, Y., Baesens, B., 2019. A multi-objective approach for profit-driven feature selection in credit scoring. Decision support systems 120, 106–117.
- Law et al. [2019] Law, S., Paige, B., Russell, C., 2019. Take a look around: using street view and satellite images to estimate house prices. ACM Transactions on Intelligent Systems and Technology (TIST) 10, 1–19.
- Lazar et al. [2012] Lazar, C., Taminau, J., Meganck, S., Steenhoff, D., Coletta, A., Molter, C., de Schaetzen, V., Duque, R., Bersini, H., Nowe, A., 2012. A survey on filter techniques for feature selection in gene expression microarray analysis. IEEE/ACM transactions on computational biology and bioinformatics 9, 1106–1119.
- Leung and Hung [2008] Leung, Y., Hung, Y., 2008. A multiple-filter-multiple-wrapper approach to gene selection and microarray data classification. IEEE/ACM Transactions on Computational Biology and Bioinformatics 7, 108–117.
- Li et al. [2016] Li, A.D., He, Z., Zhang, Y., 2016. Bi-objective variable selection for key quality characteristics selection based on a modified nsga-ii and the ideal point method. Computers in industry 82, 95–103.
- Li and Becker [2021] Li, W., Becker, D.M., 2021. Day-ahead electricity price prediction applying hybrid models of lstm-based deep learning methods and feature selection algorithms under consideration of market coupling. Energy 237, 121543.
- Lin and Chen [2011] Lin, H., Chen, K., 2011. Predicting price of taiwan real estates by neural networks and support vector regression, in: Proc. of the 15th WSEAS Int. Conf. on Syst, pp. 220–225.
- Lu et al. [2017] Lu, H., Chen, J., Yan, K., Jin, Q., Xue, Y., Gao, Z., 2017. A hybrid feature selection algorithm for gene expression data classification. Neurocomputing 256, 56–62.
- Ma et al. [2020] Ma, C., Liu, Z., Cao, Z., Song, W., Zhang, J., Zeng, W., 2020. Cost-sensitive deep forest for price prediction. Pattern Recognition 107, 107499.
- Ma et al. [2007] Ma, S., Song, X., Huang, J., 2007. Supervised group lasso with applications to microarray data analysis. BMC bioinformatics 8, 1–17.
- Ma et al. [2016] Ma, Z., Liu, Z., Wei, Z., 2016. Formalized representation of specifications for construction cost estimation by using ontology. Computer-Aided Civil and Infrastructure Engineering 31, 4–17.
- Mahmood and Abdulazeez [2017] Mahmood, M.R., Abdulazeez, A.M., 2017. A comparative study of a new hand recognition model based on line of features and other techniques, in: international Conference of reliable information and communication technology, Springer. pp. 420–432.
- Marafino et al. [2015] Marafino, B.J., Boscardin, W.J., Dudley, R.A., 2015. Efficient and sparse feature selection for biomedical text classification via the elastic net: Application to icu risk stratification from nursing notes. Journal of biomedical informatics 54, 114–120.
- Monburinon et al. [2018] Monburinon, N., Chertchom, P., Kaewkiriya, T., Rungpheung, S., Buya, S., Boonpou, P., 2018. Prediction of prices for used car by using regression models, in: 2018 5th International Conference on Business and Industrial Research (ICBIR), IEEE. pp. 115–119.
- Mukhlishin et al. [2017] Mukhlishin, M.F., Saputra, R., Wibowo, A., 2017. Predicting house sale price using fuzzy logic, artificial neural network and k-nearest neighbor, in: 2017 1st International Conference on Informatics and Computational Sciences (ICICoS), IEEE. pp. 171–176.
- Muthukrishnan and Rohini [2016] Muthukrishnan, R., Rohini, R., 2016. Lasso: A feature selection technique in predictive modeling for machine learning, in: 2016 IEEE international conference on advances in computer applications (ICACA), IEEE. pp. 18–20.
- Myers [2016] Myers, D., 2016. Construction economics: A new approach. Routledge.
- Ng et al. [2020] Ng, W.W., Tuo, Y., Zhang, J., Kwong, S., 2020. Training error and sensitivity-based ensemble feature selection. International Journal of Machine Learning and Cybernetics 11, 2313–2326.
- Nguyen et al. [2016] Nguyen, H.B., Xue, B., Liu, I., Andreae, P., Zhang, M., 2016. New mechanism for archive maintenance in pso-based multi-objective feature selection. Soft Computing 20, 3927–3946.
- Noor and Jan [2017] Noor, K., Jan, S., 2017. Vehicle price prediction system using machine learning techniques. International Journal of Computer Applications 167, 27–31.
- Odeck [2019] Odeck, J., 2019. Variation in cost overruns of transportation projects: An econometric meta-regression analysis of studies reported in the literature. Transportation 46, 1345–1368.
- Padmaja and Vishnuvardhan [2016] Padmaja, D.L., Vishnuvardhan, B., 2016. Comparative study of feature subset selection methods for dimensionality reduction on scientific data, in: 2016 IEEE 6th International Conference on Advanced Computing (IACC), IEEE. pp. 31–34.
- Pagourtzi et al. [2003] Pagourtzi, E., Assimakopoulos, V., Hatzichristos, T., French, N., 2003. Real estate appraisal: a review of valuation methods. Journal of Property Investment & Finance 21, 383–401.
- Panagakis and Kotropoulos [2014] Panagakis, Y., Kotropoulos, C., 2014. Elastic net subspace clustering applied to pop/rock music structure analysis. Pattern Recognition Letters 38, 46–53.
- Park and Mazer [2018] Park, I.W., Mazer, S.J., 2018. Overlooked climate parameters best predict flowering onset: Assessing phenological models using the elastic net. Global Change Biology 24, 5972–5984.
- Peerun et al. [2015] Peerun, S., Chummun, N.H., Pudaruth, S., 2015. Predicting the price of second-hand cars using artificial neural networks, in: The Second International Conference on Data Mining, Internet Computing, and Big Data (BigData2015), p. 17.
- Peng et al. [2010] Peng, Y., Wu, Z., Jiang, J., 2010. A novel feature selection approach for biomedical data classification. Journal of Biomedical Informatics 43, 15–23.
- Pérez-Rodríguez et al. [2015] Pérez-Rodríguez, J., Arroyo-Peña, A.G., García-Pedrajas, N., 2015. Simultaneous instance and feature selection and weighting using evolutionary computation: Proposal and study. Applied Soft Computing 37, 416–443.
- Phan [2018] Phan, T.D., 2018. Housing price prediction using machine learning algorithms: The case of melbourne city, australia, in: 2018 International conference on machine learning and data engineering (iCMLDE), IEEE. pp. 35–42.
- Qiu et al. [2018] Qiu, X., Suganthan, P.N., Amaratunga, G.A., 2018. Ensemble incremental learning random vector functional link network for short-term electric load forecasting. Knowledge-Based Systems 145, 182–196.
- Rafiei and Adeli [2016] Rafiei, M.H., Adeli, H., 2016. A novel machine learning model for estimation of sale prices of real estate units. Journal of Construction Engineering and Management 142, 04015066.
- Rafiei and Adeli [2018] Rafiei, M.H., Adeli, H., 2018. Novel machine-learning model for estimating construction costs considering economic variables and indexes. Journal of construction engineering and management 144, 04018106.
- Ramsey and Schafer [2012] Ramsey, F., Schafer, D., 2012. The statistical sleuth: a course in methods of data analysis. Cengage Learning.
- Reyes-Sierra et al. [2006] Reyes-Sierra, M., Coello, C.C., et al., 2006. Multi-objective particle swarm optimizers: A survey of the state-of-the-art. International journal of computational intelligence research 2, 287–308.
- Seijo-Pardo et al. [2017] Seijo-Pardo, B., Porto-Díaz, I., Bolón-Canedo, V., Alonso-Betanzos, A., 2017. Ensemble feature selection: homogeneous and heterogeneous approaches. Knowledge-Based Systems 118, 124–139.
- Simon et al. [2013] Simon, N., Friedman, J., Hastie, T., Tibshirani, R., 2013. A sparse-group lasso. Journal of computational and graphical statistics 22, 231–245.
- Sohrabi and Tajik [2017] Sohrabi, M.K., Tajik, A., 2017. Multi-objective feature selection for warfarin dose prediction. Computational Biology and chemistry 69, 126–133.
- [103] Struyf, T., Deeks, J., Dinnes, J., Takwoingi, Y., Davenport, C., Leeflang, M., Spijker, R., Hooft, L., Emperador, D., Dittrich, S., et al., . Cochrane covid-19 diagnostic test accuracy group. 2021. Signs and symptoms to determine if a patient presenting in primary care or hospital outpatient settings has COVID-19. Cochrane Database Syst Rev 2CD013665.[PMC free article][PubMed][Google Scholar] .
- Sun et al. [2017] Sun, N., Bai, H., Geng, Y., Shi, H., 2017. Price evaluation model in second-hand car system based on bp neural network theory, in: 2017 18th IEEE/ACIS International Conference on Software Engineering, Artificial Intelligence, Networking and Parallel/Distributed Computing (SNPD), IEEE. pp. 431–436.
- Swiniarski and Skowron [2003] Swiniarski, R.W., Skowron, A., 2003. Rough set methods in feature selection and recognition. Pattern recognition letters 24, 833–849.
- Tang et al. [2014] Tang, J., Alelyani, S., Liu, H., 2014. Feature selection for classification: A review. Data classification: Algorithms and applications , 37.
- Teng [2003] Teng, C.M., 2003. Combining noise correction with feature selection, in: International Conference on Data Warehousing and Knowledge Discovery, Springer. pp. 340–349.
- Tian et al. [2020] Tian, Y., Zhang, J., Wang, J., Geng, Y., Wang, X., 2020. Robust human activity recognition using single accelerometer via wavelet energy spectrum features and ensemble feature selection. Systems Science & Control Engineering 8, 83–96.
- Tsai and Sung [2020] Tsai, C.F., Sung, Y.T., 2020. Ensemble feature selection in high dimension, low sample size datasets: Parallel and serial combination approaches. Knowledge-Based Systems 203, 106097.
- Tziridis et al. [2017] Tziridis, K., Kalampokas, T., Papakostas, G.A., Diamantaras, K.I., 2017. Airfare prices prediction using machine learning techniques, in: 2017 25th European Signal Processing Conference (EUSIPCO), IEEE. pp. 1036–1039.
- Unler and Murat [2010] Unler, A., Murat, A., 2010. A discrete particle swarm optimization method for feature selection in binary classification problems. European Journal of Operational Research 206, 528–539.
- Verleysen and François [2005] Verleysen, M., François, D., 2005. The curse of dimensionality in data mining and time series prediction, in: International work-conference on artificial neural networks, Springer. pp. 758–770.
- Vickers [2017] Vickers, N.J., 2017. Animal communication: when i’m calling you, will you answer too? Current biology 27, R713–R715.
- Wang and Wang [2020] Wang, B., Wang, J., 2020. Deep multi-hybrid forecasting system with random ewt extraction and variational learning rate algorithm for crude oil futures. Expert Systems with Applications 161, 113686.
- Wang et al. [2007] Wang, X., Yang, J., Teng, X., Xia, W., Jensen, R., 2007. Feature selection based on rough sets and particle swarm optimization. Pattern recognition letters 28, 459–471.
- Wu et al. [2018] Wu, H., Jiao, H., Yu, Y., Li, Z., Peng, Z., Liu, L., Zeng, Z., 2018. Influence factors and regression model of urban housing prices based on internet open access data. Sustainability 10, 1676.
- Xue et al. [2013] Xue, B., Cervante, L., Shang, L., Browne, W.N., Zhang, M., 2013. Multi-objective evolutionary algorithms for filter based feature selection in classification. International Journal on Artificial Intelligence Tools 22, 1350024.
- Xue et al. [2012] Xue, B., Zhang, M., Browne, W.N., 2012. Particle swarm optimization for feature selection in classification: A multi-objective approach. IEEE transactions on cybernetics 43, 1656–1671.
- Yao et al. [2018] Yao, Y., Zhang, J., Hong, Y., Liang, H., He, J., 2018. Mapping fine-scale urban housing prices by fusing remotely sensed imagery and social media data. Transactions in GIS 22, 561–581.
- You et al. [2017] You, Q., Pang, R., Cao, L., Luo, J., 2017. Image-based appraisal of real estate properties. IEEE transactions on multimedia 19, 2751–2759.
- Yun et al. [2021] Yun, K.K., Yoon, S.W., Won, D., 2021. Prediction of stock price direction using a hybrid ga-xgboost algorithm with a three-stage feature engineering process. Expert Systems with Applications 186, 115716.
- Zeebaree et al. [2019] Zeebaree, D.Q., Haron, H., Abdulazeez, A.M., Zebari, D.A., 2019. Machine learning and region growing for breast cancer segmentation, in: 2019 International Conference on Advanced Science and Engineering (ICOASE), IEEE. pp. 88–93.
- Zhang et al. [2020] Zhang, F., Zu, J., Hu, M., Zhu, D., Kang, Y., Gao, S., Zhang, Y., Huang, Z., 2020. Uncovering inconspicuous places using social media check-ins and street view images. Computers, Environment and Urban Systems 81, 101478.
- Zhang et al. [2018] Zhang, J., Cui, S., Xu, Y., Li, Q., Li, T., 2018. A novel data-driven stock price trend prediction system. Expert Systems with Applications 97, 60–69.
- Zhang et al. [2017a] Zhang, L., Aggarwal, C., Qi, G.J., 2017a. Stock price prediction via discovering multi-frequency trading patterns, in: Proceedings of the 23rd ACM SIGKDD international conference on knowledge discovery and data mining, pp. 2141–2149.
- Zhang and Ma [2021] Zhang, W., Ma, L., 2021. Research and application of second-hand commodity price evaluation methods on b2c platform: take the used car platform as an example. Annals of Operations Research , 1–13.
- Zhang et al. [2017b] Zhang, Z., Tian, Y., Bai, L., Xiahou, J., Hancock, E., 2017b. High-order covariate interacted lasso for feature selection. Pattern Recognition Letters 87, 139–146.
- Zhao et al. [2013] Zhao, H., Min, F., Zhu, W., 2013. Cost-sensitive feature selection of numeric data with measurement errors. Journal of Applied Mathematics 2013.
- Zheng and He [2021] Zheng, L., He, H., 2021. Share price prediction of aerospace relevant companies with recurrent neural networks based on pca. Expert Systems with Applications 183, 115384.
- Zheng and Liu [2011] Zheng, S., Liu, W., 2011. An experimental comparison of gene selection by lasso and dantzig selector for cancer classification. Computers in biology and medicine 41, 1033–1040.
- Zhou et al. [2020] Zhou, Y., Kang, J., Guo, H., 2020. Many-objective optimization of feature selection based on two-level particle cooperation. Information Sciences 532, 91–109.
- Zulkifley et al. [2020] Zulkifley, N.H., Rahman, S.A., Ubaidullah, N.H., Ibrahim, I., 2020. House price prediction using a machine learning model: A survey of literature. International Journal of Modern Education & Computer Science 12.