A Review of Graph Neural Networks in Epidemic Modeling
Abstract.
Since the onset of the COVID-19 pandemic, there has been a growing interest in studying epidemiological models. Traditional mechanistic models mathematically describe the transmission mechanisms of infectious diseases. However, they often fall short when confronted with the growing challenges of today. Consequently, Graph Neural Networks (GNNs) have emerged as a progressively popular tool in epidemic research. In this paper, we endeavor to furnish a comprehensive review of GNNs in epidemic tasks and highlight potential future directions. To accomplish this objective, we introduce hierarchical taxonomies for both epidemic tasks and methodologies, offering a trajectory of development within this domain. For epidemic tasks, we establish a taxonomy akin to those typically employed within the epidemic domain. For methodology, we categorize existing work into Neural Models and Hybrid Models. Following this, we perform an exhaustive and systematic examination of the methodologies, encompassing both the tasks and their technical details. Furthermore, we discuss the limitations of existing methods from diverse perspectives and systematically propose future research directions. This survey aims to bridge literature gaps and promote the progression of this promising field. We hope that it will facilitate synergies between the communities of GNNs and epidemiology, and contribute to their collective progress.
1. Introduction
Epidemiology has long been a critical field, with its origins tracing back to ancient societies that observed patterns of disease spread (bramanti2012ancient, 1, 2). Although the conceptualization of epidemiology has evolved over time, the terms health and control have been predominantly associated with it since 1978 (frerot2018epidemiology, 3). Currently, the World Health Organization (WHO) describes epidemiology as the investigation into the distribution and determinants of health-related states or events, encompassing a broad spectrum of issues including disease transmission, vaccination efforts (fine2015another, 4, 5), cancer and diabetes treatment, etc. This definition underscores the field’s emphasis on controlling health-related issues and making informed decisions. A pertinent illustration of this is the COVID-19 pandemic, which rapidly infected millions worldwide, placing immense strain on the production and distribution of medical resources (cm2020does, 6, 7). Decision-making processes like allocation of resources, are crucial in mitigating the impact of diseases and saving lives, highlighting the importance of advancements in epidemiology (emanuel2020fair, 8).
To address a range of health-related challenges, there is an indispensable need for epidemic modeling, and researchers have devised various mechanistic models (funk2018realtime, 9, 10). These models, grounded in mathematical formulations, simulate the dissemination of infectious diseases by incorporating biological and behavioral underpinnings. By considering factors such as population, they yield insights into patterns of disease transmission and the efficacy of intervention strategies, thereby playing a pivotal role in shaping public health policies (louz2010emergence, 11, 12). However, these knowledge-driven methods often depend on oversimplified or fixed assumptions that can lead to biases in modeling. Consequently, this compromises both the accuracy of predictions and their ability to generalize across different contexts.
To overcome the limitations of mechanistic models, there is an emerging trend to adopt data-driven approaches in epidemic forecasting tasks, with a particular emphasis on machine learning and deep learning models (shorten2021deep, 13). Specifically, Convolutional Neural Networks (CNNs) and Recurrent Neural Networks (RNNs) have demonstrated great success in various epidemiological predictive tasks, including forecasting daily new case counts, estimating virus reproduction and doubling times, and determining disease-related factors (wu2018deep, 14, 15, 16). Despite their effectiveness in these tasks, these models often fall short in incorporating relational information from critical epidemiological data sources such as human mobility, geographic connections, and contact tracing. This deficiency restricts their utility in broader epidemiological applications.
Recently, the advances in Graph Neural Networks (GNNs) (SurveyonGNN_TNNLS20, 17, 18, 19, 20) have set the stage for overcoming the aforementioned challenges in epidemic modeling. Specifically, GNNs stand out for their ability to aggregate diverse information through a message-passing mechanism, making them particularly suited for capturing relational dynamics within graphs (liu2023uplifting, 21, 22). Thus, by representing interactions between entities as graphs, researchers can leverage GNNs to harness relational data effectively and facilitate epidemiology tasks (deng2020colagnn, 23, 24). For instance, GNNs are often utilized to model spatial interactions (gao2021stan, 25) and other complex interactions (caoMepoGNNMetapopulationEpidemic2022, 26), enhancing the analysis of graph data and yielding more precise predictions. In addition, GNNs bring a certain level of interpretability by quantifying the influence of individual nodes (or entities) on final prediction (feng2023contact, 27). Moreover, the flexible design of GNNs facilitates their integration with traditional mechanistic and probabilistic models to leverage expert knowledge and offer measures of uncertainty. As a result, GNNs have found extensive applications in various tasks within the field including infection prediction (liu2023epidemiologyaware, 28) , outbreak source detection (ru2023inferring, 29), intervention modeling (song2020reinforced, 30), etc., facilitating advancements in epidemiology research.
Considering the critical role of epidemic modeling and the widespread adoption of GNNs in this area, a systematic review of these algorithms is essential for advancing our understanding of the field. We seek to bridge this knowledge gap by providing a thorough overview and categorization of how GNNs are applied in epidemiological studies. Our goal extends beyond merely highlighting current research directions; we aim to uncover new directions for future exploration and enrich both the GNN (or graph machine learning) and epidemiology communities.
| Work | Tasks Taxonomy | GNNs | Mechanistic Model | Future Work |
|---|---|---|---|---|
| [ArXiv’21] (baldo2021deep, 16) | ✓ | ✓ | ||
| [JBD’21](shorten2021deep, 13) | ✓ | ✓ | ✓ | |
| [RBME’22](clement2022survey, 31) | ✓ | ✓ | ||
| [NC’22] (kamalov2022deep, 32) | ✓ | ✓ | ||
| [RBE’22] (dinesh10significance, 33) | ✓ | |||
| [IJERPH’22] (saleem2022machine, 15) | ✓ | ✓ | ||
| [ArXiv’22] (Data-centric_arxiv22, 34) | ✓ | ✓ | ✓ | ✓ |
| Ours | ✓ | ✓ | ✓ | ✓ |
Contributions. This paper presents a comprehensive review of GNNs in epidemic modeling. We focus on task categorization, summarizing the latest methodologies, and outlining future directions. We aspire for this work to become a valuable asset for researchers keen on exploring this interdisciplinary research direction. Our contributions are summarized as follows:
Connection to Existing Surveys. In contrast to previous surveys that explore the intersection of epidemiology and deep learning models, our paper offers a detailed overview specifically of GNNs in epidemic modeling. While preceding surveys predominantly concentrate on predicting COVID-19 outcomes and often overlook the inclusion of GNN-based methodologies (shorten2021deep, 13, 31, 33, 15), a few studies have indeed integrated GNNs (kamalov2022deep, 32, 16). However, the scope of such works remains relatively narrow, predominantly confined to virus transmission tasks. Certain studies concentrate exclusively on a singular virus (saleem2022machine, 15) or are dedicated to a specific task like forecasting (Data-centric_arxiv22, 34). Distinctively, our research is tailored towards GNN-based approaches, covering a broader spectrum of epidemic modeling tasks. Furthermore, our survey presents the latest review of GNN applications in epidemic modeling, offering deeper insights when compared to existing literature. The comparison can be found in Table 1. Figure 1 shows the structure of this survey.
2. preliminaries and definitions
2.1. Learning on Graph Data
In this paper, we define the graph data as , with representing the node set comprising nodes. The edge set represents the connections between nodes. The feature matrix includes feature vectors associated with node , where denotes the feature dimension. The adjacency matrix of , denoted by , sets for any existing edge and otherwise. The normalized adjacency matrix is given by . The degree matrix D, being a diagonal matrix, is characterized by .
In the domain of graph learning, the node-level task stands out as a significant area of focus. The objective of this task is to forecast the properties (i.e., numerical value or probability) or class of the individual nodes. This process entails training a neural network model that utilizes a subset of nodes with known properties, denoted as , to infer the properties of other unknown nodes. The essence of this training is encapsulated by optimizing the function:
| (1) |
Here, the function aims to forecast the property for each node, with representing the actual state of node . The discrepancy between the predicted and true properties is quantified using a loss function , such as RMSE (Root Mean Square Error).
2.2. Graph Neural Networks
Over recent years, GNNs have garnered increasing interest and have been deployed across diverse fields, including bioinformatics, material science, chemistry, and neuroscience (reiser2022graph, 35, 36, 37, 38). Among them, Graph Convolutional Networks (GCN) (GCN_ICLR17, 18) and Graph Attention Networks (GAT) (GAT_arxiv17, 19, 20), have advanced the frontier of research on graph-structured data with their sophisticated and effective designs (SurveyonGNN_TNNLS20, 17, 39, 40). Typically, GNNs aim to learn graph representations, including node embeddings , by utilizing both the structural and feature information of a graph . The process within a GNN involves two key operations: message passing and aggregation of neighborhood information. This involves each node in the graph repeatedly collecting and integrating information from its neighbors as well as its own attributes to enhance its representation. The operation of a GNN over layers can be described by the following expression:
| (2) |
where is the representation of node at layer , with being the initial node features. Here, represents the set of neighbors for node , denotes a variant-specific aggregation function, and represents an activation function. Following the completion of layers of message passing, the resultant node embedding is passed through a projection function to produce the output prediction .
2.3. Mechanistic Models
Empirical models (aleta2020modelling, 41, 42) in epidemic forecasting utilize historical data to discern patterns and forecast the future spread of diseases. In contrast, mechanistic models (jiang2021countrywide, 43, 44) provide a detailed framework that explores the biological and social complexities underlying the transmission of infectious diseases, thus exceeding the reliance on historical data inherent to empirical models. Among mechanistic approaches, classic compartmental models (1927contribution, 45) (e.g., SIR) are particularly notable. These models adeptly simplify the intricate dynamics of disease transmission into digestible components. This simplification facilitates a clearer understanding of infection spread, serving as a valuable tool for both researchers and policymakers.
SIR Compartmental Model. In the domain of epidemiology (danon2011networks, 46, 47), it is widely hypothesized that the rate at which networks evolve is significantly slower compared to the propagation speed of diseases. This fundamental assumption underpins the adoption of a SIR model (1927contribution, 45, 48), which is instrumental in accurately capturing the dynamics of epidemic spread. The SIR model categorizes the population into three distinct groups based on their disease status: susceptible (S) to infection, currently infectious (I), and recovered (R), with the latter group being immune to both contraction and transmission of the disease. The SIR model, formulated using ordinary differential equations (ODEs) (grassly2008mathematical, 49), are as follows:
| (3) |
These equations distribute the total population across the aforementioned categories, with the transitions between states regulated by two pivotal parameters: the transmission rate () and the recovery rate (). The model posits a quadratic relationship for disease transmission via interactions between susceptible and infectious individuals (), alongside a linear recovery mechanism (). By fine-tuning the parameters of the SIR model, it is possible to compute the basic reproduction number , serving as a metric for the disease transmission potentials (hanDevilLandscapesInferring2023, 50, 51).
SIR Variants. While the SIR model provides a powerful framework for analyzing disease dynamics, its simplicity can sometimes neglect critical factors such as incubation periods, non-permanent immunity, and heterogeneous population interactions. This limitation has spurred the development of SIR variants, which offer a more comprehensive and nuanced understanding of the spread and control of infectious diseases. We briefly outline some of the most commonly used variants: i) SEIR (dixon2018seds, 52): The SEIR model extends the basic SIR framework by incorporating an ’Exposed’ (E) compartment. This compartment represents individuals who have been exposed to an infectious disease but are not yet infectious themselves (1927contribution, 45, 53). The model details the transition through the stages according to the sequence: . ii) SIRD: Enhancing the traditional SIR model, the SIRD variant includes a ’Dead’ (D) compartment, thus adapting the progression to: . This modification accounts for individuals who succumb to the disease, providing a more accurate depiction of its mortality impact (tomyEstimatingStateEpidemics2022, 54, 55, 56).
| Tasks | Time Interval | Objective |
|---|---|---|
| Detection | History-Present | Incident Back-tracing |
| Surveillance | Present | Event Monitoring |
| Prediction | Future | Future Incident Prediction |
| Projection | Future | Change Simulation and Prediction |
| Task | Paper | Methodology | Hybrid | Graph Construction |
| Detection | SD-STGCN (sha2021source, 57) | GAT + GRU + SEIR | ✓ | Spatial-Temporal Graph; Static Graph Structure |
| Surveillance | WDCIP (wang2023wdcip, 58) | GAE | Spatial Graph; Static Graph Structure | |
| Projection | MMCA-GNNA (jhun2021effective, 59) | GNN + SIR + RL | ✓ | Spatial-Temporal Graph; Static Graph Structure |
| DURLECA (song2020reinforced, 30) | GNN + RL | |||
| IDRLECA (fengContactTracingEpidemic2023, 60) | GNN + RL | Spatial-Temporal Graph; Dynamic Graph Structure | ||
| Prediction | DGDI (liu2023human, 61) | GCN + Self-Attention | Spatial Graph; Static Graph Structure | |
| DVGSN (zhang2023predicting, 62) | GNN | Temporal-Only Graph; Static Graph Structure | ||
| STAN (gao2021stan, 25) | GAT + GRU | Spatial-Temporal Graph; Static Graph Structure | ||
| MSDNet (tang2023enhancing, 63) | GAT + GRU + SIS | ✓ | ||
| SMPNN (lin2023grapha, 64) | MPNN + Autoregression | |||
| ATMGNN (nguyen2023predicting, 65) | MPNN/MGNN + LSTM/Transformer | |||
| DASTGN (puDynamicAdaptiveSpatio2023, 66) | GNN + Attention + GRU | |||
| MSGNN (qiu2023msgnna, 67) | GCN + N-Beats | |||
| STEP (yuSpatiotemporalGraphLearning2023, 68) | GCN + Attention + GRU | |||
| GSRNN (li2019study, 69) | GNN + RNN | |||
| Mepo GNN (cao2023metapopulation, 70, 26) | (TCN + GCN) + Modified SIR | ✓ | Spatial-Temporal Graph; Dynamic Graph Structure | |
| Epi-Cola-GNN (liu2023epidemiologyaware, 28) | Cola-GNN + Modified SIR | ✓ | ||
| CausalGNN (wang2022causalgnn, 24) | GNN + SIRD | ✓ | ||
| ATGCN (wang2022adaptively, 71) | GNN + LSTM | |||
| HierST (zheng2021hierst, 72) | GNN + LSTM | |||
| RESEAT (moon2023reseat, 73) | GNN + Self-Attention | |||
| SAIFlu-Net (jungSelfAttentionBasedDeepLearning2022, 74) | GNN + LSTM | |||
| Epi-GNN (xieEpiGNNExploringSpatial2022, 75) | GCN + Attention + RNN | |||
| Cola-GNN (deng2020colagnn, 23) | GCN + Attention + RNN |
3. Taxonomies
In this section, we provide taxonomies for GNNs in epidemic modeling. These methods can be categorized into different types based on their epidemiological tasks, datasets, graph construction, and methodological distinctions. A comprehensive categorization is shown in Appendix 1 and due to page limitation, we provide part of it in Table 3.
3.1. Epidemiological Tasks
For epidemiological tasks, we provide a taxonomy from the perspective of epidemiologists and categorize the work we investigated into four categories based on researchers’ goals: Detection, Surveillance, Prediction, and Projection. A brief comparison of these tasks is shown in Table 2; the detailed explanations and definitions are introduced as follows:
3.1.1. Detection
The goal of detection tasks is to identify health states, disease spread, or other related incidents that happened at a specific time. In this survey, we incorporate two different detection tasks from the view of graph data: source detection and transmission detection. To formulate a mathematical definition, the temporal network, which consists of sequenced graphs from different time points, is represented as . Within a graph , the states of nodes and edges are represented by and respectively. Then, the detection task can be expressed as predicting or given graph and time point .
For example, finding patient-zero (ruInferringPatientZero2023, 76, 57, 51), as a source detection task, is important for identifying the source of disease outbreaks and aims to find a set of nodes on graph . In this setting, the problem can also be seen as identifying the state of each node at the initial time point, which is .
3.1.2. Surveillance
Surveillance tasks aim at providing timely and accurate information to support decision-making and disease prevention. Since a prompt response is needed, real-time processing ability has been the most important requirement during modeling. Here, we provide a formal definition: given a temporal graph , the goal is to identify a target statistic y on graph at the present moment or in the short term.
3.1.3. Prediction
Similar to surveillance tasks, prediction tasks also aim to forecast epidemic events using historical data. However, unlike surveillance tasks, prediction tasks typically involve longer time spans and do not require real-time processing. Therefore, prediction tasks are more interested in predicting the target at the longer time ahead like instead of at time . Due to the large amount of work, we further classify prediction tasks into two categories based on the type of prediction target:
-
(1)
Incidence Prediction. The target of incidence prediction is to provide quantitative results. In epidemic forecasting, incidences can include the number of infections or deaths in the future (sijiraniSpatioTemporalPredictionEpidemiology2023, 79, 80, 81, 82, 66, 67, 83, 84, 85), influenza activity level (liuEpidemiologyawareDeepLearning2023, 86), Influenza-Like Illness (ILI) rates (zhangPredictingInfluenzaPandemicawareness2023, 87), vaccine hesitancy (moonGraphBasedDeep2023, 88), etc. The prediction of these incidences is important to decision-making, proactive public health planning, and the effective management of infectious diseases and other health challenges.
-
(2)
Trend Prediction. Different from incidence prediction task, which focuses on quantitative targets, the target of trend prediction tasks is to identify a higher-level epidemic spreading pattern. For transmission among locations (liu2023human, 61), prediction of infection trend can be described as an information retrieving problem and the goal is to predict the next region to be infected given a historic spreading route. For transmission among individuals or groups, the goal usually includes identifying transmission dynamics in emerging high-risk groups (sunDeepDynaForecastPhylogeneticinformedGraph2023, 89).
3.1.4. Projection
In epidemic forecasting, projection tasks are similar to prediction, but with an additional intention to understand epidemic outcomes. These tasks usually require models with the ability to incorporate changes during the evolving of epidemics, such as external interventions and changing of initial states. Most of the projection tasks we collected involve finding the optimal interventions or maximizing influence to achieve targets like curbing the spread of diseases. Influence maximization (kempe2003maximizing, 90) aims to identify a subset of nodes so that the influence spreads most effectively across the graph, and there have been several early studies in epidemiological tasks, e.g., node importance ranking (bucur2020beyond, 91, 92).
In this paper, we extend the traditional setting of influence maximization and combine it with intervention strategy tasks to form a more general definition as follows: Given a temporal graph , the states of nodes and edges are influenced by strategies defined as and , which represents strategies on nodes and edges respectively. The goal of the task is to find optimal strategies so that the target is maximized or minimized.
For traditional influence maximization tasks and vaccine strategy tasks (jhun2021effective, 59), which aim to vaccinate the optimal set of nodes to minimize epidemic damage, strategies are limited to nodes at the starting time point, which is . For interventions throughout the period, strategies can include applying quarantine level to nodes at each step (fengContactTracingEpidemic2023, 60), which denotes or restricting mobility on edges (meirom2021controlling, 93, 30), which denotes .
3.1.5. Perspectives from Data Scientists.
The above general taxonomy for epidemiological tasks comes from the perspective of epidemiologists. However, it is also feasible to categorize these works from the perspective of data scientists, who focus more on the computational pipeline. Here we provide a further taxonomy from the perspective of model inputs and outputs:
-
(1)
For inputs of all models, they all consist mainly of two parts: node features and the graph structure. Based on the temporality of nodes, we can further categorize these work into spatial-only tasks, temporal-only (zhangPredictingInfluenzaPandemicawareness2023, 87), and spatial-temporal tasks. In addition, based on the temporality and learnability of graph structure, we can also use static or dynamic features to distinguish these works. A detailed introduction is presented below in Section 3.2.
-
(2)
In terms of model outputs, there are also three categories to summarize these works: scalar, graph, and action sequence. Scalar outputs are usually used in prediction tasks which provide indicators of the epidemic like infected cases. There are also some works that focus on epidemic graph construction and the outputs of their designed models are graphs (shan2023novel, 94, 58). Finally, the projection tasks we collected usually adopt Reinforcement Learning (RL), which outputs the actions taken at each time step, forming a consecutive action sequence (jhun2021effective, 59, 60, 93, 30).
3.2. Data Sources
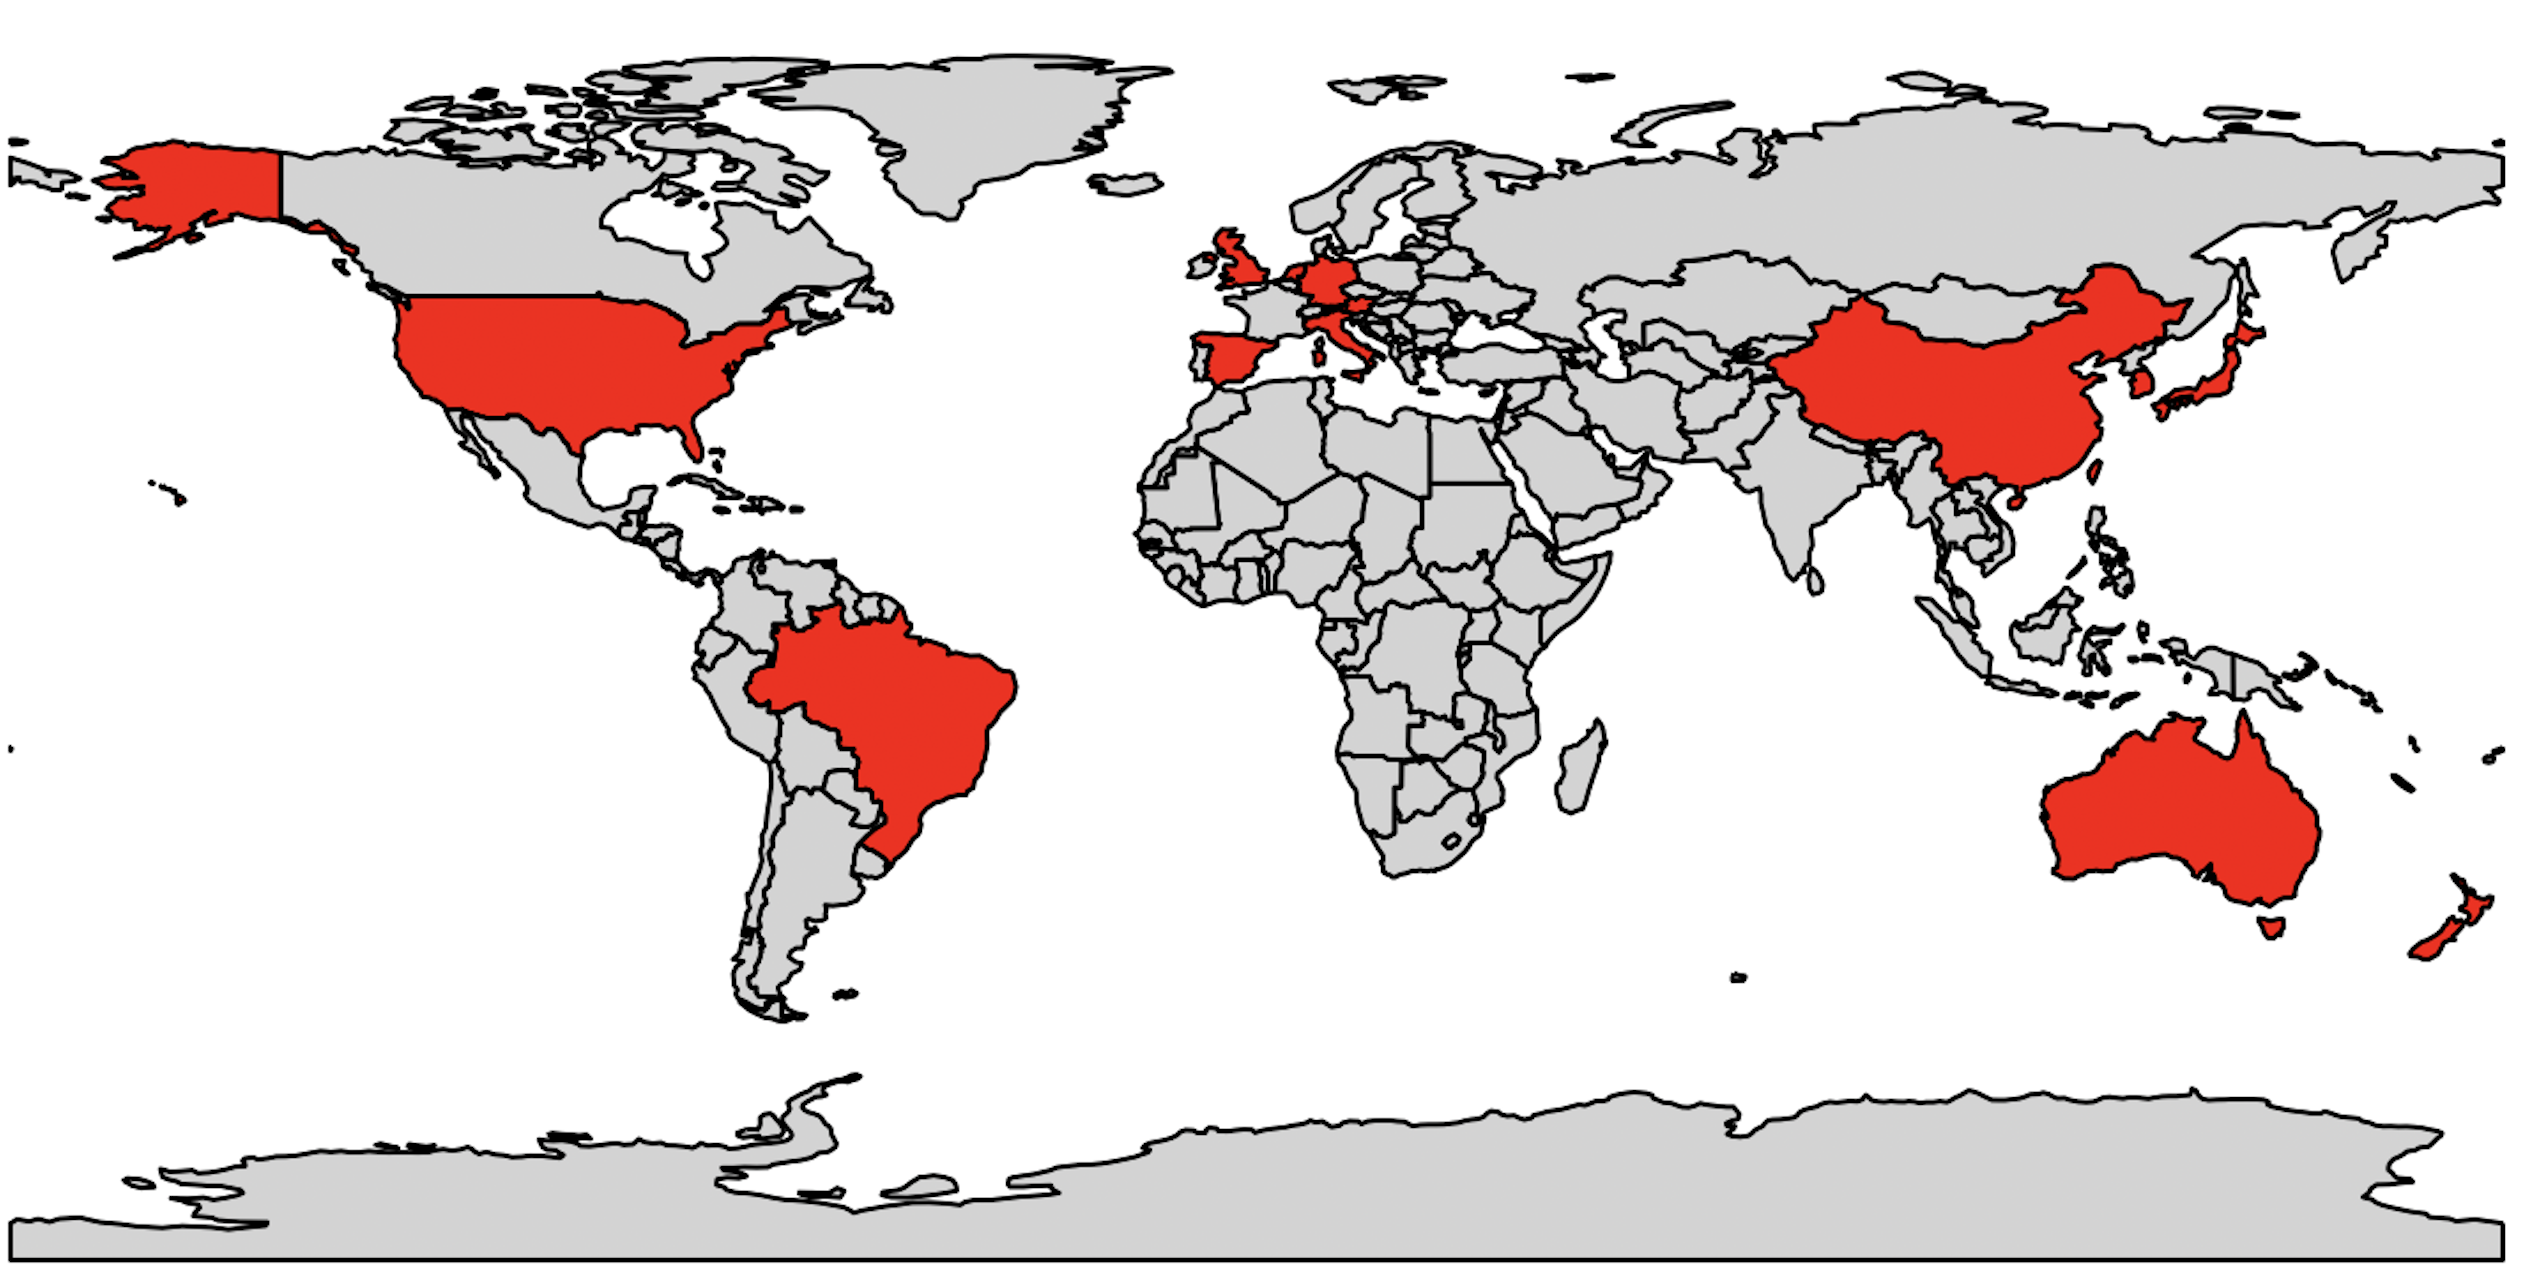
The investigated works in this survey cover a wide range of datasets from different parts of the world, as shown in Figure 2. However, the majority of research focuses only on COVID-19 while only a few study Influenza-Like Illnesses (ILI) or bacteria (gouarebDetectionPatientsRisk2023, 78). We categorize these datasets based on their sources:
-
(1)
Demographic and Health Records. Epidemic data can be accessed through public databases released by universities, governments, or other organizations. These data usually include demographic information like populations, number of infections, and health records of individuals or groups. During epidemic graph construction, these data are usually used directly as node features or used in the construction of graph structures.
-
(2)
Mobility Information. Mobility information can be acquired through websites that record transportation information, maps, or contact records of individuals. This information is usually used to construct the graph structure.
-
(3)
Online Search and Social Media. Epidemic information can also be acquired through social media and online search records. The massive search of disease-related questions in a region can indicate potential outbreaks (lin2023grapha, 64), which can then be utilized as node features.
-
(4)
Sensors. Multi-modal data can be acquired through sensors like cameras, satellites, radios, etc. These data can also help epidemic tasks like exposure risk prediction using images (hanDevilLandscapesInferring2023, 50). Unlike conventional data sources, sensor data often requires additional preprocessing using specialized models, such as encoding images with techniques like ResNet (he2016deep, 95), before integration as node features.
-
(5)
Simulated Data. Besides real-world data, some research (tang2023enhancing, 63, 89, 96) also utilized simulated data for model training and testing. These data often require simulation models like TimeGEO (jiang2016timegeo, 97), Independent Contagion Model (ICM) (murphy2021deep, 98), and also SIR models to generate temporal graphs.
3.3. Graph Construction
For graph construction, we provide a taxonomy based on the dynamicity of nodes and edges as follows.
3.3.1. Static Node Features.
Static node features typically refer to characteristics that do not change with time. The shape of static features can be represented as , where refers to the number of different features. Besides tasks involving time series, most GNN tasks are using static features. For example, in a contact graph in which individuals are modeled as nodes and contact information represents edges, personal characteristics like infection order, gender, age, and symptom-related information can be used as static features during training and prediction (songCOVID19InfectionInference2023, 77). However, tasks involving time series can also use static features as additional information.
3.3.2. Dynamic Node Features.
Contrary to static features, dynamic features represent characteristics that change through time. This type of data is commonly seen in time-series forecasting tasks and the models usually require inputs at each time point. Therefore, the shape of the dynamic features can be represented as , where refers to the number of time points given. As an example, the number of daily confirmed cases in a region can be seen as dynamic features (xieEpiGNNExploringSpatial2022, 75). Although most models take in a single slice of dynamic features at each time point, some models use the entire dynamic features across time in a single input (ruInferringPatientZero2023, 76).
3.3.3. Static Graph Structure.
The construction of a static graph structure typically entails the use of a predefined approach to generate the graph from available data. Once the graph is established, its structure remains unchanged throughout the training iterations or over different time points. For instance, in tasks involving multiple regions, the geographical adjacency , is often employed to connect different regions, which are represented as nodes in the graph (pu2023dynamic, 99, 80). The distance between regions or other features can be considered as the edge weights. Another strategy focuses on exploring human mobility or transitions, e.g., linking nodes through nearest neighbors in the case of COVID-19 transmission. This method takes into consideration the distribution of the population and individual movements between various locations (liu2023human, 61, 58). In research where the node represents an individual, connections between two nodes often utilize contact information, e.g., identifying contacts at risk of spreading the disease as links between individuals (gouareb2023detectiona, 100, 101).
3.3.4. Dynamic Graph Structure.
Determining the structure of a dynamic graph commonly involves one of two methodologies. One approach is the modification of adjacency relations over time or throughout the virus propagation process. For example, (meirom2021controlling, 93) utilize to represent the set of edges at time step , which connect individuals based on transmission probability. Another strategy entails the learning of adaptive edges or edge weights during the training phase. Given the dynamic nature of disease transmission, which evolves at each time step, traditional geographical adjacency matrices fall short of accurately representing true connectivity. Recent studies (wangCausalGNNCausalBasedGraph2022, 55, 23, 26) have aimed for models to learn an adaptive relationship between nodes. This typically involves initially generating node features via a neural network, followed by the computation of an attention matrix to depict dynamic connectivity, often expressed as , where indicates the influence of node on node .
3.4. Methodological Distinctions
The methodologies of the GNNs in epidemic modeling can be broadly classified into two categories: Neural Models and Hybrid Models. This classification illuminates the extent of methods that combine computational techniques with epidemiological insights. Both categories employ neural networks, yet they diverge in their underlying principles. (a) Neural Models primarily focus on a data-driven approach and leverage the power of deep learning (i.e., GNNs in our paper) to uncover complex patterns in disease dynamics without explicit encoding of the underlying epidemiological processes. (b) On the other hand, Hybrid Models represent a synergistic fusion of mechanistic epidemiological models with neural networks. This integration allows for the structured, theory-informed insights of mechanistic models to complement the flexible, data-driven nature of GNNs, aiming to deliver predictions that are interpretable, accurate, and grounded in theoretical knowledge.
4. Methodology
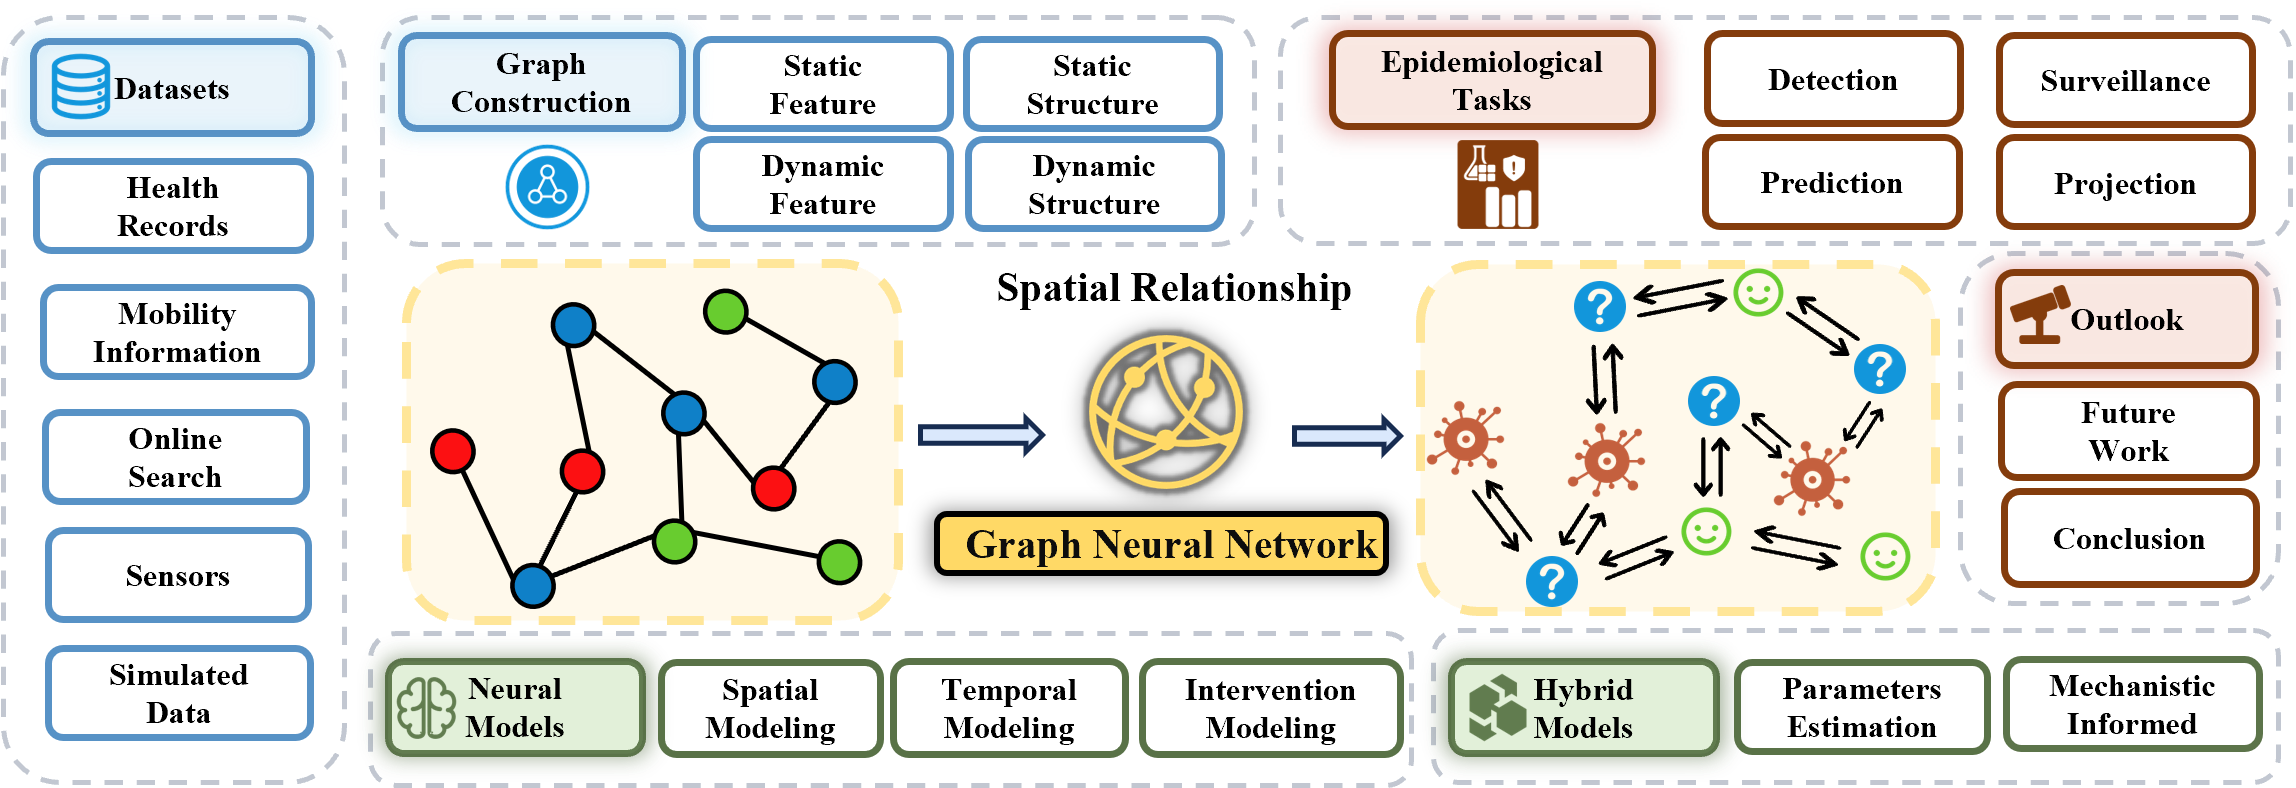
In this section, we provide a detailed illustration of the methods in epidemic modeling, which are divided into the two categories discussed in Section 3.4: Neural Models and Hybrid Models. While both categories utilize GNNs as the backbone model as illustrated in Figure 3, they differ in the adoption of the mechanistic models.

4.1. Neural Models
When utilizing GNNs for epidemic modeling, numerous studies have exclusively employed GNNs without incorporating mechanistic models into their tasks, which we term Neural Models. These data-driven models can automatically learn features from raw data and capture intricate patterns across diverse inputs. This inherent capability significantly enhances their performance across various tasks. In this subsection, we delve into the (GNN-based) Neural Models in epidemic modeling, dissected through three perspectives: (a) Spatial Dynamics Modeling, (b) Temporal Dynamics Modeling, and (c) Intervention Modeling. This categorization is designed to specifically tackle the challenges of modeling the spatial spread, temporal evolution, and the impact of intervention strategies through the advanced capabilities of GNNs.
4.1.1. Spatial Dynamics Modeling
One advantage of GNNs, e.g., GCN or GAT, is their ability to capture spatial relationships through various aggregation processes, which can analyze and capture the spatial dimensions of disease propagation. Numerous studies represent the inherent structure of geographical data as graph data, denoted as , where nodes depict regions (e.g., cities, neighborhoods, or countries), and edges describe connections between these regions (e.g., roads, flights, or potential vectors for disease transmission). Subsequently, GNNs are applied to the graph data to uncover complex relationships and dependencies at the regional level, facilitating predictions regarding disease spread across different areas (song2023covid19, 102, 103, 65, 100, 104).
In the context of GNN modeling, the significance of edge weights is paramount, as they encapsulate the intensity and nature of interactions. Within epidemiological studies, these weights are often derived from the mobility or social connectedness between regions (lin2023grapha, 64, 105). For instance, studies such as (song2020reinforced, 30, 70) utilize Origin-Destination (OD) flows to quantify inter-regional mobility, thereby dynamically capturing the intensity of transmission. To further enhance the spatial context of each node within the graph, some research advocates for the implementation of positional encoding techniques (wang2022equivariant, 106, 107). These techniques are designed to augment the nodes’ spatial awareness. For example, Liu et al. (liu2023human, 61) introduced a unique encoding for each location, denoted as , with even and odd elements represented by and respectively, where denotes the dimension of the encoding.
While GNNs have shown success in modeling spatial relations, challenges arise when dealing with varying input data. Specifically, the absence of direct structural information and the introduction of more complex structural information pose additional difficulties during modeling. To tackle these challenges, several studies have attempted solutions, as outlined below.
Adaptive Structure Learning. Although GNNs possess the inherent capability to learn the spatial characteristics of disease dissemination, there are occasions when adjacency relationship information is not available in the real world, often due to data scarcity. To overcome this challenge, several studies highlight the importance of learning an adaptive structure throughout the training process (zheng2021hierst, 72, 71). For instance, Wang et al. (wang2022adaptively, 71) introduced a graph structure learning module, denoted as . This module is designed to calculate node similarities, thereby representing spatial relationships as follows:
| (4) |
where and are randomly initialized, learnable node embeddings, while represents a hyper-parameter. Shan et al. (shan2023novel, 94) employed a method to estimate the graph Laplacian from COVID-19 data through convex optimization of derived eigenvectors. This approach aims to identify dynamic patterns of pandemic spread among countries by analyzing their structural relationships. Additionally, inspired by recent advancements in attention-based mechanisms (vaswani2023attention, 108, 109, 110), a considerable portion of research suggests the use of an attention matrix to illustrate the relationships between nodes (deng2020colagnn, 23, 55, 111). Notably, Cola-GNN (deng2020colagnn, 23) pioneers the application of additive attention in learning the adaptive structure, which is defined as follows:
| (5) |
where is an activation function, , , and are trainable parameters, with as a hyperparameter controlling the dimensions of these parameters. reflects the impact of location on location . This approach allows for dynamic adaptation to changes in graph structure, effectively capturing asymmetric and complex viral transmission patterns.
Multi-Scale Modeling. Previous approaches typically operate at a singular level, overlooking the multifaceted nature of real-world epidemiological data, which encompasses multiple scales such as country, state, and community levels. For epidemiological tasks, multi-scale modeling is imperative for capturing the dynamics of disease spread across these varied levels, from individual behaviors to global dissemination, ensuring a more comprehensive analysis. HierST (zheng2021hierst, 72) leverages multi-scale modeling to effectively capture the spread of COVID-19 across different administrative levels by constructing a unified graph, which encapsulates the spatial correlation dynamics both within and between these levels. To further address both local interactions and long-range dependencies, MSGNN (qiu2023msgnna, 67) is meticulously designed to integrate influences from both immediate and broader regions on disease transmission, enhancing its effectiveness in cross-scale epidemiological dynamics.
4.1.2. Temporal Dynamics Modeling
The temporal dynamics in epidemiological models are pivotal for capturing the evolution of disease spread, reflecting changes in infection rates, recovery rates, and other critical parameters over time. These models typically conceptualize graphs as spatio-temporal networks, underscoring the significance of temporal data in comprehending disease dynamics, and forecasting future trends (zhang2023predicting, 62, 112). A particular strand of research utilizes RNN-based models (e.g., LSTM or GRU), as mechanisms to extract node features. These features are then incorporated into the graph convolution process (CoLA_TNNLS21, 113, 72). A simple way (kapoor2020examining, 114) to achieve this by executing the concat operator:
| (6) |
where h is simply the output of an MLP (Multilayer Perceptron) over the node temporal features x at time reaching back days. Another surge of approaches first executes graph spatial convolution in each time step separately, and then leverages all outputs of the GNNs as the input of the temporal module and utilizes them for final downstream tasks like the prediction (gao2021stan, 25, 112, 115, 116). STEP (sijirani2023spatiotemporala, 112) execute the multi-layers graph convolution operation to get all node embedding h, and then leverage the GRU to get the final output:
| (7) |
where is the final result, and is the result of the update gate, which controls the inflow of information in the form of gating. The Hadamard product of and represents the information retained to the final memory at the previous timestep.
In contrast to the initial two methodologies, numerous studies achieve their final output by iteratively layering GNN and temporal models (sesti2021integrating, 117). Some work (guo2021research, 118, 57) advocate for the employment of Spatio-Temporal Graph Neural Networks (STGNNs) (hu2022graph, 119, 120, 121) to extract insights from multivariate spatiotemporal epidemic graphs. An STGNN integrates many ST-Conv blocks, which comprise a spatial layer flanked by two temporal layers. Each temporal layer features a 1-D CNN operating along the time axis, followed by a Gated Linear Unit (GLU), to delineate the temporal dynamics. The spatial layer, on the other hand, utilizes a GCN based on the Chebyshev polynomials approximation (Cheb_Neurips16, 122, 123) for spatial analysis. To further refine the understanding of spatial dynamics during disease evolution, RESEAT (moon2023reseat, 73) proposes the continuous maintenance and adaptive updating of an attention matrix. This process aims to capture regional interrelationships throughout the entirety of the input data period:
| (8) |
The denotes the attention weight between regions and at time step , and is employed as the final feature for the node . Through this mechanism, RESEAT adeptly captures not only temporal patterns but also the dynamically evolving regional interrelationships. To integrate explicit observations with implicit factors over time, Cui et al. (cui2021unobservables, 111) introduced a new case prediction methodology within an encoder-decoder framework. They contend that relying solely on observed case data, which can be inaccurate, may impair prediction performance. Accordingly, their proposed decoder is designed to incorporate inputs of new cases and deaths, thereby dynamically reflecting temporal changes.
4.1.3. Intervention Modeling
Intervention modeling offers a detailed perspective on epidemic spread by simulating the behaviors and interactions of individuals within a network based on intervention strategies. This method provides an intricate view of individual actions, mobility patterns, and the likelihood of disease transmission. When combined with GNN, this approach enhances the model’s capability to represent the diversity and complexity inherent in real-world social networks, augmenting the efficacy of intervention strategies. Song et al. (song2020reinforced, 30) introduced a reinforcement learning framework that dynamically optimizes public health interventions to strike a balance between controlling the epidemic and minimizing economic impacts, to reduce infection rates while maintaining economic activities. To delve deeper into the individual underlying dynamics, Meirom et al. (meirom2021controlling, 93) proposed a dual GNN module strategy. One module updates the node representations according to dynamic processes, while the other manages the propagation of long-range information. Subsequently, they employ RL to modulate the dynamics of social interaction graphs and perform intervention actions on them. This approach aims to indirectly curb epidemic spread by strategically altering network structures, thus avoiding direct intervention in the disease process.
IDRLECA (feng2023contact, 27) embodies a novel integration, combining an infection probability model with an innovative GNN design. The infection probability model calculates the current likelihood of each individual’s infection status. This information, along with personal health and movement data, is utilized to forecast virus transmission through human contacts using the GNN:
| (9) |
here represents the probability that individual is infected, while denotes the baseline probability of individual being healthy at time , before accounting for contact-related risks. refers to the probability of infection from a single contact. Additionally, a custom reward function is designed to simultaneously minimize the spread of infections and the associated costs, striking a balance between health objectives and economic considerations:
| (10) |
This function considers the change in the number of infections () and the cost of mobility interventions (), with and acting as soft thresholds for these changes.
4.2. Hybrid Models
Unlike Neural Models described above, Hybrid Models effectively combine the predictive capabilities of neural networks with the foundational principles of mechanistic models, thereby enhancing both the accuracy and interpretability of disease forecasting. This integration can be further classified into two categories: Parameter Estimation for Mechanistic Model and Mechanistic Informed Neural Model. The former approach allows these hybrid systems to adapt to evolving epidemic patterns by dynamically estimating parameters of mechanistic models using neural networks, ensuring that simulations remain closely aligned with current trends. Conversely, the latter approach involves incorporating priors from mechanistic models into neural networks, enriching these models with domain-specific knowledge, and directing the learning process to more accurately reflect plausible disease dynamics. This synergistic methodology not only capitalizes on the data-driven strengths of neural models but also firmly anchors predictions within the framework of epidemiological theory, presenting a comprehensive and informed strategy for predicting epidemic spread.
4.2.1. Parameter Estimation for Mechanistic Models
This line of research highlights that hybrid models, which integrate neural networks, dynamically adjust the parameters of mechanistic models. This combination enables the analysis of real-time data, thus informing and refining mechanistic models to ensure their simulations accurately mirror the dynamics of actual epidemics (jhun2021effective, 59, 63, 104). Notably, studies like (lagatta2021epidemiological, 104, 124) employ GNNs to estimate the contact (transmission) rate, , and to monitor the epidemic evolution through the implementation of the SIR model. Further, research (gao2021stan, 25, 63) estimates both the transmission rates and recovery rates by leveraging outputs from the GNN. This methodology initiates with the utilization of GRU to derive node embeddings h, which subsequently facilitate the calculation of parameters:
| (11) |
where and denote the daily increases in the number of infected and recovered cases, respectively. To enhance the model’s ability to leverage the dynamics of the pandemic for regulating longer-term progressions, the researchers utilize the predicted transmission and recovery rates to calculate predictions based on the dynamics of the disease spread:
| (12) |
where and are iteratively calculated using the ground truth of the infected and recovered cases from the day preceding the current prediction window. represents the population size of the current location, denotes the time steps, and refers to the number of days into the future for which predictions are made. Ultimately, the researchers propose two loss functions to consider both the short-term and long-term progression of the pandemic.
To go beyond single-region recognition, MepoGNN (cao2023metapopulation, 70, 125) extends the SIR model to the metapopulation variant (Data-centric_arxiv22, 34, 126, 127), accommodating heterogeneity within populations and incorporating human mobility to model the spread between sub-populations:
| (13) |
MepoGNN incorporates a spatio-temporal GNN designed to learn three dynamic parameters: , , and , throughout the evolving timeframe. Here, signifies the epidemic propagation matrix, capturing human mobility between regions, represented by . The model thereby generates its final prediction of daily confirmed cases as follows:
| (14) |
Recent work (liu2023epidemiologyaware, 28) integrates the Cola-GNN (deng2020colagnn, 23) framework with the SIR model through the development of Epi-Cola-GNN, introducing a mobility matrix to capture the dynamics of infectious disease spread across different locations. Within this matrix, quantifies the intensity of human mobility from location to location , offering a nuanced perspective on the spatial transmission of diseases. This incorporation leads to a modification in the representation of infectious cases within the SIR model framework:
| (15) |
Furthermore, they introduce the concept of the Next-Generation Matrix (NGM) (diekmann2010construction, 128), which provides a clearer epidemiological interpretation and more effectively supports both intra-location spread and inter-location transmission influenced by human mobility.
Instead of simply estimating the rate indicator, EpiGCN (han2023devila, 129) innovatively employs three distinct linear layers to transform the node feature into the SIR state, enhancing the model awareness of the available data:
| (16) |
Subsequently, they refine the process of updating the SIR Eq. 3 model and introduce a novel SIR message-passing mechanism that aggregates information from neighboring nodes. This approach modifies the conventional SIR update equation to incorporate spatial dependencies and interactions within the network:
| (17) |
here and denote the matrices for linear transformations corresponding to the transmission and recovery processes, respectively. Ultimately, the SIR states are concatenated and transformed to align with the prediction objectives:
| (18) |
4.2.2. Mechanistic-Informed Neural Models
Unlike previous methods wherein neural networks dynamically adjust the parameters of mechanistic models based on data inputs, mechanistic-informed neural models utilize domain knowledge from mechanistic models to inform the architecture and learning processes of GNNs. This strategy flexibility allows for a swift adaptation to changing conditions, markedly improving the accuracy of forecasts and the effectiveness of interventions. Certain studies (meznar2021prediction, 96, 58, 101) utilize the SIR model to generate target data by simulating epidemic spreads from individual nodes, which are then employed to train GNNs for downstream tasks. In the context of source detection tasks, such as those discussed in (ru2023inferring, 29, 51, 57), one-hot encoded node states , with representing the number of possible states, are used as inputs for the GNN, where the states are defined as either {S, E, I, R} or {S, I, R}. Song et al. (song2020reinforced, 30) integrated SIHR (a variant of SIR) (kermack1927contribution, 130) simulation environment with the RL framework, providing a dynamic model of epidemic progression for the RL agent. This capability allows the agent to account for individuals who are hospitalized, enabling the dynamic modification of mobility control policies.
To explicitly capture causal dynamics, CausalGNN (wang2022causalgnn, 24) introduces a novel approach to causal modeling by leveraging causal features , with representing the cumulative number of individuals in each state of the SIRD model. A causal encoder is then designed to transform these causal features into node embeddings, operating as follows:
where and denote model parameters, and these causal features are intended to be concatenated with other node embeddings. The spatial GNN architecture also infers the SIRD rates by providing , which are subsequently utilized for SIRD model updates.
5. Future Work
While many challenges have been addressed in the application of GNNs within epidemic modeling, this field continues to confront various difficulties, both explored and unexplored. In this section, we will examine these challenges and highlight potential avenues for future research.
5.1. Epidemic at Scales
Multi-scale data are crucial in epidemiology because they offer comprehensive insights into both intra-region and inter-region relationships, thus aiding in the more accurate modeling of disease spread. Presently, several studies have acknowledged this importance and initiated the integration of multi-scale data into their frameworks (tangEnhancingSpatialSpread2023, 85, 131, 132, 72). Although these efforts have yielded models capable of accommodating multi-scale data, existing approaches are limited to processing only two predefined scales, such as county-level and state-level data. Looking ahead, there is growing anticipation for the development of novel models capable of incorporating data across multiple dynamic scales and adaptable to diverse epidemiological tasks.
Meanwhile, scalability must also be considered for numerous reasons: (1) A smaller granularity results in the expansion of graph data. (2) Some tasks require real-time processing (wangWDCIPSpatiotemporalAIdriven2023, 131). While the number of countries or provinces can be small, the graph for individuals or other necessary parts in epidemic models can be extremely large, e.g., contact information graphs in metropolises, which could make the current methods very time-consuming. Furthermore, the use of multi-scale data and the requirements for real-time processing make the problem even harder.
5.2. Cross-Modality in Epidemiology
The integration of multi-modal data in epidemiological tasks offers a powerful approach for enhancing our understanding of disease transmission dynamics, improving predictive accuracy, enabling early detection and intervention, conducting comprehensive risk assessments, and fostering interdisciplinary collaboration to address public health challenges more effectively. Data from different modalities can not only serve as augmentations for each other but also compensate for noise from single-modality data. In recent years, some works have successfully incorporated multi-modality in GNNs. Although GNNs are very suitable for information aggregation and handling multi-modality data, there has not been much work exploring the multi-modality of GNNs in an epidemiology setting. Some related works (linGraphNeuralNetwork2023, 133, 50) have utilized unstructured data like textual or image data to construct node features. However, there is no cross-modality in their work in terms of node features.
5.3. Epidemic Diffusion Process
The diffusion process, which is the key component in epidemiological tasks, can be both spatial and temporal. All GNN-based methods discussed above involve information aggregation at one or several time points in a discrete manner. Nevertheless, in the real world, disease spreading is a continuous process, which is incompatible with current methods. To address this problem, Continuous GNNs (xhonneux2020continuous, 134, 135, 136), inspired by Neural ODE (chen2018neural, 137), can be applied to model the continuous spreading process.
Another problem lies in that both disease spreading and infection take time, and they can happen asynchronously. One related work (puDynamicAdaptiveSpatio2023, 66) considers different time-space effects and models the effects using the attention mechanism. However, it is still done in a discrete manner, creating gaps in the real-world transmission process.
5.4. Interventions for Epidemics
In epidemiology, control measures are vital for controlling disease spread and safeguarding public health. They include intervention strategies like vaccination, quarantine, and public health education to limit transmission and minimize outbreaks, ultimately saving lives and reducing the burden on healthcare systems (bhattacharyya2023public, 138, 139, 140). Among the methods mentioned in this paper, most of the research incorporates intervention strategy in agent-based models (fengContactTracingEpidemic2023, 60, 93, 30) or other neural models (pu2023dynamic, 99). Generally, the interventions in these methods include deleting nodes, altering nodes, and altering edge weights. However, each method only includes one type of intervention, either node-level or edge-level. In the real world, however, interventions can happen at different graph levels and also at different scales. To better model the real situation, multi-level and multi-scale interventions need to be introduced.
5.5. Generating Explainable Predictions
The study of epidemic modeling not only aims for accurate predictions but also emphasizes interpretability. Ideally, experts will rely on epidemic models’ predictions to make informed decisions. However, relying on a model’s predictions becomes risky if the model cannot provide confidence in its forecasts, given the significant consequences of these decisions. Therefore, interpretability is essential and offers various benefits, including understanding disease dynamics, identifying risk factors, and providing measures of uncertainty. Despite the crucial role of interpretability, neural models investigated thus far have not placed significant emphasis on this aspect, with hybrid models primarily relying on mechanistic models to provide explanations. In recent years, there have been some approaches aimed at providing interpretability for general Graph Neural Networks (dai2021towards, 141, 142, 143, 144), which also hold potential usefulness in epidemiological settings.
5.6. Handling Challenges from Epidemic Data
The idea of Data-Centric AI (DCAI) has grown more and more important in recent years (zha2023data, 145), which inspired people to pay attention not only to modeling but also to processing data itself. In epidemiological tasks, there are also many challenges originating from data, e.g., noise, incomplete data, privacy, etc. Although there have not been many works addressing these challenges in GNN-related epidemiological tasks, we expect future works will try to tackle this problem by proposing model-centric and data-centric methods.
Noisy Data. Rodríguez et al. (rodriguezDataCentricEpidemicForecasting2022, 146) introduced several sources of data in epidemiology and noise naturally exists in these data. For example, while social media can provide information on epidemic progress, it may also create significant noise by spreading rumors and misinformation. For GNNs in epidemiology, noise can exist both at node-level and edge-level. So far, the denoising mechanisms for GNNs in epidemiology have remained to be studied. Fortunately, there has been a wide range of studies on the robustness of GNNs (jin2020graph, 147, 148, 149, 150), which may be adapted to epidemic data.
Incomplete Data. In addition to noises, epidemic data can also be incomplete. The data-gathering process is not always perfect and can not guarantee the accurate collection of features for every node. This problem may be mitigated during modeling because the blank features can be replaced by the aggregated neighbor features (tomy2022estimating, 101) and simulation or interpolation can also be used to infer missing features at some time points. Nevertheless, there is not much work studying the influence of incomplete data in an epidemiology setting while using GNN models.
Privacy Protection. In the real world, epidemic data typically includes sensitive information such as individual health status, location, and potentially identifiable details, which, if mishandled, can lead to severe privacy violations and undermine public trust in health systems (selgelid2016ethics, 151, 47, 152). In contemporary research, methods commonly utilize all available epidemic data that span countries or regions. However, this reliance on large-scale data may heighten awareness among government entities and departments regarding data privacy. Owing to the growing focus on data sensitivity, stringent legislations (IPR_06, 153, 154) have been introduced to regulate data collection and utilization. Therefore, future work should take more privacy problems into consideration. Federated Graph Learning (FGL) (FedGCN_arxiv22, 155, 156, 157) emerges as a potent solution to these privacy concerns by leveraging the distributed nature of data without necessitating its central aggregation. This approach aligns with the stringent requirements of data privacy regulations by enabling data to remain at its source, thereby minimizing the risks associated with centralized data storage and processing (fgssl_IJCAI23, 158, 159).
6. Conclusion
In this survey, we present a comprehensive overview of graph neural networks in epidemic modeling. First, we provide introductions and definitions not only for epidemiology and epidemic modeling but also for Graph Neural Networks (GNNs). Then, clear and structured taxonomies for epidemiological tasks and methodology are proposed. In terms of epidemiological tasks, we present a categorization of tasks consisting of four parts: Detection, Surveillance, Prediction, and Projection. In terms of methodology, we focus on GNN-based methods and separate them into Neural Models and Hybrid Models. At the end of our survey, we not only point out the challenges and drawbacks of the current methodology but also offer a number of promising directions for interested researchers to work on. The aim of this survey is to bridge the gaps between Graph Neural Networks (GNNs) and epidemiology, inspiring both epidemiologists and data scientists to pursue advancements in this burgeoning field.
References
- (1) Barbara Bramanti “Ancient Epidemic Diseases in a New Light” In German Research 34.2, 2012, pp. 22–27
- (2) L.. Bruce-Chwatt “Plagues and Peoples. By William H. McNeill. Pp. 369. (Basil Blackwell, Oxford, 1977.)” In Journal of Biosocial Science 9.4, 1977, pp. 501–503
- (3) Mathilde Frérot et al. “What is epidemiology? Changing definitions of epidemiology 1978-2017” In PloS one 13.12 Public Library of Science San Francisco, CA USA, 2018, pp. e0208442
- (4) Paul Fine “Another Defining Moment for Epidemiology” In The Lancet 385.9965, 2015, pp. 319–320
- (5) Milton Terris “The Society for Epidemiologic Research and the Future of Epidemiology” In Journal of Public Health Policy 14.2, 1993, pp. 137 JSTOR: 3342960
- (6) Jayadevan Cm “Does the Inadequate Health Resources Aggravate Covid-19 Pandemic?” In Scholars Journal of Applied Medical Sciences 8.7, 2020, pp. 1646–1650
- (7) Sebastian Bergrath et al. “Impact of the COVID-19 Pandemic on Emergency Medical Resources: An Observational Multicenter Study Including All Hospitals in a Major Urban Center of the Rhein-Ruhr Metropolitan Region” In Die Anaesthesiologie 71.S2, 2022, pp. 171–179
- (8) Ezekiel J Emanuel et al. “Fair allocation of scarce medical resources in the time of Covid-19” In New England Journal of Medicine 382.21 Mass Medical Soc, 2020, pp. 2049–2055
- (9) Sebastian Funk et al. “Real-Time Forecasting of Infectious Disease Dynamics with a Stochastic Semi-Mechanistic Model” In Epidemics 22, 2018, pp. 56–61
- (10) Mikhail Alexandrovich Kondratyev “Forecasting Methods and Models of Disease Spread” In Computer Research and Modeling 5.5, 2013, pp. 863–882
- (11) Derrick Louz, Hans E. Bergmans, Birgit P. Loos and Rob C. Hoeben “Emergence of Viral Diseases: Mathematical Modeling as a Tool for Infection Control, Policy and Decision Making” In Critical Reviews in Microbiology 36.3, 2010, pp. 195–211
- (12) Rafael Mikolajczyk et al. “Influenza” In Deutsches Ärzteblatt international, 2009
- (13) Connor Shorten, Taghi M Khoshgoftaar and Borko Furht “Deep Learning applications for COVID-19” In Journal of big Data 8.1 Springer, 2021, pp. 1–54
- (14) Yuexin Wu, Yiming Yang, Hiroshi Nishiura and Masaya Saitoh “Deep learning for epidemiological predictions” In The 41st International ACM SIGIR Conference on Research & Development in Information Retrieval, 2018, pp. 1085–1088
- (15) Farrukh Saleem, Abdullah Saad Al-Malaise Al-Ghamdi, Madini O Alassafi and Saad Abdulla AlGhamdi “Machine learning, deep learning, and mathematical models to analyze forecasting and epidemiology of COVID-19: A systematic literature review” In International journal of environmental research and public health 19.9 MDPI, 2022, pp. 5099
- (16) Federico Baldo et al. “Deep learning for virus-spreading forecasting: A brief survey” In arXiv:2103.02346, 2021
- (17) Zonghan Wu et al. “A comprehensive survey on graph neural networks” In IEEE TNNLS, 2020, pp. 4–24
- (18) Thomas N Kipf and Max Welling “Semi-supervised classification with graph convolutional networks” In ICLR, 2017
- (19) Petar Veličković et al. “Graph attention networks” In arXiv preprint arXiv:1710.10903, 2017
- (20) Shaked Brody, Uri Alon and Eran Yahav “How attentive are graph attention networks?” In ICLR, 2022
- (21) Xiao Liu, Lijun Zhang and Hui Guan “Uplifting Message Passing Neural Network with Graph Original Information” arXiv, 2023 eprint: 2210.05382
- (22) Sohir Maskey, Ron Levie, Yunseok Lee and Gitta Kutyniok “Generalization Analysis of Message Passing Neural Networks on Large Random Graphs” arXiv, 2022 eprint: 2202.00645
- (23) Songgaojun Deng et al. “Cola-GNN: Cross-location Attention Based Graph Neural Networks for Long-term ILI Prediction” In Proceedings of the 29th ACM International Conference on Information & Knowledge Management ACM, 2020, pp. 245–254
- (24) Lijing Wang et al. “CausalGNN: Causal-Based Graph Neural Networks for Spatio-Temporal Epidemic Forecasting” In Proceedings of the AAAI Conference on Artificial Intelligence 36.11, 2022, pp. 12191–12199
- (25) Junyi Gao et al. “STAN: Spatio-Temporal Attention Network for Pandemic Prediction Using Real-World Evidence” In Journal of the American Medical Informatics Association 28.4, 2021, pp. 733–743
- (26) Qi Cao et al. “MepoGNN: Metapopulation Epidemic Forecasting with Graph Neural Networks”, 2022
- (27) Tao Feng, Sirui Song, Tong Xia and Yong Li “Contact Tracing and Epidemic Intervention via Deep Reinforcement Learning” In ACM Transactions on Knowledge Discovery from Data 17.3, 2023, pp. 1–24
- (28) Mutong Liu, Yang Liu and Jiming Liu “Epidemiology-Aware Deep Learning for Infectious Disease Dynamics Prediction” In International Conference on Information and Knowledge Management, Proceedings Association for Computing Machinery, 2023, pp. 4084–4088
- (29) Xiaolei Ru et al. “Inferring Patient Zero on Temporal Networks via Graph Neural Networks” In Proceedings of the AAAI Conference on Artificial Intelligence 37.8, 2023, pp. 9632–9640
- (30) Sirui Song et al. “Reinforced Epidemic Control: Saving Both Lives and Economy” arXiv, 2020 eprint: 2008.01257
- (31) J. Clement, VijayaKumar Ponnusamy, K.C. Sriharipriya and R. Nandakumar “A Survey on Mathematical, Machine Learning and Deep Learning Models for COVID-19 Transmission and Diagnosis” In IEEE Reviews in Biomedical Engineering 15, 2022, pp. 325–340
- (32) Firuz Kamalov et al. “Deep Learning for Covid-19 Forecasting: State-of-the-art Review.” In Neurocomputing 511, 2022, pp. 142–154
- (33) J Nayak B Naik P Dinesh and K Vakula PB Dash D Pelusi “Significance of deep learning for COVID-19: state-of-the-art review” In Research Biomedical Engineering, doi 10
- (34) Alexander Rodríguez et al. “Data-centric epidemic forecasting: A survey” In arXiv preprint arXiv:2207.09370, 2022
- (35) Patrick Reiser et al. “Graph neural networks for materials science and chemistry” In Communications Materials 3.1 Nature Publishing Group UK London, 2022, pp. 93
- (36) Hongzhi Wen et al. “Graph neural networks for multimodal single-cell data integration” In Proceedings of the 28th ACM SIGKDD conference on knowledge discovery and data mining, 2022, pp. 4153–4163
- (37) Oliver Wieder et al. “A compact review of molecular property prediction with graph neural networks” In Drug Discovery Today: Technologies 37 Elsevier, 2020, pp. 1–12
- (38) Alaa Bessadok, Mohamed Ali Mahjoub and Islem Rekik “Graph neural networks in network neuroscience” In IEEE Transactions on Pattern Analysis and Machine Intelligence 45.5 IEEE, 2022, pp. 5833–5848
- (39) Enyan Dai et al. “A comprehensive survey on trustworthy graph neural networks: Privacy, robustness, fairness, and explainability” In arXiv preprint arXiv:2204.08570, 2022
- (40) Yue Liu et al. “A Survey of Deep Graph Clustering: Taxonomy, Challenge, and Application” In arXiv preprint arXiv:2211.12875, 2022
- (41) Alberto Aleta et al. “Modelling the Impact of Testing, Contact Tracing and Household Quarantine on Second Waves of COVID-19” In Nature Human Behaviour 4.9, 2020, pp. 964–971
- (42) Sheryl L. Chang et al. “Modelling Transmission and Control of the COVID-19 Pandemic in Australia” In Nature Communications 11.1, 2020, pp. 5710
- (43) Renhe Jiang et al. “Countrywide Origin-Destination Matrix Prediction and Its Application for COVID-19” In Machine Learning and Knowledge Discovery in Databases. Applied Data Science Track 12978 Springer International Publishing, 2021, pp. 319–334
- (44) Chuang Yang et al. “EpiMob: Interactive Visual Analytics of Citywide Human Mobility Restrictions for Epidemic Control” In IEEE Transactions on Visualization and Computer Graphics 29.8, 2023, pp. 3586–3601
- (45) “A Contribution to the Mathematical Theory of Epidemics” In Proceedings of the Royal Society of London. Series A, Containing Papers of a Mathematical and Physical Character 115.772, 1927, pp. 700–721
- (46) Leon Danon et al. “Networks and the epidemiology of infectious disease” In Interdisciplinary perspectives on infectious diseases 2011 Hindawi, 2011
- (47) Karel Caals, Abha Saxena and Calvin Wai-Loon Ho “Ethics of Epidemics, Research and Surveillance: A WHO Workshop Report” In Asian Bioethics Review 9.3, 2017, pp. 265–271
- (48) Jonas Dehning et al. “Inferring Change Points in the Spread of COVID-19 Reveals the Effectiveness of Interventions” In Science 369.6500, 2020, pp. eabb9789
- (49) Nicholas C. Grassly and Christophe Fraser “Mathematical Models of Infectious Disease Transmission” In Nature Reviews Microbiology 6.6, 2008, pp. 477–487
- (50) Zhenyu Han et al. “Devil in the Landscapes: Inferring Epidemic Exposure Risks from Street View Imagery” In Proceedings of the 31st ACM International Conference on Advances in Geographic Information Systems ACM, 2023, pp. 1–4
- (51) Chintan Shah et al. “Finding Patient Zero: Learning Contagion Source with Graph Neural Networks” arXiv, 2020 eprint: 2006.11913
- (52) Brian Dixon, George Lecakes, Paul K. Moon and John Schmalzel “SEDS: Expanding TEDS to Include Physical Structures” In 2018 IEEE Sensors Applications Symposium (SAS), 2018, pp. 1–6
- (53) Pauline Van Den Driessche “Reproduction Numbers of Infectious Disease Models” In Infectious Disease Modelling 2.3, 2017, pp. 288–303
- (54) Abhishek Tomy et al. “Estimating the State of Epidemics Spreading with Graph Neural Networks” In Nonlinear Dynamics 109.1 Springer Science and Business Media B.V., 2022, pp. 249–263 eprint: 2105.05060
- (55) Lijing Wang et al. “CausalGNN: Causal-Based Graph Neural Networks for Spatio-Temporal Epidemic Forecasting”, 2022
- (56) Elena Loli Piccolomini and Fabiana Zama “Monitoring Italian COVID-19 Spread by a Forced SEIRD Model” In PLOS ONE 15.8, 2020, pp. e0237417
- (57) Hao Sha, Mohammad Al Hasan and George Mohler “Source Detection on Networks Using Spatial Temporal Graph Convolutional Networks” In 2021 IEEE 8th International Conference on Data Science and Advanced Analytics (DSAA) IEEE, 2021, pp. 1–11
- (58) Siqi Wang et al. “WDCIP: Spatio-Temporal AI-driven Disease Control Intelligent Platform for Combating COVID-19 Pandemic” In Geo-spatial Information Science 0.0 Taylor & Francis, 2023, pp. 1–25
- (59) Bukyoung Jhun “Effective Vaccination Strategy Using Graph Neural Network Ansatz” arXiv, 2021 eprint: 2111.00920
- (60) Tao Feng, Sirui Song, Tong Xia and Yong Li “Contact Tracing and Epidemic Intervention via Deep Reinforcement Learning” In ACM Transactions on Knowledge Discovery from Data 17.3, 2023, pp. 1–24
- (61) Yang Liu et al. “Human Mobility Modeling during the COVID-19 Pandemic via Deep Graph Diffusion Infomax” In Proceedings of the AAAI Conference on Artificial Intelligence 37.12, 2023, pp. 14347–14355
- (62) Jie Zhang, Pengfei Zhou, Yijia Zheng and Hongyan Wu “Predicting Influenza with Pandemic-Awareness via Dynamic Virtual Graph Significance Networks” In Computers in Biology and Medicine 158, 2023, pp. 106807
- (63) Yinzhou Tang, Huandong Wang and Yong Li “Enhancing Spatial Spread Prediction of Infectious Diseases through Integrating Multi-scale Human Mobility Dynamics” In Proceedings of the 31st ACM International Conference on Advances in Geographic Information Systems ACM, 2023, pp. 1–12
- (64) Chen Lin et al. “Graph Neural Network Modeling of Web Search Activity for Real-time Pandemic Forecasting” In 2023 IEEE 11th International Conference on Healthcare Informatics (ICHI) IEEE, 2023, pp. 128–137
- (65) Viet Bach Nguyen, Truong Son Hy, Long Tran-Thanh and Nhung Nghiem “Predicting COVID-19 Pandemic by Spatio-Temporal Graph Neural Networks: A New Zealand’s Study”, 2023 eprint: 2305.07731
- (66) Xiaojun Pu et al. “Dynamic Adaptive Spatio–Temporal Graph Network for COVID-19 Forecasting” In CAAI Transactions on Intelligence Technology John Wiley and Sons Inc, 2023
- (67) Mingjie Qiu, Zhiyi Tan and Bing-kun Bao “MSGNN: Multi-scale Spatio-temporal Graph Neural Network for Epidemic Forecasting” arXiv, 2023 eprint: 2308.15840
- (68) Shuo Yu et al. “Spatio-Temporal Graph Learning for Epidemic Prediction” In ACM Transactions on Intelligent Systems and Technology 14.2 Association for Computing Machinery, 2023
- (69) Zhijian Li et al. “A Study on Graph-Structured Recurrent Neural Networks and Sparsification with Application to Epidemic Forecasting” arXiv, 2019 eprint: 1902.05113
- (70) Qi Cao et al. “Metapopulation Graph Neural Networks: Deep Metapopulation Epidemic Modeling with Human Mobility”, 2023, pp. 453–468 eprint: 2306.14857
- (71) Yuejiao Wang et al. “Adaptively Temporal Graph Convolution Model for Epidemic Prediction of Multiple Age Groups” In Fundamental Research 2.2, 2022, pp. 311–320
- (72) Shun Zheng et al. “HierST: A Unified Hierarchical Spatial-temporal Framework for COVID-19 Trend Forecasting” In Proceedings of the 30th ACM International Conference on Information & Knowledge Management ACM, 2021, pp. 4383–4392
- (73) Jaeuk Moon, Seungwon Jung, Sungwoo Park and Eenjun Hwang “RESEAT: Recurrent Self-Attention Network for Multi-Regional Influenza Forecasting” In IEEE Journal of Biomedical and Health Informatics 27.5, 2023, pp. 2585–2596
- (74) Seungwon Jung, Jaeuk Moon, Sungwoo Park and Eenjun Hwang “Self-Attention-Based Deep Learning Network for Regional Influenza Forecasting” In IEEE Journal of Biomedical and Health Informatics 26.2, 2022, pp. 922–933
- (75) Feng Xie, Zhong Zhang, Liang Li and Yusong Tan “EpiGNN: Exploring Spatial Transmission with Graph Neural Network for Regional Epidemic Forecasting”, 2022
- (76) Xiaolei Ru et al. “Inferring Patient Zero on Temporal Networks via Graph Neural Networks” In Proceedings of the AAAI Conference on Artificial Intelligence 37.8, 2023, pp. 9632–9640
- (77) Kyungwoo Song et al. “COVID-19 Infection Inference with Graph Neural Networks” In Scientific Reports 13.1 Nature Research, 2023
- (78) Racha Gouareb et al. “Detection of Patients at Risk of Enterobacteriaceae Infection Using Graph Neural Networks: A Retrospective Study” medRxiv, 2023, pp. 2023.06.01.23290386
- (79) S. Siji Rani et al. “Spatio-Temporal Prediction in Epidemiology Using Graph Convolution Network” In Lecture Notes in Networks and Systems 720 LNNS Springer Science and Business Media Deutschland GmbH, 2023, pp. 367–378
- (80) Shuo Yu et al. “Spatio-Temporal Graph Learning for Epidemic Prediction” In ACM Transactions on Intelligent Systems and Technology 14.2 Association for Computing Machinery, 2023
- (81) Viet Bach Nguyen, Truong Son Hy, Long Tran-Thanh and Nhung Nghiem “Predicting COVID-19 Pandemic by Spatio-Temporal Graph Neural Networks: A New Zealand’s Study”, 2023 eprint: 2305.07731
- (82) V. Croft, Senna C… van Iersel and Cosimo Della Santina “Forecasting Infections with Spatio-Temporal Graph Neural Networks: A Case Study of the Dutch SARS-CoV-2 Spread” In Frontiers in Physics 11 Frontiers Media SA, 2023
- (83) Jaeuk Moon, Seungwon Jung, Sungwoo Park and Eenjun Hwang “RESEAT: Recurrent Self-Attention Network for Multi-Regional Influenza Forecasting” In IEEE Journal of Biomedical and Health Informatics 27.5, 2023, pp. 2585–2596
- (84) Qi Cao et al. “Metapopulation Graph Neural Networks: Deep Metapopulation Epidemic Modeling with Human Mobility”, 2023, pp. 453–468 eprint: 2306.14857
- (85) Yinzhou Tang, Huandong Wang and Yong Li “Enhancing Spatial Spread Prediction of Infectious Diseases through Integrating Multi-scale Human Mobility Dynamics” In Proceedings of the 31st ACM International Conference on Advances in Geographic Information Systems, SIGSPATIAL ’23 Association for Computing Machinery, 2023, pp. 1–12
- (86) Mutong Liu, Yang Liu and Jiming Liu “Epidemiology-Aware Deep Learning for Infectious Disease Dynamics Prediction” In International Conference on Information and Knowledge Management, Proceedings Association for Computing Machinery, 2023, pp. 4084–4088
- (87) Jie Zhang, Pengfei Zhou, Yijia Zheng and Hongyan Wu “Predicting Influenza with Pandemic-Awareness via Dynamic Virtual Graph Significance Networks” In Computers in Biology and Medicine 158, 2023, pp. 106807
- (88) Sifat Afroj Moon et al. “A Graph Based Deep Learning Framework for Predicting Spatio-Temporal Vaccine Hesitancy” medRxiv, 2023, pp. 2023.10.24.23297488
- (89) Chaoyue Sun et al. “DeepDynaForecast: Phylogenetic-informed Graph Deep Learning for Epidemic Transmission Dynamic Prediction” bioRxiv, 2023, pp. 2023.07.17.549268
- (90) David Kempe, Jon Kleinberg and Éva Tardos “Maximizing the spread of influence through a social network” In Proceedings of the ninth ACM SIGKDD international conference on Knowledge discovery and data mining, 2003, pp. 137–146
- (91) Doina Bucur and Petter Holme “Beyond ranking nodes: Predicting epidemic outbreak sizes by network centralities” In PLoS computational biology 16.7 Public Library of Science San Francisco, CA USA, 2020, pp. e1008052
- (92) Petter Holme “Three faces of node importance in network epidemiology: Exact results for small graphs” In Physical Review E 96.6 APS, 2017, pp. 062305
- (93) Eli A. Meirom, Haggai Maron, Shie Mannor and Gal Chechik “Controlling Graph Dynamics with Reinforcement Learning and Graph Neural Networks” arXiv, 2021 eprint: 2010.05313
- (94) Baoling Shan et al. “Novel Graph Topology Learning for Spatio-Temporal Analysis of COVID-19 Spread” In IEEE Journal of Biomedical and Health Informatics 27.6, 2023, pp. 2693–2704
- (95) Kaiming He, Xiangyu Zhang, Shaoqing Ren and Jian Sun “Deep residual learning for image recognition” In Proceedings of the IEEE conference on computer vision and pattern recognition, 2016, pp. 770–778
- (96) Sebastian Mežnar, Nada Lavrač and Blaž Škrlj “Prediction of the Effects of Epidemic Spreading with Graph Neural Networks” In Complex Networks & Their Applications IX, Studies in Computational Intelligence Springer International Publishing, 2021, pp. 420–431
- (97) Shan Jiang et al. “The TimeGeo modeling framework for urban mobility without travel surveys” In Proceedings of the National Academy of Sciences 113.37 National Acad Sciences, 2016, pp. E5370–E5378
- (98) Charles Murphy, Edward Laurence and Antoine Allard “Deep Learning of Contagion Dynamics on Complex Networks” In Nature Communications 12.1 Nature Publishing Group, 2021, pp. 4720
- (99) Xiaojun Pu et al. “Dynamic Adaptive Spatio–Temporal Graph Network for COVID-19 Forecasting” In CAAI Transactions on Intelligence Technology John Wiley and Sons Inc, 2023
- (100) Racha Gouareb et al. “Detection of Patients at Risk of Enterobacteriaceae Infection Using Graph Neural Networks: A Retrospective Study” medRxiv, 2023, pp. 2023.06.01.23290386
- (101) Abhishek Tomy et al. “Estimating the State of Epidemics Spreading with Graph Neural Networks” In Nonlinear Dynamics 109.1, 2022, pp. 249–263
- (102) Kyungwoo Song et al. “COVID-19 Infection Inference with Graph Neural Networks” In Scientific Reports 13.1 Nature Research, 2023
- (103) Xiaojun Pu et al. “Dynamic Adaptive Spatio–Temporal Graph Network for COVID-19 Forecasting” In CAAI Transactions on Intelligence Technology n/a.n/a
- (104) Valerio La Gatta, Vincenzo Moscato, Marco Postiglione and Giancarlo Sperli “An Epidemiological Neural Network Exploiting Dynamic Graph Structured Data Applied to the COVID-19 Outbreak” In IEEE Transactions on Big Data 7.1, 2021, pp. 45–55
- (105) George Panagopoulos, Giannis Nikolentzos and Michalis Vazirgiannis “Transfer Graph Neural Networks for Pandemic Forecasting” In Proceedings of the AAAI Conference on Artificial Intelligence 35.6, 2021, pp. 4838–4845
- (106) Haorui Wang, Haoteng Yin, Muhan Zhang and Pan Li “Equivariant and Stable Positional Encoding for More Powerful Graph Neural Networks” arXiv, 2022 eprint: 2203.00199
- (107) Deyu Bo, Yuan Fang, Yang Liu and Chuan Shi “Graph Contrastive Learning with Stable and Scalable Spectral Encoding”
- (108) Ashish Vaswani et al. “Attention Is All You Need” arXiv, 2023 eprint: 1706.03762
- (109) Richard E. Turner “An Introduction to Transformers” arXiv, 2024 eprint: 2304.10557
- (110) Derya Soydaner “Attention Mechanism in Neural Networks: Where It Comes and Where It Goes” In Neural Computing and Applications 34.16, 2022, pp. 13371–13385 eprint: 2204.13154
- (111) Yue Cui et al. “Into the Unobservables: A Multi-range Encoder-decoder Framework for COVID-19 Prediction” In Proceedings of the 30th ACM International Conference on Information & Knowledge Management ACM, 2021, pp. 292–301
- (112) S. Siji Rani et al. “Spatio-Temporal Prediction in Epidemiology Using Graph Convolution Network” In IOT with Smart Systems Springer Nature, 2023, pp. 367–378
- (113) Yixin Liu et al. “Anomaly Detection on Attributed Networks via Contrastive Self-Supervised Learning” In IEEE TNNLS IEEE, 2021
- (114) Amol Kapoor et al. “Examining COVID-19 Forecasting Using Spatio-Temporal Graph Neural Networks” arXiv, 2020 eprint: 2007.03113
- (115) Sifat Afroj Moon et al. “A Graph Based Deep Learning Framework for Predicting Spatio-Temporal Vaccine Hesitancy” medRxiv, 2023, pp. 2023.10.24.23297488
- (116) Fernando Henrique Duarte et al. “Time Series Forecasting of COVID-19 Cases in Brazil with GNN and Mobility Networks”, 2023, pp. 361–375
- (117) Nathan Sesti, Juan Jose Garau-Luis, Edward Crawley and Bruce Cameron “Integrating LSTMs and GNNs for COVID-19 Forecasting” arXiv, 2021 eprint: 2108.10052
- (118) Lihao Guo and Yuxin Yang “Research on the Forecast of the Spread of COVID-19” In 2021 11th International Conference on Biomedical Engineering and Technology ACM, 2021, pp. 47–51
- (119) Na Hu et al. “Graph Learning-Based Spatial-Temporal Graph Convolutional Neural Networks for Traffic Forecasting” In Connection Science 34.1, 2022, pp. 429–448
- (120) Jie Zhou et al. “Graph Neural Networks: A Review of Methods and Applications” arXiv, 2021 eprint: 1812.08434
- (121) Zonghan Wu et al. “A Comprehensive Survey on Graph Neural Networks” In IEEE Transactions on Neural Networks and Learning Systems 32.1, 2021, pp. 4–24 eprint: 1901.00596
- (122) Michaël Defferrard, Xavier Bresson and Pierre Vandergheynst “Convolutional neural networks on graphs with fast localized spectral filtering” In NeurIPS 29, 2016
- (123) Mingguo He, Zhewei Wei and Ji-Rong Wen “Convolutional neural networks on graphs with chebyshev approximation, revisited” In NeurIPS 35, 2022, pp. 7264–7276
- (124) Huaze Xie, Da Li, Yuanyuan Wang and Yukiko Kawai “Visualization Method for the Spreading Curve of COVID-19 in Universities Using GNN” In 2022 IEEE International Conference on Big Data and Smart Computing (BigComp) IEEE, 2022, pp. 121–128
- (125) Qi Cao et al. “MepoGNN: Metapopulation Epidemic Forecasting with Graph Neural Networks” In Machine Learning and Knowledge Discovery in Databases 13718 Springer Nature Switzerland, 2023, pp. 453–468
- (126) Duygu Balcan et al. “Multiscale Mobility Networks and the Spatial Spreading of Infectious Diseases” In Proceedings of the National Academy of Sciences 106.51, 2009, pp. 21484–21489
- (127) Sayyed Rasoul Mousavi, Fateme Bahri and Farzaneh Sadat Tabataba “An enhanced beam search algorithm for the shortest common supersequence problem” In Engineering Applications of Artificial Intelligence 25.3 Elsevier, 2012, pp. 457–467
- (128) O. Diekmann, J… Heesterbeek and M.. Roberts “The Construction of Next-Generation Matrices for Compartmental Epidemic Models” In Journal of The Royal Society Interface 7.47, 2010, pp. 873–885
- (129) Zhenyu Han et al. “Devil in the Landscapes: Inferring Epidemic Exposure Risks from Street View Imagery” In Proceedings of the 31st ACM International Conference on Advances in Geographic Information Systems ACM, 2023, pp. 1–4
- (130) William Ogilvy Kermack and Anderson G McKendrick “A contribution to the mathematical theory of epidemics” In Proceedings of the royal society of london. Series A, Containing papers of a mathematical and physical character 115.772 The Royal Society London, 1927, pp. 700–721
- (131) Siqi Wang et al. “WDCIP: Spatio-Temporal AI-driven Disease Control Intelligent Platform for Combating COVID-19 Pandemic” In Geo-spatial Information Science 0.0 Taylor & Francis, 2023, pp. 1–25
- (132) Mingjie Qiu, Zhiyi Tan and Bing-kun Bao “MSGNN: Multi-scale Spatio-temporal Graph Neural Network for Epidemic Forecasting” arXiv, 2023 eprint: 2308.15840
- (133) Chen Lin et al. “Graph Neural Network Modeling of Web Search Activity for Real-time Pandemic Forecasting” In 2023 IEEE 11th International Conference on Healthcare Informatics (ICHI), 2023, pp. 128–137
- (134) Louis-Pascal Xhonneux, Meng Qu and Jian Tang “Continuous graph neural networks” In International conference on machine learning, 2020, pp. 10432–10441 PMLR
- (135) Ben Chamberlain et al. “Grand: Graph neural diffusion” In International Conference on Machine Learning, 2021, pp. 1407–1418 PMLR
- (136) Michael Poli et al. “Graph neural ordinary differential equations” In arXiv preprint arXiv:1911.07532, 2019
- (137) Ricky TQ Chen, Yulia Rubanova, Jesse Bettencourt and David K Duvenaud “Neural ordinary differential equations” In Advances in neural information processing systems 31, 2018
- (138) Himashree Bhattacharyya and Rashmi Agarwalla “Public Health Interventions in the Control of Emerging Diseases” In International Journal Of Community Medicine And Public Health 10.9, 2023, pp. 3398–3402
- (139) Dean T. Jamison “Disease Control” In Solutions for the World’s Biggest Problems: Costs and Benefits Cambridge University Press, 2007, pp. 295–344
- (140) Mingyu Luo, Jimin Sun, Zhenyu Gong and Zhen Wang “What Is Always Necessary throughout Efforts to Prevent and Control COVID-19 and Other Infectious Diseases? A Physical Containment Strategy and Public Mobilization and Management” In BioScience Trends 15.3, 2021, pp. 188–191
- (141) Enyan Dai and Suhang Wang “Towards self-explainable graph neural network” In Proceedings of the 30th ACM International Conference on Information & Knowledge Management, 2021, pp. 302–311
- (142) Zhitao Ying et al. “Gnnexplainer: Generating explanations for graph neural networks” In Advances in neural information processing systems 32, 2019
- (143) Hao Yuan, Haiyang Yu, Shurui Gui and Shuiwang Ji “Explainability in graph neural networks: A taxonomic survey” In IEEE transactions on pattern analysis and machine intelligence 45.5 IEEE, 2022, pp. 5782–5799
- (144) Yi Nian, Yurui Chang, Wei Jin and Lu Lin “Globally Interpretable Graph Learning via Distribution Matching” In WWW, 2024
- (145) Daochen Zha et al. “Data-centric ai: Perspectives and challenges” In Proceedings of the 2023 SIAM International Conference on Data Mining (SDM), 2023, pp. 945–948 SIAM
- (146) Alexander Rodríguez et al. “Data-Centric Epidemic Forecasting: A Survey” arXiv, 2022 eprint: 2207.09370
- (147) Wei Jin et al. “Graph structure learning for robust graph neural networks” In Proceedings of the 26th ACM SIGKDD international conference on knowledge discovery & data mining, 2020, pp. 66–74
- (148) Wei Jin et al. “Adversarial attacks and defenses on graphs” In ACM SIGKDD Explorations Newsletter 22.2 ACM New York, NY, USA, 2021, pp. 19–34
- (149) Yanqiao Zhu et al. “Deep graph structure learning for robust representations: A survey” In arXiv preprint arXiv:2103.03036 14, 2021, pp. 1–1
- (150) Xiaorui Liu et al. “Elastic graph neural networks” In International Conference on Machine Learning, 2021, pp. 6837–6849 PMLR
- (151) Michael J. Selgelid “Ethics and Security Aspects of Infectious Disease Control: Interdisciplinary Perspectives” Routledge, 2016
- (152) Liu Yang, Zhang Jiahui and Sun Kaiyang “Interpretation of Information Security and Data Privacy Protection According to the Data Use During the Epidemic” In Journal of Communication and Computer 19.1, 2022
- (153) Christopher May and Susan K Sell “Intellectual property rights: A critical history” Lynne Rienner Publishers Boulder, 2006
- (154) International Consortium Investigators for Fairness in Trial Data Sharing “Toward fairness in data sharing” In New England Journal of Medicine 375.5 Mass Medical Soc, 2016, pp. 405–407
- (155) Yuhang Yao, Weizhao Jin, Srivatsan Ravi and Carlee Joe-Wong “Fedgcn: Convergence and communication tradeoffs in federated training of graph convolutional networks” In arXiv preprint arXiv:2201.12433, 2022
- (156) Wenke Huang, Mang Ye and Bo Du “Learn from others and be yourself in heterogeneous federated learning” In CVPR, 2022
- (157) Wenke Huang et al. “A Federated Learning for Generalization, Robustness, Fairness: A Survey and Benchmark” In arXiv, 2023
- (158) Wenke Huang, Guancheng Wan, Mang Ye and Bo Du “Federated Graph Semantic and Structural Learning” In IJCAI, 2023
- (159) Guancheng Wan, Wenke Huang and Mang Ye “Federated Graph Learning under Domain Shift with Generalizable Prototypes” In Proceedings of the AAAI Conference on Artificial Intelligence, 2024
- (160) Cornelius Fritz, Emilio Dorigatti and David Rügamer “Combining Graph Neural Networks and Spatio-Temporal Disease Models to Improve the Prediction of Weekly COVID-19 Cases in Germany” In Scientific Reports 12.1 Nature Research, 2022
- (161) Mohammad Reza Davahli et al. “Predicting the Dynamics of the COVID-19 Pandemic in the United States Using Graph Theory-Based Neural Networks” In International Journal of Environmental Research and Public Health 18.7 Multidisciplinary Digital Publishing Institute, 2021, pp. 3834
- (162) Shohaib Mahmud, Haiying Shen, Ying Natasha Zhang Foutz and Joshua Anton “A Human Mobility Data Driven Hybrid GNN+RNN Based Model For Epidemic Prediction” In 2021 IEEE International Conference on Big Data (Big Data) IEEE, 2021, pp. 857–866
Complete Taxonomy
| Task | Paper | Methodology | Hybrid | Graph Construction |
|---|---|---|---|---|
| Detection | SD-STGCN (sha2021source, 57) | GAT + GRU + SEIR | ✓ | Spatial-Temporal Graph; Static Graph Structure |
| (ruInferringPatientZero2023, 76) | GCN + SIR | ✓ | Spatial-Temporal Graph; Dynamic Graph Structure | |
| (shah2020finding, 51) | GNN + SIR | ✓ | ||
| Surveillance | WDCIP (wang2023wdcip, 58) | GAE | Spatial Graph; Static Graph Structure | |
| (songCOVID19InfectionInference2023, 77) | GAT/GCN | |||
| (gouarebDetectionPatientsRisk2023, 78) | GCN | |||
| (hanDevilLandscapesInferring2023, 50) | GCN + Modified SIR | ✓ | ||
| (shan2023novel, 94) | Graph Fourier Transform | |||
| Projection | MMCA-GNNA (jhun2021effective, 59) | GNN + SIR + RL | ✓ | Spatial-Temporal Graph; Static Graph Structure |
| DURLECA (song2020reinforced, 30) | GNN + RL | |||
| IDRLECA (fengContactTracingEpidemic2023, 60) | GNN + RL | Spatial-Temporal Graph; Dynamic Graph Structure | ||
| (meirom2021controlling, 93) | GNN + RL | |||
| Prediction | DGDI (liu2023human, 61) | GCN + Self-Attention | Spatial Graph; Static Graph Structure | |
| (sunDeepDynaForecastPhylogeneticinformedGraph2023, 89) | GNN + LSTM | |||
| DVGSN (zhang2023predicting, 62) | GNN | Temporal-Only Graph; Static Graph Structure | ||
| STAN (gao2021stan, 25) | GAT + GRU | Spatial-Temporal Graph; Static Graph Structure | ||
| MSDNet (tang2023enhancing, 63) | GAT + GRU + SIS | ✓ | ||
| SMPNN (lin2023grapha, 64) | MPNN + Autoregression | ✓ | ||
| ATMGNN (nguyen2023predicting, 65) | MPNN/MGNN + LSTM/Transformer | |||
| DASTGN (puDynamicAdaptiveSpatio2023, 66) | GNN + Attention + GRU | |||
| MSGNN (qiu2023msgnna, 67) | GCN + N-Beats | |||
| STEP (yuSpatiotemporalGraphLearning2023, 68) | GCN + Attention + GRU | |||
| (panagopoulos2021transfer, 105) | GNN + LSTM | |||
| (meznar2021prediction, 96) | Network Centrality + XGBoost | |||
| (tomy2022estimating, 101) | GNN + SEIRD | ✓ | ||
| (lagatta2021epidemiological, 104) | GNN + LSTM + SIRD | ✓ | ||
| GSRNN (li2019study, 69) | GNN + RNN | Spatial-Temporal Graph; Static Graph Structure | ||
| (fritzCombiningGraphNeural2022, 160) | GNN + SDDR | ✓ | ||
| (xie2022visualization, 124) | GCN + Modified SIR | ✓ | ||
| (moonGraphBasedDeep2023, 88) | K-GNN + GRU | |||
| (sesti2021integrating, 117) | GNN + LSTM | |||
| (davahli2021predicting, 161) | GNN + LSTM | |||
| (murphy2021deep, 98) | GNN | |||
| (kapoor2020examining, 114) | GNN + MLP | |||
| (croftForecastingInfectionsSpatiotemporal2023, 82) | GAT + GRU | |||
| Mepo GNN (cao2023metapopulation, 70, 26) | (TCN + GCN) + Modified SIR | ✓ | Spatial-Temporal Graph; Dynamic Graph Structure | |
| Epi-Cola-GNN (liu2023epidemiologyaware, 28) | Cola-GNN + Modified SIR | ✓ | ||
| CausalGNN (wang2022causalgnn, 24) | GNN + SIRD | ✓ | ||
| ATGCN (wang2022adaptively, 71) | GNN + LSTM | |||
| HierST (zheng2021hierst, 72) | GNN + LSTM | |||
| RESEAT (moon2023reseat, 73) | GNN + Self-Attention | |||
| SAIFlu-Net (jungSelfAttentionBasedDeepLearning2022, 74) | GNN + LSTM | |||
| Epi-GNN (xieEpiGNNExploringSpatial2022, 75) | GCN + Attention + RNN | |||
| Cola-GNN (deng2020colagnn, 23) | GCN + Attention + RNN | |||
| (cui2021unobservables, 111) | GNN + Attention + LSTM | |||
| (mahmud2021human, 162) | GNN + RNN | |||
| (guo2021research, 118) | STGCN | |||
| (duarte2023time, 116) | GCRN/GCLSTM |