Blind Identification of Binaural Room Impulse Responses from Smart Glasses
Abstract
Smart glasses are increasingly recognized as a key medium for augmented reality, offering a hands-free platform with integrated microphones and non-ear-occluding loudspeakers to seamlessly mix virtual sound sources into the real-world acoustic scene. To convincingly integrate virtual sound sources, the room acoustic rendering of the virtual sources must match the real-world acoustics. Information about a user’s acoustic environment however is typically not available. This work uses a microphone array in a pair of smart glasses to blindly identify binaural room impulse responses (BRIRs) from a few seconds of speech in the real-world environment. The proposed method uses dereverberation and beamforming to generate a pseudo reference signal that is used by a multichannel Wiener filter to estimate room impulse responses which are then converted to BRIRs. The multichannel room impulse responses can be used to estimate room acoustic parameters which is shown to outperform baseline algorithms in the estimation of reverberation time and direct-to-reverberant energy ratio. Results from a listening experiment further indicate that the estimated BRIRs often reproduce the real-world room acoustics perceptually more convincingly than measured BRIRs from other rooms with similar geometry.
Index Terms:
Augmented Reality, Binaural Room Impulse Response, Blind System Identification, Microphone Array, Smart GlassesI Introduction
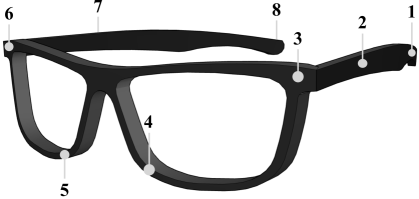
Audio for augmented reality (AR) aims at augmenting the real world with virtual sound sources that realistically blend into the acoustic scene. As part of such a system, the room acoustic rendering of virtual sources must be matched to the acoustics of the room in which the user is located [1, 2]. AR applications are often enabled by head-worn devices such as head-mounted displays (HMDs) or smart glasses. In the present contribution, we propose a method that addresses the acoustic matching problem under realistic acoustic conditions: we use a microphone array that is integrated into a pair of smart glasses as illustrated in Fig. 1 to estimate binaural room impulse responses (BRIRs) in noisy, real-world environments.
BRIRs represent the linear, time-invariant acoustic transfer path between a sound source and the sound pressure at a listener’s eardrum. BRIRs thus include the acoustic properties of the environment and the direction-dependent influence of the listener’s head, torso, and outer ear, as captured by a set of head-related impulse responses (HRIRs). Although HRIRs are highly individual to the listener’s morphology [3], scalable and widespread personalization of HRIRs is not currently feasible, and binaural rendering of virtual sound sources for a general audience therefore often replaces the individual HRIRs with a generic set of HRIRs from a dummy head.
Yet even binaural rendering based on BRIRs measured with a dummy head is still infeasible in most practical AR applications, for two main reasons: (i), a large set of dummy head BRIRs is required to facilitate head rotations during the rendering and, (ii), dedicated acoustic measurements in the target environment are infeasible in consumer AR applications.
The first challenge can be overcome by employing an array that captures room impulse responses (RIRs) with multiple microphones to characterize the directional properties of the acoustic environment. Using array processing techniques, the array RIRs are transformed into BRIRs for any given head rotation by combining them with an anechoically measured set of generic HRIRs [4, 5]. Perceptually plausible rendering from array RIRs, i.e., convincing rendering when no explicit external reference is provided, has been achieved with such a method [4].
The second challenge can be overcome by blind estimation of the array RIRs from sounds that naturally occur in the user’s environment like own speech or the speech of other people. While established signal processing and machine-learning methods for blind RIR estimation exist in the literature, they are typically not designed and validated for the estimation of multichannel RIRs supporting the full audible frequency range under realistic acoustic conditions and may fail to converge in such cases [6].
The herein proposed method extends the work presented in [7, 6]. It uses a pseudo reference signal obtained by beamforming and dereverberation from a few seconds of captured speech and then identifies a multichannel RIR which forms the basis for the subsequent binaural rendering. New contributions in this work are the extended signal model and the modification of the method to consider noise, the use of the wearer’s own voice for the estimation, a resynthesis approach for the estimated RIRs and binaural rendering to obtain BRIRs, an extensive evaluation using a data set of measured RIRs from a pair of glasses, the analysis of the robustness of the method, and the perceptual evaluation of the whole processing chain.
II Background
Several approaches for the room acoustic matching of virtual sound sources with real sources have been explored in the literature. One option is to estimate RIRs from running signals and use convolution to match the acoustics of the virtual source signal with the estimated real-world acoustics. Most of the proposed methods solve the blind multichannel identification task by exploiting cross-relations between channels, such as [8, 9, 10, 11]. However, the authors showed in [6] that cross-relation-based methods fail to converge if acoustic RIRs of realistic lengths (multiple hundreds of milliseconds) are estimated. Thus, new methods that converge quicker have been proposed [12, 7, 6]. They aim at transforming the blind identification task into a non-blind one by applying dereverberation and/or beamforming to estimate a pseudo reference signal. Estimates of the transfer functions between the pseudo reference signal and the array microphone signals are then converted to RIR estimates. Promising results have been obtained for reverberation time (RT) estimation using simulated omnidirectional RIRs [12] and multichannel RIRs [7] in the spherical harmonics (SH) domain. The generalized approach from [6] does not require SH-domain processing. So far, the method has been validated with simulated and measured multichannel RIRs using spherical and circular arrays with regularly distributed microphones.
Recently, the RIR estimation task has also been approached using deep-learning (DL) methods. For example, [13] uses a custom architecture with an encoder network and a decoder that models the response using shaped noise. [14] built on this architecture, but allowed for multiple sources in the room by estimating one generic response per room. Other recent approaches use generative networks [15, 16, 17]. So far, the DL-based methods only consider the single-channel problem and most often work with sampling rates that do not support the entire audible frequency range. Most of the DL-based evaluations only consider a parametric evaluation and do not include a perceptual evaluation. An exception is [13] which solved the single-channel task for the full audible bandwidth and delivered promising parameter estimation as well as perceptual results. It is noted therein that other DL-based methods often generate audible artifacts. The extension of the DL methods to support multichannel RIR estimation and binaural rendering would require training data from a large number of realistic acoustic environments for a specific microphone array geometry and would thus involve an extensive measurement or simulation effort.
An alternative to the full RIR estimation is to only estimate a set of room acoustic parameters and resynthesize a room response from them, turning the task into a blind parameter estimation problem. Blind parameter estimation has been a topic of research for many years; a comparison of different methods was made through the ACE challenge [18]. Since then, several machine-learning-based algorithms for parameter estimation have been proposed, such as [19, 20]. So far, the motivation for parameter estimation was not using the parameters to render sound but to inform other algorithms, for example for speech enhancement or recognition, in order to improve their performance. For that reason, the algorithms do not contain stages for resynthesizing a response.
Thus far, it is unknown whether full RIR estimation or parameter estimation is the more promising approach for AR. Computing parameters from RIR estimates is beneficial for performance assessment as a basic set of parameters such as RT and direct-to-reverberant energy ratio (DRR) are easier to interpret and correlate better to certain attributes of room acoustic perception than technical measures such as projection misalignment. Therefore, we also use parameters to evaluate our RIR estimation and compare the results to the best-performing algorithms from the ACE challenge. We believe, however, that estimating the full RIR offers a clear advantage over estimating parameters alone as any parameter can be derived from a full multichannel RIR estimate and it is still unclear which exact set of parameters needs to be reproduced to achieve perceptually adequate, i.e., plausible [21] or transfer-plausible [22], rendering.
III RIR Estimation
III-A Signal Model
Consider a person speaking in a room and the speech being picked up by a microphone array in a pair of smart glasses that is either worn by the speaker or by another person in the room. The array signals can then be described in discrete time as the convolution of the speech signal and the multichannel RIR from the speaker’s mouth to each microphone plus additive noise ,
| (1) |
is the number of microphones in the array and , and are length- vectors. The herein proposed method estimates the multichannel RIR by utilizing an estimate of the speech signal which is referred to as pseudo reference signal . By exploiting the pseudo reference signal, the method converts the blind identification task into a non-blind one so that the RIR estimate can be obtained using a multichannel Wiener filter.
For the estimation of the pseudo reference signal, it is beneficial to re-express the RIR as a sum of the individual contributions of the direct sound path , the early reflections , and the late reverberation , . The signal model from (1) is then re-expressed in the frequency domain,
| (2) |
where is the angular frequency. For notational convenience, we distinguish between time- and frequency-domain representations of the signals solely by exchanging the dependent variable, i.e., denotes the discrete Fourier transform of .
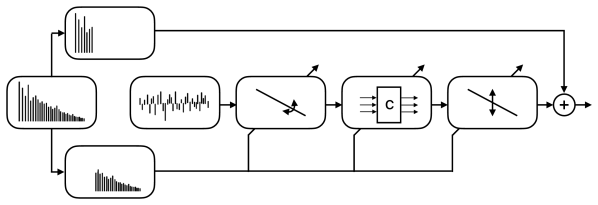
For finding the pseudo reference signal, the proposed processing aims at recovering the signal while only having access to . This is achieved by reducing the influence of the late reverberation using dereverberation and minimizing the influence of the direct-sound path, early reflections, and noise using a beamformer. Once the pseudo reference signal has been obtained, a multichannel RIR is estimated via a multichannel Wiener filter (MWF). As detailed in Sec. IV, the late part of the RIR estimate is then resynthesized using filtered noise and is converted to a binaural response. The full processing chain is illustrated in Fig. 2.
III-B Dereverberation
The generalized weighted prediction error (GWPE) method [23] is chosen for the blind multichannel dereverberation as it provides a high dereverberation performance while avoiding signal distortions and achieving a high perceptual signal quality [24]. The GWPE method is especially well suited for the given problem as it produces the same number of output channels as input channels, does not require knowledge of the number of sources, and preserves time differences between channels [23]. It is integrated into a subband processing framework and estimates a multichannel prediction filter matrix with filters of length in each subband that minimize the temporal signal correlation after a prediction delay to obtain the dereverberated subband signals
| (3) |
The prediction delay is typically chosen in the range of tens of milliseconds so that the short-term autocorrelation of speech is not affected by the filter. Thus, only the late reverberation in (2) with a delay greater than the prediction delay is suppressed by the GWPE algorithm. Note that the GWPE method exploits multichannel information and thus shows better dereverberation performance when more channels are available. For this reason, the dereverberation is applied before the beamformer, see Fig. 2. In this work, we assume time-invariant conditions and thus non-adaptive dereverberation is sufficient. However, the GWPE can be replaced by adaptive dereverberation algorithms with similar properties such as [25, 26] to support adaptive processing.
III-C Beamforming
A minimum variance distortionless response (MVDR) beamformer [27, Ch. 6.2.1] is employed to extract the signal from the direct sound component while suppressing the early reflections and the noise described by the signal model in (2). With the noise power spectral density (PSD) matrix and the steering vector , the MVDR beamformer weights are obtained as
| (4) |
The noise PSD matrix is typically estimated during speech pauses by assuming ergodic signals and replacing the expectation with a temporal average. The pseudo reference signal is then obtained by applying the beamformer to the dereverberated array signals ,
| (5) |
In practice, the processing is applied blockwise using the short-time Fourier transform (STFT). We assume access to measured anechoic array transfer functions (ATFs) for a dense grid of directions. In the processing, the ATF from the source direction is used as steering vector . Thus, the source direction of arrival (DOA) has to be estimated, and in [6], the multiple signal classification (MUSIC) algorithm [28] was successfully used with the proposed method. In the present contribution, we do not estimate DOAs but rather investigate the influence of a DOA mismatch separately in Sec. VI-E.
III-D Transfer Function Estimation
With the pseudo reference signal , the blind estimation problem is successfully transformed into a non-blind one and conventional system identification methods can be applied to obtain the RIR estimate. As in [6], we propose to use a multichannel Wiener filter (MWF) to obtain the multichannel transfer function estimate
| (6) |
from the PSD of the pseudo reference signal and the cross spectral density vector . The MWF is designed to minimize the mean squared error (MSE)
| (7) |
between the filtered pseudo reference and the array signals . The multichannel RIR estimate is obtained as the time-domain counterpart of the transfer function estimate. In this work, we perform batch processing using the MWF, assuming static sources and time-invariant conditions. Equivalently, a recursive least squares (RLS) filter can be employed as in [7] if time-variant conditions are assumed.111The MWF and RLS are equivalent if the forgetting factor of the RLS is set to one, the RLS is initialized with zeros, and the PSD and CSD estimates are obtained in the same way.
IV Rendering
IV-A Ringing Artifacts
If a virtual source signal is to be rendered by convolution with a BRIR estimate, it is essential for the estimate to not contain audible artifacts. However, the obtained RIR estimates in some cases exhibit narrowband ringing artifacts due to narrowband spectral nulls in the pseudo reference signal that are more significant than corresponding nulls in the array signals. Such nulls are created by interfering sound waves as described by the room and the array transfer functions and may even be reinforced by the dereverberation. In other words, the transfer function of the reference and the array may share common zeros, which is a violation of an identifiability condition known from blind identification via channel cross-relations [8].
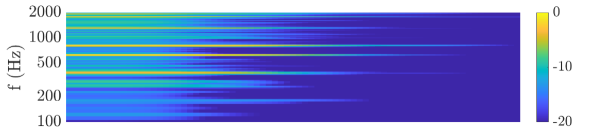
An example of this is given in Fig. 3, which shows the energy decay relief (EDR) of one channel of an RIR estimate using the proposed processing. The EDR is calculated as the frequency-dependent, reverse-integrated energy of the RIR [29]. The EDR is typically normalized to at each frequency to allow for the estimation of reverberation times but we omit the normalization to illustrate the relative energy content. The estimated RIR shows large, slowly decaying energy contributions in some narrow bands that manifest themselves as audible ringing when a speech sample is convolved with it.222Audio examples are provided at https://github.com/facebookresearch/GlassesRoomID.
IV-B RIR Resynthesis
As the ringing only occurs in narrow frequency bands, we propose to resynthesize the RIR estimates in octave bands using filtered noise. Synthesized RIRs based on filtered noise have been shown to be perceptually convincing [30] and by resynthesizing the RIRs with a coarse, octave-band frequency resolution, narrowband inaccuracies such as the ringing are prevented in the resynthesized response.
The synthesis of late reverberation tails using noise is well known from the literature [30, 31, 32, 33]. Typically, the methods either match the noise EDR in time-frequency blocks or match the decay and the early-to-late energy ratio. We follow the latter approach as it automatically removes any noise floor in the RIR estimates and we additionally perform covariance matching to preserve inter-channel relations. The full procedure is illustrated in Fig. 4 and the resulting EDR is shown in Fig. 3.
In the first step, the RIR estimate is decomposed into octave bands using a filter bank and divided into an early part and a late part at time . In this work, we use for all resynthesized RIRs. Then, independent realizations of normally distributed noise of the same length as the late part of the RIR estimate are generated and sent through the filter bank. An exponential decay slope according to the reverberation time of the estimate is applied to the generated noise ,
| (8) |
where denotes the microphone channel index, denotes the band index of the filter bank, and is the sampling frequency. The spatial covariance matching is performed similar to [34] by exploiting the eigendecomposition of a target covariance to match the covariance of the noise signals,
| (9) |
Here, the noise signals of all microphone channels are stacked in the vector , the diagonal matrix contains the eigenvalues of the target covariance , and the matrix contains the orthonormal eigenvectors.
In the third step, the energy of the covariance-matched noise is matched with the energy of the late part of the estimated RIR ,
| (10) |
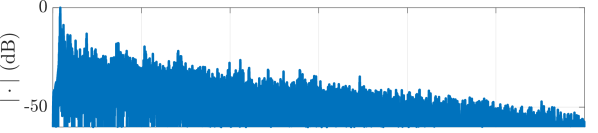
The energy matching ensures that the early-to-late energy ratio of the RIR estimate is preserved in the resynthesized RIR. Lastly, the resynthesized RIR estimate is obtained by concatenating the early part of the RIR estimate and the filtered noise in the time domain and stacking the results for all microphone channels in the vector . A measured RIR from a meeting room, a corresponding estimate from the proposed method, and its resynthesized version are shown in Fig. 5.
IV-C Binaural Rendering
To render a virtual sound source via headphones, its anechoic source signal is filtered with a BRIR estimate ,
| (11) |
The rendering is performed for the left- and right-ear signals as indicated by the superscript . The following demonstrates how the BRIR estimate is computed from the multichannel RIR estimate .
The binaural rendering of multichannel array signals is an actively researched problem. Due to the simplifications of the RIR estimate that were introduced by replacing the late part of the RIR with filtered noise, we only consider signal-independent, non-parametric rendering methods, i.e., methods that do not require the estimation of parameters like reflection directions. Depending on the specific microphone array and sound field assumptions, three non-parametric binaural rendering methods are considered state-of-the-art: magnitude-least-squares-optimal rendering (magLS) [35, 36, 5], beamforming-based binaural reproduction (BFBR) [37, 38], and binaural signal matching (BSM) [39, 40]. The most recent iterations of these methods often combine ideas of the approaches, e.g., in [41] BSM was implemented with magnitude optimization at high frequencies and [39] combines BFBR and BSM. Differences between specific implementations of the methods depending on assumptions on the microphone array and the sound field are thus often greater than general differences between the methods. We use the end-to-end magnitude least squares method (eMagLS) [5] as it neither requires additional assumptions, nor specific microphone arrays or the choice of parameters.
The eMagLS method transforms the multichannel RIR into a BRIR by applying optimal rendering filters and summing over all microphone channels,
| (12) |
The eMagLS rendering filters ensure a minimum (magnitude-) least-squares rendering error, i.e., they minimize the difference between a head-related transfer function (HRTF, the frequency-domain counterpart of the HRIR) and a filtered array signal that is generated by a plane wave from the same direction as the HRTF for a large set of directions. While in the original publication, the eMagLS method was developed using analytically derived ATFs for spherical microphone arrays, the method can be used in the same way with arbitrary arrays using measured ATFs which has also recently been explored in [42]. We use measured ATFs to calculate the rendering filters without utilizing a spherical harmonics decomposition, which was termed eMagLS2 in [5]. The eMagLS filters are least-squares-optimal at low frequencies and minimize the least-squares error of the magnitude at high frequencies, favoring the accurate rendering of magnitudes of binaural cues over their phase. If a dynamic binaural reproduction including compensation for a user’s head rotation is required, the rendering filters can be computed with a rotated HRTF set as shown in [42]. In this case, different filters need to be selected in (12) depending on the head rotation. The rendering filters can be pre-computed for a dense grid of head rotations so that only (11) must be computed during the rendering.
V Estimation from Own Speech
The herein proposed method has been shown to successfully estimate RIRs under noise-free conditions for speech sources in the far field [6]. In this contribution, we additionally propose to estimate RIRs for the estimation of acoustic parameters from the user’s own speech, i.e., speech from the person wearing the smart glasses. None of the assumptions in the signal model and processing from Sec. III require far-field sources. However, in the case of estimation using the user’s own speech, the steering vector used in the beamformer design in (4) is replaced by an ATF that is measured using the mouth simulator of a dummy head. In this study, the model Brüel & Kjær HATS 5128-C is used. Due to the static relation between the microphone array and the user’s mouth, knowledge of the DOA is not required in this case. The RIRs from the user’s mouth to the array microphones only contain valuable information if the microphones are sufficiently far away from the mouth. Thus, we restrict the RIR estimation to the microphones closest to the user’s ears (microphones 1 and 8 in Fig. 1) in all investigations that utilize the user’s own speech.
In [6], we showed that the proposed processing chain is beneficial for far-field sources and that the additional dereverberation significantly improves the results compared to processing without dereverberation. It is unclear if the same is true for near-field sources as in the estimation from the user’s own speech. Moreover, it is not even clear if near-field RIRs from the mouth are suitable for the estimation of RTs due to the expected high DRR. Thus, we investigate in this section if near-field RIRs from the mouth simulator can be used to estimate RTs and if dereverberation and ATF-based near-field beamforming are beneficial for the estimation of RIRs from own speech. This pre-study is based on measured RIRs from 23 rooms with varying signal-to-noise ratios (SNRs) using babble noise. The data set and the evaluation procedure are described in detail in Sec. VI.
To quantify if measured near-field RIRs can be used to estimate RTs and if these estimates correlate with RTs from far-field measurements, we compared RTs from far-field RIR measurements in the 23 rooms to RTs from RIR measurements using the mouth simulator of the dummy head wearing the smart glasses. We found a median absolute difference between the RTs from mouth and far-field measurements of of the far-field RT, a correlation coefficient of , and a bias of , showing that the use of own speech for RT estimation can be beneficial.
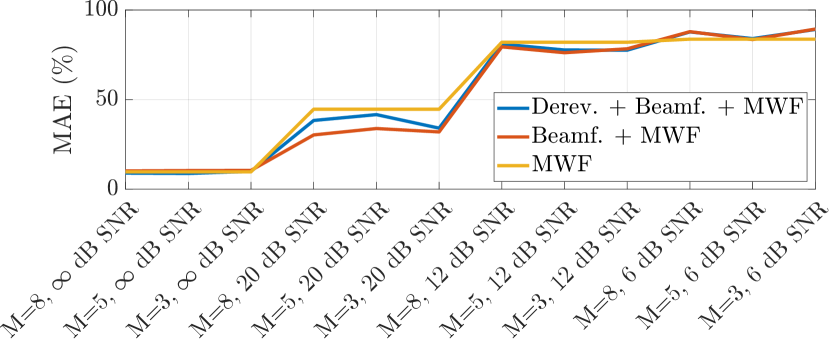
To determine the most suitable processing chain, we compare RIR estimates from the full chain to estimates obtained without dereverberation and to estimates obtained without dereverberation and beamforming. In the latter case, the signal from the microphone closest to the user’s mouth (microphone 5 in Fig. 1) is utilized as the pseudo reference signal. Fig. 6 shows median absolute errors (MAEs) of the RT estimates of the three configurations of the method for varying numbers of microphones and SNRs. Only at an SNR of , a significant difference between the different configurations is observed. Here, the configuration using beamforming but no dereverberation performs best with median errors between and . As some of the microphones are located close to the user’s mouth, a sufficiently clean reference is captured without the additional dereverberation. This configuration is thus used in the evaluation in Sec. VI.
Without noise, all three methods perform similarly, resulting in MAEs of around . At SNRs of and lower, all methods create large errors of about . Interestingly, even in the scenarios with a rather high SNR of , the additional noise considerably impairs the results compared to the scenarios without noise. This likely happens because, due to the proximity of the mouth to the microphones, the reverberant signal energy, whose decay is analyzed to estimated RTs, is much lower than the direct signal energy. Note however that high-SNR scenarios are most relevant for the estimation from own speech as the proximity of the user’s mouth to the microphones results in a high SNR even if the user is located in a noisy environment. To quantify this effect, we conducted measurements under anechoic conditions comparing the level of the user’s own speech to the same speech in distance and found about higher sound pressure levels of the user’s own speech compared to the distant speech for frequencies up to and about up to . Thus, an SNR of for the estimation from own speech is more comparable to an SNR of for far-field speech.
VI Objective Evaluation
VI-A Data Set
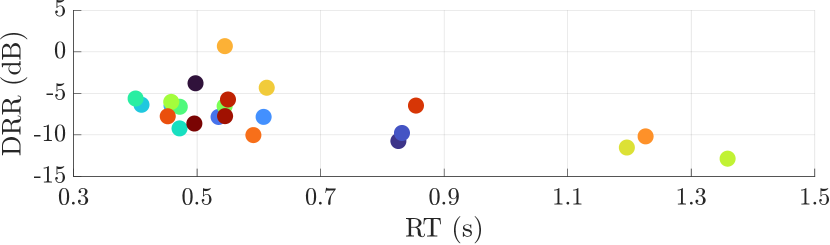
We evaluate the proposed method using a data set of 23 rooms. In each room, RIRs were measured using a Brüel & Kjær Type 4295 omnidirectional loudspeaker and a pair of smart glasses with 8 microphones worn by a Brüel & Kjær HATS 5128-C dummy head. The microphone locations on the smart glasses are illustrated in Fig. 1. The RIRs were measured once with the dummy head looking toward the source and once with the dummy head rotated by 45∘ in azimuth resulting in 46 sets of RIRs. Additionally, all measurements were repeated with the mouth simulator of the dummy head as the source instead of the omnidirectional loudspeaker. The rooms had volumes between and (mean ) and the source-receiver distance (for the omnidirectional loudspeaker) varied between and (mean ). The RTs varied between and (mean ) and the DRRs between and (mean ) as shown in Fig. 7.
VI-B Signal Generation and Parameter Estimation
For the evaluation of the proposed method, the measured far-field and own-voice RIRs were convolved with a source signal containing of either male or female speech. To investigate the performance for different numbers of microphones, not only the full 8-channel microphone array was used but also sub-arrays using only the microphones with indices and in Fig. 1. Multichannel babble noise with the coherence of the microphone array in an isotropic diffuse field was generated using measured anechoic array transfer functions (ATFs) and the method from [34]. The noise was added to the microphone signals with varying gain to achieve average signal-to-noise ratios (SNRs) of , , and over all channels. The noise gain was calculated only considering signal parts where speech was active. Next, the multichannel signals were dereverberated using the GWPE method with the identity matrix approach for covariance estimation, a prediction delay of , a filter order of 36, and STFT block processing using a block length of 2048 samples, a square-root Hann window, and a hop size of 128 samples. A sample rate of was used for all signals in this work. The MVDR beamformer coefficients were calculated using measured ATFs and the noise covariance was estimated using of the babble noise. The beamformer was informed of the true source DOA and applied using the same STFT processing as for the dereverberation. From the resulting pseudo reference signal and the noisy array signals, transfer functions were estimated for each microphone channel using the MWF. The STFT processing used a rectangular window, a hop size of 2048 samples, and a block length of twice the true broadband RT so that the approximation of the convolutive transfer functions as multiplicative transfer functions in the STFT domain is valid [43]. The final RIR estimates were then limited to half the block length in the time domain. This concludes the processing for the objective evaluation. The multichannel RIR estimates were directly used for the calculation of the evaluation metrics.
The best-performing algorithms for RT [44] and DRR estimation [45] from the ACE challenge [18] were employed as a baseline. The ACE challenge compared several estimators under the same conditions which has not been repeated since. They have been compared to many later algorithms and thus are a valuable baseline. The RT estimator finds free-decay regions in the signal and fits decay slopes in frequency bands to estimate frequency-dependent RTs. In contrast to the original publication where a fullband RT is obtained from the subband estimates using a mapping function, we directly use the subband estimates as final parameter estimates to be able to compare RT estimates in octave bands. The DRR estimator calculates DRRs from direct and reverberant PSDs obtained via two delay-and-sum beamformers, one pointed at the source and one rotated by in azimuth. It is provided with the true source DOA, ATFs for the beamformer design, and times of voice activity. The estimator uses all microphone signals for the estimation but only outputs a single DRR estimate. For the calculation of the DRR error, this estimate is compared to the average ground truth DRR over all channels. A bias compensation was not performed.
VI-C Evaluation Metrics
The reverberation time (RT), the direct-to-reverberant energy ratio (DRR), and the weighted angular error (WAE) were used as evaluation metrics. The RTs were calculated in octave bands between and and the calculation of the other metrics was bandlimited between and where sufficient speech energy could be assumed.
The RTs were calculated for each channel of the measured and estimated RIRs using the T20-estimation method of the ITA toolbox [46], i.e., by fitting linear slopes to the sections of the energy decay curves with values between and . Whenever there was no good fit and the T20 estimation failed, the result for the corresponding channel and octave band was obtained using T15 estimation, or T10 estimation if the T15 estimation also failed. If the T10 estimation was also unsuccessful, the estimation for the corresponding microphone channel and frequency band was counted as failed. Note that the ground truths used for the calculation of the RT errors are not the same for all methods. While the proposed RT estimation from far-field speech and the baseline estimators use far-field signals and corresponding ground truths, the proposed method using own speech has its own ground truths, and the RT errors are calculated in relation to those.
Broadband DRRs were calculated for each channel by finding the direct sound peak and extracting the direct energy as the energy within a rectangular window starting before and ending after the peak. The reverberant energy was calculated as the energy from after the direct sound until the beginning of the noise floor which was determined by the RT estimator. As DRR estimates from own speech are only useful for virtual source rendering if they can be related to DRRs from far-field speech, we use the DRR ground truths from the far-field measurements even to calculate errors for the estimates from own speech.
The WAE [7] compares the directional energy distribution of the RIR estimate to the one of the ground truth and is calculated by representing the multichannel RIR via circular harmonics coefficients calculating the mismatch of the pseudo intensity vectors of the estimate and the ground truth, and weighting the directional error by the total energy of the RIR. As the perceptual importance of directional energy is particularly high for early reflections, the WAE was calculated for the early part of the RIRs up to after the direct sound. Recall that the estimation from own speech only obtains RIR estimates for microphones 1 and 8. Thus, no WAE is computed for the own-speech estimates.
As in [18], RT and DRR are evaluated by calculating the mean squared error (MSE), the bias, and the Pearson correlation coefficient . Additionally, we investigate the median absolute error (MAE) and the median absolute deviation (MAD) as they allow for a more intuitive interpretation. The MAE for the RT is given in percent, relative to the ground truth RT. The final error measures were obtained by averaging (MSE) or taking the median over all channels and frequency bands (where applicable).
VI-D Results
The results for array configurations with , and microphones and SNRs of , and are presented in Tab. I. Additionally, results for a best-case scenario without noise and microphones are shown.
| RT | DRR | WAE | ||||||||||||
|---|---|---|---|---|---|---|---|---|---|---|---|---|---|---|
| MSE | bias | MAE (%) | MAD (%) | failed (%) | MSE | bias | MAE (dB) | MAD (dB) | MAE (∘) | MAD (∘) | ||||
| MWF Far Speech | 0.03 | 0.01 | 0.89 | 8.85 | 5.22 | 0 | 5.11 | 0.21 | 0.83 | 1.29 | 0.84 | 44.36 | 7.95 | |
| M=8, dB SNR | MWF Own Speech | 0.01 | 0.07 | 0.95 | 9.98 | 4.24 | 0 | 248.49 | -15.28 | 0.4 | 14.82 | 2.31 | ||
| ACE [44, 45] | 0.08 | -0.09 | 0.68 | 16.19 | 10.63 | 0 | 89.33 | 9.19 | 0.62 | 8.94 | 1.35 | |||
| MWF Far Speech | 0.03 | 0.03 | 0.88 | 10.22 | 6.15 | 0.02 | 4.6 | 0.3 | 0.83 | 1.17 | 0.78 | 45.46 | 9.93 | |
| M=8, 20 dB SNR | MWF Own Speech | 0.11 | 0.16 | 0.72 | 28.65 | 23.79 | 7.22 | 94.88 | -9.15 | 0.45 | 9.07 | 2.04 | ||
| ACE [44, 45] | 0.12 | -0.2 | 0.62 | 29.42 | 21.6 | 0 | 89.55 | 9.2 | 0.62 | 8.96 | 1.37 | |||
| MWF Far Speech | 0.03 | 0.05 | 0.85 | 11.35 | 7.25 | 1.32 | 4.65 | 0.3 | 0.83 | 1.18 | 0.79 | 46.12 | 9.6 | |
| M=8, 12 dB SNR | MWF Own Speech | 0.25 | 0.39 | 0.57 | 78.46 | 14.71 | 31.37 | 66.51 | -7.38 | 0.4 | 6.98 | 2.55 | ||
| ACE [44, 45] | 0.19 | -0.26 | 0.47 | 35.71 | 26.87 | 0 | 90.43 | 9.24 | 0.62 | 9.03 | 1.32 | |||
| MWF Far Speech | 0.04 | 0.08 | 0.82 | 13.4 | 8.67 | 6.29 | 4.66 | 0.33 | 0.83 | 1.2 | 0.79 | 45.67 | 9.5 | |
| M=8, 6 dB SNR | MWF Own Speech | 0.43 | 0.55 | 0.49 | 87.8 | 8.56 | 66.54 | 29.55 | -4.07 | 0.42 | 4.46 | 2.33 | ||
| ACE [44, 45] | 0.25 | -0.31 | 0.35 | 48.76 | 36.19 | 0 | 91.55 | 9.28 | 0.58 | 9.07 | 1.38 | |||
| MWF Far Speech | 0.04 | 0.02 | 0.85 | 11.16 | 6.94 | 0.12 | 6.34 | -0.32 | 0.76 | 1.62 | 0.93 | 35.25 | 8.11 | |
| M=5, 20 dB SNR | MWF Own Speech | 0.12 | 0.17 | 0.74 | 32.75 | 25.26 | 8.15 | 75.83 | -7.98 | 0.38 | 7.67 | 1.91 | ||
| ACE [44, 45] | 0.12 | -0.2 | 0.62 | 28.77 | 21.28 | 0 | 92.7 | 9.38 | 0.66 | 9.15 | 1.56 | |||
| MWF Far Speech | 0.05 | 0.04 | 0.82 | 12.45 | 7.98 | 1.49 | 6.45 | -0.34 | 0.76 | 1.61 | 0.94 | 34.42 | 8 | |
| M=5, 12 dB SNR | MWF Own Speech | 0.23 | 0.38 | 0.62 | 74.19 | 17 | 31.99 | 50.88 | -6.38 | 0.52 | 6.26 | 1.8 | ||
| ACE [44, 45] | 0.2 | -0.26 | 0.47 | 35.57 | 26.47 | 0 | 97.29 | 9.61 | 0.65 | 9.39 | 1.57 | |||
| MWF Far Speech | 0.06 | 0.08 | 0.79 | 14.92 | 9.55 | 6.3 | 6.44 | -0.31 | 0.76 | 1.62 | 0.96 | 34.83 | 7.36 | |
| M=5, 6 dB SNR | MWF Own Speech | 0.35 | 0.5 | 0.56 | 82.45 | 9.22 | 63.66 | 23.38 | -3.66 | 0.55 | 3.63 | 1.99 | ||
| ACE [44, 45] | 0.26 | -0.32 | 0.34 | 50.33 | 37.64 | 0 | 111.86 | 10.33 | 0.61 | 10 | 1.52 | |||
| MWF Far Speech | 0.11 | -0.08 | 0.87 | 17.19 | 11.62 | 0.16 | 16.7 | -2.14 | 0.58 | 2.76 | 1.43 | 32.89 | 7.69 | |
| M=3, 20 dB SNR | MWF Own Speech | 0.13 | 0.18 | 0.7 | 33.48 | 28.14 | 10.02 | 217.55 | -14.29 | 0.39 | 14.04 | 1.92 | ||
| ACE [44, 45] | 0.12 | -0.19 | 0.61 | 27.8 | 21.04 | 0 | 72.9 | 8.24 | 0.68 | 7.99 | 1.47 | |||
| MWF Far Speech | 0.09 | -0.02 | 0.83 | 18.57 | 12.5 | 1.6 | 18.45 | -2.39 | 0.57 | 3.06 | 1.66 | 32.75 | 8.04 | |
| M=3, 12 dB SNR | MWF Own Speech | 0.27 | 0.39 | 0.56 | 79.28 | 16.89 | 38.35 | 141.86 | -11.44 | 0.49 | 11.53 | 2.25 | ||
| ACE [44, 45] | 0.19 | -0.26 | 0.47 | 36.95 | 27.68 | 0 | 76.37 | 8.45 | 0.68 | 8.17 | 1.56 | |||
| MWF Far Speech | 0.08 | 0.04 | 0.79 | 20.17 | 12.6 | 8.28 | 18.71 | -2.45 | 0.56 | 3.2 | 1.72 | 32.73 | 8.42 | |
| M=3, 6 dB SNR | MWF Own Speech | 0.43 | 0.55 | 0.55 | 88.34 | 9.58 | 72.28 | 67.61 | -7.5 | 0.48 | 7.4 | 2.5 | ||
| ACE [44, 45] | 0.26 | -0.33 | 0.34 | 51.88 | 39.64 | 0 | 88.13 | 9.11 | 0.67 | 8.78 | 1.57 | |||
Reverberation Time (RT)
The proposed method outperforms the baseline estimator in all scenarios and RT metrics. The method achieves the best results in terms of MAE and bias in all test cases when using far-field speech. It achieves the highest correlation coefficients in most cases, only in the noise-free scenario the proposed method using own speech generates an even higher correlation. The generated MAEs are with lowest in the scenario without noise and microphones. They increase with decreasing SNR and a decreasing number of microphones to a maximum MAE of for and an SNR of . When the method uses the wearer’s own speech, it achieves good results in the high-SNR scenarios. Without the presence of noise, it creates an MAE of , clearly outperforming the baseline algorithm with an MAE of . At lower SNRs, the method using own speech creates significantly higher errors than the method using the far-field speech but at an SNR of , its results are comparable to the ones from the baseline algorithm from the ACE challenge creating MAEs around . At lower SNRs, the MAEs of both the own speech and the baseline estimator increase strongly but the ACE estimator creates significantly lower errors than the method using own speech. However, the method using own speech in all cases shows a higher correlation coefficient so its results may be improved by a bias compensation.
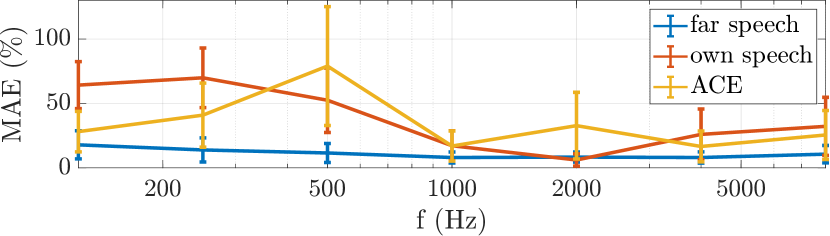
Fig. 8 shows the MAEs as a function of frequency for microphones and an SNR of . While the proposed method using far-field speech generates low errors across the full frequency range, with only slightly increasing MAEs toward low frequencies, the results from the other methods fluctuate more strongly. The MAEs from the proposed method using own speech strongly increase toward low frequencies and the baseline estimator creates substantial errors at the and octave bands.
As described above, cases may exist where the RT estimation fails and hence the last column of the RT metrics in Tab. I shows the percentage of such cases. With the proposed method using far-field speech, of estimates failed in the scenario with SNR microphones. This percentage increases with lower SNRs and less microphones, to a maximum of at an SNR of and microphones. The RT estimation failed in a higher proportion of cases when using own speech, ranging between and . As discussed in Sec. V, this likely is caused by the lower ratio of reverberant to direct energy. Note that a low amount of failed RT estimates can in practice be compensated for by interpolation from neighboring frequency bands or microphone channels. Failure to estimate the RT with the traditional slope fitting may also be avoided by employing other methods that are more robust against a high noise floor such as [47]. The corresponding ACE estimator uses a different fitting procedure and thus none of its estimations failed.
Direct-to-Reverberant Energy Ratio (DRR)
The proposed method with far-field speech also achieves the best results for DRR estimation in almost all cases. Only in the scenarios with microphones, the DRR estimator from the ACE challenge reaches a higher correlation coefficient and in two of those cases also a lower MAD. In those cases, the estimator may achieve better results than the proposed method in terms of the MAE if a data-driven bias compensation is applied. However, the proposed method with far-field speech generates the lowest MAEs in all scenarios. Its MAEs change noticeably with the number of microphones but only slightly with SNR, achieving the lowest MAEs of about for , about for , and the highest MAEs of about for .
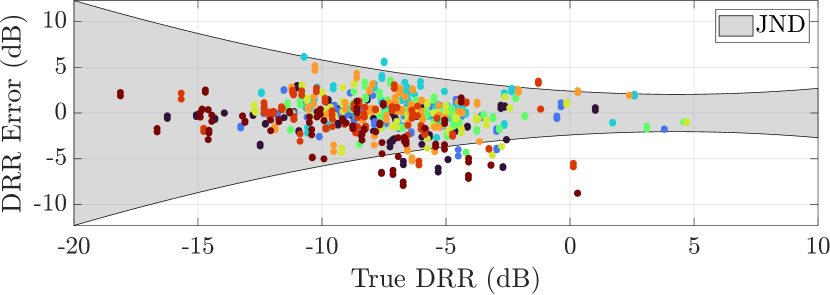
The DRR estimates from the proposed method using far-field speech with microphones and an SNR of are shown for all microphone channels and frequency bands as a function of the true DRR in Fig. 9. By comparing it to the just noticeable differences (JNDs) from [48], we find that of the DRR estimates are within the JND.
As expected, the results from the own speech estimation are strongly biased as the DRR from near-field speech is generally higher than the one from far-field speech. Due to the low correlation coefficient, a simple bias compensation is not sufficient to improve these results but a more sophisticated bias compensation that exploits a source distance estimate may be successful.
Weighted Angular Error (WAE)
WAEs were only computed for the proposed method using far-field speech, as the RIR estimates from own speech only comprise two microphone channels and no corresponding baseline estimator exists for further comparison. The WAEs can however be compared to the ones computed in [6], where the proposed method was used in noise-free scenarios with different arrays of regularly distributed microphones. The most similar array from that study is an equatorial microphone array with 6 microphones, achieving a mean WAE of about which is comparable to the median WAE of about that is obtained in the present study with the smart glasses and 5 microphones. The results do not strongly depend on the SNR but rather on the number of microphones where MAEs in scenarios with more microphones tend to be higher than in scenarios with fewer microphones. Note that the expected WAE generated by a pseudo intensity vector pointing in uniformly distributed random directions is .
VI-E Robustness
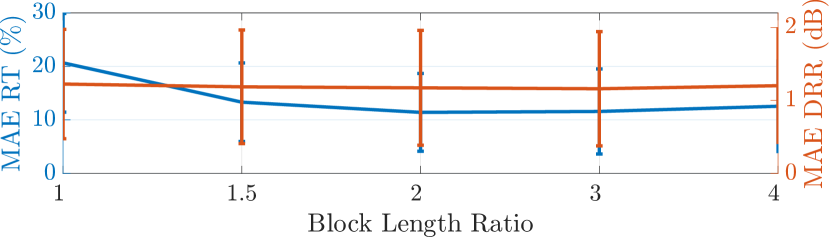
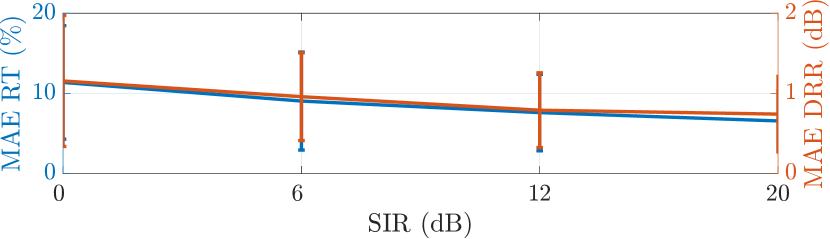
We investigate the robustness of the proposed method with far-field speech against a DOA offset, deviations in the block length of the MWF, and interfering speech. The influence on MAEs of RT and DRR for microphones are shown in Fig. 10.
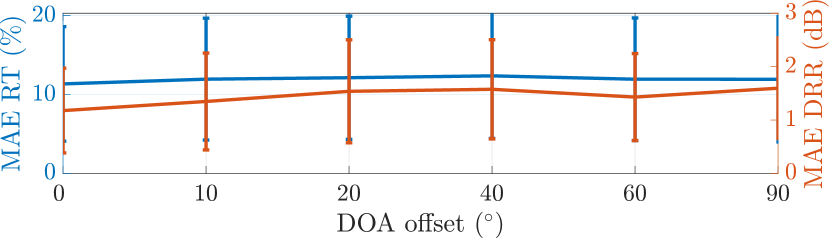
While in the previous analysis, the MVDR beamformer used an ATF from the true source direction as a steering vector, here an ATF from a direction with an azimuthal offset of varying angle to the true source direction was used. The results were obtained for an SNR of . With an increased DOA offset, the MAEs increase slightly from about to for the RT estimates and more significantly from to for DRRs, indicating that RTs can be estimated even if the direct sound is not captured accurately. In contrast, the DRR estimates benefit more from an accurate DOA estimate.
The choice of the block length of the MWF has a larger influence on the MAEs of RTs. On the other hand, it only has a minor influence on MAEs of DRRs. In the previous evaluation, the MWF block length was chosen to be equal to twice the ground truth RT which is shown to give the best results in Fig. 10 (center). When choosing the length to be in the range between to times the ground truth RT, the MAEs of RTs only increase slightly by up to . When the MWF block length is equal to the ground truth RT, the MAE increases by about .
Lastly, we consider a scenario with interfering speech but no additional diffuse noise. For this investigation, a set of 3 rooms was considered, where measurements for source directions at , , and were available. Measurements from the same rooms were used for the perceptual evaluation and are discussed in more detail in Sec. VII-B. The results were obtained for all combinations of positions as target speech position and interfering speech position, resulting in 6 combinations per room and 18 total combinations. The estimation was performed with male target speech and female interfering speech and vice versa. Fig. 10 (bottom) shows MAEs for varying signal-to-interference ratios (SIRs), i.e., varying energy of the interfering speech compared to the speech that is considered for the estimation. For example, at an SIR of , target speech and interfering speech have equal energy. Note that we assume no knowledge about the interferer, neither in terms of its DOA nor its PSD. The MAEs of both RT and DRR moderately increase with decreasing SIR, from to and to , respectively.
VII Listening Experiment
Apart from the objective evaluation, the resynthesized BRIRs should be evaluated perceptually. With the AR application in mind, real/virtual tests under the plausibility [21] or transfer-plausibility paradigm [22], comparing a headphone-rendered stimulus to a stimulus that is played back with a loudspeaker in the room, may be considered appropriate. However, performing real/virtual tests using multiple rooms is cumbersome as participants need to be individually tested in all rooms and the rooms need to be equipped according to the experimental demands. Moreover, the experiment should investigate the perceptual quality of the generated BRIRs without the impact of other factors like non-individualized HRTFs, head-tracking artifacts, and the distortion of external sounds through headphones. Thus, we only use static, headphone-rendered stimuli intending to answer two research questions:
(i) Is it better to use an estimated response than a measured response from another, geometrically similar room?
(ii) Can the estimated response be distinguished from the measured response?
Therein, (i) aims at testing whether BRIR estimation is worth the effort when the alternative is to choose an available response from a different, but similar room for rendering. Question (ii) aims at assessing if the quality of the estimate is so good that it is confused with a measurement.
VII-A Experiment Design
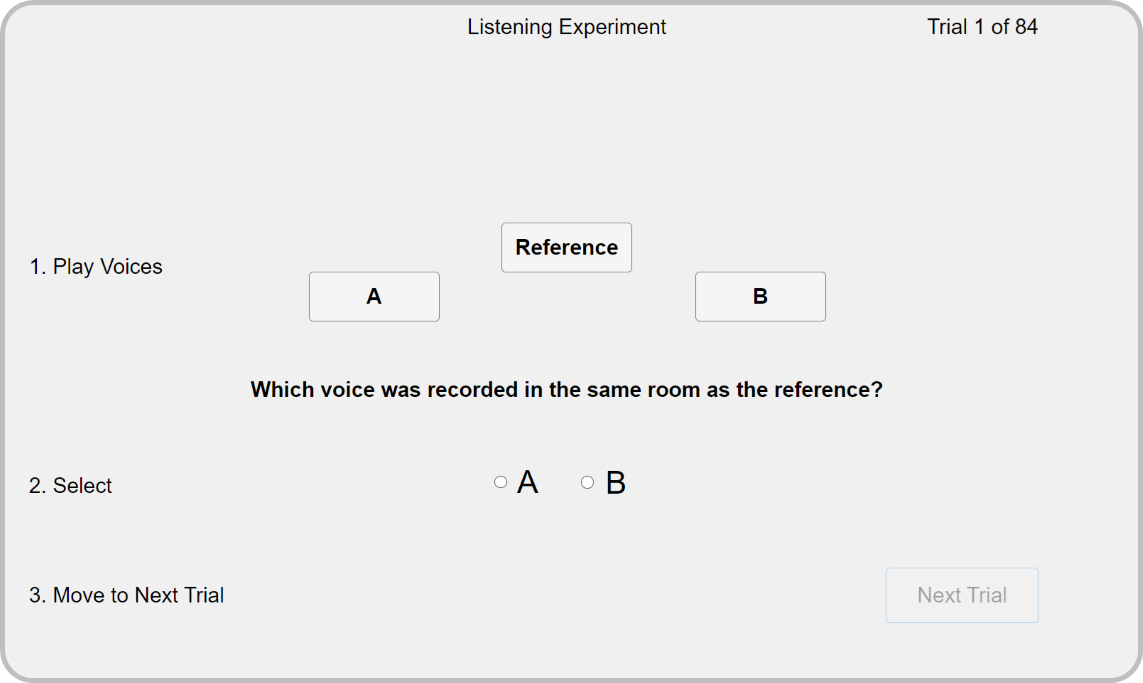
To answer questions (i) and (ii), a test was designed with a reference sample and two test samples in each trial. Participants were asked to listen to the three samples and to select which one of the test samples (A or B) sounded as if it was recorded in the same room as the reference. The reference used one speech signal as source material and the test samples used a different speech signal. Different speech signals for different samples in one trial are also employed in real/virtual tests under the transfer-plausibility paradigm [22]. Following [49], where, like here, all renderings were virtual, the measurement from the same position rendered with a different signal would be called a “transfer-reference”. Also, the design is akin to the identification test performed within the co-immersion framework [50].
The user interface of the experiment is shown in Fig. 11. In all trials of all parts of the experiment, the speech signals of the reference and the test samples were different but of the same type (female or male speech) and were based on BRIRs from different positions. For example, if the reference sample was created from BRIRs with the source located to the left of the listener convolved with a sample of female speech, both test samples would be generated using either measured BRIRs or estimated BRIRs with the source located to the right of the listener, convolved with the same audio sample of the female speaker but this speech sample would differ from the one used by the reference.
To answer (i), two parts were included. In part I.a, the reference was based on a measured response, and the first test stimulus was based on an estimated response from the same room as the reference, whereas the second test stimulus was based on a measured response from a different room. Thus, choosing the estimated response implies that it is closer to the reference than the response of the other room. If participants choose the measured response from another room, it remains unclear if the confusion originated from shortcomings of the estimate or from the fact that the tested rooms are so similar that participants cannot distinguish them. Therefore, part I.b tests the distinguishability between measured responses from different rooms.
To assess the much stricter question (ii), part II of the experiment used a measured response from one position in a room for generating the reference. One of the test samples was based on a measured response from a different location in the same room and the other one on an estimated response of the room. Here, participants are expected to only confuse the measurement with the estimate if the estimate reproduces RT and DRR with low error and is completely free from artifacts and audible degradations.
The experiment comprised a total of 84 trials. Parts I.a and I.b of the experiment were initially designed with 24 trials each, containing the combinations of 6 room comparisons (each of the 3 rooms compared to 2 other rooms), 2 source positions, and 2 signal types (female or male speech). After a pilot test, a repetition of all trials of part I.a with different speech signals was added to reduce the influence of individual speech signals, resulting in 72 trials for part I of the experiment. Part II of the experiment only contained within-room comparisons of measured and estimated responses and thus had 12 trials including all combinations of the 3 rooms, 2 positions, and 2 signal types. All trials appeared in random order for each participant and the trials of parts I and II were not separated. Within each trial, test samples A and B were randomly assigned to buttons A and B in the user interface for each participant. To familiarize the participants with the procedure, they had to complete 3 training trials whose answers were not included in the results.
VII-B Data Set
For the listening experiment, a data set with RIRs from geometrically similar rooms with the same relative source-receiver positions was required. The chosen data set comprises three sets of RIRs, obtained from a meeting room of dimensions and a variable-acoustics lab space of dimensions that was measured in a dry condition, i.e., with acoustic wall panels turned to their absorbing side, and in a reverberant condition with the panels turned to their reflecting side. Within each room, two source positions were measured with Genelec 8320A loudspeakers that were located at azimuth and a distance of (meeting room) or (lab space) from the Brüel & Kjær HATS 5128-C dummy head wearing the smart glasses as receiver. In the meeting room, a table was located between the loudspeakers and the dummy head. To be able to answer (i), rooms with similar dimensions were chosen so that, based on the geometry, it would be reasonable to employ a response from one of the rooms to auralize any of the others.
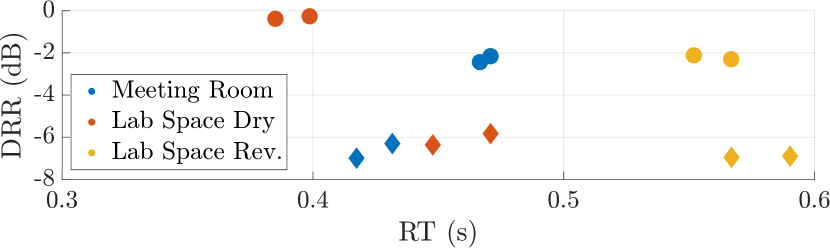
Fig. 12 shows measured reverberation times and DRRs of the three rooms, averaged over microphone channels and octave bands. Circles illustrate the metrics for a frequency range between and , and diamonds for a limited frequency range between and where speech carries the majority of its energy. When considering the frequency range up to , the three rooms have different RTs of (Lab Space Dry), (Meeting Room) and (Lab Space Rev.) but for the limited frequency range up to , Meeting Room and Lab Space Dry have similar RTs and all three rooms have similar DRRs.
VII-C Signal Generation
The reference samples for the experiment were generated by rendering a measured multichannel RIR using the eMagLS binaural rendering technique (cf. Sec. IV-C) and convolving the resulting BRIR with a speech sample. For each trial, one out of eight speech samples of either male or female speech was picked randomly for the reference and one of the seven remaining samples of the same type (male or female) was randomly chosen for the test samples. The selection of speech samples was done beforehand so that the samples in each trial were the same for all participants.
The multichannel RIR estimates were generated using the same parameters as for the objective evaluation in Sec. VI-B. However, only estimates from far-field speech using the full array of 8 microphones were used and no noise was added to the array signals. The RIR estimates were then resynthesized and rendered as detailed in Sec. IV. All samples were band-limited to frequencies between and . The binaural rendering was done for a forward-facing head orientation and no head tracking was performed during the experiment.
VII-D Results
23 participants aged between 24 and 62 years (average 37 years) took part in the experiment. 6 of the participants had previously participated in a listening experiment. One participant reported mild hearing loss. They took between 12 and 54 minutes (average 24 minutes) to complete the experiment. For this test, we preferred mostly inexperienced listeners, as we believe that their perception will matter more in an application scenario. Also, through the test design as a 2AFC task with a simple question, no extensive acoustical expertise was required.
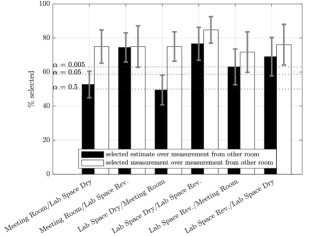
Fig. 13(a) shows the results for part I of the experiment. Recall that participants were asked which of the test samples was recorded in the same room as the reference. The black bars show that for four out of six pairs, the estimate was selected significantly more often () than a rendering using a measured response from another room. In two cases, the percentage of selections was close to 50. In these cases, the estimate was neither better nor worse than a measurement from a different room.
The white bars show that for all pairs, a measurement from the same room was selected significantly more often than a measurement from another room. This indicates that participants were better than chance when distinguishing between the rooms, independent of the pair. Note however that the proportions are in a range of –, indicating that the participants did not always recognize the measurement from the same room.
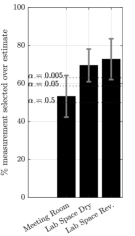
Fig. 13(b) shows the results of part II of the experiment, where measurements and estimates from the same position in the same room were directly compared to the reference, which was generated from a measurement from another position in the same room. For the Meeting Room, the estimates were selected as often as the measurements. For the Lab Space in the dry and reverberant settings, the percentages of selecting the measurement over the estimate are and .
VII-E Discussion
Regarding (i), the result is positive for four out of six rooms. Here, the estimate is more similar to the reference than a measurement from another, geometrically similar room. For the pair Meeting Room / Lab Space Dry, using the estimate was as good as using a measurement from the other room. This is not unexpected, as these rooms are very similar in terms of RT and DRR as shown in Fig. 12. Using measured responses from a database according to parameter similarity might thus in fact be another viable approach for solving the room acoustic matching problem [51]. Comparing the results from part I.b (white bars in Fig. 13(a)) however shows that when comparing measurements from these two rooms, distinguishability was far from perfect (a result in line with [52]) but significantly above chance level. This suggests that the estimation is not perfect yet, as in that case, participants would recognize the differences between the rooms even when one of them used an estimated response for rendering.
Regarding (ii), the experiment has shown that for one of the three rooms, the estimate is selected as often as a measurement from the same position. For the other two rooms, the measurement was selected more often, suggesting that the method does not provide equally perfect results for all types of rooms yet.
VIII Conclusion
We presented a method to blindly identify BRIRs from speech signals captured with a microphone array in a pair of smart glasses. In an intermediate step, the method provides multichannel RIR estimates that we used to estimate room acoustic parameters. When using far-field speech, the method outperforms baseline estimators in both RT and DRR estimation in all considered scenarios, across different microphone array configurations and SNRs. It further reproduces the directional energy distribution captured by the multichannel RIRs similarly accurate with the pair of smart glasses as with a comparable conventional microphone array. The method is robust against inaccuracies in the assumed source DOA, deviations in the chosen block length, and interfering speech. When the proposed method uses speech from the person wearing the smart glasses for the estimation, it delivers accurate RT estimates only in high-SNR scenarios. High-SNR scenarios are however the most realistic scenarios for this use case as the proximity of the user’s mouth to the microphone array naturally ensures a high SNR.
The estimated BRIRs were further evaluated in a listening experiment. The results suggest that the estimated BRIRs often allow for a perceptually more convincing virtual source rendering than measured BRIRs from geometrically similar rooms. What is more, in no case was a measurement from a different room selected more often than a generated estimate, indicating that the estimates do not contain artifacts or distortions that would make participants undoubtedly choose the other given stimulus. For one of the three investigated rooms, the BRIR estimates were even confused with a measured BRIR from the same position.
A reference implementation and binaural audio samples from the listening experiment are provided at https://github.com/facebookresearch/GlassesRoomID.
References
- [1] A. Neidhardt, C. Schneiderwind, and F. Klein, “Perceptual Matching of Room Acoustics for Auditory Augmented Reality in Small Rooms - Literature Review and Theoretical Framework,” Trends in Hearing, vol. 26, p. 1–22, 2022.
- [2] S. V. Amengual Gari, P. W. Robinson, and P. T. Calamia, “Room acoustic characterization for binaural rendering: From spatial room impulse responses to deep learning,” in Proc. International Congress on Acoustics, 2022, p. 1–10.
- [3] H. Møller, M. F. Sørensen, D. Hammershøi, and C. B. Jensen, “Head-related transfer functions of human subjects,” J. Audio Eng. Soc., vol. 43, no. 5, p. 300–321, 1995.
- [4] S. V. Amengual Garí, J. M. Arend, P. T. Calamia, and P. W. Robinson, “Optimizations of the spatial decomposition method for binaural reproduction,” J. Audio Eng. Soc., vol. 68, no. 12, pp. 959–976, 2020.
- [5] T. Deppisch, H. Helmholz, and J. Ahrens, “End-to-End Magnitude Least Squares Binaural Rendering of Spherical Microphone Array Signals,” in Int. Conf. on Immersive and 3D Audio, 2021, pp. 1–8.
- [6] T. Deppisch, J. Ahrens, S. V. Amengual Garí, and P. Calamia, “Blind Estimation of Spatial Room Impulse Responses Using a Pseudo Reference Signal,” in Workshop on Hands-free Speech Communication and Microphone Arrays (HSCMA), 2024, p. 1–5.
- [7] N. Meyer-Kahlen and S. J. Schlecht, “Blind Directional Room Impulse Response Parameterization from Relative Transfer Functions,” in IEEE Int. Workshop on Acoustic Signal Enhancement, 2022, p. 1–5.
- [8] G. Xu, H. Liu, L. Tong, and T. Kailath, “A Least-Squares Approach to Blind Channel Identification,” IEEE Transactions on Signal Processing, vol. 43, no. 12, pp. 2982–2993, 1995.
- [9] Y. Huang and J. Benesty, “A class of frequency-domain adaptive approaches to blind multichannel identification,” IEEE Transactions on Signal Processing, vol. 51, no. 1, pp. 11–24, 2003.
- [10] M. A. Haque and M. K. Hasan, “Noise Robust Multichannel Frequency-Domain LMS Algorithms for Blind Channel Identification,” IEEE Signal Processing Letters, vol. 15, p. 305–308, 2008.
- [11] B. Jo and P. Calamia, “Robust blind multichannel identification based on a phase constraint and different lp-norm constraints,” in 28th European Signal Processing Conference, 2021, pp. 1966–1970.
- [12] A. Perez-Lopez, A. Politis, and E. Gomez, “Blind reverberation time estimation from ambisonic recordings,” in IEEE 22nd International Workshop on Multimedia Signal Processing, 2020, pp. 1–6.
- [13] C. J. Steinmetz, V. K. Ithapu, and P. Calamia, “Filtered Noise Shaping for Time Domain Room Impulse Response Estimation from Reverberant Speech,” in IEEE Workshop on Applications of Signal Processing to Audio and Acoustics, 2021, pp. 221–225.
- [14] K. Lee, J. Seo, K. Choi, S. Lee, and B. S. Chon, “Room Impulse Response Estimation in a Multiple Source Environment,” in AES Int. Conf. on Spatial and Immersive Audio, 2023.
- [15] Z. Liao, F. Xiong, J. Luo, M. Cai, E. S. Chng, J. Feng, and X. Zhong, “Blind Estimation of Room Impulse Response from Monaural Reverberant Speech with Segmental Generative Neural Network,” in INTERSPEECH, 2023, pp. 2723–2727.
- [16] A. Ratnarajah, I. Ananthabhotla, V. K. Ithapu, P. Hoffmann, D. Manocha, and P. Calamia, “Towards Improved Room Impulse Response Estimation for Speech Recognition,” in IEEE International Conference on Acoustics, Speech and Signal Processing, 2023, pp. 1–5.
- [17] S. Lee, H. S. Choi, and K. Lee, “Yet Another Generative Model for Room Impulse Response Estimation,” in IEEE Workshop on Applications of Signal Processing to Audio and Acoustics, 2023, pp. 1–5.
- [18] J. Eaton, N. D. Gaubitch, A. H. Moore, and P. A. Naylor, “Estimation of Room Acoustic Parameters: The ACE Challenge,” IEEE/ACM Transactions on Audio Speech and Language Processing, vol. 24, no. 10, pp. 1681–1693, 2016.
- [19] H. Gamper and I. J. Tashev, “Blind reverberation time estimation using a convolutional neural network,” IEEE Int. Workshop on Acoustic Signal Enhancement, pp. 136–140, 2018.
- [20] P. Götz, C. Tuna, A. Walther, and E. A. P. Habets, “Online reverberation time and clarity estimation in dynamic acoustic conditions,” The Journal of the Acoustical Society of America, vol. 153, no. 6, pp. 3532–3542, 2023.
- [21] A. Lindau and S. Weinzierl, “Assessing the plausibility of virtual acoustic environments,” Acta Acustica united with Acustica, vol. 98, no. 5, pp. 804–810, 2012.
- [22] S. A. Wirler, N. Meyer-Kahlen, and S. J. Schlecht, “Towards transfer-plausibility for evaluating mixed reality audio in complex scenes,” in AES Int. Conf. on Audio for Virtual and Augmented Reality, 2020, p. 1–10.
- [23] T. Yoshioka and T. Nakatani, “Generalization of multi-channel linear prediction methods for blind MIMO impulse response shortening,” IEEE Transactions on Audio, Speech and Language Processing, vol. 20, no. 10, pp. 2707–2720, 2012.
- [24] V. W. Neo, C. Evers, and P. A. Naylor, “Speech dereverberation performance of a polynomial-EVD subspace approach,” in 28th European Signal Processing Conference, 2021, pp. 221–225.
- [25] T. Yoshioka and T. Nakatani, “Dereverberation for reverberation-robust microphone arrays,” in 21st European Signal Processing Conference, 2013, pp. 1–5.
- [26] S. Braun and E. A. Habets, “Online Dereverberation for Dynamic Scenarios Using a Kalman Filter with an Autoregressive Model,” IEEE Signal Processing Letters, vol. 23, no. 12, pp. 1741–1745, 2016.
- [27] H. L. Van Trees, Optimum Array Processing: Part IV of Detection, Estimation, and Modulation Theory. John Wiley & Sons, 2002.
- [28] R. O. Schmidt, “Multiple emitter location and parameter estimation,” IEEE Transactions on Antennas and Propagation, vol. 34, no. 3, pp. 276–280, 1986.
- [29] J.-M. Jot, “An analysis/synthesis approach to real-time artificial reverberation,” in Proc. IEEE Int. Conf. on Acoustics, Speech, and Signal Processing, 1992, p. 221–224.
- [30] J. Traer and J. H. McDermott, “Statistics of natural reverberation enable perceptual separation of sound and space,” Proc. of the National Academy of Sciences, vol. 113, no. 48, pp. E7856–E7865, 2016.
- [31] V. Välimäki, B. Holm-Rasmussen, B. Alary, and H. M. Lehtonen, “Late reverberation synthesis using filtered velvet noise,” Applied Sciences, vol. 7, no. 5, p. 1–17, 2017.
- [32] C. Pörschmann, P. Stade, and J. M. Arend, “Binauralization of Omnidirectional Room Impulse Responses - Algorithm and Technical Evaluation,” in 20th Int. Conf. on Digital Audio Effects, 2017, pp. 345–352.
- [33] J. M. Arend, S. V. Amengual Garí, C. Schissler, F. Klein, and P. W. Robinson, “Six-Degrees-of-Freedom Parametric Spatial Audio Based on One Monaural Room Impulse Response,” J. Audio Eng. Soc., vol. 69, no. 7/8, pp. 557–575, 2021.
- [34] E. A. P. Habets, I. Cohen, and S. Gannot, “Generating nonstationary multisensor signals under a spatial coherence constraint,” The Journal of the Acoustical Society of America, vol. 124, no. 5, pp. 2911–2917, 2008.
- [35] M. Zaunschirm, C. Schörkhuber, and R. Höldrich, “Binaural rendering of Ambisonic signals by head-related impulse response time alignment and a diffuseness constraint,” The Journal of the Acoustical Society of America, vol. 143, no. 6, pp. 3616–3627, 2018.
- [36] C. Schörkhuber, M. Zaunschirm, and R. Höldrich, “Binaural Rendering of Ambisonic Signals via Magnitude Least Squares,” in Proc. of the German Annual Conference on Acoustics (DAGA), 2018, pp. 339–342.
- [37] R. Duraiswami, D. N. Zotkin, Z. Li, E. Grassi, N. A. Gumerov, and L. S. Davis, “High Order Spatial Audio Capture and its Binaural Head-Tracked Playback over Headphones with HRTF Cues,” in Proc. 119th Conv. Audio Eng. Soc., 2005, p. 1–16.
- [38] I. Ifergan and B. Rafaely, “On the selection of the number of beamformers in beamforming-based binaural reproduction,” Eurasip Journal on Audio, Speech, and Music Processing, vol. 2022, no. 6, p. 1–17, 2022.
- [39] L. Madmoni, J. Donley, V. Tourbabin, and B. Rafaely, “Beamforming-based Binaural Reproduction by Matching of Binaural Signals,” in AES Int. Conf. on Audio for Virtual and Augmented Reality, 2020, p. 1–8.
- [40] ——, “Binaural Reproduction from Microphone Array Signals Incorporating Head-Tracking,” in Immersive and 3D Audio: From Architecture to Automotive, 2021, pp. 1–5.
- [41] T. Lübeck, S. V. Amengual Garí, P. Calamia, D. L. Alon, J. Crukley, and Z. Ben-Hur, “Perceptual evaluation of approaches for binaural reproduction of non-spherical microphone array signals,” Frontiers in Signal Processing, vol. 2, no. August, pp. 1–18, 2022.
- [42] L. McCormack, N. Meyer-Kahlen, D. L. Alon, Z. Ben-Hur, S. V. Amengual Gari, and P. Robinson, “Six-Degrees-of-Freedom Binaural Reproduction of Head-Worn Microphone Array Capture,” J. Audio Eng. Soc., vol. 71, no. 10, p. 638–649, 2023.
- [43] Y. Avargel, S. Member, and I. Cohen, “On Multiplicative Transfer Function Approximation in the Short-Time Fourier Transform Domain,” IEEE Signal Processing Letters, vol. 14, no. 5, pp. 337–340, 2007.
- [44] T. d. M. Prego, A. A. de Lima, S. L. Netto, B. Lee, A. Said, R. W. Schafer, and T. Kalker, “A blind algorithm for reverberation-time estimation using subband decomposition of speech signals,” The Journal of the Acoustical Society of America, vol. 131, no. 4, pp. 2811–2816, 2012.
- [45] Y. Hioka and K. Niwa, “PSD estimation in Beamspace for Estimating Direct-to-Reverberant Ratio from A Reverberant Speech Signal,” in Proc. ACE Challenge Workshop, 2015.
- [46] M. Berzborn, R. Bomhardt, J. Klein, J.-G. Richter, and M. Vorländer, “The ITA-Toolbox: An Open Source MATLAB Toolbox for Acoustic Measurements and Signal Processing,” Proc. of the German Annual Conference on Acoustics (DAGA), pp. 222–225, 2017.
- [47] G. Götz, R. Falcón Pérez, S. J. Schlecht, and V. Pulkki, “Neural network for multi-exponential sound energy decay analysis,” The Journal of the Acoustical Society of America, vol. 152, no. 2, pp. 942–953, 2022.
- [48] E. Larsen, N. Iyer, C. R. Lansing, and A. S. Feng, “On the minimum audible difference in direct-to-reverberant energy ratio,” The Journal of the Acoustical Society of America, vol. 124, no. 1, pp. 450–461, 2008.
- [49] T. McKenzie, N. Meyer-Kahlen, and S. J. Schlecht, “The role of source signal similarity in distinguishing between different positions in a room,” in AES Int. Conf. on Spatial and Immersive Audio, 2023, p. 1–9.
- [50] D. Fantini, G. Presti, M. Geronazzo, R. Bona, A. G. Privitera, and F. Avanzini, “Co-immersion in Audio Augmented Virtuality: the Case Study of a Static and Approximated Late Reverberation Algorithm,” IEEE Trans. Visual. Comput. Graphics, vol. 29, no. 11, pp. 4472–4481, 2023.
- [51] F. Klein, A. Neidhardt, and M. Seipel, “Real-time Estimation of Reverberation Time for Selection of suitable binaural room impulse responses,” in 5th Int. Conf. on Spatial Audio, 2019, pp. 145–150.
- [52] H. Helmholz, I. Ananthabhotla, P. T. Calamia, and S. V. Amengual Garí, “Towards the Prediction of Perceived Room Acoustical Similarity,” in AES Int. Conf. on Audio for Virtual and Augmented Reality, 2022, pp. 1–11.