Prediction and identification of point defect fingerprints in the X-ray photoelectron spectra of TiNx
Abstract
We investigate the effect of selected N and Ti point defects in 1 TiN on N 1s and Ti 2p3/2 binding energies (BE) by experiments and ab initio calculations. X-ray photoelectron spectroscopy (XPS) measurements of Ti-deficient TiN films reveal additional N 1s spectral components at lower binding energies. Ab initio calculations predict that these components are caused by either Ti vacancies, which induce a N 1s BE shift of eV in its first N neighbors, and/or N tetrahedral interstitials, which have their N 1s BE shifted by eV and also shift BE of their first N neighbors by eV. However, the ab initio calculations also reveal that the tetrahedral N interstitial is unstable at room temperature. We, therefore, unambiguously attribute the detected signal to Ti vacancies. Furthermore, the vacancy concentration in Ti-deficient TiN was quantified with XPS supported by ab initio calculations. The largest BE shifts of , and eV for Ti 2p3/2 electrons are predicted for the Ti tetrahedral, split (10)-aligned and split (111)-aligned interstitial atoms, respectively, and we, therefore, propose XPS could detect them. Other defects such as N vacancy or N split (10)-aligned interstitial introduce smaller N 1s and Ti 2p3/2 BE shifts and are unlikely to be detectable experimentally. Our work highlights the potential of ab initio-guided XPS measurements in detecting and quantifying point defects in 1 TiN.
keywords:
TiN, point defects, XPS, N 1s and Ti 2p binding energies, DFT1 Introduction
X-ray photoelectron spectroscopy (XPS) has been an invaluable tool used to characterize the surfaces [1, 2, 3, 4] and oxidation [5, 6] of TiN films, since even short exposure to air leads to the formation of oxide and oxynitride overlayer at the surface [7, 8]. As the inelastic electron mean free path in TiO2 is just 1.5 nm at 1000 eV [9], the surface oxide makes it difficult to obtain information about the unoxidized TiN coating itself. For example, it was previously shown that Ti-deficient TiN is exhibiting some shift of N 1s binding energies to lower values [2, 10]. However, the specific explanation, whether this is a feature of the film itself or just an effect of the oxide layer, was never clarified.
While the straightforward solution to eliminate or greatly reduce the oxygen exposure altogether is to perform the XPS measurements in situ [11, 2], recently, capping approaches were developed to prevent oxidation of the TiN films even when the samples are exposed to atmosphere [12, 13]. It was also shown that when the oxidation is small, angle-resolved XPS can be used to distinguish the signal coming from below the oxidized region [11]. Therefore, it is possible to use XPS to obtain information from the bulk-like region of the TiN thin film.
Ab initio techniques have been successfully used to aid the XPS analysis of various materials. The core electron binding energies (BE) shifts can be precisely predicted using the density functional theory together with core-hole approaches [14, 15, 16]. It has been recently demonstrated that such a combined approach can help to explain spectral features observed experimentally [17] and to obtain important information about the structure of the materials [18]. Our recent work showed that it is possible to detect and even quantify the concentration of Ti vacancies in Ti1-δOxN1-x thin films [19]. That work focused on Ti vacancies, while the possible presence and influence of other point defects were not studied.
In this work, we will examine a series of Al-capped TiNx thin films with different stoichiometry deposited using high-power pulsed magnetron sputtering together with density functional theory (DFT) calculations of N 1s and Ti 2p BE shifts induced by various point defects. We will critically evaluate whether the findings are relevant for experimental analysis of point defects in TiN by XPS.
2 Methodology
2.1 Experiment
TiNx thin films were deposited onto Si (100) substrates at floating potential using reactive high-power pulsed magnetron sputtering (HPPMS) of a 50 mm diameter Ti target (99.99 % purity, EVOCHEM Advanced Materials) with an average power density of 9.4 W/cm2, 2.5% duty cycle and 50 s on-time. The depositions were performed in a pure nitrogen atmosphere at 1 Pa pressure and a target-to-substrate distance of 10 cm at different temperatures, = 100, 200, 300, and 400 ∘C with deposition time of 2 hours. The base pressure at deposition temperature was for all depositions less than Pa. The temperature was the main variable in the depositions controlling the film composition. After the depositions, films were cooled to room temperature for two hours, while still under vacuum. Subsequently, a thin Al capping was deposited for 12 s by direct current magnetron sputtering of a diameter-50 mm Al target at 3.9 W/cm2 power density in Ar atmosphere at 0.5 Pa. The capping layer was deposited at room temperature in order to achieve a perfectly homogeneous Al layer since a pronounced island growth was observed at higher . Sputter cleaning behind a closed shutter for at least 2 minutes was performed for both Ti and Al targets before the TiN and Al depositions, respectively. The sample was immediately transferred to the KRATOS AXIS SUPRA X-ray photoelectron spectroscope after capping to limit the surface contamination, with the total air exposure time below 10 minutes.
The XPS was equipped with a monochromatic Al Kα source and a hemispherical detector. The spectrometer was calibrated with respect to the BE of Au 4f7/5 (83.9 eV), Ag 3d5/2 (368.3 eV), and Cu 2p3/2 (932.7 eV) signals. During spectra acquisition, the base pressure of the system was Pa. No charging effects were observed during XPS measurements. O 1s, Ti 2p, N 1s, C 1s and Al 2p core-level spectra were collected with a pass energy of 20 eV, a step size of 0.1 eV, and a dwell time of 1000 ms in 3 alternating sweeps. Additional high resolution (20 sweeps, 10 eV pass energy, 1 s dwell time, and 0.04 eV step) and angle-resolved XPS measurements (at 0°, 50°, and 70°, 3 sweeps, 20 eV pass energy, 1 s dwell time and 0.05 eV step) were performed for the N 1s region.
For the structural analysis with X-ray diffraction (XRD), a Bruker AXS D8 Discover General Area Detector Diffraction System (GADDS) was utilized. The Cu Kalpha ( Å) X-ray source was set to 40 kV at a current of 40 mA and the incident angle was fixed at 15∘.
Ion beam analysis has been performed at the Tandem Laboratory of Uppsala University [20]. Depth profiles of the elemental composition were obtained by time-of-flight elastic recoil detection analysis (ToF-ERDA) using 36 MeV 127I8+ primary ions. The ion beam was directed onto the sample at an angle of 67.5° with respect to the surface normal and time-energy coincidence spectra were obtained at an angle of 45° with respect to the primary beam. The detection system is described in more detail in [21] and a segmented gas detector system was employed [22]. Time-energy coincidence spectra were converted to depth profiles with CONTES [23] and all films exhibited homogeneous depth profiles. Sources of uncertainty for ToF-ERDA are the detection efficiency below unity as well as the specific energy loss of primary ions and recoil species [24]. Minimization of such uncertainties can be realized by combining different methods [25]. Thus, ToF-ERDA was combined with Rutherford backscattering spectrometry (RBS) using a 2 MeV 4He+ primary beam and backscattered ions were detected at an angle of 170°. SIMNRA [26] was used for RBS data analysis. Based on the combination of both techniques—ToF-ERDA and RBS—the total measurement uncertainty was 2% relative of the deduced values. The samples are referenced by their ToF-ERDA/RBS composition throughout the manuscript (e.g., TiN1.37, TiN1.18).
2.2 Ab initio modelling
222 TiN supercells with size of 64 atoms and a single-point defect were used for the calculations. The list of point defects considered here consists of N (VN) and Ti (VTi) vacancies, N and Ti tetrahedral (I and I), split (10)-aligned (I and I) and split (111)-aligned (I and I) N and Ti interstitials [27] as well as of the most stable N Frenkel pair consisting of the N split (10)-aligned interstitial with the two N atoms equally distant from the vacancy site (FP) [28]. Furthermore, 333 supercell models with a single defect were prepared for VN and VTi in order to estimate the influence of the supercell size. The initial models were fully relaxed with respect to atomic positions and cell size and shape using the Vienna Ab initio Simulation Package (VASP) [29, 30] DFT [31, 32] code. Projector augmented wave (PAW) pseudopotentials [33] were used with the plane-wave energy cutoff of 500 eV, -point grid of 555 (333 for the larger supercells), and Gaussian smearing method with broadening of 0.1 eV.
Nudged elastic band method [34] as implemented in VASP was used to estimate the migration barrier between neighboring interstitial sites. The calculations ran with the same parameters as the structural relaxations above. We used 5 intermediate images between fully relaxed N in the tetrahedral position and the (111)-aligned split interstitial employing the supercells. The images were allowed to be fully structurally relaxed during the NEB calculation.
The N 1s and Ti 2p3/2 BEs were calculated as the energy difference between the final state, where a single electron was removed from the specified atom and core level and placed in the valence band, and the initial ground state. Self-consistent DFT calculations were used for both the ground and the final state. The final state always corresponds to the lowest energy state under the constraint of the specific core electron being removed from the core level and placed into the valence band. As a result, the method is able to predict the main XPS peaks. However, spectral features corresponding to additional energy loss events, e.g., the satellite peaks, are not modeled. We note that while the absolute BEs do not correspond to the absolute experimental values by few eV, the relative BE shifts using the same method for Ti1-δOxN1-x were previously found to be in perfect agreement with the experiment [19]. The BE calculations were carried out for every atom in the supercell, leading to 64 core hole calculations per defect model and used the all-electron full-potential Wien2k code with the linearized augmented plane-wave basis set [35]. Atomic muffin-tin radii were set to 1.79 and 1.25 Bohr radius for Ti and N atoms, respectively. The basis size parameter of 7.5 and 444 -point grid should guarantee a convergence of better than 0.05 eV for the calculated BEs (while the convergence of the relative energy shifts should be even better). Perdew–Burke–Ernzerhof (PBE) functional was used for all calculations [36]. For the purpose of visualization and comparison with experimental spectra, the discrete calculated binding energies were broadened by Gaussians with eV and the energies were shifted such that the main N 1s peak corresponding to stoichiometric TiN without defects is at 397.3 eV and main Ti 2p3/2 peak at 455.1 eV [1]. All DFT calculations are publicly available under the Creative Commons license in the NOMAD Archive [37, 38].
3 Results and discussion
3.1 Film composition and structure
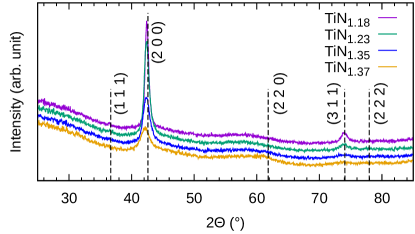
The chemical compositions of all as deposited TiNx films was characterized by ion beam analysis and are summarized in Table 1. All measured samples are Ti-deficient with respect to stoichiometric TiN1.0 and Ti content is decreasing with the decreasing deposition temperature. Figure 1 shows XRD patterns of the deposited films. All films show a highly textured cubic TiN phase, however, with the decreasing deposition temperature, the intensity of the diffraction peaks clearly decreases and larger peak broadening is observed, indicating smaller TiN crystallites. Additionally, the peak shifts to smaller angles at lower deposition temperatures, thus corresponding to a lattice parameter increase for films deposited at lower temperatures. However, due to very significant texturing in the films and small grain sizes, the evaluation of stress-free lattice parameter, e.g., by method, was not possible.
| (∘C) | Ti (at. %) | N (at. %) | in TiNx |
|---|---|---|---|
| 100 | 1.37(5) | ||
| 200 | 1.35(5) | ||
| 300 | 1.23(5) | ||
| 400 | 1.18(5) |
3.2 Capping layer quality
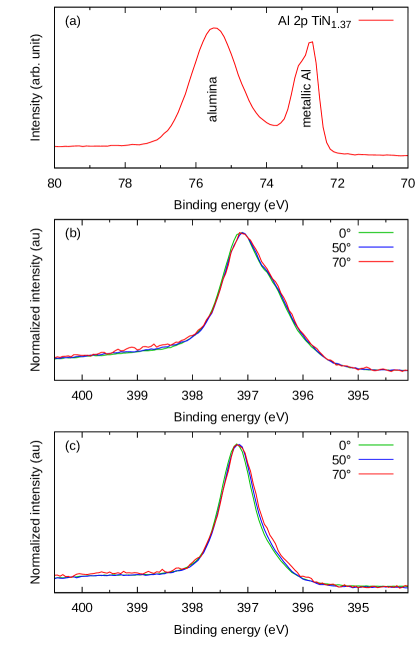
A crucial prerequisite before analyzing the measured XPS spectra is verifying the effectiveness of the deposited capping layer; otherwise, it is difficult to distinguish between the spectral features originating in the surface oxidized layer and in the unoxidized film underneath. An overlayer of TiO2 and/or TiOxNy is formed, when TiN oxidizes. Specifically, the TiOxNy surface component was shown to lie 1 eV below the TiN component in the N 1s spectra [8]. Therefore, a two-step workflow was developed to estimate the quality of the Al capping. The first requirement is that the capping layer is thick enough. This was evaluated from the XPS Al 2p spectra, where the contribution from the surface alumina and the remaining metallic Al below can be clearly distinguished. An optimal amount of Al as a compromise between the signal attenuation in the capping and the oxidation protection was determined to be when the alumina and metallic Al peak had approximately the same height, as can be seen in Figure 2 a).
The second important indicator of the Al capping quality is the evolution of the N 1s peak under different XPS measurement angles. In the case of an oxidation of a TiNx film, it is expected that there will be an O gradient and, therefore, also depth-dependence of the N 1s signal , which is very sensitive to the oxidation [8]. In other words, under the assumption that the film is homogeneous, the capping works perfectly, and effects at the capping/TiN interface can be neglected, it is be expected that all N 1s measurements at different angles and, hence, at different depths in the film result in an identical peak shape. This is shown in Figure 2b) and c) for the TiN1.37 and TiN1.18 films, respectively. The differences between the N 1s measurements at different angles are negligible and much smaller than the differences between the different films, which will be discussed later. In conclusion, the Al capping is effectively protecting all here-reportted TiN films from oxidation.
3.3 XPS measurements
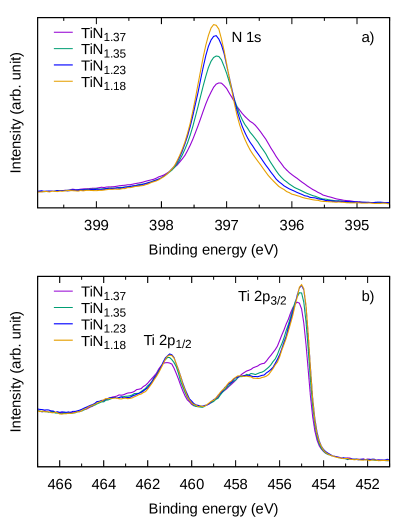
XPS measurements of the N 1s spectra of the deposited films are shown in Figure 3a). They exhibit the expected main TiN peak around 397.2 eV as well as weak satellite features at higher BEs [1]. Capped stoichiometric TiN films are expected to only show those two N 1s components [8]. However, with increasing off-stoichiometry, there is a significant shift in the spectral weight from the main TiN-like peak to lower BEs. This is consistent with what was previously reported for Ti vacancies in TiON [19], where this signal originates from N atoms with neighboring Ti vacancies.
Measured Ti 2p XPS spectra are plotted in Figure 3b). The spectra exhibit a structure consisting of four peaks, where the main peaks around 453 eV and 461 eV correspond to the main Ti 2p3/2 and Ti 2p1/2 peaks of TiN, respectively, and the weaker peaks around 458 and 464 eV are the satellites. Ti 2p BEs exhibit smaller changes with the increasing off-stoichiometry compared to the case of N 1s. There is virtually no difference between the TiN1.18 and TiN1.23 samples. As the off-stoichiometry is increased, the main peaks shift to slightly higher BEs and there is a small increase in spectra intensity between the main and satellite peaks.
Based on the XRD, ion beam analysis and XPS results as well as previously reported DFT calculations [39, 40, 27], the following, preliminary conclusions about the point defects present in the films can be drawn. There are three possible point defect-based explanations of N excess as measured by ion beam analysis: Ti vacancies, N interstitials, and N antisites. Ti vacancies have the lowest energy of formation of 3.2 eV [39, 40]. N interstitials have energy of formation of 4.6, 4.8 and 5.46 eV for the split (10)-aligned, split (111)-aligned, and tetrahedral interstitials [27], respectively. The least energetically favorable defect is the N antisite with formation energy of 12.6 eV [39]. Therefore, based on thermodynamic considerations, Ti vacancies are the most probable point defects facilitating the observed off-stoichiometry, due to their low energy of formation. There is also additional evidence in the presence of low BE components in the N 1s spectra. The shift of the XRD peaks to smaller angles (indicating increasing lattice parameter) for films deposited at lower temperatures with respect to the films deposited at higher temperatures and also to the powder TiN values, i.e., PDF Card No.: 00-038-1420, can be explained by N interstitials. However, since it was not possible to determine the equilibrium lattice parameter, it is possible that the XRD peak shifts are caused by differences in residual stress states of the films. Therefore, based just on the ion beam analysis and XRD data, the presence of N interstitials is likely but cannot be definitely proven.
In the next step, we evaluate this hypothesis, i.e., that the films contain Ti vacancies and N interstitials, based on ab initio calculations of the influence of specific point defects on both the lattice parameter and the binding energies of the surrounding atoms.
3.4 Ab initio modeling
3.4.1 Core electron binding energies
In the following, we will exclusively discuss the BEs of N 1s and Ti 2p3/2 electrons. The point defect visualizations, BE histograms and broadened BEs, as well as the mean BE shifts are summarized in Figure 4 for all the here studied point defects. Only atoms with significant core electron BE shifts ( eV) are marked in the figures. We will now discuss how these findings could be relevant for the experimental analysis of point defects in TiN by XPS.
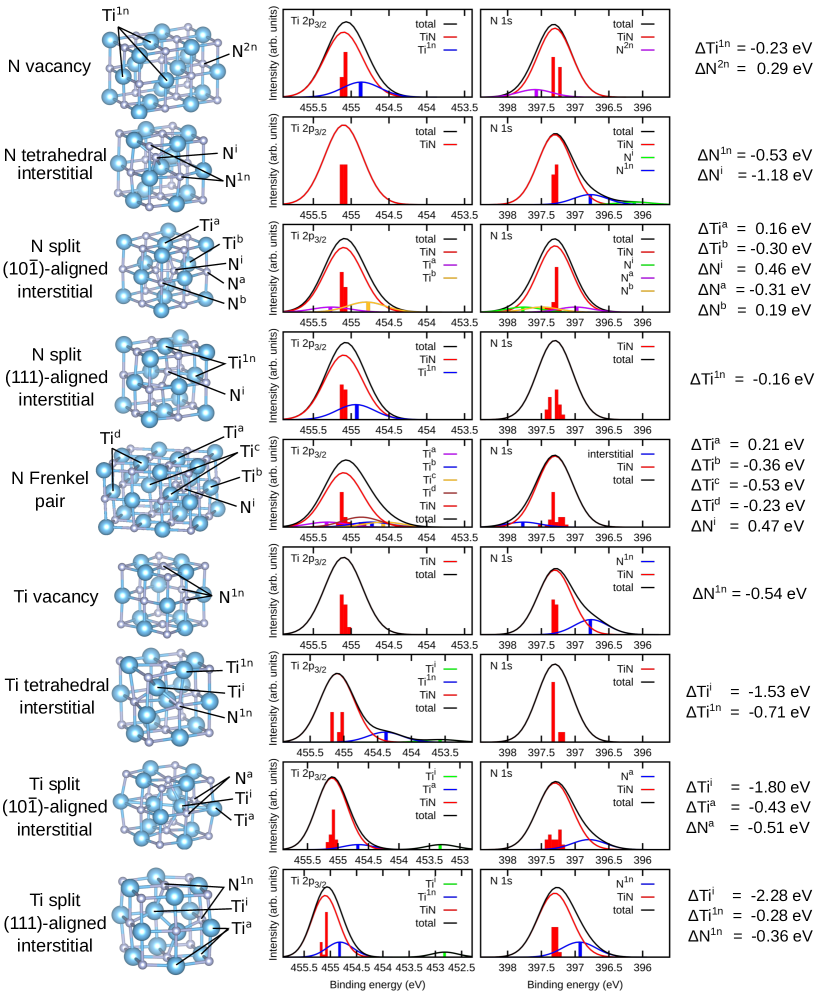
N vacancy (Figure 4, first row): The second nearest N2n neighbors of the vacancy see a slight increase in BEs by around 0.29 eV. This is consistent with previous ELNES calculations, where the influence of N vacancy was also reported to be strongest for the second nearest N neighbors [42]. Other N atoms do not show any significant changes. While the N vacancies introduce a positive shift in BEs of its six first Ti1n neighbors, the shift magnitude is only 0.23 eV, and, therefore, would be difficult to resolve experimentally. The N vacancies might be visible indirectly as an apparent shift of the main Ti 2p peak. The shift of BEs of the second nearest N vacancy N neighbors is larger with almost 0.3 eV. However, it overlaps the very broad N 1s satellite peak observed in experiments, which resides at higher energies [1, 8] (and is not possible to be modeled by our DFT approach), complicating fitting and introducing further potential uncertainty.
N tetrahedral interstitial (Figure 4, second row): The interstitial Ni atom has its BE reduced by 1.18 eV. BE a reduction of 0.53 eV was predicted for its first N1n neighbors. Both BE shifts of eV and eV are significant enough to be resolvable by XPS. No other N atoms are significantly affected and also no significant effect was predicted for any of the Ti atoms.
N split (10)-aligned interstitial (Figure 4, third row): The split interstitial N atoms have BE 0.46 eV higher than the rest of the atoms. The first Na neighbors in the direction of the N2 bond have reduced BE by 0.31 eV. The first Nb neighbors perpendicular to the N2 bond see an increase of BE by 0.19 eV. The rest of N atoms is less affected. The two Tia atoms directly above and below the N2 bond exhibit increase of BE by 0.16 eV, while the remaining four first Tib neighbors see decrease of BE by 0.3 eV. The BE shift of the interstitial N atom of 0.46 eV is quite significant, however, the signal is weak as it originates only from two atoms per defect. Potential characterization would be further complicated by an overlap with the satellite peak, which is also situated at higher BE and, therefore, it is unlikely that this type of interstitials can be unambiguously resolved by fitting extra spectral components.
N split (111)-aligned interstitial (Figure 4, fourth row): There is no N atom with a significant BE shift and the shift of the Ti first neighbors is only eV. Therefore, this type of N interstitial is expected to only lead to small peak broadening and, thus, is deemed to be undetectable by XPS.
N Frenkel pair (Figure 4, fifth row): The calculated Frankel pair defect consists of the N split (10)-aligned interstitial and a close N vacancy in the direction perpendicular to the N–N bond. The calculated BE shifts are very close to what would be expected from just adding together the effects of the before-calculated N vacancy and N split (10)-aligned interstitial. The two interstitial atoms Ni have their N 1s BE increased by 0.47 eV (as compared to 0.46 eV for the separate interstitial). The first Tia and Tib neighbors of the interstitial exhibit Ti shifts of 0.21 eV and eV, respectively, which is similar to the influence of the interstitial alone. A similar effect is seen for the first Tid neighbors of the vacancy, where a BE decrease of 0.23 eV is predicted (identical to the effect of the vacancy alone). Two Tic atoms, which are both first neighbors of the vacancy and interstitial, exhibit a BE shift of eV. In this case, the shift is the exact sum of the effects calculated for N vacancy eV and N interstitial eV.
Ti vacancy (Figure 4, sixth row): N1n atoms directly next to the Ti vacancy have reduced BEs by 0.54 eV with respect to the rest of the N atoms and the signal is strong as a single vacancy influences 6 N atoms. This is consistent with the findings in Ref. [19], where it was additionally published that the BE shift is approximately additive with respect to the number of vacancies and that the effect can be used for Ti vacancy quantification using the XPS. The BEs of the Ti atoms are mostly unaffected, only showing minimal fluctuations in the range of 0.1 eV.
Ti tetrahedral interstitial (Figure 4, seventh row): This Ti interstitial induces minimal changes in the N 1s BEs in surrounding N atoms. However, the interstitial Tii atom itself has BE reduced by 1.53 eV and its first 4 Ti1n neighbors see a BE reduction of 0.71 eV.
Ti split (10)-aligned interstitial (Figure 4 eighth row): The only significantly influenced N atoms are the nearest Na neighbors in the (100) plane, while no other calculated N 1s binding energies stand out. The general distribution of the remaining BE energies from N atoms is quite broad. This is expected as the Ti introduces much larger overall displacements than the smaller N interstitials. The two Tii interstitial atoms show a decrease of binding energy by 1.80 eV, Tia atoms in the direction of the Ti–Ti interstitial pair bond have BEs reduced by 0.43 eV, and the rest of Ti atoms is unaffected.
Ti interstitial 111 (Figure 4, ninth row): The first 6 N1n neighbors of the Ti interstitial pair have their BEs reduced by 0.36 eV. Other N atoms see no significant change. Two Tii interstitial atoms exhibit a BE decrease of 2.28 eV and the Ti1n first neighbors exhibit a BE decrease of 0.28 eV.
Importantly, the predictions highlight that all the Ti interstitials exhibit a distinct signal in the Ti 2p spectra. Although they are very unlikely due to all having very high formation energy of more than eV [40], they are relevant, as there are no other overlapping signals at lower BEs with respect to the Ti 2p TiN signal. Therefore, even very small interstitial concentrations should be easily distinguishable. In general, the fitting of Ti 2p peak is a complicated matter. There is an overlap between the Ti 2p1/2 and Ti 2p3/2 peaks and the satellite peaks are much more pronounced than in the N 1s signal. The choice of background is much more crucial than for N 1s and also the choice of a proper asymmetric line shape plays an important role [8]. Therefore, we do not expect any other defect besides the Ti interstitials to be easily identifiable from the Ti 2p spectra.
Regarding the analysis of the N 1s spectra, we predict a possibility of detecting point defects, which induce a significant negative BE shift of the N 1s atoms, such as Ti vacancies or N tetrahedral interstitials as there is no overlapping peak at lower BEs (assuming the film can be protected from oxidation [8]). Nevertheless, it seems difficult to distinguish Ti vacancies and N tetrahedral interstitials from the XPS spectra. Selected Ti interstitials also induce negative BE shifts in the N 1s spectra, however, their presence would be much easier to confirm or disprove from the Ti 2p peak. Point defects inducing positive BE shifts of the N 1s core electrons, like N vacancies and N split (10)-aligned interstitials, are predicted to be much more difficult to detect due to overlap with the satellite peak located at higher BE with respect to the main TiN N 1s component.
3.4.2 Ab initio lattice parameters
| defect type | (Å) | (Å) |
|---|---|---|
| none | 4.239 | 0 |
| VN | 4.239 | |
| VTi | 4.230 | |
| I | 4.267 | 0.028 |
| I | 4.268 | 0.029 |
| I | 4.267 | 0.028 |
| FP | 4.267 | 0.028 |
| I | 4.296 | 0.057 |
| I | 4.294 | 0.055 |
| I | 4.296 | 0.057 |
It was already shown that the lattice parameter can be one of the factors signaling the presence of point defects [39]. Table 2 shows the predicted impact of the studied point defects on the lattice parameter, which corresponds to the concentration of one defect per 64 atoms (in the reference perfect lattice). In general, at the studied defect concentration, N vacancy has no significant effect on the lattice parameter, while Ti vacancy reduces the lattice parameter by 0.01 Å at the simulated vacancy concentration. N interstitial increases the lattice parameter by around 0.03 Å independent of the interstitial type. About twice the larger increase in lattice parameter of 0.06 Å is seen for Ti interstitial and again does not depend on its type. The N Frenkel pair influences the lattice parameter in a similar way to the N interstitial alone.
3.5 Ti vacancy quantification
Based on the DFT calculations, the observed changes in the N 1s spectra with increasing off-stoichiometry can be explained by Ti vacancies or N tetrahedral interstitials. Both explanations are also consistent with the ion beam analysis and XRD results discussed previously. Because the tetrahedral interstitials have a fingerprint that is indistinguishable from the fingerprint of the Ti vacancies, it is important to estimate how many interstitials are in the different states. The split N interstitials are more stable than the tetrahedral ones [27]. Nevertheless, as HPPMS deposition is a highly energetic process, creating tetrahedral interstitials cannot be ruled out.
However, results from our NEB calculations show, that the energy barrier for the transition of N interstitial from the tetrahedral position to the geometrically closest (111) aligned split interstitial is only 0.35 eV. The transition frequency can be calculated as
| (1) |
where is the attempt frequency, is the Boltzmann constant and is the temperature. Using the before-calculated activation energy together with a very crude estimate of the attempt frequency at 5 THz, based on the position of the first maximum in TiN phonon density of states [43], leads to transition frequency of 6.6 MHz at room temperature and 94 MHz at . We can thus conclude that there is unlikely to be a large population of tetrahedral N interstitials even at room temperature and, therefore, the vast majority of the N interstitials are supposed to be the split ones, which have no distinct signal in the XPS N 1s spectra and are predicted to only lead to peak broadening of the main N 1s component (or would overlap with the satellite). Therefore, for the following analyses, we can safely assume that all the N 1s XPS signal at the lower BE peaks comes from the Ti vacancies, and we can attempt to quantify the Ti vacancy concentration from the N 1s spectra.
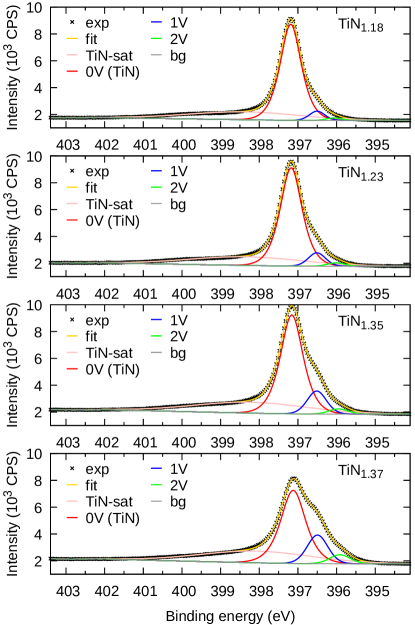
For the Ti vacancy quantification in TiNx, we use the method published previously for the analysis of Ti vacancies in TiON thin films [19]. An almost identical fitting procedure was used to fit the N 1s peak components, with the most notable difference is that there was no sign of the N2 peak, so it was not included during the fitting. Four peaks were used for the fits, corresponding to the main TiN component (Ti atoms with 6 N neighbors and 0 vacancies, denoted 0V), two components at lower BEs corresponding to Ti atoms with 1 and 2 vacancies (denoted 1V and 2V) in the first coordination shell and a satellite peak. We have used approximate Voigt (Gaussian/Lorentzian) peakshapes in a product form [44]
| (2) |
where is energy, is peak position, is peak broadening parameter (its value is close to full width at half the maximum intensity), and stands for fraction of the Lorentzian part in % of a peak . GL(70) lineshape was used for the main TiN-like (0V) peak, while GL(30) line shapes were utilized for the 1V and 2V peaks and GL(0) for the satellite peak. Peak intensities, positions, and broadening were free-fitting parameters, however, only a single shared broadening parameter was fitted for the 1V and 2V peaks to reduce fit ambiguity. A Tougaard-like background shape was utilized during the fitting. The fits of the N 1s regions of all samples are shown in Figure 5, while the fit parameters are summarized in Table 3.5. Using this four-peak model, it was possible to achieve near-perfect fits for all the studied samples. Additionally, the fit parameters are very stable between the fits and the fitted peak positions are in good agreement with the predicted shifts. Specifically, the positions of the three main peaks are in the range of 397.12–397.19 eV, 396.49–396.52 eV, and 396.91–396.07 eV for the 0V, 1V, and 2V components, respectively. This is in excellent agreement with the here calculated value of eV for the shift between 0V and 1V peak as well as the predicted and experimentally observed shifts between corresponding components in TiON [19].
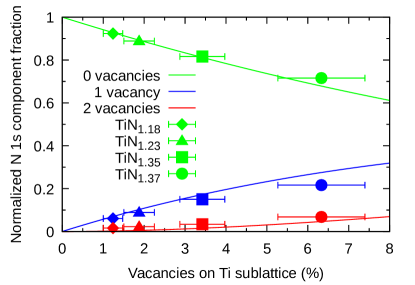
The fitting was followed by a simplified version of the analysis of the relative peak ratios from [19], enabled by the fact that there is no oxidation of the TiN layer due to the Al capping, and, therefore, no need for corrections compensating the TiN oxidation. Vacancy concentration can be directly quantified from the three N 1s main components (0V, 1V, 2V) ratios. Assuming a cubic TiN monocrystal, i.e., neglecting the grain boundaries, with random vacancy distribution, the probability of finding an N atom with Ti first neighbors, or equivalently with neighboring Ti vacancies, is [19]
| (3) |
where is the vacancy concentration on the metal sublattice.
During the vacancy quantification, we search for a which minimizes the squared differences between the experimental (fitted) components and the theoretical ones, where both the experimental and theoretical functions were previously renormalized to sum to 1. Only the first three components are considered, i.e., corresponding to the N atoms with 0, 1, and 2 Ti vacancies in the first coordination shell. The normalization is needed for the experimental components, as opposed to using directly the fractions from Table 3.5, since the fit also includes the satellite peak. For the theoretical probabilities, the normalization is equivalent to neglecting the components corresponding to the N atoms with more than two vacancies in the first coordination shell. There is no experimental evidence for a corresponding signal in our data and the probability of finding such configuration at small is very low; therefore, this is a reasonable simplification. This is consistent with what we have done previously in Ref. [19], however, the approach here is simplified due to the capping and thus, no need arises to add extra parameters to compensate for the additional oxidation.
| sample | (eV) | (eV) | |
|---|---|---|---|
| TiN1.26 | 0.485(4) | 397.123(2) | 0.785(4) |
| TiN1.22 | 0.577(3) | 397.159(1) | 0.714(2) |
| TiN1.15 | 0.645(3) | 397.1754(8) | 0.686(2) |
| TiN1.09 | 0.672(3) | 397.1867(7) | 0.665(2) |
| sample | (eV) | (eV) | |
| TiN1.26 | 0.147(3) | 396.495(4) | 0.65(1) |
| TiN1.22 | 0.106(2) | 396.513(4) | 0.6(1) |
| TiN1.15 | 0.064(2) | 396.51(5) | 0.54(1) |
| TiN1.09 | 0.044(2) | 396.504(7) | 0.48(2) |
| sample | (eV) | (eV) | |
| TiN1.26 | 0.046(1) | 395.916(8) | 0.65(1) |
| TiN1.22 | 0.0237(9) | 395.95(1) | 0.6(1) |
| TiN1.15 | 0.016(1) | 396.01(2) | 0.54(1) |
| TiN1.09 | 0.012(1) | 396.07(2) | 0.48(2) |
| sample | (eV) | (eV) | |
| TiN1.26 | 0.322(3) | 398.07(2) | 3.42(3) |
| TiN1.22 | 0.293(3) | 398.22(2) | 3.46(3) |
| TiN1.15 | 0.274(3) | 398.34(2) | 3.48(4) |
| TiN1.09 | 0.272(3) | 398.38(2) | 3.46(4) |
The theoretical are shown in Figure 6 together with the fitted ratios for the four here studied samples. The axis positions of the experimental points correspond to the fitted using the aforementioned procedure and is thus the determined Ti vacancy concentration on the metal sublattice.
We note that the N 1s fits and thus also the results are sensitive to the peak shapes used during the fitting. The specific combination of the used lineshapes described above was selected since it leads to fits with the lowest residual mean square errors. Furthermore, the notion of using different peak shapes for the main TiN-like 0V peak is based already on previous work [8] where this peak was also fitted with a more Lorentzian peak shape. However, it is not immediately clear why a different lineshape should be needed for the main TiN-like component and 1V and 2V components. One possible explanation for the need for a different lineshape for the TiN component is the presence of interstitials. We have previously discussed that the presence of split N interstitials is likely and they would overlap with the main 0V peak and could contribute to a different broadening character. To estimate the uncertainty related to the used peak shapes we have also run several different fits, e.g., with GL(30) or GL(70) for all three main peaks and several other variants (GL(30) also for the satellite peak, GL(90) for the TiN-like peak, etc.). The average difference between the resulting values of different fits is 0.0025, with the maximum value difference between different fits was less than 0.01. Thus, this uncertainty due to peak shape selection is smaller than the uncertainty from the fit which is shown in Figure 6. Another possible source of uncertainty, the background shape choice (e.g., linear, Shirley, Tougaard) does not significantly influence the results due to a minimal increase of the background over the N 1s peak and thus its influence on the results is negligible.
4 Conclusions
We have shown that several point defects in TiN induce N 1s and Ti 2p core electron binding energy shifts in nearby N and Ti atoms, with a magnitude large enough to be detectable experimentally. The here presented calculations predict that significant N 1s BE shifts are associated with N tetrahedral interstitials and Ti vacancies. However, the population of tetrahedral N interstitials in TiN is negligible even at room temperature, as the tetrahedral interstitials quickly transform to the lower energy split interstitials. Therefore, the Ti vacancies can be unambiguously detected in the N 1s XPS spectra and the recently published XPS Ti vacancy quantification method for Ti1-δOxN1-x thin films can be adapted also for TiN films. This was successfully experimentally verified by XPS measurements of Ti-deficient TiN thin films where we were able to quantify the Ti vacancy concentration. Furthermore, the largest predicted BE shifts are associated with Ti interstitials, hence, it should be possible to detect the presence and the type of Ti interstitials in TiN by XPS. However, no evidence of Ti interstitials was detected in the deposited thin films. Our results highlight that the XPS-based point defect characterization methods are meaningful for the detection and quantification of point defects in TiN.
CRediT authorship contribution statement
Pavel Ondračka: Conceptualization, Formal analysis, Investigation, Methodology, Writing - original draft, review & editing, Visualization. Pauline Kümmerl: Investigation, Writing - original draft, review & editing, Marcus Hans: Investigation, Formal analysis, Writing - review & editing. Stanislav Mráz: Investigation, Writing - review & editing. Daniel Primetzhofer: Investigation, Formal analysis, Writing - review & editing. David Holec: Conceptualization, Investigation, Supervision, Writing - review & editing. Petr Vašina: Supervision, Writing - review & editing, Funding acquisition. Jochen M. Schneider: Conceptualization, Supervision, Project administration, Writing - review & editing, Funding acquisition.
Acknowledgments
This research was funded by German Research Foundation (DFG, SFB-TR 87/3) ”Pulsed high power plasmas for the synthesis of nanostructured functional layer”. This work was supported by the Ministry of Education, Youth and Sports of the Czech Republic through the e-INFRA CZ (ID:90254) and project LM2023039. The authors also gratefully acknowledge the computing time granted by the JARA Vergabegremium and provided on the JARA Partition part of the supercomputer CLAIX at RWTH Aachen University (project JARA0151). The NEB calculations have been achieved using the Vienna Scientific Cluster (VSC). Accelerator operation at Uppsala University has been supported by the Swedish research council VR-RFI (#2019_00191).
References
- [1] R. T. Haasch, T. Y. Lee, D. Gall, J. E. Greene, I. Petrov, Epitaxial TiN(001) Grown and Analyzed In situ by XPS and UPS. I. Analysis of As-deposited Layers, Surface Science Spectra 7 (3) (2000) 193–203. doi:10.1116/1.1365617.
- [2] C. Walker, S. Morton, N. Brown, J. Matthew, High-resolution AlK and high-photon energy CrK-excited X-ray photoelectron spectroscopy of titanium nitride, Journal of Electron Spectroscopy and Related Phenomena 95 (2-3) (1998) 211–223. doi:10.1016/S0368-2048(98)00211-4.
- [3] R. T. Haasch, T. Y. Lee, D. Gall, J. E. Greene, I. Petrov, Epitaxial TiN(001) Grown and Analyzed In situ by XPS and UPS. II. Analysis of Ar + Sputter Etched Layers, Surface Science Spectra 7 (3) (2000) 204–212. doi:10.1116/1.1367596.
- [4] D. Jaeger, J. Patscheider, Single Crystalline Oxygen-free Titanium Nitride by XPS, Surface Science Spectra 20 (1) (2013) 1–8. doi:10.1116/11.20121107.
- [5] I. Milošev, H. H. Strehblow, B. Navinšek, XPS in the study of high-temperature oxidation of CrN and TiN hard coatings, Surface and Coatings Technology 74-75 (PART 2) (1995) 897–902. doi:10.1016/0257-8972(95)08360-X.
- [6] M. Kuznetsov, J. Zhuravlev, V. Gubanov, XPS analysis of adsorption of oxygen molecules on the surface of Ti and TiNx films in vacuum, Journal of Electron Spectroscopy and Related Phenomena 58 (3) (1992) 169–176. doi:10.1016/0368-2048(92)80016-2.
- [7] G. Greczynski, S. Mráz, L. Hultman, J. M. Schneider, Venting temperature determines surface chemistry of magnetron sputtered TiN films, Applied Physics Letters 108 (4) (2016). doi:10.1063/1.4940974.
- [8] G. Greczynski, L. Hultman, Self-consistent modelling of X-ray photoelectron spectra from air-exposed polycrystalline TiN thin films, Applied Surface Science 387 (2016) 294–300. doi:10.1016/j.apsusc.2016.06.012.
- [9] G. C. Smith, A. B. Hopwood, K. J. Titchener, Electron inelastic mean free path for Ti, TiC, TiN and TiO2 as determined by quantitative reflection electron energy-loss spectroscopy, Surface and Interface Analysis 33 (3) (2002) 230–237. doi:10.1002/sia.1205.
- [10] M. Delfino, J. A. Fair, D. Hodul, X‐ray photoemission spectra of reactively sputtered TiN, Journal of Applied Physics 71 (12) (1992) 6079–6085. doi:10.1063/1.350465.
- [11] D. Jaeger, J. Patscheider, A complete and self-consistent evaluation of XPS spectra of TiN, Journal of Electron Spectroscopy and Related Phenomena 185 (11) (2012) 523–534. doi:10.1016/j.elspec.2012.10.011.
- [12] G. Greczynski, I. Petrov, J. E. Greene, L. Hultman, Al capping layers for nondestructive x-ray photoelectron spectroscopy analyses of transition-metal nitride thin films, Journal of Vacuum Science & Technology A: Vacuum, Surfaces, and Films 33 (5) (2015) 05E101. doi:10.1116/1.4916239.
- [13] G. Greczynski, D. Primetzhofer, J. Lu, L. Hultman, Core-level spectra and binding energies of transition metal nitrides by non-destructive x-ray photoelectron spectroscopy through capping layers, Applied Surface Science 396 (2017) 347–358. doi:10.1016/j.apsusc.2016.10.152.
- [14] T. Ozaki, C.-C. Lee, Absolute Binding Energies of Core Levels in Solids from First Principles, Physical Review Letters 118 (2) (2017) 026401. doi:10.1103/PhysRevLett.118.026401.
- [15] A. Aarva, V. L. Deringer, S. Sainio, T. Laurila, M. A. Caro, Understanding X-ray Spectroscopy of Carbonaceous Materials by Combining Experiments, Density Functional Theory, and Machine Learning. Part I: Fingerprint Spectra, Chemistry of Materials 31 (22) (2019) 9243–9255. doi:10.1021/acs.chemmater.9b02049.
- [16] J. M. Kahk, J. Lischner, Predicting core electron binding energies in elements of the first transition series using the -self-consistent-field method, Faraday Discussions 236 (2022) 364–373. doi:10.1039/d1fd00103e.
- [17] A. Panepinto, D. Cornil, P. Guttmann, C. Bittencourt, J. Cornil, R. Snyders, Fine Control of the Chemistry of Nitrogen Doping in TiO2 : A Joint Experimental and Theoretical Study, The Journal of Physical Chemistry C 124 (31) (2020) 17401–17412. doi:10.1021/acs.jpcc.0c05003.
- [18] P. Ondračka, D. Nečas, M. Carette, S. Elisabeth, D. Holec, A. Granier, A. Goullet, L. Zajíčková, M. Richard-Plouet, Unravelling local environments in mixed TiO2–SiO2 thin films by XPS and ab initio calculations, Applied Surface Science 510 (2020) 145056. doi:10.1016/j.apsusc.2019.145056.
- [19] P. Ondračka, M. Hans, D. M. Holzapfel, D. Primetzhofer, D. Holec, J. M. Schneider, Ab initio-guided X-ray photoelectron spectroscopy quantification of Ti vacancies in Ti1-δN1-xOx, Acta Materialia 230 (7) (2022) 117778. doi:10.1016/j.actamat.2022.117778.
- [20] P. Ström, D. Primetzhofer, Ion beam tools for nondestructive in-situ and in-operando composition analysis and modification of materials at the Tandem Laboratory in Uppsala, Journal of Instrumentation 17 (04) (2022) P04011. doi:10.1088/1748-0221/17/04/p04011.
- [21] Y. Zhang, H. J. Whitlow, T. Winzell, I. F. Bubb, T. Sajavaara, K. Arstila, J. Keinonen, Detection efficiency of time-of-flight energy elastic recoil detection analysis systems, Nuclear Instruments and Methods in Physics Research Section B: Beam Interactions with Materials and Atoms 149 (4) (1999) 477–489. doi:10.1016/s0168-583x(98)00963-x.
- [22] P. Ström, P. Petersson, M. Rubel, G. Possnert, A combined segmented anode gas ionization chamber and time-of-flight detector for heavy ion elastic recoil detection analysis, Review of Scientific Instruments 87 (10) (2016). doi:10.1063/1.4963709.
- [23] M. S. Janson, CONTES instruction manual, Internal Report, Uppsala University (2004).
- [24] M. to Baben, M. Hans, D. Primetzhofer, S. Evertz, H. Ruess, J. M. Schneider, Unprecedented thermal stability of inherently metastable titanium aluminum nitride by point defect engineering, Materials Research Letters 5 (3) (2016) 158–169. doi:10.1080/21663831.2016.1233914.
- [25] M. Moro, B. Bruckner, P. Grande, M. Tabacniks, P. Bauer, D. Primetzhofer, Stopping cross section of vanadium for H+ and He+ ions in a large energy interval deduced from backscattering spectra, Nuclear Instruments and Methods in Physics Research Section B: Beam Interactions with Materials and Atoms 424 (2018) 43–51. doi:10.1016/j.nimb.2018.03.032.
-
[26]
M. Mayer, SIMNRA, a simulation
program for the analysis of NRA, RBS and ERDA, in: AIP Conference
Proceedings, AIP, 1999, pp. 541–544.
doi:10.1063/1.59188.
URL http://dx.doi.org/10.1063/1.59188 - [27] L. Tsetseris, N. Kalfagiannis, S. Logothetidis, S. T. Pantelides, Structure and interaction of point defects in transition-metal nitrides, Physical Review B 76 (22) (2007) 224107. doi:10.1103/PhysRevB.76.224107.
- [28] D. G. Sangiovanni, B. Alling, P. Steneteg, L. Hultman, I. A. Abrikosov, Nitrogen vacancy, self-interstitial diffusion, and Frenkel-pair formation/dissociation in 1 TiN studied by ab initio and classical molecular dynamics with optimized potentials, Physical Review B 91 (5) (2015) 054301. doi:10.1103/PhysRevB.91.054301.
- [29] G. Kresse, J. Furthmüller, Efficiency of ab-initio total energy calculations for metals and semiconductors using a plane-wave basis set, Computational Materials Science 6 (1) (1996) 15–50. doi:10.1016/0927-0256(96)00008-0.
- [30] G. Kresse, J. Furthmüller, Efficient iterative schemes for ab initio total-energy calculations using a plane-wave basis set, Physical Review B 54 (16) (1996) 11169–11186. doi:10.1103/PhysRevB.54.11169.
- [31] P. Hohenberg, W. Kohn, Inhomogeneous Electron Gas, Physical Review 136 (3B) (1964) B864–B871. doi:10.1103/PhysRev.136.B864.
- [32] W. Kohn, L. J. Sham, Self-Consistent Equations Including Exchange and Correlation Effects, Physical Review 140 (4A) (1965) A1133–A1138. doi:10.1103/PhysRev.140.A1133.
- [33] G. Kresse, D. Joubert, From ultrasoft pseudopotentials to the projector augmented-wave method, Physical Review B 59 (3) (1999) 1758–1775. doi:10.1103/PhysRevB.59.1758.
- [34] H. Jónsson, G. Mills, K. W. Jacobsen, Nudged elastic band method for finding minimum energy paths of transitions, in: Classical and Quantum Dynamics in Condensed Phase Simulations, World Scientific Publishing, 1998, pp. 385–404. doi:10.1142/9789812839664\_0016.
- [35] P. Blaha, K. Schwarz, F. Tran, R. Laskowski, G. K. H. Madsen, L. D. Marks, WIEN2k: An APW+lo program for calculating the properties of solids, The Journal of Chemical Physics 152 (7) (2020) 074101. doi:10.1063/1.5143061.
- [36] J. P. Perdew, K. Burke, M. Ernzerhof, Generalized Gradient Approximation Made Simple, Physical Review Letters 77 (18) (1996) 3865–3868. doi:10.1103/PhysRevLett.77.3865.
- [37] M. Scheidgen, L. Himanen, A. N. Ladines, D. Sikter, M. Nakhaee, A. Fekete, T. Chang, A. Golparvar, J. A. Márquez, S. Brockhauser, S. Brückner, L. M. Ghiringhelli, F. Dietrich, D. Lehmberg, T. Denell, A. Albino, H. Näsström, S. Shabih, F. Dobener, M. Kühbach, R. Mozumder, J. F. Rudzinski, N. Daelman, J. M. Pizarro, M. Kuban, C. Salazar, P. Ondračka, H.-J. Bungartz, C. Draxl, Nomad: A distributed web-based platform for managing materials science research data, Journal of Open Source Software 8 (90) (2023) 5388. doi:10.21105/joss.05388.
-
[38]
Ondračka Pavel,
Nomad
dataset: Prediction and identification of point defect fingerprints in the
x-ray photoelectron spectra of tinx (2024).
doi:10.17172/NOMAD/2024.03.28-1.
URL https://nomad-lab.eu/prod/v1/gui/dataset/doi/10.17172/NOMAD/2024.03.28-1 - [39] Z. Zhang, A. Ghasemi, N. Koutná, Z. Xu, T. Grünstäudl, K. Song, D. Holec, Y. He, P. H. Mayrhofer, M. Bartosik, Correlating point defects with mechanical properties in nanocrystalline TiN thin films, Materials and Design 207 (2021) 109844. doi:10.1016/j.matdes.2021.109844.
- [40] K. Balasubramanian, S. V. Khare, D. Gall, Energetics of point defects in rocksalt structure transition metal nitrides: Thermodynamic reasons for deviations from stoichiometry, Acta Materialia 159 (2018) 77–88. doi:10.1016/j.actamat.2018.07.074.
- [41] K. Momma, F. Izumi, VESTA 3 for three-dimensional visualization of crystal, volumetric and morphology data, Journal of Applied Crystallography 44 (6) (2011) 1272–1276. doi:10.1107/S0021889811038970.
- [42] M. Tsujimoto, H. Kurata, T. Nemoto, S. Isoda, S. Terada, K. Kaji, Influence of nitrogen vacancies on the N K-ELNES spectrum of titanium nitride, Journal of Electron Spectroscopy and Related Phenomena 143 (2-3) (2005) 159–165. doi:10.1016/j.elspec.2004.04.006.
- [43] S. K. Gupta, S. D. Gupta, H. R. Soni, V. Mankad, P. K. Jha, First-principles studies of the superconductivity and vibrational properties of transition-metal nitrides TMN (TM = Ti, V, and Cr), Materials Chemistry and Physics 143 (2) (2014) 503–513. doi:10.1016/j.matchemphys.2013.08.046.
- [44] S. Evans, Curve synthesis and optimization procedures for x‐ray photoelectron spectroscopy, Surface and Interface Analysis 17 (2) (1991) 85–93. doi:10.1002/sia.740170204.