Compression and acceleration of ions by ultra-short ultra-intense azimuthally-polarized light
Abstract
An efficient plasma compression scheme by azimuthally-polarized (AP) light is proposed. An AP light possesses a donut-like intensity pattern, enabling it to compress and accelerate ions toward the optical axis across a wide range of parameters. When the light intensity reaches the relativistic regime of , and the plasma density is below the critical density, protons can be compressed and accelerated by the toroidal soliton formed by the light. The expansion process of the soliton can be well described by the snow-plow model. Three-dimensional (3D) particle-in-cell (PIC) simulations show that within the soliton regime, despite the ion density surpassing ten times of the critical density, their energy is relatively low for efficient neutron production. When the light intensity increases to , and the plasma density is tens of the critical density, deuterium ions can be compressed to thousands of the critical density and meanwhile accelerated to the MeV level by a tightly-focused AP light during the hole-boring (HB) process. This process is far more dramatic compared to the soliton regime, and can produce up to neutrons in a few light cycles. Moreover, in the subsequent beam-target stage, neutron yield is assessed to reach over . Finally, we present a comparison with the results by a radially-polarized (RP) light to examine the influence of light polarization.
I Introduction
Neutron sources have broad applications in material testing for fusion energy research Perkins et al. (2000), neutron resonance spectroscopy Higginson et al. (2010), radiation medicine Schardt et al. (2010), etc. With the development of laser technology, laser-driven neutron sources (LDNS) are attracting great attention due to its compactness, high transportability and ability for generating ultra-short neutron pulse Alejo et al. (2016); Yogo et al. (2023). One of the currently investigated mechanisms capable of producing neutrons is nuclear-fusion reactions, suitable to be driven by laser owing to their relatively modest ion energy requirements compared to spallation reactions Alejo et al. (2016). In the LDNS schemes by fusion reactions, ion acceleration is necessary for optimizing the neutron yields, since the reaction cross peaks for the center-of-mass energy on the order of keV to MeV, depending on the specific reaction involved Atzeni and Meyer-ter-Vehn (2004). There have been several LDNS schemes based on different ion acceleration mechanisms such as laser-cluster interactions by Coulomb explosion Ditmire et al. (1999), in-target reactions by HB mechanism Willingale et al. (2011); Toupin et al. (2001) and beam-target fusion by target normal sheath acceleration Willingale et al. (2011); Jiang et al. (2020); Yan et al. (2022).
In order to enhance nuclear reactions within a limited time interval, some LDNS schemes employ the ion compression at the same time of their acceleration, such as spherically convergent plasma fusion Zhuo et al. (2009); He et al. (2015); Ren et al. (2017), fusion enhanced by a double-cone configuration Hu et al. (2015), and the collapse of plasma shell with two ultra-intense laser pulses Xu et al. (2012). In these schemes, ions can be compressed to to times the plasma critical density while accelerated to MeV, aided by specific target configurations or multiple laser pulses. As the reaction rate of nuclear fusion is proportional to the square of the ion density Atzeni and Meyer-ter-Vehn (2004), it is possible to produce a significant number of neutrons in a very short period by compressing ions, which should be helpful for the generation of a short neutron pulse. Furthermore, the plasma compression via laser is a crucial concern for the exploit of inertial confinement fusion (ICF) energy. The current ion-compression schemes essentially possess structures similar to existing ICF schemes. There is a need for the exploration of novel plasma compression mechanisms, which can lead to the new LDNS schemes and also benefit the ICF research.
In this paper, we propose an efficient plasma compression mechanism, naturally achieved by the interaction an ultra-short ultra-intense AP light and uniform plasma, without the need for complex target configurations or multiple laser pulses. Recently, the focused laser intensity has surpassed Yoon et al. (2021), and the generation of few-cycle cylindrical vector (CV) light over has been achieved through pulse compression Kong et al. (2019) or the use of a optical converter Carbajo et al. (2014, 2016). It is important to explore the phenomena induced by CV light in the relativistic regime. Both AP and RP lights are CV-typed and share a cylindrically symmetric structure Zhan (2009); Forbes (2019). Their amplitude shape is the same as that of the Laguerre-Gaussian (LG) mode with the radial index and the azimuthal index , denoted as the mode Zhan (2009). Therefore, they typically exhibit a hollow intensity profile. When tightly focused, AP light generates a strong magnetic field along the optical axis on its focal point, whereas RP light gives a longitudinal electric field Quabis et al. (2000); Dorn et al. (2003). In the relativistic regime, an AP light is discovered to form a long-standing toroidal soliton when penetrating through an underdense plasma Cheng et al. (2023a). With a further increase in light intensity and plasma density, the HB process becomes to dominate the laser-plasma interaction Yu et al. (2016); Psikal and Matys (2018). We will show that ions can be compressed and accelerated to different levels by an AP light in these relativistic-soliton and HB regimes. It should be noted that the proposed plasma compression here does not work for a linearly- Esirkepov et al. (2002); Sarri et al. (2010); Toupin et al. (2001) or circularly- Li et al. (2021); Weng et al. (2012) polarized light with a simple Gaussian profile under the similar laser-plasma interaction condition.
The rest of the paper is organised as follows. In Sec. II, we present the compression phenomenon in the soliton regime by 3D PIC simulation. An analytic theory based on the snow-plow model is derived to describe the expansion of the toroidal soliton and plasma compression on its center. In Sec. III, we investigate the compression and acceleration of deuterium ions in the HB regime and estimate the neutron yields from the reaction \ceD + D -¿ ^3He + n. Additionally, a comparison with RP light is presented. Discussions and conclusions are given in Sec. IV.
II The soliton regime
II.1 PIC simulation setup
The PIC code used here is JPIC-3D Wu (2011); Cheng et al. (2023a, b), which adopts a field solver free of numerical dispersion along the , , axes. The AP light has an azimuthally-directed electric field in the cylindrical coordinates , and can be expressed as Zhan (2009)
| (1) |
where denotes the natural number, is the transverse radius, is the beam width, is the Gouy phase, is the wavefront radius, is the Rayleigh length, is the beam waist at the focal point and is the wave number. The temporal profile takes , where is the pulse duration. The electric field amplitude can be normalized as , where is the light angular frequency, is electron mass, is electron charge, and is light speed. Laser intensity is given by .
In the soliton regime, the laser pulse takes , which corresponds to for the wavelength . The laser has the spot size , and the duration , i.e. fs at . The laser pulse propagates from the left boundary at , and focuses on the plasma surface at . The plasma length is . The initial plasma density is , where is the plasma critical density, and is the vacuum permittivity. The ions are chosen as protons with the mass . The initial temperatures are eV for both electrons and ions.
The size of the simulation box is , and the spatial resolution is 30 cells per wavelength, with each cell containing 8 macro-particles. The time step is .
II.2 Compression and acceleration process of the plasma
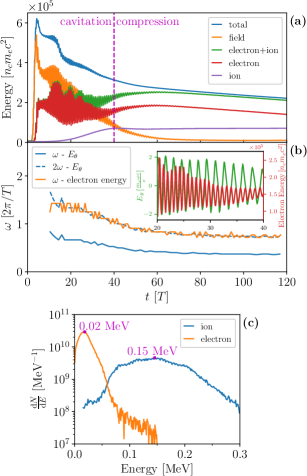
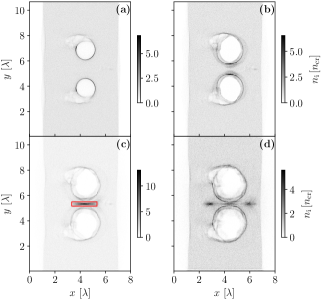
Fig. 1-(a) shows the energy evolution in the whole simulation box from to . The whole process consists of two stages: the cavitation stage before and the compression stage thereafter. At the cavitation stage, the AP light has been fully input after . The electrons are accelerated quickly with an increasing kinetic energy as they consume laser field energy. A fraction of light is reflected out of the simulation box, which leads to the first steep descent of the total energy. The second steep descent occurring at can be attributed to light transmission across the plasma out of the right boundary. Owing to the downshift in the light frequency below the background plasma frequency, a large part of light gets trapped in the plasma after . This trapped light then pushes electrons outward by the ponderomotive force, forming a subcycle toroidal soliton as first discussed in Ref. Cheng et al., 2023a. The decline of the total energy starts to exhibit a more gentle slope since the trapped soliton slowly radiates out its energy. On a timescale of the ion response time , the ions initiate movement and cavitation in response to the space-charge field, marking the onset of the soliton’s evolution into a postsoliton Naumova et al. (2001a); Esirkepov et al. (2002); Cheng et al. (2023a). At in Fig. 2-(a), the ion energy climbs up to a flatform, and here an ion toroidal cavity forms as wide as the electron one.
After , as the ions gradually catch up the electrons, the whole toroidal plasma cavity enters into the compression stage. The toroidal postsoliton resembles a bent two-dimensional s-polarized postsoliton Naumova et al. (2001a); Sánchez-Arriaga and Lefebvre (2011a, b). Therefore, ions on the inner side of the torus can be compressed and accelerated toward the torus center due to this distinct topological structure. Since the azimuthally-directed electric field is tangential to the boundary of the toroidal cavity, the ponderomotive force that the light exerts on the plasma is more stable with a weak field-particle energy exchange. As a result, the energy oscillation amplitude becomes small, and the subsequent compression is relatively moderate.
It should be noted that the ponderomotive force holds a crucial role in both the cavitation and compression stages. To see this, Fig. 1-(b) shows that the oscillation frequency of the azimuthal electric field is exactly twice that of the electron energy (the inset shows temporally). This frequency characteristic arises from the fact that the pondermotive force of this azimuthal soliton contains a second harmonic oscillation Weng et al. (2012) .
The later evolution of the compression stage is presented from Figs. 2-(b) to 2-(d). At , the particles on the inner side of the torus start to merge and penetrate with each other. At , they are compressed to a narrow density needle with a width of only around . The ion density reaches , ten times of the initial density. Fig. 1-(c) gives the energy spectra of the particles in the red rectangular zone in Fig. 2-(c). Fitted with the Maxwellian distribution, the ion spectrum reveals an effective ion temperature on the order of 0.1 MeV. This ion energy is relatively low for the efficient neutron production Atzeni and Meyer-ter-Vehn (2004). At , the ion density needle is further squeezed into two parts, travelling towards the opposite directions along the torus axis.
II.3 The snow-plow model
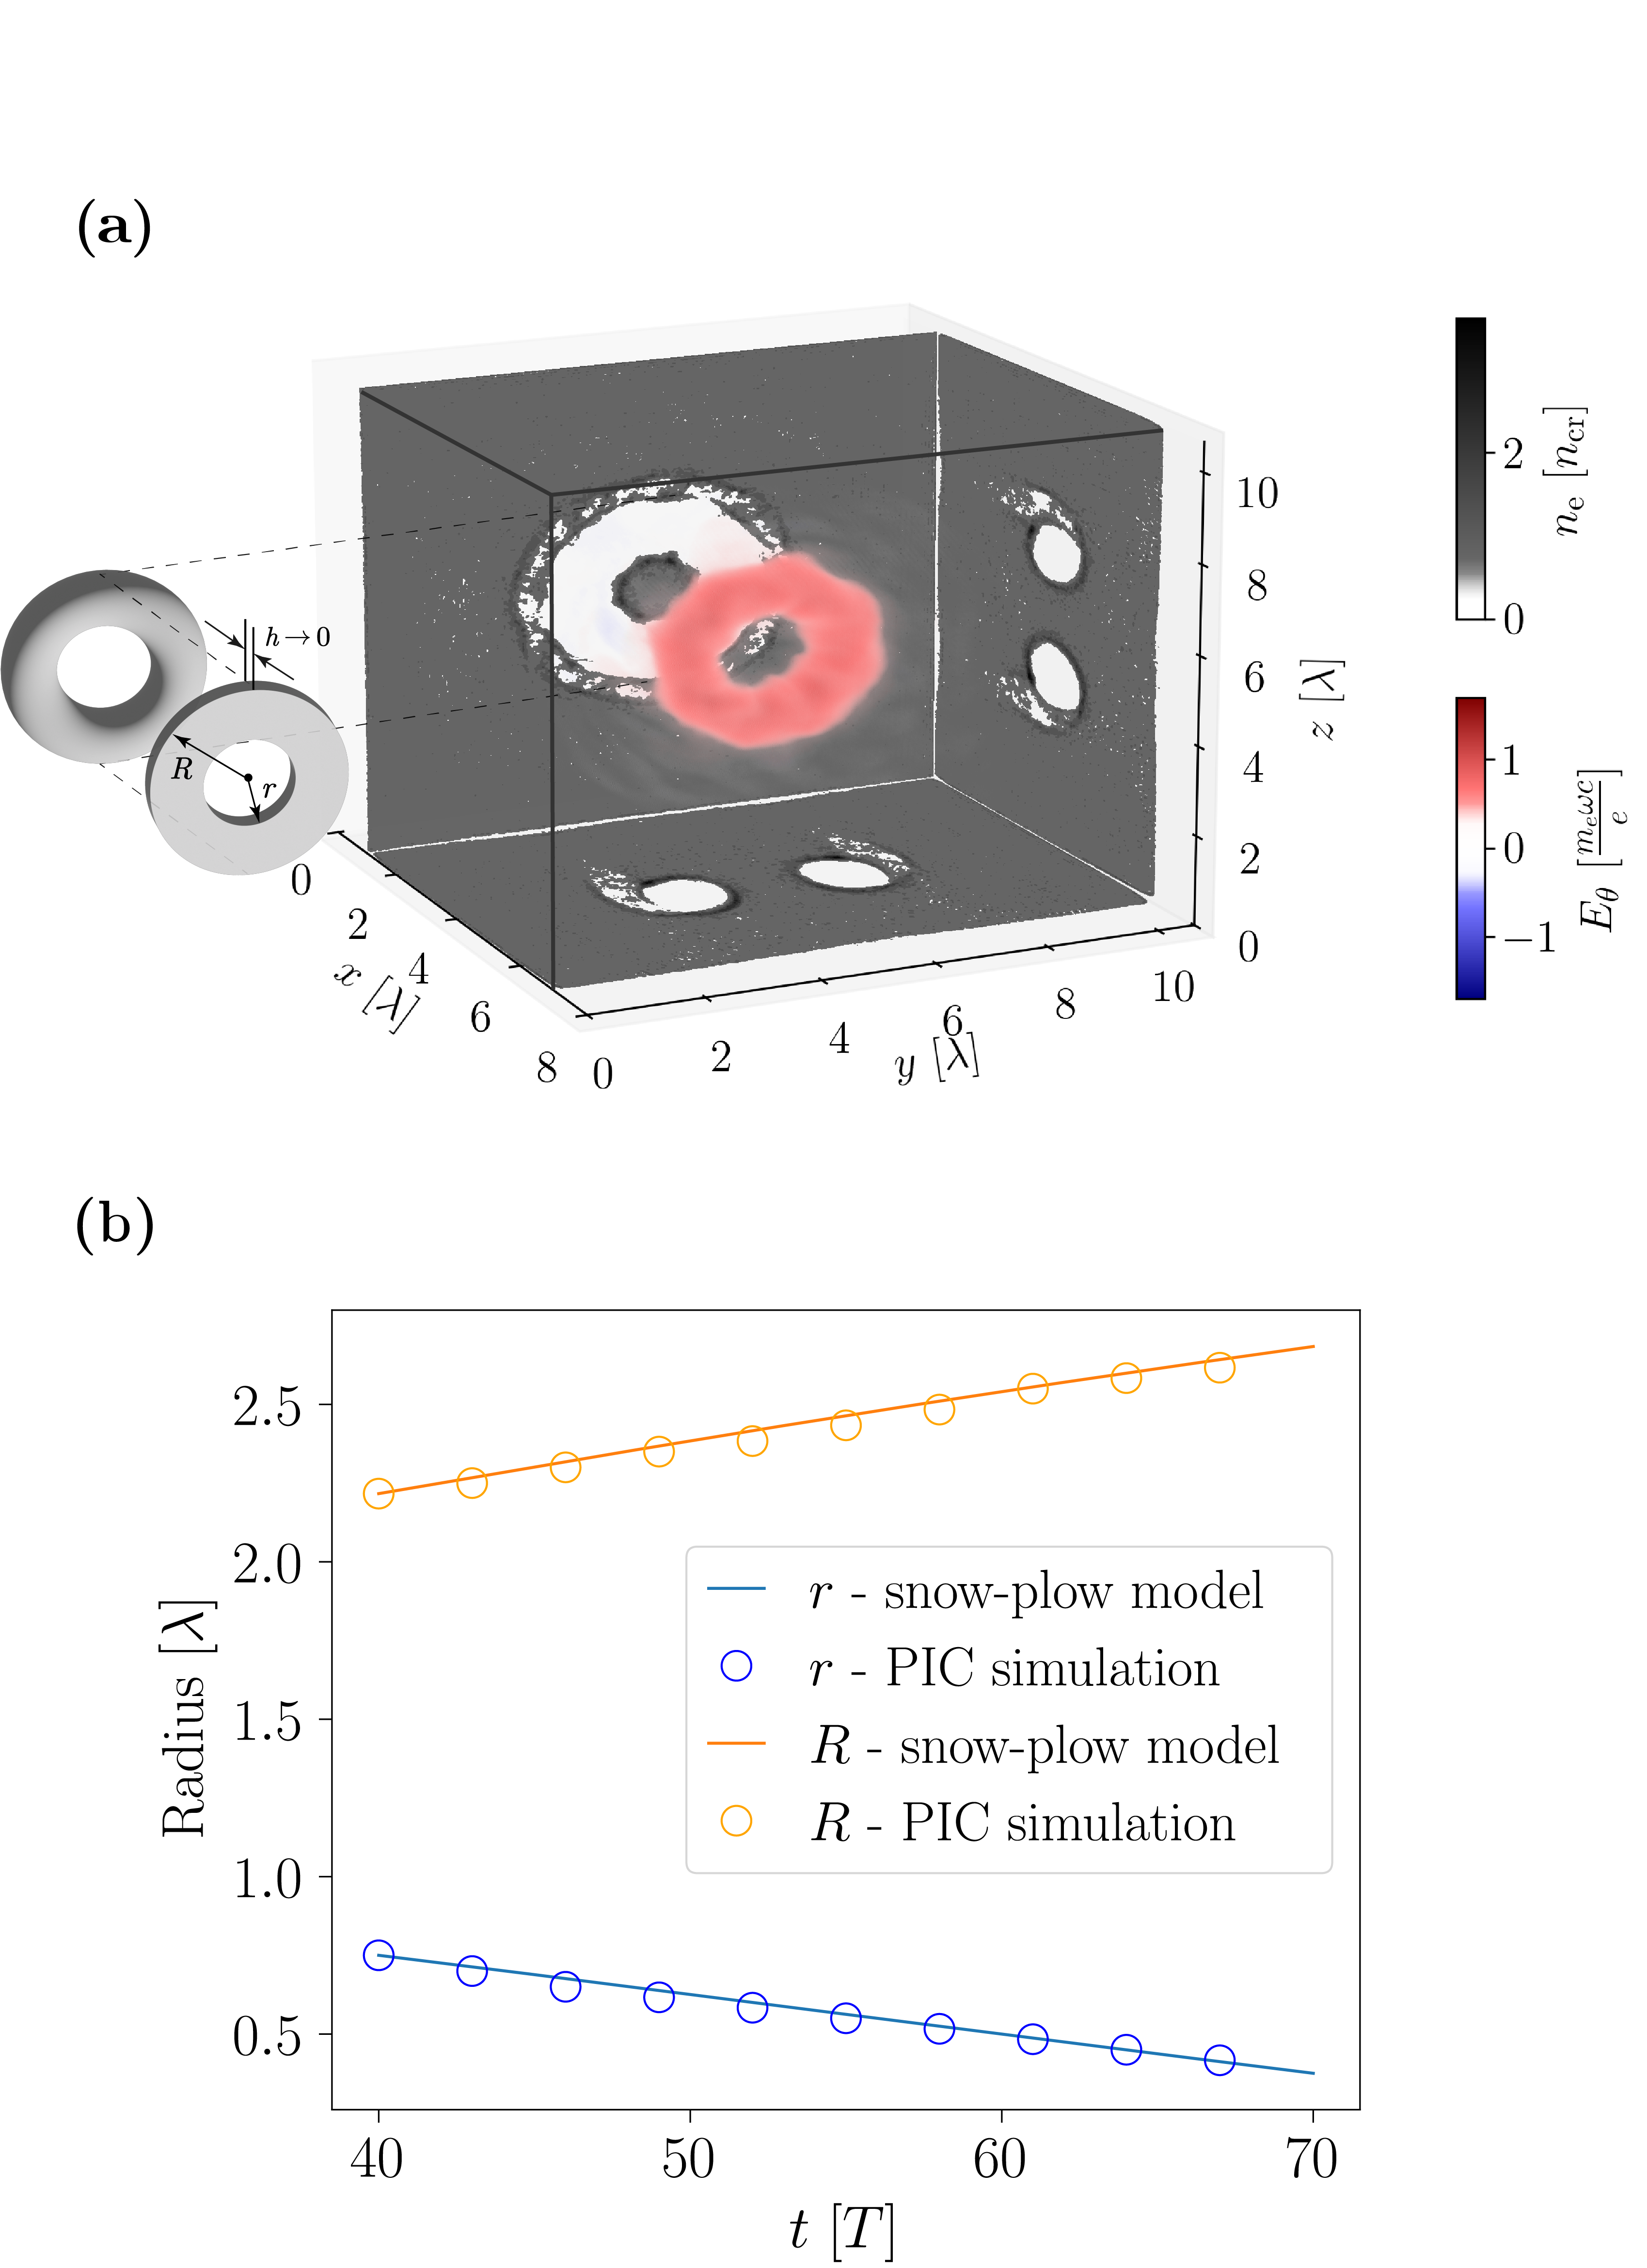
The snow-plow model has been used to study the long-term expansion of two-dimensional postsolitons formed by s-polarized lights in Refs. Naumova et al., 2001a; Sánchez-Arriaga and Lefebvre, 2011a, b. Here, we employ the snow-plow model to describe the expansion process of the toroidal cavity from to . First, as shown in Fig. 3-(a), we use a flat hollow cylinder with an infinitesimal thickness to approximately represent the enlargement of the annulus in the equatorial plane. Here is its inner radius and the outer radius. We use the subscripts “in” and “out” to distinguish the quantities on the inner or outer side of the torus. The snow-plow model assumes that all the particles pushed by the light pressure are inside an thin shell. Let be the ion surface number density in the cylinderical surface, and hence the plasma mass can be expressed as
| (2) |
while noting that the electron mass has been neglected. By the particle number conservation, we have
| (3) |
where the subscript “0” denotes the initial quantities at . Here we further assume that the cylinderical surface with radius of is the interface between the inner and outer sides of the hollow cylinder, and then the total number of the ions on the inner side can be calculated as
| (4) |
where the defined term for convenience is given as
| (5) |
here is the major radius of the torus. Substituting Eqs. (4) and (5) into Eq. (3), we obtain
| (6) |
Since only the initial conditions and the particle number conservation law are used here, one can see that the surface number density or plasma mass is simply independent of the dynamical process in the snow-plow model.
For the electric field, we can relate it to the cavity geometry by introducing the adiabatic invariant Naumova et al. (2001a); Landau and Lifshits (1984)
| (7) |
and by approximating the toroidal postsoliton as a resonant mode Cap and Deutsch (1978) . Thus these two equations give
| (8) |
Finally, the dynamical equations driven by the radiation pressure can be written as
| (9) |
where is the plasma mass. We then substitute Eqs. (2), (6) and (8) to Eqs. (9), and obtain the evolution equations of and as
| (10) |
These equations are solved numerically, and Fig. 3-(b) shows that the numerical solutions are in very good agreement with the PIC results.
III The hole-boring regime
III.1 Azimuthally-polarized light
In this section, we attempt to enhance the plasma compression efficiency for a potential LDNS by raising light intensity. We will explore the so-called hole-boring regime where AP light can directly compress and accelerate ions. The normalized light amplitude takes , which corresponds to . The laser focus spot is shrunk to , which can make the compression process faster and more efficient. When tightly focused to the wavelength scale, the AP light can generate a longitudinal magnetic field as strong as the transverse field Quabis et al. (2000); Dorn et al. (2003). This field is helpful to confine the compressed electrons on the optical axis. In JPIC-3D, the laser-boundary-condition algorithm Thiele et al. (2016) is adopted to produce an ideal focus field Cheng et al. (2023b). The light is input at the left boundary and the focal plane is located at . The plasma has the initial density . The ion mass is changed to to simulate a deuterium plasma. The size of the simulation box is . All the other parameters remain the same as the soliton regime.
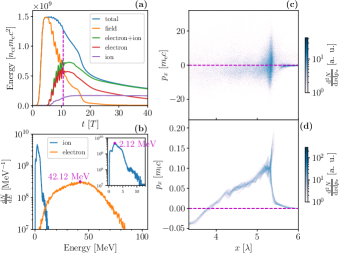
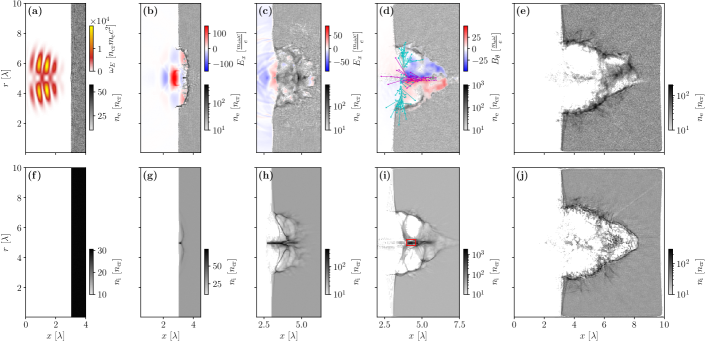
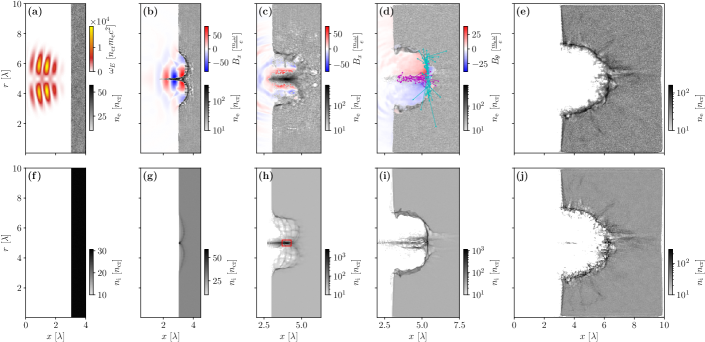
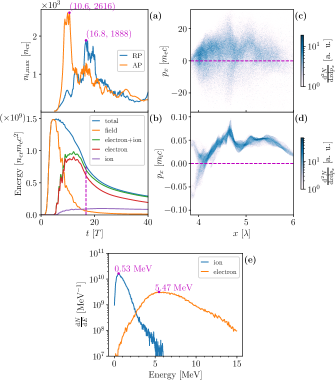
Fig. 4 illustrates the plasma compression process by the AP light. In Fig. 4-(a), the tightly-focused AP light exhibits a hollow intensity pattern, which punches out a ring-like dip on the plasma surface through the light pressure at , as shown in Fig. 4-(b) and 4-(g). The electrons on the optical axis are then squeezed backward and confined as a sharp needle due to the ponderomotive force and strong longitudinal magnetic field of the tightly-focused AP light. The ions lag behind, following the movement of the electrons due to their space-charge field. Fig. 5-(a) illustrates the energy evolution of the system from to . It can be observed that at , discernible oscillations in both field and electron energies manifest the role of the ponderomotive force.
At , it is shown in Fig. 4-(c) and 4-(h) that the ions undergo compression, forming a ring-like dip comparable in width to that of the electrons and achieving the ion peak density of on the optical axis. This ion compression is mainly attributed to the electro-static attraction exerted by the electrons compressed and confined on the optical axis. At this moment, as in Fig. 5-(a), the energy oscillation tends to diminish, indicating that the light will soon be completely reflected from the plasma region. Fig. 5-(b) presents the energy spectra of the particles within the red rectangular zone in Fig. 4-(h), revealing that the effective ion temperature reaches the order of 1 MeV, and electrons are MeV. The high density and energy of the ions are attained at the same time, providing a suitable environment for producing neutrons by nuclear reactions. From the neutron yield Atzeni and Meyer-ter-Vehn (2004) , where is the deuterium density, is the average reactivity of the deuterium-deuterium reaction, is the volume of the reaction region, and is the reaction time, the neutron yield is estimated to be around from to , spanning around 13 fs.
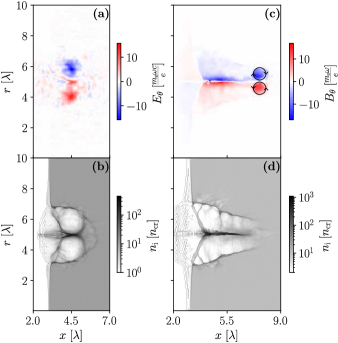
At in Figs. 4-(d) and 4-(i), both compressed ions and electrons are further accelerated forward along the direction and disperse slightly as the light departs, resulting in a decrease in the ion peak density to . The relatively high ion density is maintained by the strong azimuthal quasi-static magnetic field generated by the longitudinal current in the compressed plasma column. As presented in Figs. 5-(c) and 5-(d), the ions moving forward and a fraction of electrons moving backward that dominate this positive longitudinal current. The presence of the radial currents is also observed at the bottom of the dip in Fig. 4-(d). In Fig. 4-(i), the finger-like plasma channels are also discernible within the plasma due to the penetration of the light as a result of relativistically induced transparency Pukhov and Meyer-ter-Vehn (1997).
In final, the HB by the AP light leaves a U-shaped crater 3 in depth and 2.4 in diameter at in Figs. 4-(e) and 4-(j). A significant portion of piled-up and accelerated ions would penetrate and travel through the deuterium plasma, giving rise to a substantial neutron yield via the beam-target approach. The neutron yield by this approach can be estimated using the integral Yogo et al. (2023); Toupin et al. (2001); He et al. (2015)
| (11) |
where is the reaction section and is the stopping power of the deuterium ion in the deuterium plasma. In our case, the neutron yield resulting from the interaction of the injected deuterium ions and the deuterium plasma is approximately , much higher than the yield in the compression stage owing to a sufficient reaction time.
III.2 Radially-polarized light
AP light has been shown to be a robust natural mode for forming a long-standing toroidal soliton with a relatively moderate plasma compression, and the change in polarization can influence its geometry and stability Li et al. (2020). However, the HB regime discussed above seems to be mainly dominated by the light ponderomotive force, which is simply proportional to the gradient of intensity distribution Mourou et al. (2006). To check the potential polarization effects in the HB regime, a case using RP light is displayed in Fig. 6 and Fig. 7, with the other parameters fixed. The expression of a RP light can be derived directly from that of an AP light through the duality transformation April (2010) and . Thus, both lights share the same intensity pattern Dorn et al. (2003) as can be verified by comparing Fig. 4-(a) and Fig. 6-(a). Due to the alignment of the electric field and the magnetic field is exchanged for both-typed lights, a strong longitudinal electric field, rather than a magnetic field, appears when the RP light is tightly focused.
The polarization change has an impact on the compression and acceleration of ions. Fig. 7-(a) presents the temporal evolution of the maximum ion density near the optical axis for both polarization states. There are two observations can be made: firstly, the ion peak density achieved by the RP light is 28% lower than the AP case; secondly, the time at which the ion density reaches its peak for the RP light is delayed than that for the AP light. In fact, as shown in Fig. 7-(b), there is no oscillation in the field or electron energy at , which means that the light has been completely scattered away from the plasma region.
Fig. 6-(g) illustrates the ion motion just during the reflection of the RP light. As shown in Fig. 6-(b), the electrons on the optical axis are pushed into the plasma rather than squeezed out in Fig. 4-(b). As the light penetrates deeper, the electrons are pulled back by the reversed longitudinal electric field in the second subcycle. This push-pull action Zaïm et al. (2017) shakes the electrons longitudinally, along with radially-oscillating motion induced by the radial electric field in the interaction region. As a result, the electrons can not be stably confined on the optical axis, leading to a lower ion density.
When the light leaves off the plasma region at , as shown in Figs. 6-(d) and 6-(i), a negative longitudinal current is formed, generating a strong quasi-static azimuthal magnetic field. As seen in Figs. 7-(c) and 7-(d), the majority of electrons accelerated by its longitudinal electric field possess a positive longitudinal momentum, leading to this negative longitudinal current. This resulting azimuthal magnetic field pinches the electron current into a filament Naumova et al. (2001b), subsequently draws the ions toward the axis, analogous to the Z-pinch process Slutz et al. (2010); Hurricane et al. (2023). In addition, the radial current induced by the electrons moving from the radial boundary of the plasma to the optical axis can be found at the top of the dip, as shown in Figure 7-(d), resulting in the reversed azimuthal magnetic field at the top of the plasma dip.
The energy spectra of the particles within the red rectangular zone in Fig. 6-(i), when the ion density reaching its peak, is presented in Fig. 7-(e). The effective ion and electron temperature are only about 0.1 MeV and 1 MeV, respectively. Both are nearly one order of magnitude lower than that of the AP case. This is mainly because most energetic electrons accelerated by the push-pull mechanism Zaïm et al. (2017) have run out of the compression region as the light departs, and hence the energy transferred to ions is low, as discussed above.
The neutron yield by nuclear reaction from to is estimated to be , and the subsequent beam-target yield is estimated to be . Both are lower than the AP case. Nevertheless, owing to the strong longitudinal electric field of the RP light, the crater in Figs. 6-(e) and 6-(j) exhibits a width of 1.3 and a significantly greater depth of 5.5 when compared to that punched by the AP light.
IV Discussion and conclusion
In the HB regime, a wide parameter range is scanned by changing light intensity and initial density. We find that, to achieve the optimum ion compression with the highest density, a positive correlation remains between light intensity and plasma density. If the plasma is too dense or the light is too weak, AP light is not able to drill deep enough to compress ions. Conversely, if the plasma is too rarefied or the light is too strong, the number of the ions involved in the compression is not large enough compared to that the light could compress.
Interestingly, it is noteworthy that even within the HB regime, AP light can be trapped in the ring-like plasma dip for several light cycles, behaving like a short-term soliton, as shown in Figs. 8-(a) and 8-(b). This case takes a relatively low light amplitude for a plasma density . The case using RP light is also shown in Figs. 8-(b) and 8-(d). The deuterium peak densities reach and for AP and RP lights, respectively. Additionally, Fig. 8-(c) illustrates that vortex electric currents can be generated, giving rise to a robust quasi-static azimuthal magnetic field, similar to that observed by using a Gaussian-shape light Yue et al. (2021). The RP light in this case can finally penetrate through the plasma, and release its energy at the plasma-vacuum interface, which has the potential to accelerate and collimate ions as discussed in Refs. Bulanov and Esirkepov, 2007; Nakamura et al., 2010; Helle et al., 2016.
In terms of the polarization effect, we primarily focus on these two CV lights, as they have a cylindrically symmetric structure, ensuring a more uniform and stable compression and acceleration of ions and facilitating the analysis in both theory and simulation. On the other hand, light of linear or circular polarization has also demonstrated the potential to form a toroidal ion cavity in plasma Wilson et al. (2019, 2023) or compress ions toward the optical axis Wang et al. (2015). However, to the best of our knowledge, there has been no detailed discussion on the ion compression effect by ultrashort lights of these polarizations in the soliton or HB regime. Since these polarization states can be considered as a linear superposition of azimuthal and radial components in the cylindrical polarization bases Ossikovski (2016); Zhan (2006), our investigation on these two fundamental CV lights can serve as a foundation for further research concerned with polarization or other degrees of freedom in light, such as angular momentum Zhan (2006).
In conclusion, our 3D PIC simulations show that the ion compression and acceleration can be realized efficiently by an AP light across a wide range of parameters. In the soliton regime, an AP light with the intensity of can from a toroidal soliton and compress ions from to , over ten times of the initial density. However, the ion energy is only on the 0.1 MeV level, not efficient for the neutron production. Based on the snow-plow model and some approximations, an analytic theory is derived to demonstrate the expansion of the toroidal cavity. In the HB regime, an AP light with the intensity level of is adopted to drill into a deuterium plasma with initial density of . The peak deuterium ion density can surpass , nearly one hundred times the initial density, and the ion energy can attain the MeV level. This efficient compression and acceleration of ions are appropriate for nuclear fusions. Here we consider the deuterium-deuterium reaction to estimate the neutron yields in different stages. In the compression stage, the neutron yield is in 13 fs. The compressed ions can subsequently trigger nuclear fusions by the beam-target reactions as they penetrate through the deuterium plasma. In this stage, the neutron yield is around , much higher than the yield in the compression stage due to a sufficient reaction time. To highlight the light polarization effect, ion compression by RP light is also examined. The dominant compression process by RP light resembles a Z pinch.
Acknowledgements.
D.-C. Deng would like to thank Dr. Y. Zhang and Dr. J.-L. Jiao for helpful discussions. This work was supported by the Strategic Priority Research Program of Chinese Academy of Sciences (Grant No.XDA17040502).References
- Perkins et al. (2000) L. J. Perkins, B. G. Logan, M. D. Rosen, M. D. Perry, T. D. de la Rubia, N. M. Ghoniem, T. Ditmire, P. T. Springer, and S. C. Wilks, Nuclear Fusion 40, 1 (2000).
- Higginson et al. (2010) D. P. Higginson, J. M. McNaney, D. C. Swift, T. Bartal, D. S. Hey, R. Kodama, S. Le Pape, A. Mackinnon, D. Mariscal, H. Nakamura, N. Nakanii, K. A. Tanaka, and F. N. Beg, Physics of Plasmas 17, 100701 (2010).
- Schardt et al. (2010) D. Schardt, T. Elsässer, and D. Schulz-Ertner, Reviews of Modern Physics 82, 383 (2010).
- Alejo et al. (2016) A. Alejo, H. Ahmed, A. Green, S. R. Mirfayzi, M. Borghesi, and S. Kar, Il Nuovo Cimento C 38C, 1 (2016).
- Yogo et al. (2023) A. Yogo, Y. Arikawa, Y. Abe, S. R. Mirfayzi, T. Hayakawa, K. Mima, and R. Kodama, The European Physical Journal A 59, 191 (2023).
- Atzeni and Meyer-ter-Vehn (2004) S. Atzeni and J. Meyer-ter-Vehn, The Physics of Inertial Fusion: Beam Plasma Interaction, Hydrodynamics, Hot Dense Matter, Oxford Science Publications No. 125 (Clarendon Press ; Oxford University Press, Oxford : New York, 2004).
- Ditmire et al. (1999) T. Ditmire, J. Zweiback, V. P. Yanovsky, T. E. Cowan, G. Hays, and K. B. Wharton, Nature 398, 489 (1999).
- Willingale et al. (2011) L. Willingale, G. M. Petrov, A. Maksimchuk, J. Davis, R. R. Freeman, A. S. Joglekar, T. Matsuoka, C. D. Murphy, V. M. Ovchinnikov, A. G. R. Thomas, L. Van Woerkom, and K. Krushelnick, Physics of Plasmas 18, 083106 (2011).
- Toupin et al. (2001) C. Toupin, E. Lefebvre, and G. Bonnaud, Physics of Plasmas 8, 1011 (2001).
- Jiang et al. (2020) X. Jiang, F. Shao, D. Zou, M. Yu, L. Hu, X. Guo, T. Huang, H. Zhang, S. Wu, G. Zhang, T. Yu, Y. Yin, H. Zhuo, and C. Zhou, Nuclear Fusion 60, 076019 (2020).
- Yan et al. (2022) J. Yan, G. L. Ren, Z. J. Chen, X. Zhang, C. Yang, L. L. Li, J. H. Zheng, H. Cao, C. K. Sun, W. Jiang, Q. Tang, Z. F. Song, B. Yu, Y. D. Pu, Y. S. Dong, T. X. Huang, J. Liu, S. Jiang, and X. T. He, Nuclear Fusion 62, 106030 (2022).
- Zhuo et al. (2009) H. B. Zhuo, W. Yu, M. Y. Yu, H. Xu, X. Wang, B. F. Shen, Z. M. Sheng, and J. Zhang, Physical Review E 79, 015401 (2009).
- He et al. (2015) M.-Q. He, H.-B. Cai, H. Zhang, Q.-L. Dong, C.-T. Zhou, S.-Z. Wu, Z.-M. Sheng, L.-H. Cao, C.-Y. Zheng, J.-F. Wu, M. Chen, W.-B. Pei, S.-P. Zhu, and X. T. He, Physics of Plasmas 22, 123103 (2015).
- Ren et al. (2017) G. Ren, J. Yan, J. Liu, K. Lan, Y. H. Chen, W. Y. Huo, Z. Fan, X. Zhang, J. Zheng, Z. Chen, W. Jiang, L. Chen, Q. Tang, Z. Yuan, F. Wang, S. Jiang, Y. Ding, W. Zhang, and X. T. He, Physical Review Letters 118, 165001 (2017).
- Hu et al. (2015) L.-X. Hu, T.-P. Yu, F.-Q. Shao, Q.-J. Zhu, Y. Yin, and Y.-Y. Ma, Physics of Plasmas 22, 123104 (2015).
- Xu et al. (2012) H. Xu, W. Yu, M. Y. Yu, Wong, A. Y., Sheng, Z. M., Murakami, M., and Zhang, J., Applied Physics Letters 100, 144101 (2012).
- Yoon et al. (2021) J. W. Yoon, Y. G. Kim, I. W. Choi, J. H. Sung, H. W. Lee, S. K. Lee, and C. H. Nam, Optica 8, 630 (2021).
- Kong et al. (2019) F. Kong, H. Larocque, E. Karimi, P. B. Corkum, and C. Zhang, Optica 6, 160 (2019).
- Carbajo et al. (2014) S. Carbajo, E. Granados, D. Schimpf, A. Sell, K.-H. Hong, J. Moses, and F. X. Kärtner, Optics Letters 39, 2487 (2014).
- Carbajo et al. (2016) S. Carbajo, E. A. Nanni, L. J. Wong, G. Moriena, P. D. Keathley, G. Laurent, R. J. D. Miller, and F. X. Kärtner, Physical Review Accelerators and Beams 19, 021303 (2016).
- Zhan (2009) Q. Zhan, Advances in Optics and Photonics 1, 1 (2009).
- Forbes (2019) A. Forbes, Laser & Photonics Reviews 13, 1900140 (2019).
- Quabis et al. (2000) S. Quabis, R. Dorn, M. Eberler, O. Glöckl, and G. Leuchs, Optics Communications 179, 1 (2000).
- Dorn et al. (2003) R. Dorn, S. Quabis, and G. Leuchs, Physical Review Letters 91, 233901 (2003).
- Cheng et al. (2023a) Z. Cheng, D. Deng, M. Yu, and H. Wu, Plasma Science and Technology 25, 032001 (2023a).
- Yu et al. (2016) C. Yu, A. Deng, Y. Tian, W. Li, W. Wang, Z. Zhang, R. Qi, C. Wang, and J. Liu, Physics of Plasmas 23, 082701 (2016).
- Psikal and Matys (2018) J. Psikal and M. Matys, Plasma Physics and Controlled Fusion 60, 044003 (2018).
- Esirkepov et al. (2002) T. Esirkepov, K. Nishihara, S. V. Bulanov, and F. Pegoraro, Physical Review Letters 89, 275002 (2002).
- Sarri et al. (2010) G. Sarri, D. K. Singh, J. R. Davies, F. Fiuza, K. L. Lancaster, E. L. Clark, S. Hassan, J. Jiang, N. Kageiwa, N. Lopes, A. Rehman, C. Russo, R. H. H. Scott, T. Tanimoto, Z. Najmudin, K. A. Tanaka, M. Tatarakis, M. Borghesi, and P. A. Norreys, Physical Review Letters 105, 175007 (2010).
- Li et al. (2021) Z. Li, Y. Bai, and Y. Tian, Optics Letters 46, 336 (2021).
- Weng et al. (2012) S. M. Weng, M. Murakami, P. Mulser, and Z. M. Sheng, New Journal of Physics 14, 063026 (2012).
- Wu (2011) H.-C. Wu, “JPIC & How to make a PIC code,” (2011), arxiv:1104.3163 [astro-ph, physics:physics] .
- Cheng et al. (2023b) Z.-M. Cheng, H.-C. Wu, D.-C. Deng, and M.-Y. Yu, Physics of Plasmas 30, 073105 (2023b).
- Naumova et al. (2001a) N. M. Naumova, S. V. Bulanov, T. Zh. Esirkepov, D. Farina, K. Nishihara, F. Pegoraro, H. Ruhl, and A. S. Sakharov, Physical Review Letters 87, 185004 (2001a).
- Sánchez-Arriaga and Lefebvre (2011a) G. Sánchez-Arriaga and E. Lefebvre, Physical Review E 84, 036403 (2011a).
- Sánchez-Arriaga and Lefebvre (2011b) G. Sánchez-Arriaga and E. Lefebvre, Physical Review E 84, 036404 (2011b).
- Landau and Lifshits (1984) L. D. Landau and E. M. Lifshits, Electrodynamics of Continuous Media, 2nd ed., Pergamon International Library of Science, Technology, Engineering, and Social Studies No. v. 8 (Pergamon, Oxford [Oxfordshire] ; New York, 1984).
- Cap and Deutsch (1978) F. Cap and R. Deutsch, IEEE Transactions on Microwave Theory and Techniques 26, 478 (1978).
- Thiele et al. (2016) I. Thiele, S. Skupin, and R. Nuter, Journal of Computational Physics 321, 1110 (2016).
- Pukhov and Meyer-ter-Vehn (1997) A. Pukhov and J. Meyer-ter-Vehn, Physical Review Letters 79, 2686 (1997).
- Li et al. (2020) Z. Li, S. Guo, Y. Bai, Y. Zeng, and Y. Tian, Plasma Physics and Controlled Fusion 63, 015007 (2020).
- Mourou et al. (2006) G. A. Mourou, T. Tajima, and S. V. Bulanov, Reviews of Modern Physics 78, 309 (2006).
- April (2010) A. April, in Coherence and Ultrashort Pulse Laser Emission, edited by F. J. Duarte (InTech, 2010).
- Zaïm et al. (2017) N. Zaïm, M. Thévenet, A. Lifschitz, and J. Faure, Physical Review Letters 119, 094801 (2017).
- Naumova et al. (2001b) N. M. Naumova, J. Koga, K. Nakajima, T. Tajima, T. Zh. Esirkepov, S. V. Bulanov, and F. Pegoraro, Physics of Plasmas 8, 4149 (2001b).
- Slutz et al. (2010) S. A. Slutz, M. C. Herrmann, R. A. Vesey, A. B. Sefkow, D. B. Sinars, D. C. Rovang, K. J. Peterson, and M. E. Cuneo, Physics of Plasmas 17, 056303 (2010).
- Hurricane et al. (2023) O. A. Hurricane, P. K. Patel, R. Betti, D. H. Froula, S. P. Regan, S. A. Slutz, M. R. Gomez, and M. A. Sweeney, Reviews of Modern Physics 95, 025005 (2023).
- Yue et al. (2021) D. N. Yue, M. Chen, P. F. Geng, X. H. Yuan, Z. M. Sheng, J. Zhang, Q. L. Dong, A. Das, and G. R. Kumar, Plasma Physics and Controlled Fusion 63, 075009 (2021).
- Bulanov and Esirkepov (2007) S. V. Bulanov and T. Zh. Esirkepov, Physical Review Letters 98, 049503 (2007).
- Nakamura et al. (2010) T. Nakamura, S. V. Bulanov, T. Z. Esirkepov, and M. Kando, Physical Review Letters 105, 135002 (2010).
- Helle et al. (2016) M. H. Helle, D. F. Gordon, D. Kaganovich, Y. Chen, J. P. Palastro, and A. Ting, Physical Review Letters 117, 165001 (2016).
- Wilson et al. (2019) T. C. Wilson, F. Y. Li, S. M. Weng, M. Chen, P. McKenna, and Z. M. Sheng, Journal of Physics B: Atomic, Molecular and Optical Physics 52, 055403 (2019).
- Wilson et al. (2023) T. C. Wilson, Z.-M. Sheng, P. McKenna, and B. Hidding, Journal of Physics Communications 7, 035002 (2023).
- Wang et al. (2015) W. Wang, B. Shen, X. Zhang, L. Zhang, Y. Shi, and Z. Xu, Scientific Reports 5, 8274 (2015).
- Ossikovski (2016) J. J. G. Ossikovski, Razvigor, Polarized Light and the Mueller Matrix Approach (CRC Press, Boca Raton, 2016).
- Zhan (2006) Q. Zhan, Optics Letters 31, 867 (2006).