Toward CXL-Native Memory Tiering via Device-Side Profiling
Abstract
The Compute Express Link (CXL) interconnect has provided the ability to integrate diverse memory types into servers via byte-addressable SerDes links. Harnessing the full potential of such heterogeneous memory systems requires efficient memory tiering. However, existing research in this domain has been constrained by low-resolution and high-overhead memory access profiling techniques. To address this critical challenge, we propose to enhance existing memory tiering systems with a novel NeoMem solution. NeoMem offloads memory profiling functions to device-side controllers, integrating a dedicated hardware unit called NeoProf. NeoProf readily tracks memory access and provides the operating system with crucial page hotness statistics and other useful system state information. On the OS kernel side, we introduce a revamped memory-tiering strategy, enabling accurate and timely hot page promotion based on NeoProf statistics. We implement NeoMem on a real CXL-enabled FPGA platform and Linux kernel v6.3. Comprehensive evaluations demonstrate that NeoMem achieves to geomean speedup over several existing memory tiering solutions.
††* Co-first authors.†† Corresponding author.I Introduction
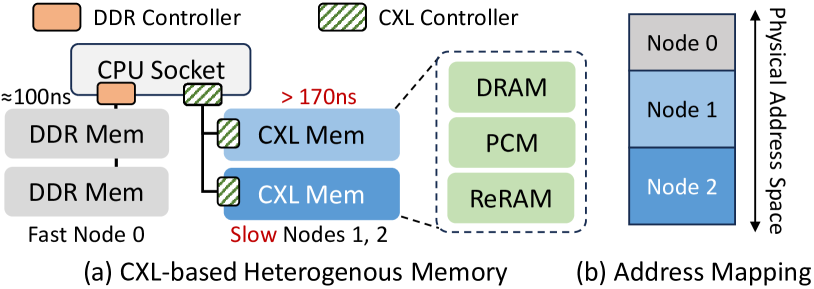
The Compute Express Link (CXL) technology provides a coherent and byte-addressable interconnect between host CPUs and various external devices [23]. Among its multiple applications [33, 67, 42, 7, 82, 14, 8], CXL-based memory extension (CXL memory for short) has risen as a focal point [53, 47, 29, 26, 11]. As illustrated in Figure 1-(a), CXL enables servers to effortlessly incorporate diverse memory devices to expand the memory capacity and bandwidth without necessitating hardware modifications on the CPU side. As depicted in Figure 1-(b), CXL memories are exposed to the software as CPU-less NUMA nodes [53, 47]. CPUs directly read from or write to these address-mapped NUMA nodes without invoking page faults or swaps.
However, CXL memory is also faced with the elevated access latency, which can be over twice as high when compared to direct CPU-attached DRAMs [69, 40, 47]. The latency is more pronounced when integrating slower memory media like PCM and ReRAM with CPUs via CXL [65]. As a result, these disparities in latency, bandwidth and capacity have led to the formation of a CXL-based tiered memory system [65, 47, 53, 44]. Notably, accesses to faster memory tiers are characterized by lower latency and higher bandwidth, whereas the opposite holds true for slower tiers. Given this differential, the operating system should place frequently accessed “hot” pages in fast NUMA nodes while putting “cold” pages in slow nodes to maximize system performance, which is referred to as Memory Tiering technique [57, 79, 5, 36, 39, 21].
Challenges of CXL-based Memory Tiering. However, existing memory tiering techniques encounter significant challenges when applied to CXL-based tiered memory systems. These difficulties primarily stem from the absence of an effective, low-overhead memory access profiling method. Unlike RDMA-based memory disaggregation, where the operating system monitors external memory access [6, 28], CXL memory allows direct CPU access without OS awareness of the access patterns. This necessitates special profiling methods like PTE-scan [50], hint-fault monitoring [25], and PMU sampling [74], each with inherent limitations, to differentiate between “hot” and “cold” pages.
To be specific, PTE-scan and hint-fault monitoring manipulate special bits in Page-Table Entries (PTEs) to realize page tracking. PTE-scan periodically clears Access bits in PTEs, identifying accessed pages by scanning them after the processor sets these bits. Hint-fault monitoring [25], meanwhile, poisons some sampled PTEs. The following access to these pages will trigger protection faults, notifying the OS with the page access. Obviously, PTE-scan only captures one access per page in each epoch, leading to low time-resolution and high overhead. Due to frequently triggering page faults, hint-fault monitoring incurs even greater overhead [60]. What’s worse, both techniques operate at the TLB level, lacking information about true LLC misses. If a page is frequently accessed but resides in cache, it is redundant to migrate it to fast memory. Additionally, they cannot differentiate between read and write operations, a crucial aspect for NVM-based CXL memory, which has asymmetric read and write bandwidth [65].
Performance Monitoring Units (PMUs) in CPUs such as Intel’s PEBS and AMD’s IBS can be employed to track LLC misses. For instance, PEBS supports sampling LLC misses at a configurable interval. It stores the records in a buffer and, upon reaching capacity, triggers interrupts to transfer them to a specified memory space. While PMU-sampling directly tracks LLC misses, it always operates at a low sampling frequency to control overhead [21, 44], hindering the achievement of optimal hot page detection recall in practical scenarios [21]. Additionally, PMU-based methods are CPU vendor-specific, which limits their generality. A detailed analysis of these memory profiling techniques is presented in Section II-C.
Design goals: Given these challenges, an ideal memory access profiling mechanism should aim to fulfill these goals:
G1: High Resolution – First of all, the profiler should accurately and promptly track the frequency and location of memory accesses with high time and space resolution.
G2: Low Overhead – It’s also crucial for the profiler to consume minimal CPU cycles, ensuring that system’s performance is not detrimentally impacted.
G3: Cache Awareness – The profiler should be aware of CPU’s cache and only captures LLC misses to ensure a high accuracy.
G4: Universal Compatibility – The design should be versatile, ensuring compatibility across various platforms, provided they support CXL-based memory expansion.
G5: Comprehensive Profiling – Additionally, if the profiler can also capture crucial information such as system bandwidth utilization, read/write distribution and access frequency distribution, etc., the OS can perform more informed scheduling.
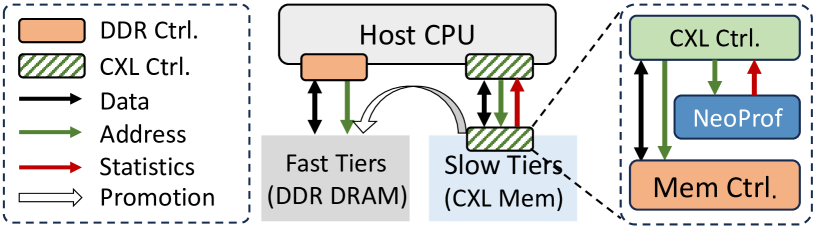
Our Work: We capitalize on the special architecture of CXL memory and propose NeoMem, a CXL-native memory tiering solution featuring hardware-software co-design. NeoMem integrates memory access profiling units named NeoProf, into the device-side controllers, as illustrated in Figure 2. NeoProf readily analyzes LLC misses to CXL memory and provides the OS with crucial information like page hotness, memory bandwidth utilization, read/write ratio, and access frequency distribution, etc. Concurrently, on the OS side, we implement an advanced memory-tiering strategy leveraging NeoProf’s insights for efficient hot page promotion. We demenstrate how NeoMem aligns with the five design goals:
For goal G1, NeoProf uses a customized Sketch [18] based hot-page detector to efficiently analyze each physical page access and identify hot pages with a fine granularity of 4KB. By offloading hot page tracking to dedicated hardware, NeoMem does not waste precious CPU cycles for memory profiling, which inherently satisfies G2. As NeoProf resides at the memory side, it directly snoops LLC misses to CXL memory which naturally fulfills G3. To ensure broad compatibility, as outlined in G4, we limit hardware modifications to the CXL device side. This guarantees seamless integration with any CXL-enabled CPUs. Beyond tracking page hotness, NeoProf offers insights into other vital metrics, such as bandwidth utilization, read/write ratio and access frequency distribution, etc. This data empowers the OS to dynamically control page migration aggressiveness for optimal performance, which fulfills G5.
In contrast to previous studies using emulation to prototype their designs [47, 53, 65], NeoMem is implemented on a real CXL-enabled FPGA platform. On the software front, we implement NeoMem’s driver and memory tiering daemon atop the Linux kernel v6.3. To summarize, we have made the following key contributions:
-
•
Analysis of Limitations. We investigate the limitations of existing memory tiering methods and demonstrate the necessity of an efficient memory access profiling technique in emerging CXL-based tiered memory systems (Sec. II).
-
•
NeoMem Solution. We propose a novel NeoMem solution, which leverages a dedicated hardware profiler, NeoProf, in memory-side controller to realize efficient memory profiling (Sec. III). We carefully design the architecture of NeoProf to ensure high profiling accuracy and low overhead (Section IV). Based on NeoProf, we introduce NeoMem’s software design and dynamic migration policy (Sec. V).
-
•
Real-Platform Prototyping. We conduct real-platform prototyping of NeoMem based on a CXL-enabled FPGA platform and Linux kernel v6.3 with our NeoMem patch (Sec. VI). Compared to several existing memory-tiering mechanisms, NeoMem achieves to geomeam speedup.
II Background and Motivation
II-A CXL-based Tiered Memory System
CXL (Compute-Express-Link) [23], built on the PCIe 5.0 physical layer, creates a cache-coherent, byte-addressable interconnect through efficient SerDes links. It comprises three sub-protocols: CXL.io, CXL.cache, and CXL.mem. The CXL.mem protocol specifically allows direct CPU access to memory devices over CXL with cache-line granularity. Unlike traditional DDR-based memory, where the memory controller is embedded in the host CPUs and challenging to upgrade, CXL employs device-side memory controllers. This architectural separation facilitates the flexible integration of various memory types into servers, catering to specific capacity, performance, and cost needs [32, 68, 47, 53].
However, compared to CPU-attached DDR-DRAMs, CXL-connected memories generally exhibit much higher latency. On the one hand, the control and transmission overhead of CXL is non-negligible. Previous studies usually assume a 170-250ns of CXL memory read latency when typical DDR4 memory is connected via CXL controllers with optimized latency [53, 47, 69, 40]. On the other hand, the latency is more pronounced when integrating high-density but slower memory media like PCM and ReRAM as CXL memory [65, 33]. To delve deeper into this difference, we conduct a performance characterization on Intel’s FPGA-based CXL memory, with its detailed configurations provided in Section VI-A.
As depicted in Figure 3-(a), the FPGA-based CXL memory serves as the slow memory tier, which demonstrates a latency of about 430 ns, approximately that of the faster CPU-attached DDR-DRAM (serves as the fast memory tier). To further gauge the real-world performance implications, we compare the end-to-end performance using several benchmarks (introduced in Section VI-A). We bound CPU threads to either the fast or slow memory tier to assess the resultant slowdown. As indicated in Figure 3-(b), solely utilizing the CXL memory results in a performance decrease ranging from (in Redis) to (in Page-Rank). These observations align with prior findings [69].
II-B Tiered Memory Management
Given the disparities in latency, bandwidth and capacity of different memory types, memory tiering techniques have been proposed to maximize system performance. Memory tiering fundamentally hinges on the data locality of workloads and strategically places the frequently accessed “hot” pages, which are performance critical, in faster memory tiers. The iterative memory tiering process typically unfolds in three key stages:
-
•
Memory-Access Profiling. The system first gathers page access statistics via specific memory profiling techniques.
-
•
Page Classification. Profiled pages are then classified as either “hot” or “cold” based on their access frequency.
-
•
Page Migration. The hot pages identified in slow memory tiers are migrated to fast tiers, a process termed as Promotion. Conversely, the “cold” pages are relocated to slower memory tiers, a process known as Demotion.
Among the three steps, memory-access profiling plays a fundamental role [50, 15, 61, 57, 65]. A high-resolution and low-overhead memory profiling method is critical for promptly identifying performance-critical “hot” pages. Since physical memory accesses are not visible to the operating system, several special profiling techniques have been proposed, which are analysed as follows.
II-C Memory Access Profiling Techniques
PTE-scan. Page-Table-Entry scanning (PTE-scan for short) is a widely used method for page access tracking. In this approach, a daemon thread in the OS kernel periodically resets the Accessed bits in PTEs. When a page is accessed by the CPU, the corresponding bit in the PTE is updated. After a certain interval after previous resets, the daemon thread scans the PTEs to check which pages have been accessed. Therefore, PTE-scan tracks memory access in distinct epochs. This method is favored in various studies and systems [36, 79, 30, 21, 5].
However, PTE-scan faces challenges with low time resolution and high overhead. For instance, scanning PTEs in a large-scale memory system can even take several seconds [57], leading to significant delays. Furthermore, PTE-scan can only detect a single access per page in each scanning epoch, necessitating multiple epochs to identify frequently accessed pages. This multi-round approach escalates costs and reduces timeliness. Efforts like DAMON [50] and AMP [30] employ region sampling or huge pages to mitigate PTE scanning overhead, they however compromise on space resolution.
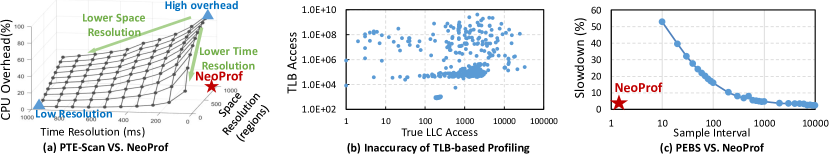
We analyze the performance trade-offs in PTE-scan using DAMON [50] in Linux. DAMON allows customization of both time resolution (interval between scans, in milliseconds) and space resolution (number of monitored regions, where a higher number equates to finer granularity). As depicted in Figure 4-(a), our analysis reveals that to achieve prompt memory access tracking with manageable overhead in PTE-scan, there’s a significant compromise in space resolution, and vise-versa. In contrast, our NeoProf method (indicated by the red star) successfully achieves both high time and space resolution with negligible overhead, effectively overcoming the key limitations associated with PTE-scan.
Observation#1: PTE-scan methods cannot achieve high time and space resolution while maintaining a low overhead.
Hint-fault Monitoring. In contrast to PTE-scan, which gathers page-access information in distinct epochs, several proposals advocate for hint-fault monitoring to achieve more immediate page-access tracking [53, 49, 39, 5, 10]. For example, Thermostat [5] periodically samples a subset of pages and “poisons” the corresponding PTEs by setting specific bits. Protection faults are immediately triggered in the successive page accesses to these poisoned pages, signaling to the OS which pages have been accessed. Hence, hint-fault monitoring operates “actively,” recording a page access instantly, whereas PTE-scan functions “passively,” identifying accessed pages only when the scanning thread functions. However, as each page tracking operation initiates a costly TLB shootdown and page fault, hint-fault monitoring necessitates a sampling approach to temper overheads, which results in a low coverage in practice [61]. Moreover, like PTE-scan, hint-fault monitoring depends on multiple rounds to determine page access frequency, resulting in low time resolution.
Furthermore, both PTE-scan and hint-fault monitoring have a common limitation: they track TLB misses rather than LLC misses. Consequently, they do not directly measure true memory access, but rather an indirect indication of it. Our detailed profiling reveals that TLB misses and LLC misses often do not exhibit a strong correlation across various workload traces. This observation is illustrated in Figure 4-(b), where we graph the total number of TLB accesses (plotted on the Y-axis) against the LLC accesses (on the X-axis) for some sampled pages from a Redis [58] trace. We utilize the KCacheSim [12] simulator for this analysis. The scatter plot in the figure clearly demonstrates a high level of dispersion, indicating that a page with frequent TLB accesses does not necessarily correlate with a high number of LLC misses. This finding suggests that it is not accurate to discern “hot” and “cold” pages using TLB-based memory profiling techniques.
Observation#2: TLB-based memory profiling methods may not capture the actual CXL memory access patterns.
PMU Sampling. PMU (Performance Monitoring Unit) sampling, unlike PTE-scan and hint-fault monitoring, utilizes hardware monitors in modern CPUs for direct LLC miss tracking. Prominent solutions include Intel’s PEBS (Precise Event Based Sampling) and AMD’s IBS (Instruction Based Sampling). PEBS, for instance, supports sampling events like LLC misses and storing them in a dedicated memory buffer. When this buffer reaches capacity, it triggers an interrupt, prompting the kernel to process these event samples.
This direct tracking method is prevalent in memory tiering systems [57, 44, 21]. However, as illustrated in Figure 4-(c), the overhead of PEBS increases with sampling frequency. For instance, decreasing the sampling interval from every 10,000 to every 10 LLC misses can cause a workload slowdown of more than 50%. Consequently, existing systems usually adopt a low sampling frequency to minimize performance impact, which however scarifies the time resolution [21, 44].
Furthermore, it’s important to note that the integration of PMU sampling is often closely tied to specific CPU platforms. Consequently, a system designed for Intel CPU servers may not seamlessly transition to AMD or ARM servers, which contradicts the open and versatile principles of CXL.
Observation#3: The PMU-sampling methods are CPU-vendor specific and will introduce significant overhead when improving the time resolution.
Conclusion. Our analysis across three distinct observations reveals the limitations of current memory access profiling techniques. These difficulties pose substantial challenges to the advancement of CXL-based memory tiering systems. There is an urgent demand for memory profiling techniques that can offer high resolution while maintaining low overhead.
III NeoMem Solution
To overcome these limitations, we propose a novel CXL-native111We call NeoMem “CXL-native” because it fully utilizes the special architecture of CXL memory that has device-side controllers. memory tiering system named NeoMem. NeoMem’s key design philosophy is to offload the memory profiling functions from CPU to a dedicated hardware unit in CXL memory’s controller, which is named NeoProf in our design. As depicted in both Figure 4-(a) and Figure 4-(c), NeoProf (the red star) achieves exceptionally high time and space resolution while imposing minimal CPU overhead. In this section, we outline the full-stack system design of NeoMem.
III-A Overview of NeoMem Solution
Figure 5 presents the overview of NeoMem. In the system, we currently assume two memory tiers: the CPU-attached DDR DRAM serves as the fast memory tier, while CXL-connected memory is the slow memory tier. Different memory tiers are managed via the NUMA APIs of Linux. NeoMem mainly introduces the following key components:
Memory Access Profiling. A pivotal feature of NeoMem is its efficient memory access profiling capability. NeoMem facilitates two core profiling functions: (1) detection of hot pages in slow memory and (2) monitoring of runtime states.
Hot Page Detection. NeoMem incorporates a dedicated hardware profiler named NeoProf to meet the high-resolution and low-overhead requirements of hot page detection. As shown in Figure 5, NeoProf (❶) resides in CXL memory’s device-side controllers. It snoops memory-access requests sent via the CXL channel, analyzes them and generates page hotness information as well as other useful statistics (❸). The host CPU controls NeoProf’s execution and readouts the hotness statistics periodically via sending commands (❷) through an MMIO (Memory-Mapped I/O) interface. In the OS kernel space, we implement the driver (❹) to interact with NeoProf hardware. Since NeoProf-based hot page profiling only requires device-side modification, it is drop-in compatible with any CXL-enabled server platforms.
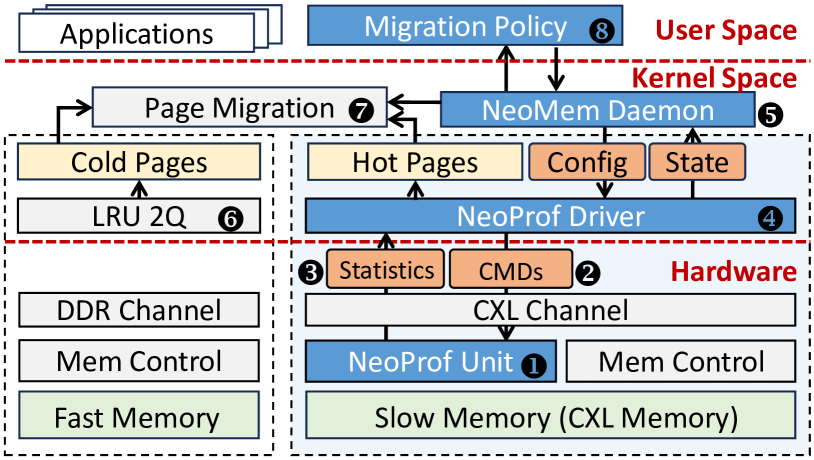
Note that cold pages in fast memory tiers should also be detected and demoted to slow memory to create space for hot page promotion. Since the detection of cold pages does not need a high resolution, as highlighted in [21], NeoMem employs the well-established LRU 2Q mechanism[35] in the Linux kernel for the detection of cold pages (❻).
State Monitoring. In a tiered memory system, monitoring runtime states, such as bandwidth utilization, read/write ratios [65], and page access frequency distribution [44], is crucial for effective memory tiering. For example, when the slow CXL memory experiences increased bandwidth usage, it becomes advantageous to migrate more hot pages to fast memory. Additionally, in cases where CXL-side memory employs devices with asymmetrical read/write bandwidths, the migration scheduler should better consider their distinct performance characteristics [65]. Furthermore, the distribution of page access frequency also counts in hot page classification [44]. To facilitate the migration scheduling process, we incorporate state monitors into NeoProf. The operating system accesses these critical runtime states through NeoProf commands.
NeoMem Daemon. Within the Linux kernel, we implement a NeoMem daemon (❺) that interfaces with NeoProf to gather runtime statistics. This daemon is responsible for managing hot page promotions, adhering to a migration policy specified in user space (❽). Hot pages are migrated by invoking the kernel’s page migration functions (❼), at intervals set by the migration_interval parameter. Additionally, the daemon resets NeoProf’s states at regular intervals, as determined by the clear_interval setting.
Migration Policy. Based on the rich information provided by NeoProf, NeoMem’s migration policy establishes the guidelines for the NeoMem daemon to orchestrate memory profiling and migration (❼). This policy decision is made in the user space, enabling customization and tuning by the user. We will introduce the implementation of NeoMem daemon and migration policy in Section V.
IV NeoProf Details
IV-A Architecture Overview
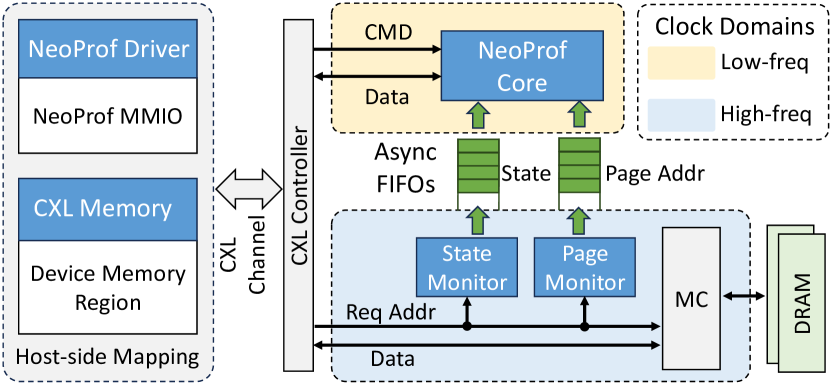
Figure 6 illustrates the block diagram of NeoProf hardware, consisting of three custom units: the State Monitor, Page Monitor, and NeoProf Core. The Page Monitor snoops device-side CXL controller requests, identifies physical page addresses, and forks them to the NeoProf Core for analysis. The State Monitor tracks Read/Write transactions, estimates bandwidth utilization and read/write ratios, while the NeoProf Core collaborates with both monitors, identifying hot pages and responding to host CPU control commands.
As shown in the left part, the registers of NeoProf core are memory-mapped to a predefined address space, enabling the OS kernel to access them via Memory-Mapped IO (MMIO). The host CPU sends commands to NeoProf by writing data to specific addresses with different offsets. Additionally, the CXL memory is mapped to another address space, allowing the OS to manage it as a CPU-less NUMA node [53, 47].
Notably, the NeoProf prototype is implemented on an FPGA platform. As a result, we place the NeoProf Core in a low-frequency domain, while the State Monitor and Page Monitor operate at a high frequency to match the memory controller’s requirements. We use asynchronous FIFOs for data transmission from the monitors to the NeoProf core.
IV-B Hot Page Detector
In this section, we introduce NeoProf’s hardware design for high-resolution, low-overhead hot page detection. We start by analyzing the challenges and then introduce our solution.
Challenges. Given a physical page access stream represented as , where denotes the -th accessed page, we define a page as “hot” if its access frequency surpasses a certain threshold . A straw-man approach for hardware-based hot page detection involves utilizing counters to monitor the access frequency of individual physical pages. However, consider a 512GB CXL memory expander [68], housing a total of 128 million 4KB pages. Assigning a 32-bit counter to each page would require 512MB of buffer to store these counters. Moreover, updating these counters with every page access would impose a significant burden on DRAM bandwidth. Additionally, reading and processing these counters to identify hot pages could introduce considerable latency, severely affecting the timeliness of profiling.
Efficient Hot Page Detection. To address the challenges outlined, we propose an efficient hot-page detection architecture. Our approach hinges on the Count-Min (CM) Sketch algorithm [18], a hash-based technique designed for estimating item frequencies within a data stream. We enhance the CM-Sketch with two capabilities: (1) we propose an efficient hot page filtering mechanism to prevent duplication. (2) We introduce an error-bound control mechanism in the hot page detector to guarantee a high detection accuracy.
As illustrated in Figure 7, a CM-Sketch with parameters () is represented by a two-dimensional array counts (❶) with a width of and a depth of . Given parameters (), we set and . Each entry in the array consists of a counter, a hot bit and a valid bit (❷). different hash functions (❸) map the input page address to one of entries in each lane. When a page address arrives, the hash functions calculate offsets in each row of the sketching array, denoted as for the -th row, where . Subsequently, the counters of the hashed entries are indexed and incremented:
| (1) |
Then the access frequency of page , represented as , is approximated by the minimum value in each lane:
| (2) |
According to the theory [18], the estimated access frequency falls within the following range with probability :
| (3) |
Here, is the total number of accesses seen by the sketch. Given a threshold , the hot page detector (❹) assesses whether the approximated access count exceeds :
| (4) |
After each hot page detection period, NeoProf should clear the counters to prevent saturation. However, naively resetting counters involves costly traversal of all sketch entries. To address this, we include a Valid bit in each entry. Now, every counter increment operation involves checking the Valid bit first. If the bit is False, indicating that this is a new entry, we reset the counter and update the Valid bit to True. Otherwise, the counter increments as usual. In each sketch lane, the Valid bits are physically arranged in a contiguous manner, allowing for rapid resetting in a few cycles.
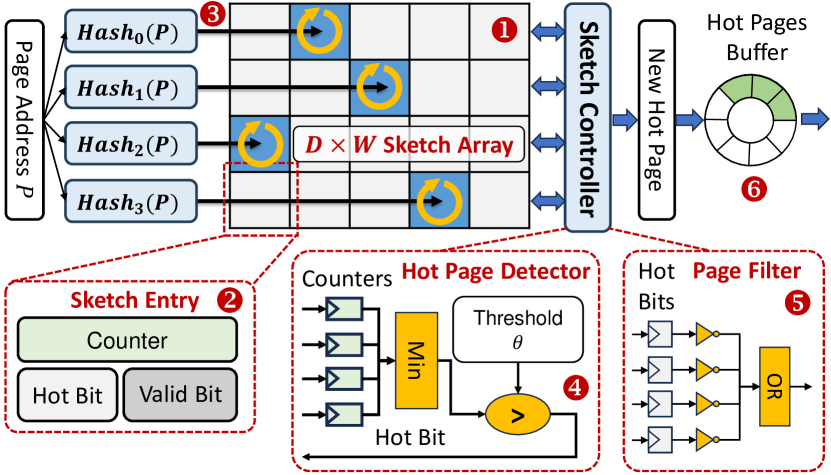
Hot-Page Filtering. In NeoProf’s design, the addresses of detected hot pages are put into the hot pages buffer (❻ in Figure 7). However, in each detection period, a page can be identified as hot repeatedly once its access frequency exceeds the threshold , which will fill up the hot-page buffer quickly and is redundant for hot page migration. We avoid this problem via introducing a Hot bit in each sketch entry (❷).
Before transferring a page address to the output buffer, the hot page filter (❺) examines the Hot bits in the hashed entries. If all the hot bits are set to True, this suggests that the page might have been recorded previously, leading us to dismiss it. Conversely, if any Hot bit is False, this indicates a newly detected hot page. We then set the hot bits in the corresponding entries to True. Such a design can be thought of as equivalent to adding a bloom filter [76] after the CM-Sketch unit to probabilistically determine the presence of a hot page [34]. Our design is more efficient as it reuses the hashing results and introduces only a minimal number of additional hot bits.
Accurate Error-Bound Estimation. One significant challenge in Sketch-based hotness estimation is the increasing approximation error as the number of streamed-in page addresses grows ( in Eq. 3). In extreme cases, all counters in the sketch array exceeding the threshold can lead to an unseen page being incorrectly labeled as “hot” due to substantial approximation error. Equation 3 provides a worst-case error bound estimation, which has been criticized as overly “loose” for practical use [13]. Chen et al. introduced a technique to estimate a “near-optimal” approximation error by sorting counters within any row of the sketch array in descending order, denoted as . The tight error bound, referred to as , is then determined as the -percentile value of these sorted counters.
With probability , we can say that . If the approximated page access count, , exceed threshold , we can assert that . For example, given and , we can choose the median value of a row to serve as the error estimation, denoted as . When this error comes to a large value (e.g., when ), it indicates that the sketch array may have reached saturation, and the detection results only have a low confidence. NeoMem relies on the estimated error bound to ensure accurate hot page detection, which will be introduced in Section V-A.
Hardware Implementation. Based on these algorithms, we introduce the hardware implementation details of the proposed hot-page detector and the error-bound estimation logic:
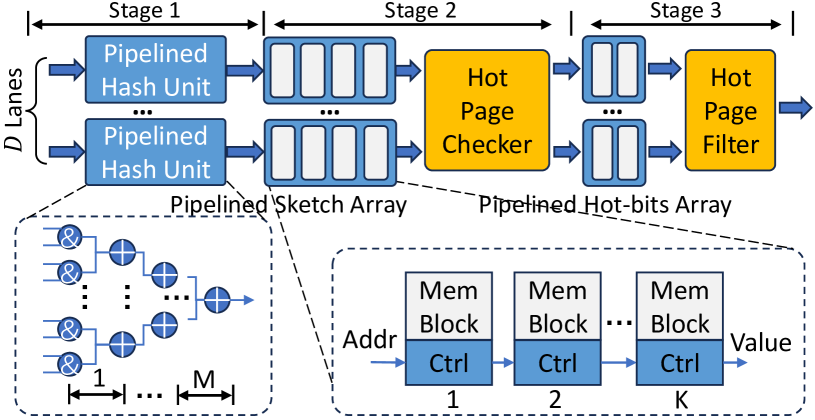
Pipelined Hot Page Detection. In Figure 8, we break down the detector’s pipeline into three primary stages: (1) hash index computation, (2) hot page checking, and (3) hot page filtering. Each of these stages comprises a series of finer pipeline stages. We utilize the H3 [56] hash function for hash index computation. This function calculates a -bit hash value based on a -bit input value and a -bit seed :
| (5) |
where the input is the -bit page address. performs logic AND between each bit and every bit of (the seed is viewed as a 2D bit array with rows and columns). The operator performs logic XOR operation on vectors. The resulting vector, denoted as , is an bit vector encoding the hashed index. To ensure efficient and pipelined processing, we divide this reduction tree into stages, as visualized in Figure 8. Additionally, we employ a total of pipeline units to handle the hash functions for each sketch row in parallel.
Another implementation challenge arises when the sketch array width, represented by the parameter , increases. This makes achieving a single-cycle index and update for any counter difficult. To address this, we adopt a solution based on prior practices [70]. We partition the memory into sub-blocks and implement the sketch array in a pipelined manner.
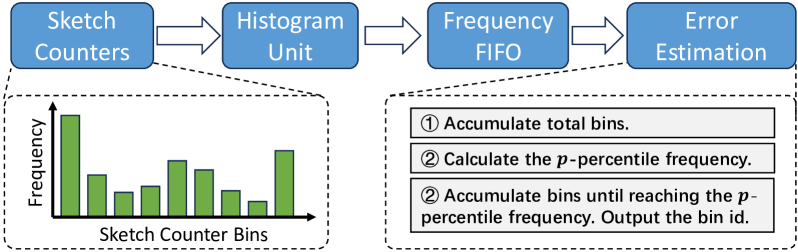
Histogram-based Error-Bound Estimation. According to the accurate error-bound estimation algorithm introduced above, we should read out a row of sketch counters, sort them, and select the -percentile value as the error bound. To reduce CXL bandwidth occupation and save host CPU cycles, we avoid reading out sketch counters by adopting a histogram-based error-bound estimation mechanism.
As depicted in Figure 9, NeoProf Core incorporates a histogram unit with 64 bins. Triggered by specific NeoProf commands, the histogram unit will read the counters in the first row of sketch array and estimate the frequency distribution. The host CPU just needs to readout the histogram and estimate the -percentile frequency using a straightforward algorithm. This approach offers significant advantages compared to directly reading out the entire sketch rows, which could incur a substantial number of transactions.
Besides facilitating error-bound estimation, the histogram also approximates the page access frequency distribution in CXL memory. In Section V-A we will demonstrate how the NeoMem migration policy conducts dynamic hotness threshold adjustment according to the histogram information.
| Command | Offset | Operation | Description |
| Reset | 0x100 | Write 1 | Reset NeoProf |
| SetThreshold | 0x200 | Write | Set hot page threshold to |
| GetNrHotPage | 0x300 | Read | Readout # profiled hotpages |
| GetHotPage | 0x400 | Read | Readout a hot page address |
| GetNrSample | 0x500 | Read | Readout # sampled cycles |
| GetRdCnt | 0x600 | Read | Readout # sampled read |
| GetWrCnt | 0x700 | Read | Readout # sampled write |
| SetHistEn | 0x800 | Write | Trigger the histogram calculation |
| GetNrHistBin | 0x900 | Read | Readout # histogram bins |
| GetHist | 0xA00 | Read | Readout the histogram bins |
NeoProf Commands. NeoProf’s execution is controlled by the host CPU through a set of commands, which are encoded by varying offsets in NeoProf’s MMIO region. Some core commands are listed in Table I. Among these commands, the Reset command clears all the counters and buffers within NeoProf. The SetThreshold command is used to adjust the hot page threshold . Subsequently, the GetNrHotPage command is employed to retrieve the total number of identified hot pages. Following this, a sequence of GetHotPage commands are sent to NeoProf to read out the 32-bit addresses of these hot pages from the hot page buffer sequentially.
Additionally, we design the GetNrSample, GetRdCnt and GetWrCnt commands to retrieve the total sampled cycles, as well as the breakdown of cycles attributed to read and write operations. This information enables the operating system to estimate the read/write bandwidth utilization accurately. Finally, the SetHistEn, GetNrHistBin and GetHist commands are used to trigger the histogram calculation and retrieve the histogram data.
V NeoMem Software Design
V-A NeoMem Migration Policy
Setting the hotness threshold is a critical challenge in memory tiering. Traditional methods, constrained by limited insight into memory access patterns, often rely on static thresholds for classifying hot pages. For example, AutoNUMA [17], AutoTiering [39], and Nimble [79] classify a page as “hot” after a single profiled access, while TPP [53] requires two accesses. However, these static approaches are inadequate for adapting to the dynamic nature of memory access patterns in various workloads. With rich and timely memory access information, NeoMem dynamically adjusts the hotness threshold (described in Algorithm 1) based on the following statistics:
Access Frequency Distribution. We utilize the page access frequency distribution to dynamically determine the hotness threshold . This involves using NeoProf’s histogram of sketch counters as a proxy for actual access frequencies (line 4 in the algorithm). The threshold is determined by setting to the -percentile of this distribution. Specifically, we define as the histogram’s quantile function, where implies that a fraction of pages have fewer than accesses. Thus, is set to (outlined in line 16), aligning the threshold with the top- access frequency.
Bandwidth Utilization. We aim for maximum utilization of fast memory in the system, so when we observe heavy use of the slower CXL memory’s bandwidth, it prompts the migration of more pages to the fast memory tier. We define bandwidth utilization () as the ratio of memory reads and writes to total sampled cycles, given by (line 5). and represent cycles when the device is transferring read and write data monitored by NeoProf during the last threshold update period, and stands for the sampled cycles in that period. Note that is a simple approximation of the true bandwidth utilization, which is, however, sufficient to reflect the relative level of memory usage. The hotness threshold should be inversely proportional to , denoted as .
Ping-Pong Severity. A improperly low hotness threshold may lead to a situation where infrequently accessed pages are prematurely promoted to fast memory, only to be swiftly demoted back to slower memory, which is referred to as Ping-Pong phenomenon [53]. To measure ping-pong severity, we introduce the page flag in the Linux kernel, set when a page is demoted and cleared when it’s promoted. A page with the flag set and then promoted again is counted as a ping-pong event. Ping-pong severity is the ratio of ping-pong events to promoted pages in the previous period, calculated as (line 6). The hotness threshold should be proportional to , denoted as .
Approximation Error. Ensuring the precision of hot page classification necessitates considering the approximation error of the sketch-based hot page detector (referenced in line 7 of the algorithm). We assume that if the estimated error bound exceeds the threshold , this indicates considerable inaccuracies in hot page detection. To mitigate this, we increase the threshold by halving the percentile (as outlined in lines 14 and 15) to enhance the confidence in hot-page detection.
Migration Quota. Lastly, to prevent excessive CPU resource and memory bandwidth consumption due to page migration, we establish a migration quota designated as . Should the number of migrated pages during the previous period exceed this set quota (), we also halve parameter to make the threshold higher, as outlined in line 13.
Taking these factors into consideration, we calibrate the parameter to (line 10), where and are adjustable hyper-parameters. As described in the algorithm, in every threshold update period, we dynamically choose the top fraction of pages as hot and make sure that the decision meets the constraints from error bound and migration quota.
V-B User-Space Interface
In order to facilitate the configuration of runtime parameters in NeoMem, we introduce a set of user-space interfaces, which are accessible through the /sys/kernel/mm/neomem directory. These interfaces are linked to various functions implemented in the kernel space. They empower users to both retrieve essential information from NeoProf and adjust parameters, such as the hotness threshold, migration interval, etc. The migration policy is then implemented within the user space, utilizing these interfaces as its communication channel. Users also have the flexibility to implement their own custom scheduling policies via these interfaces.
VI Evaluation
VI-A Experimental Setup
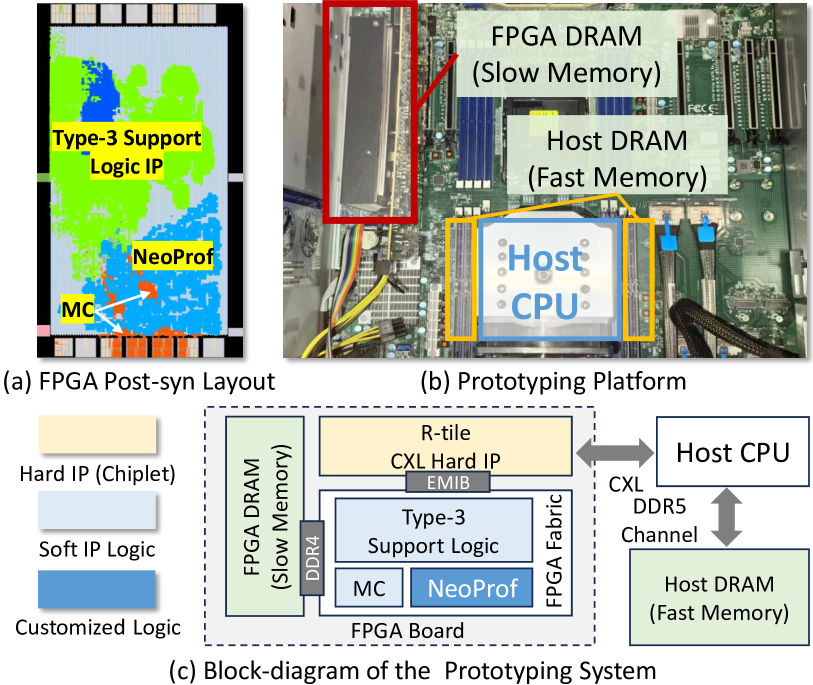
Prototyping Platform. We evaluate NeoMem’s practicality and performance on a real CXL memory system, detailed in Table II. The setup includes a single-socket Intel® Sapphire-Rapids CPU and a CXL-enabled Intel® Agilex-7 I-Series FPGA acting as CXL memory (CXL 1.1, Type-3 device). Intel enables cxl.mem on this FPGA where the CXL-and memory-related IP cores are implemented on the chiplet[19]. The FPGA has dual-channel DDR4-2666 memory with 16GB capacity. The host CPU is equipped with 32GB dual-channel DDR5-4800 memory. For different fast-slow memory ratios, we adjust host memory size by reserving a specific amount of physical memory within the Linux kernel [51]. The default fast-slow ratio is 1:2. We disable CPU’s SMT, fix the CPU clock frequency and clear the page cache before running workloads to ensure consistent performance across trials.
| Host CPU | Single socket Intel® Xeon 6430 CPU @ 2.10GHz | |
|
||
| DDR Memory | 32GB DDR5 4800MHz x 2 | |
| CXL Memory | One Intel® Agilex I-Series FPGA Dev Kit @400 MHz | |
|
Benchmarks. Our study utilizes eight benchmarks that are widely used in previous studies: DeathstarBench [24], a representative data-center benchmark. We evaluate the p99 latency of composing posts, following the practice of previous work [69].; Page-Rank (PR) [9], a classic graph processing workload; XSBench [71] and GUPS [1], both are HPC workloads characterized by skewed hot memory regions; Note that the original GUPS benchmark features random memory access, we follow HeMem’s practice [57] and make some memory access regions hotter than the others. Silo [72], an in-memory database for which we employ the YCSB-C workload; Btree [4], an in-memory index lookup workload; and two applications from SPEC-2017, 603.bwaves and 654.roms, selected for their substantial Resident Set Size (RSS). The RSS values for these seven benchmarks range from 10.3 GB to 19.7 GB. We execute workloads with 32 threads to fully stress the CPU cores and assess the impact of memory access profiling and page migration on CPU overheads.
Baselines. We select five baseline methods for comparative analysis. These baseline methods cover the memory access profiling techniques introduced in Section II-C. Specifically, to compare NeoMem with hint-fault monitoring methods, TPP [53] and AutoNUMA [17] are chosen. TPP enhances hint-fault monitoring by introducing hysteresis for page promotions and separating reclamation and allocation in the fast-tier node. AutoNUMA, part of Linux kernel v6.3, blends part of TPP’s features and introduces an API for configuring a hotness threshold. In addition, to compare NeoMem with PTE-scan and PMU sampling methods, we integrate these profiling techniques into NeoMem, replacing its native memory profiling functions. We call these two systems PTE-scan and PEBS for short. Lastly, we include First-touch NUMA as a baseline, a widely-used memory allocation policy that assigns pages to the fast memory tier until it’s full, without subsequent migration.
VI-B Implementation
|
|
|
|
|
|
||||||||||||
| 32 | 16 | 512K | 2 | 128 | 16K |
We implement NeoProf in Verilog, connect it to Intel’s Type-3 CXL IP, and then synthesize the design using Intel Quartus 22.3. Fig.10-c shows the block-diagram of the implemented prototype. The NeoMem’s software parts, along with other baseline methods, are all developed based on Linux kernel v6.3 for fair comparison.
Hardware Parameters. Table III provides an overview of the default hardware parameters employed by NeoProf. We configure two sketch lanes (), each equipped with 512K counters (), where each counter is 16 bits in size. The sketch counter array is divided into 128 pipeline stages. To accommodate detected hot pages in each epoch, we allocate 16K hot page buffers. Additionally, we utilize 32 bits to index the device-side page address (4KB page), allowing us to address up to 16TB of memory for each memory controller.
FPGA Resource Utilization. Our NeoProf implementation mainly consumes 93.8K ALMs (10%) and 1.5K BRAMs (M20K, 12%), no DSPs. The FPGA post-synthesize layout is shown in Figure 10-(a). The light blue parts are consumed by NeoProf and the remaining parts are mainly consumed by Intel’s FPGA support logic (Type-3 device) for CXL hard IP. Note that the FPGA support logic only serves as the bridge between NeoProf and the CXL controller chiplet on FPGA. .
| Parameter | Value | Description |
| MB/s | The maximum page migration rate. | |
| The lower percentile bound | ||
| The upper percentile bound | ||
| The init value of | ||
| / | Adjustable hyper-parameters | |
| migration_interval | The interval of page migration in NeoMem | |
| clear_interval | The interval of resetting NeoProf counters | |
| pebs_sampling_rate | - | The sampling rate of PEBS |
| pte_sampling_rate | - | PTE-sampling rate of TPP&AutoNUMA |
| page_scanning_rate | Page table scanning rate of PTE-scan |
Default Software Parameters. The default software parameters of NeoMem and baseline methods are listed in Table IV. For NeoMem, we carefully set the parameters in Algorithm 1. For TPP and AutoNUMA baselines, we set the PTE sampling rate to every 1-3 seconds, which is much higher than their default values to match our benchmarks. For PEBS, we follow previous work’s practice [21] and sample the LLC miss event (MEMLOAD_L3MISSRETIRED.LOCALDRAM). To guarantee the optimal performance, the sampling rate for PEBS is fine-tuned for each benchmark, varying between 200 and 5000 memory accesses. The page table scanning frequency of PTE-scan is set to every 5 seconds [30].
VI-C Main Results
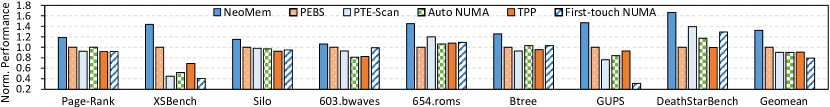
Performance Comparison. Figure 11 shows the performance comparison of our proposed NeoMem system against baseline systems. All performance numbers are normalized against the PEBS system. As depicted by the blue bars representing NeoMem, our approach consistently demonstrates superior performance across all seven benchmarks, achieving geomean speedups ranging from (over PEBS) to a remarkable (over First-touch NUMA). On the representative data-center benchmark, DeathStarBench, NeoMem achieves to speedup over baseline methods. These results demonstrate NeoMem’s efficiency in tiered memory management.
In certain benchmarks, NeoMem exhibits astonishing performance improvements compared to the baseline systems. For instance, NeoMem outperforms First-touch NUMA by factors of and in the XSBench and GUPS benchmarks, respectively. NeoMem also achieves and speedup over AutoNUMA and PTE-scan in XSBench, respectively. This remarkable performance gain is attributed to the skewed hot memory regions present in GUPS and XSBench, as discussed in [44]. NeoMem promptly and accurately identifies these hot regions based on NeoProf and efficiently migrates them to the fast memory, thus significantly enhancing system performance. More detailed analysis of slow-tier traffic reduction of different solutions are presented in Sec.VI-D.
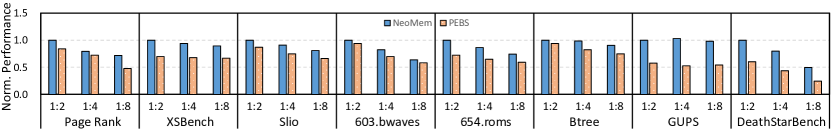
Performance with Different Memory Configs. To illustrate NeoMem’s performance under various memory setups, we maintain a constant CXL memory size and investigate three fast-to-slow memory ratios: 1:2, 1:4, and 1:8. Our evaluation compares NeoMem with PEBS, the second-best memory-tiering system according to Figure 11. As depicted in Figure 12, NeoMem consistently outperforms PEBS across all setups. Notably, in Page-Rank and Btree, the performance gap between NeoMem and PEBS widens as fast memory shrinks, indicating NeoMem’s higher accuracy in hot page classification. Conversely, in GUPS and XSBench, the performance of both NeoMem and PEBS remains relatively stable. This is because the hot sets in these benchmarks always fit within the fast memory. In GUPS the performance on 1:4 is slightly higher than that on 1:2 due to system noise in each run.
VI-D Analysis of NeoMem
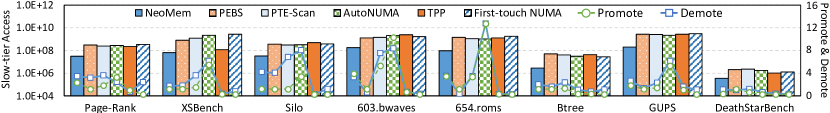
Memory Traffic and Page Migration Analysis. To better understand per-application behaviors, we profile slow-tier (CXL memory) access and page migration using NeoProf’s state monitor and Linux kernel’s counters. As shown in Fig.13, NeoMem exhibits significantly lower slow-tier traffic across all benchmarks, which explains its superior performance. Note that the slow-traffic reduction is not strictly proportional to end-to-end performance in some cases. For example, on XSBench, PEBS has higher slow-tier access than TPP but has a better end-to-end performance in Fig.11. This is due to other system-level affecting factors, e.g., false page promotion also incurs slow-tier access, which varies among solutions.
From the figure, NeoMem’s promotion count (normalized to PEBS) is significantly lower than AutoNUMA’s, and is on par with PTE-scan. This implies NeoMem’s superior ability to identify hot pages accurately and promptly. TPP exhibits the fewest migration counts in most cases, as it promotes pages only after two consecutive hint-faults. First-touch NUMA performs the worst among all baseline solutions, primarily due to its absence of promotion. PEBS demonstrates fewer promotions than NeoMem in the majority of cases, this suggests that its sampling-based tracking has low coverage and is prone to missing a large number of hot pages.
CPU Overhead of NeoMem. As NeoMem offloads memory profiling to dedicated hardware, the host CPU only has to retrieve data from NeoProf, which has minimal overhead. To demonstrate this, we conduct an experiment where we disabled migration but enable profiling based on NeoProf. We then evaluate the slowdown on the GUPS benchmark relative to a baseline system where NeoProf is disabled. After several trials, we observe a mere 0.021% slowdown.
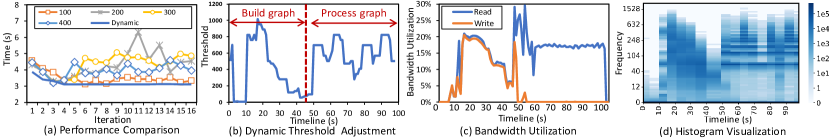
Effectiveness of the Migration Policy. To demonstrate the effectiveness of our NeoMem policy introduced in Section V-A, we compare it to the naive fixed-threshold policy. We consider the Page-Rank workload processing a graph through sixteen iterations. In each iteration, the execution time is recorded. We compare NeoMem’s dynamic threshold policy with fixed thresholds ().
As depicted in Figure 14-(a), the dynamic threshold policy employed by NeoMem (the dark blue line) consistently results in the shortest execution times across these iterations. Fixed thresholds, for example, , suffer from an obvious slowdown after the -th iteration. This outcome demonstrates the effectiveness and necessity of a dynamic scheduling policy.
Figure 14-(b) illustrates the evolving hotness threshold during Page-Rank testing. The threshold is dynamically adjusted from 1 to 1000, with initial low settings and rapid increases (50s to 100s) in response to runtime conditions.
In Figure 14-(c), we plot the runtime read/write bandwidth profiled by NeoProf. We can observe that during the initial graph processing phase (around 40s), high bandwidth utilization prompts NeoMem to set a low threshold (as seen in Figure 14-(b)), promoting more pages and effectively reducing CXL memory bandwidth utilization.
Figure 14-(d) visualizes the evolving access frequency histogram profiled by NeoProf. Every 5 seconds, the profiled histogram is plotted as the vertical strip. The darker regions represent that more pages have this page-access frequency. The distribution of dark regions appears to correspond closely with the fluctuations observed in Figure 14-(b). This suggests that hotness threshold is properly set according to the runtime page access frequency distribution.
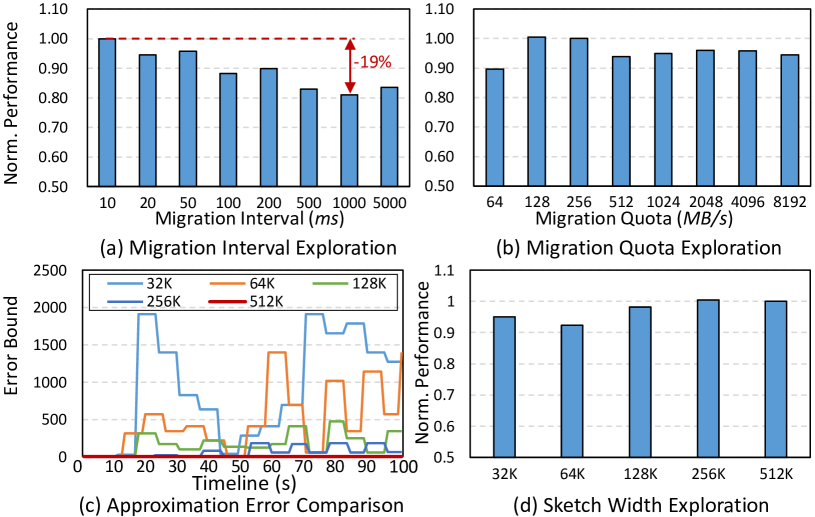
Sensitivity to System Parameters. We investigate the impact of migration_interval (the period at which NeoMem retrieves hot pages from NeoProf and does promotion) and migration quota ( in Sec. V-A) on system performance.
Migration Interval. In Figure 15-(a), we vary the migration interval from 10ms to 5000ms and assess its effect on the Page-Rank benchmark. A shorter migration interval generally results in better performance, as it enables more timely detection and migration of hot pages. Achieving a short migration interval requires a memory profiling technique with high time resolution and low overhead, highlighting NeoProf’s advantages. In comparison, PTE-scan based methods can only support second-level hot page detection and migration [57, 30].
Migration Quota. In Figure 15-(b), we vary the migration quota from 64MB/s to 8192MB/s and evaluate its impact on performance. We find that a 64MB/s migration quota results in a 10% lower performance compared to 128MB/s or 256MB/s. Increasing the migration quota further slightly hampers overall performance due to heightened migration aggressiveness.
Sensitivity to NeoProf Parameters.We evaluate NeoMem’s sensitivity to NeoProf’s hardware configurations, specifically sketch width () and sketch lanes (). We find that using a single lane () results in a minor decrease in end-to-end performance. However, increasing beyond 2 does not improve performance obviously. Consequently, we empirically choose to maintain at 2 in our prototype. We then vary the parameter from 32K to 512K and plot both the error-bound curve, calculated using the algorithm in Section IV, and the system performance using the Page-Rank benchmark. As shown in Figure 15-(c), increasing the sketch width () dramatically reduces the error-bound, which is constantly zero when the sketch width reaches 512K. Concurrently, system performance improves with the increasing of sketch width, peaking when is set at 256K, as shown in Figure 15-(d). Our prototype adopts to ensure a sufficiently low error bound and high performance.
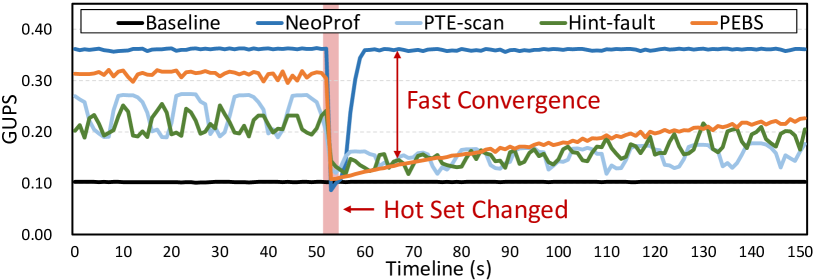
Convergence Analysis on GUPS. To examine how the low overhead and high resolution/accuracy advantages of NeoMem contribute to improved performance, we perform a convergence analysis using the GUPS microbenchmark. In this experiment, we confine 90% of memory access to a fixed memory region, while the remaining 10% of memory access uniformly falls in the whole working set. For each method we warm up the system for 600s to reach a convergence. Then we suddenly change the location of the hot set to evaluate the convergence speed of different methods.
As shown in Figure 16, we plot the GUPS (giga updates per second, higher is better) of NeoProf and other baselines over time. NeoProf shows the highest GUPS in the converged state (0-50s), indicating that it accurately classifies the hot pages and cold pages, avoiding unnecessary page migration. The smooth curve of NeoProf also reveals that NeoProf has a low overhead. After the hot set change at about 50s, NeoProf shows the fastest converge speed, indicating that NeoProf quickly identifies hot pages and migrates them to local memory, thanks to the high time resolution and space resolution.
Unlike NeoProf, other memory profiling mechanisms fail to achieve comparable performance. Both PTE-scan and Hint fault monitoring suffer from the the periodical scanning overhead, as the obvious fluctuation of GUPS curves. All the three baselines converge far slower than NeoProf due to their inherent coarse profiling granularity and inaccurate memory access information gained from profiling.
VII Discussion & Future Work
Evaluation on ASIC-based CXL Memory. Current CXL memory-tiering solutions like TPP [53] employ NUMA-based emulation, assuming a 170-250ns latency—lower than our paper’s assumption. This discrepancy is partly attributed to Intel’s FPGA implementation. However, NeoMem’s efficacy persists even in lower-latency situations, as NeoMem is superior to TPP according to our experiments. Evaluations on ASIC-based CXL memory are reserved for future research.
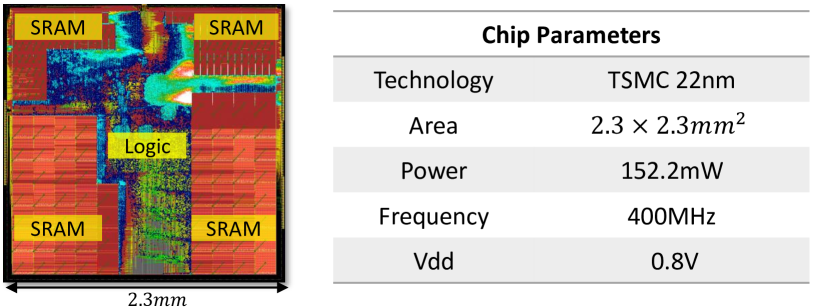
Hardware Overhead Estimation. To estimate the hardware cost of integrating NeoProf into CXL controllers, we also evaluate the area and power overheads of NeoProf using EDA tools. Figure 17 illustrates the layout and parameters of NeoProf co-processor. This implementation of NeoProf utilizes the TSMC 22nm technology node, with sketch parameters set at , a sweet-point demonstrated in Figure 15-(d). The resulting design occupies an area of approximately 5.3 and consumes 152.2 of power, which is lightweight for integration into device-side controllers.
Virtualization Support. In cloud environments based on virtual machines, NeoMem can be integrated into the host OS. The host OS identifies hot physical pages through the NeoMem daemon and executes hot page promotion. Following hot page migration, the Enhanced Page Table (EPT) of the guest virtual machines will undergo remapping [65]. Evaluation in virtualized environments is planned for our future work.
Huge Page Support. In current implementations of NeoMem and baselines, transparent huge page is disabled for simplicity. Note that NeoProf is orthogonal to earlier memory tiering methods based on huge pages, which profile memory access at the base-page level [5, 44]. We plan to evaluate the integration of NeoProf with such methods in future work.
Scalability Evaluation. In our current prototyping system, we are constrained by a single 16GB CXL memory device due to hardware limitations. Also, we only evaluate NeoMem’s performance on a two-tiered memory system. For our future work, we plan to conduct evaluations on larger-scale systems featuring multiple CXL devices and larger memory capacities with more than two tiers. Note that NeoProf’s memory profiling capabilities are not restricted by memory size, and the profiling throughput should linearly scale with the addition of more CXL memory devices equipped with NeoProf.
Memory Interleaving. In systems equipped with multiple CXL memory devices, memory interleaving is often employed. A single physical page can be distributed o interleaved among multiple devices. Under such circumstances, the NeoProf feature of each device only profiles a specific fraction of each page. As a result, the host system may need to gather this fragmented information from all devices and conduct additional post-processing tasks like de-duplication.
VIII Related Work
VIII-A Efficient Algorithms for Data Stream Analysis
Analysing huge data streams (e.g., page-access streams) necessitates efficient algorithms to ensure real-time and cost-effective. Probabilistic algorithms have been extensively employed to solve various tasks such as identifying the presence of specific items, exemplified by the Bloom Filter [76] and Counting Bloom Filter [77]. They are also used to identify unique elements, as demonstrated by the HyperLogLog algorithm [22], and to estimate item frequencies, as shown by the Sketch algorithms [18, 81, 27, 80, 46]. In this study, we treat hot page detection as a problem of identifying “heavy hitters” in memory access streams, a task for which the Count-Min Sketch algorithms are particularly well-suited [18]. Recent studies have introduced FPGA-based Sketch acceleration [70, 37, 38, 64], which however have not touched the crucial issue of accurate error-bound estimation in practice.
VIII-B Software-based Tiered Memory System
Software-based tiered memory systems have seen extensive research in techniques related to page access profiling [65, 30, 15, 21, 5, 43], page classification [30, 44, 57, 41, 52], and efficient page migration [79, 62]. These methods, however, are hindered by limited memory access profiling capabilities, as demonstrated in our work. An alternative approach involves managing memory objects directly at the application [31, 48, 59, 73, 2, 3] or library [40, 20, 54, 78, 75] level, but these require modifications to users’ applications or libraries. Our NeoMem solution, proposed as a hardware-OS co-design approach, offers a practical resolution to these challenges.
VIII-C Architecture Support for Memory Tiering
Besides software-based approaches, previous works have also optimized heterogeneous memory systems from an architectural standpoint. MemPod [55] is a related proposal that uses the Majority Element Algorithm (MEA) to identify hot pages but assumes management of both slow and fast memory by the same hardware, which differs from the current CXL memory system. Similar approaches like CAMEO [16], PoM [66], and SILC-FM [63] treat fast memory as a hardware-managed cache for slow memory. A recent work, HoPP [45], suggests modifying CPU memory controllers to track memory accesses and provide information to the OS, resembling PMU monitoring methods. However, these approaches necessitate costly CPU-side modifications. In contrast, NeoMem is a “CXL-native” solution, limiting hardware modifications to the CXL memory side and avoiding expensive CPU-side upgrades.
IX Conclusion
In this paper, we introduce NeoMem, a novel memory-tiering technique designed for CXL-based heterogeneous memory systems. NeoMem embodies a hardware-OS co-design philosophy, with the integration of a dedicated hardware profiler called NeoProf into the controllers of CXL memory. This enables the OS to access profiled information and execute efficient hot page migration based on a customized migration policy. Comprehensive evaluation on a real CXL memory platform demonstrates that NeoMem achieves a geomean speedup ranging from 32% to 67% across various existing memory tiering solutions.
References
- [1] “Gups,” http://icl.cs.utk.edu/projectsfiles/hpcc/RandomAccess/.
- [2] “Memkind,” https://memkind.github.io/memkind/, 2021.
- [3] “Persistent memory programming,” http://pmem.io/, 2017.
- [4] R. Achermann and A. Panwar, “Mitosis workload btree,” http://icl.cs.utk.edu/ projectsfiles/hpcc/RandomAccess/, 2019.
- [5] N. Agarwal and T. F. Wenisch, “Thermostat: Application-transparent page management for two-tiered main memory,” in Proceedings of the Twenty-Second International Conference on Architectural Support for Programming Languages and Operating Systems, 2017, pp. 631–644.
- [6] H. Al Maruf and M. Chowdhury, “Effectively prefetching remote memory with leap,” in 2020 USENIX Annual Technical Conference (USENIX ATC 20), 2020, pp. 843–857.
- [7] M. Arif, A. Maurya, and M. M. Rafique, “Accelerating performance of gpu-based workloads using cxl,” in Proceedings of the 13th Workshop on AI and Scientific Computing at Scale using Flexible Computing, 2023, pp. 27–31.
- [8] V. Banakar, K. Wu, Y. Patel, K. Keeton, A. C. Arpaci-Dusseau, and R. H. Arpaci-Dusseau, “Wiscsort: External sorting for byte-addressable storage,” arXiv preprint arXiv:2307.06476, 2023.
- [9] S. Beamer, K. Asanović, and D. Patterson, “The gap benchmark suite,” arXiv preprint arXiv:1508.03619, 2015.
- [10] S. Bergman, P. Faldu, B. Grot, L. Vilanova, and M. Silberstein, “Reconsidering os memory optimizations in the presence of disaggregated memory,” in Proceedings of the 2022 ACM SIGPLAN International Symposium on Memory Management, 2022, pp. 1–14.
- [11] D. Boles, D. Waddington, and D. A. Roberts, “Cxl-enabled enhanced memory functions,” IEEE Micro, vol. 43, no. 2, pp. 58–65, 2023.
- [12] I. Calciu, M. T. Imran, I. Puddu, S. Kashyap, H. A. Maruf, O. Mutlu, and A. Kolli, “Rethinking software runtimes for disaggregated memory,” in Proceedings of the 26th ACM International Conference on Architectural Support for Programming Languages and Operating Systems, 2021, pp. 79–92.
- [13] P. Chen, Y. Wu, T. Yang, J. Jiang, and Z. Liu, “Precise error estimation for sketch-based flow measurement,” in Proceedings of the 21st ACM Internet Measurement Conference, 2021, pp. 113–121.
- [14] A. Cho, A. Saxena, M. Qureshi, and A. Daglis, “A case for cxl-centric server processors,” arXiv preprint arXiv:2305.05033, 2023.
- [15] J. Choi, S. Blagodurov, and H.-W. Tseng, “Dancing in the dark: Profiling for tiered memory,” in 2021 IEEE International Parallel and Distributed Processing Symposium (IPDPS). IEEE, 2021, pp. 13–22.
- [16] C. C. Chou, A. Jaleel, and M. K. Qureshi, “Cameo: A two-level memory organization with capacity of main memory and flexibility of hardware-managed cache,” in 2014 47th Annual IEEE/ACM International Symposium on Microarchitecture. IEEE, 2014, pp. 1–12.
- [17] J. Corbet, “Autonuma: the other approach to numa scheduling,” LWN. net, 2012.
- [18] G. Cormode and S. Muthukrishnan, “An improved data stream summary: the count-min sketch and its applications,” Journal of Algorithms, vol. 55, no. 1, pp. 58–75, 2005.
- [19] I. Corporation, “Intel® fpga compute express link (cxl) ip,” https://www.intel.com/content/www/us/en/products/details/fpga/intellectual-property/interface-protocols/cxl-ip.html, 2024.
- [20] S. R. Dulloor, A. Roy, Z. Zhao, N. Sundaram, N. Satish, R. Sankaran, J. Jackson, and K. Schwan, “Data tiering in heterogeneous memory systems,” in Proceedings of the Eleventh European Conference on Computer Systems, 2016, pp. 1–16.
- [21] P. Duraisamy, W. Xu, S. Hare, R. Rajwar, D. Culler, Z. Xu, J. Fan, C. Kennelly, B. McCloskey, D. Mijailovic, B. Morris, C. Mukherjee, J. Ren, G. Thelen, P. Turner, C. Villavieja, P. Ranganathan, and A. Vahdat, “Towards an adaptable systems architecture for memory tiering at warehouse-scale,” in Proceedings of the 28th ACM International Conference on Architectural Support for Programming Languages and Operating Systems, Volume 3, ser. ASPLOS 2023. New York, NY, USA: Association for Computing Machinery, 2023, p. 727–741. [Online]. Available: https://doi.org/10.1145/3582016.3582031
- [22] P. Flajolet et al., “Hyperloglog: the analysis of a near-optimal cardinality estimation algorithm,” in Discrete mathematics & theoretical computer science Proceedings, 2007.
- [23] C. foundation, “Cxl 3.0 specification,” https://www.computeexpresslink.org/download-the-specification, 2022.9.
- [24] Y. Gan, Y. Zhang, D. Cheng, A. Shetty, P. Rathi, N. Katarki, A. Bruno, J. Hu, B. Ritchken, B. Jackson et al., “An open-source benchmark suite for microservices and their hardware-software implications for cloud & edge systems,” in Proceedings of the Twenty-Fourth International Conference on Architectural Support for Programming Languages and Operating Systems, 2019, pp. 3–18.
- [25] J. Gandhi, A. Basu, M. D. Hill, and M. M. Swift, “Badgertrap: A tool to instrument x86-64 tlb misses,” ACM SIGARCH Computer Architecture News, vol. 42, no. 2, pp. 20–23, 2014.
- [26] D. Gouk, S. Lee, M. Kwon, and M. Jung, “Direct access,High-Performance memory disaggregation with DirectCXL,” in 2022 USENIX Annual Technical Conference (USENIX ATC 22), 2022, pp. 287–294.
- [27] A. Goyal and H. Daumé, “Lossy conservative update (lcu) sketch: Succinct approximate count storage,” in Proceedings of the AAAI Conference on Artificial Intelligence, vol. 25, no. 1, 2011, pp. 878–883.
- [28] J. Gu, Y. Lee, Y. Zhang, M. Chowdhury, and K. G. Shin, “Efficient memory disaggregation with infiniswap,” in 14th USENIX Symposium on Networked Systems Design and Implementation (NSDI 17), 2017, pp. 649–667.
- [29] M. Ha, J. Ryu, J. Choi, K. Ko, S. Kim, S. Hyun, D. Moon, B. Koh, H. Lee, M. Kim, H. Kim, and K. Park, “Dynamic capacity service for improving cxl pooled memory efficiency,” IEEE Micro, vol. 43, no. 2, pp. 39–47, 2023.
- [30] T. Heo, Y. Wang, W. Cui, J. Huh, and L. Zhang, “Adaptive page migration policy with huge pages in tiered memory systems,” IEEE Transactions on Computers, vol. 71, no. 1, pp. 53–68, 2022.
- [31] M. Hildebrand, J. Khan, S. Trika, J. Lowe-Power, and V. Akella, “Autotm: Automatic tensor movement in heterogeneous memory systems using integer linear programming,” in Proceedings of the Twenty-Fifth International Conference on Architectural Support for Programming Languages and Operating Systems, 2020, pp. 875–890.
- [32] S. Hynix, “Sk hynix cxl memory,” https://news.skhynix.com/sk-hynix-develops-ddr5-dram-cxltm-memory-to-expand-the-cxl-memory-ecosystem, 2022.9.
- [33] J. Jang, H. Choi, H. Bae, S. Lee, M. Kwon, and M. Jung, “CXL-ANNS:Software-Hardware collaborative memory disaggregation and computation for Billion-Scale approximate nearest neighbor search,” in 2023 USENIX Annual Technical Conference (USENIX ATC 23), 2023, pp. 585–600.
- [34] X. Jin, X. Li, H. Zhang, R. Soulé, J. Lee, N. Foster, C. Kim, and I. Stoica, “Netcache: Balancing key-value stores with fast in-network caching,” in Proceedings of the 26th Symposium on Operating Systems Principles, 2017, pp. 121–136.
- [35] T. Johnson and D. Shasha, “2q: A low overhead high performance buffer management replacement algorithm,” in Proceedings of the 20th International Conference on Very Large Data Bases, ser. VLDB ’94. San Francisco, CA, USA: Morgan Kaufmann Publishers Inc., 1994, p. 439–450.
- [36] S. Kannan, A. Gavrilovska, V. Gupta, and K. Schwan, “Heteroos: Os design for heterogeneous memory management in datacenter,” SIGARCH Comput. Archit. News, vol. 45, no. 2, p. 521–534, jun 2017. [Online]. Available: https://doi.org/10.1145/3140659.3080245
- [37] M. Kiefer, I. Poulakis, S. Breß, and V. Markl, “Scotch: Generating fpga-accelerators for sketching at line rate,” Proceedings of the VLDB Endowment, vol. 14, no. 3, pp. 281–293, 2020.
- [38] M. Kiefer, I. Poulakis, E. T. Zacharatou, and V. Markl, “Optimistic data parallelism for fpga-accelerated sketching,” Proceedings of the VLDB Endowment, vol. 16, no. 5, pp. 1113–1125, 2023.
- [39] J. Kim, W. Choe, and J. Ahn, “Exploring the design space of page management for Multi-Tiered memory systems,” in 2021 USENIX Annual Technical Conference (USENIX ATC 21), 2021, pp. 715–728.
- [40] K. Kim, H. Kim, J. So, W. Lee, J. Im, S. Park, J. Cho, and H. Song, “SMT: software-defined memory tiering for heterogeneous computing systems with CXL memory expander,” IEEE Micro, vol. 43, no. 2, pp. 20–29, 2023. [Online]. Available: https://doi.org/10.1109/MM.2023.3240774
- [41] K. Koh, K. Kim, S. Jeon, and J. Huh, “Disaggregated cloud memory with elastic block management,” IEEE Transactions on Computers, vol. 68, no. 1, pp. 39–52, 2019.
- [42] M. Kwon, S. Lee, and M. Jung, “Cache in hand: Expander-driven cxl prefetcher for next generation cxl-ssd,” in Proceedings of the 15th ACM Workshop on Hot Topics in Storage and File Systems, 2023, pp. 24–30.
- [43] T. Lee and Y. I. Eom, “Optimizing the page hotness measurement with re-fault latency for tiered memory systems,” in 2022 IEEE International Conference on Big Data and Smart Computing (BigComp), 2022, pp. 275–279.
- [44] T. Lee, S. K. Monga, C. Min, and Y. I. Eom, “Memtis: Efficient memory tiering with dynamic page classification and page size determination,” in Proceedings of the 29th Symposium on Operating Systems Principles, 2023, pp. 17–34.
- [45] H. Li, K. Liu, T. Liang, Z. Li, T. Lu, H. Yuan, Y. Xia, Y. Bao, M. Chen, and Y. Shan, “Hopp: Hardware-software co-designed page prefetching for disaggregated memory,” in 2023 IEEE International Symposium on High-Performance Computer Architecture (HPCA). IEEE, 2023, pp. 1168–1181.
- [46] H. Li, Q. Chen, Y. Zhang, T. Yang, and B. Cui, “Stingy sketch: a sketch framework for accurate and fast frequency estimation,” Proceedings of the VLDB Endowment, vol. 15, no. 7, pp. 1426–1438, 2022.
- [47] H. Li, D. S. Berger, L. Hsu, D. Ernst, P. Zardoshti, S. Novakovic, M. Shah, S. Rajadnya, S. Lee, I. Agarwal, M. D. Hill, M. Fontoura, and R. Bianchini, “Pond: Cxl-based memory pooling systems for cloud platforms,” in Proceedings of the 28th ACM International Conference on Architectural Support for Programming Languages and Operating Systems, Volume 2, ASPLOS 2023, Vancouver, BC, Canada, March 25-29, 2023, T. M. Aamodt, N. D. E. Jerger, and M. M. Swift, Eds. ACM, 2023, pp. 574–587. [Online]. Available: https://doi.org/10.1145/3575693.3578835
- [48] Z. Li and M. Wu, “Transparent and lightweight object placement for managed workloads atop hybrid memories,” in Proceedings of the 18th ACM SIGPLAN/SIGOPS International Conference on Virtual Execution Environments, ser. VEE 2022. New York, NY, USA: Association for Computing Machinery, 2022, p. 72–80. [Online]. Available: https://doi.org/10.1145/3516807.3516822
- [49] Linux, “Automatic numa balancing,” https://www.linux-kvm.org/images/7/75/01x07b-NumaAutobalancing.pdf.
- [50] Linux, “Damon: Data access monitor,” https://docs.kernel.org/mm/damon/index.html.
- [51] Linux, “Linux memmap command for reserving physical memory,” https://www.kernel.org/doc/html/v5.16/admin-guide/kernel-parameters.html.
- [52] A. Maruf, A. Ghosh, J. Bhimani, D. Campello, A. Rudoff, and R. Rangaswami, “Multi-clock: Dynamic tiering for hybrid memory systems,” in 2022 IEEE International Symposium on High-Performance Computer Architecture (HPCA), 2022, pp. 925–937.
- [53] H. A. Maruf, H. Wang, A. Dhanotia, J. Weiner, N. Agarwal, P. Bhattacharya, C. Petersen, M. Chowdhury, S. O. Kanaujia, and P. Chauhan, “TPP: transparent page placement for cxl-enabled tiered-memory,” in Proceedings of the 28th ACM International Conference on Architectural Support for Programming Languages and Operating Systems, Volume 3, ASPLOS 2023, Vancouver, BC, Canada, March 25-29, 2023, T. M. Aamodt, N. D. E. Jerger, and M. M. Swift, Eds. ACM, 2023, pp. 742–755. [Online]. Available: https://doi.org/10.1145/3582016.3582063
- [54] D.-J. Oh, Y. Moon, D. K. Ham, T. J. Ham, Y. Park, J. W. Lee, J. H. Ahn, and E. Lee, “Maphea: A framework for lightweight memory hierarchy-aware profile-guided heap allocation,” ACM Trans. Embed. Comput. Syst., vol. 22, no. 1, dec 2022. [Online]. Available: https://doi.org/10.1145/3527853
- [55] A. Prodromou, M. Meswani, N. Jayasena, G. Loh, and D. M. Tullsen, “Mempod: A clustered architecture for efficient and scalable migration in flat address space multi-level memories,” in 2017 IEEE International Symposium on High Performance Computer Architecture (HPCA), 2017, pp. 433–444.
- [56] M. Ramakrishna, E. Fu, and E. Bahcekapili, “Efficient hardware hashing functions for high performance computers,” IEEE Transactions on Computers, vol. 46, no. 12, pp. 1378–1381, 1997.
- [57] A. Raybuck, T. Stamler, W. Zhang, M. Erez, and S. Peter, “Hemem: Scalable tiered memory management for big data applications and real nvm,” in Proceedings of the ACM SIGOPS 28th Symposium on Operating Systems Principles, 2021, pp. 392–407.
- [58] Redis, “Redis data base,” https://github.com/redis/redis, 2023.10.
- [59] J. Ren, J. Luo, K. Wu, M. Zhang, H. Jeon, and D. Li, “Sentinel: Efficient tensor migration and allocation on heterogeneous memory systems for deep learning,” in 2021 IEEE International Symposium on High-Performance Computer Architecture (HPCA), 2021, pp. 598–611.
- [60] J. Ren, D. Xu, I. Peng, J. Ryu, K. Shin, D. Kim, and D. Li, “Hm-keeper: Scalable page management for multi-tiered large memory systems,” arXiv preprint arXiv:2302.09468, 2023.
- [61] J. Ren, D. Xu, I. Peng, J. Ryu, K. Shin, D. Kim, and D. Li, “Rethinking memory profiling and migration for multi-tiered large memory systems,” 2023.
- [62] J. H. Ryoo, L. K. John, and A. Basu, “A case for granularity aware page migration,” in Proceedings of the 2018 International Conference on Supercomputing, 2018, pp. 352–362.
- [63] J. H. Ryoo, M. R. Meswani, A. Prodromou, and L. K. John, “Silc-fm: Subblocked interleaved cache-like flat memory organization,” in 2017 IEEE International Symposium on High Performance Computer Architecture (HPCA). IEEE, 2017, pp. 349–360.
- [64] A. Saavedra, C. Hernández, and M. Figueroa, “Heavy-hitter detection using a hardware sketch with the countmin-cu algorithm,” in 2018 21st Euromicro Conference on Digital System Design (DSD). IEEE, 2018, pp. 38–45.
- [65] S. Sha, C. Li, Y. Luo, X. Wang, and Z. Wang, “vtmm: Tiered memory management for virtual machines,” in Proceedings of the Eighteenth European Conference on Computer Systems, 2023, pp. 283–297.
- [66] J. Sim, A. R. Alameldeen, Z. Chishti, C. Wilkerson, and H. Kim, “Transparent hardware management of stacked dram as part of memory,” in 2014 47th Annual IEEE/ACM International Symposium on Microarchitecture. IEEE, 2014, pp. 13–24.
- [67] J. Sim, S. Ahn, T. Ahn, S. Lee, M. Rhee, J. Kim, K. Shin, D. Moon, E. Kim, and K. Park, “Computational cxl-memory solution for accelerating memory-intensive applications,” IEEE Computer Architecture Letters, vol. 22, no. 1, pp. 5–8, 2022.
- [68] Sumsung, “Expanding the limits of memory bandwidth and density: Samsung’s cxl dram memory expander,” https://semiconductor.samsung.com/newsroom/tech-blog/expanding-the-limits-of-memory-bandwidth-and-density-samsungs-cxl-dram-memory-expander/, 2022.9.
- [69] Y. Sun, Y. Yuan, Z. Yu, R. Kuper, I. Jeong, R. Wang, and N. S. Kim, “Demystifying CXL memory with genuine cxl-ready systems and devices,” CoRR, vol. abs/2303.15375, 2023. [Online]. Available: https://doi.org/10.48550/arXiv.2303.15375
- [70] D. Tong and V. K. Prasanna, “Sketch acceleration on fpga and its applications in network anomaly detection,” IEEE Transactions on Parallel and Distributed Systems, vol. 29, no. 4, pp. 929–942, 2017.
- [71] J. R. Tramm, A. R. Siegel, T. Islam, and M. Schulz, “XSBench - the development and verification of a performance abstraction for Monte Carlo reactor analysis,” in PHYSOR 2014 - The Role of Reactor Physics toward a Sustainable Future, Kyoto, 2014. [Online]. Available: https://www.mcs.anl.gov/papers/P5064-0114.pdf
- [72] S. Tu, W. Zheng, E. Kohler, B. Liskov, and S. Madden, “Speedy transactions in multicore in-memory databases,” in Proceedings of the Twenty-Fourth ACM Symposium on Operating Systems Principles, 2013, pp. 18–32.
- [73] C. Wang, H. Cui, T. Cao, J. Zigman, H. Volos, O. Mutlu, F. Lv, X. Feng, and G. H. Xu, “Panthera: Holistic memory management for big data processing over hybrid memories,” in Proceedings of the 40th ACM SIGPLAN Conference on Programming Language Design and Implementation, ser. PLDI 2019. New York, NY, USA: Association for Computing Machinery, 2019, p. 347–362. [Online]. Available: https://doi.org/10.1145/3314221.3314650
- [74] V. M. Weaver et al., “Advanced hardware profiling and sampling (pebs, ibs, etc.): creating a new papi sampling interface,” Technical Report UMAINE-VMWTR-PEBS-IBS-SAMPLING-2016-08. University of Maine, Tech. Rep., 2016.
- [75] W. Wei, D. Jiang, S. A. McKee, J. Xiong, and M. Chen, “Exploiting program semantics to place data in hybrid memory,” in 2015 International Conference on Parallel Architecture and Compilation (PACT), 2015, pp. 163–173.
- [76] WikiPedia, “Bloom filter,” https://en.wikipedia.org/wiki/Bloom_filter.
- [77] WikiPedia, “Counting bloom filter,” https://en.wikipedia.org/wiki/Counting_Bloom_filter.
- [78] K. Wu, Y. Huang, and D. Li, “Unimem: Runtime data managementon non-volatile memory-based heterogeneous main memory,” in Proceedings of the International Conference for High Performance Computing, Networking, Storage and Analysis, ser. SC ’17. New York, NY, USA: Association for Computing Machinery, 2017. [Online]. Available: https://doi.org/10.1145/3126908.3126923
- [79] Z. Yan, D. Lustig, D. Nellans, and A. Bhattacharjee, “Nimble page management for tiered memory systems,” in Proceedings of the Twenty-Fourth International Conference on Architectural Support for Programming Languages and Operating Systems, 2019, pp. 331–345.
- [80] T. Yang, J. Jiang, P. Liu, Q. Huang, J. Gong, Y. Zhou, R. Miao, X. Li, and S. Uhlig, “Elastic sketch: Adaptive and fast network-wide measurements,” in Proceedings of the 2018 Conference of the ACM Special Interest Group on Data Communication, 2018, pp. 561–575.
- [81] T. Yang, Y. Zhou, H. Jin, S. Chen, and X. Li, “Pyramid sketch: A sketch framework for frequency estimation of data streams,” Proceedings of the VLDB Endowment, vol. 10, no. 11, pp. 1442–1453, 2017.
- [82] X. Zhang, Y. Chang, T. Lu, K. Zhang, and M. Chen, “Rethinking design paradigm of graph processing system with a cxl-like memory semantic fabric,” in 2023 IEEE/ACM 23rd International Symposium on Cluster, Cloud and Internet Computing (CCGrid). IEEE, 2023, pp. 25–35.