AIR-HLoc: Adaptive Image Retrieval for Efficient Visual Localisation
Abstract
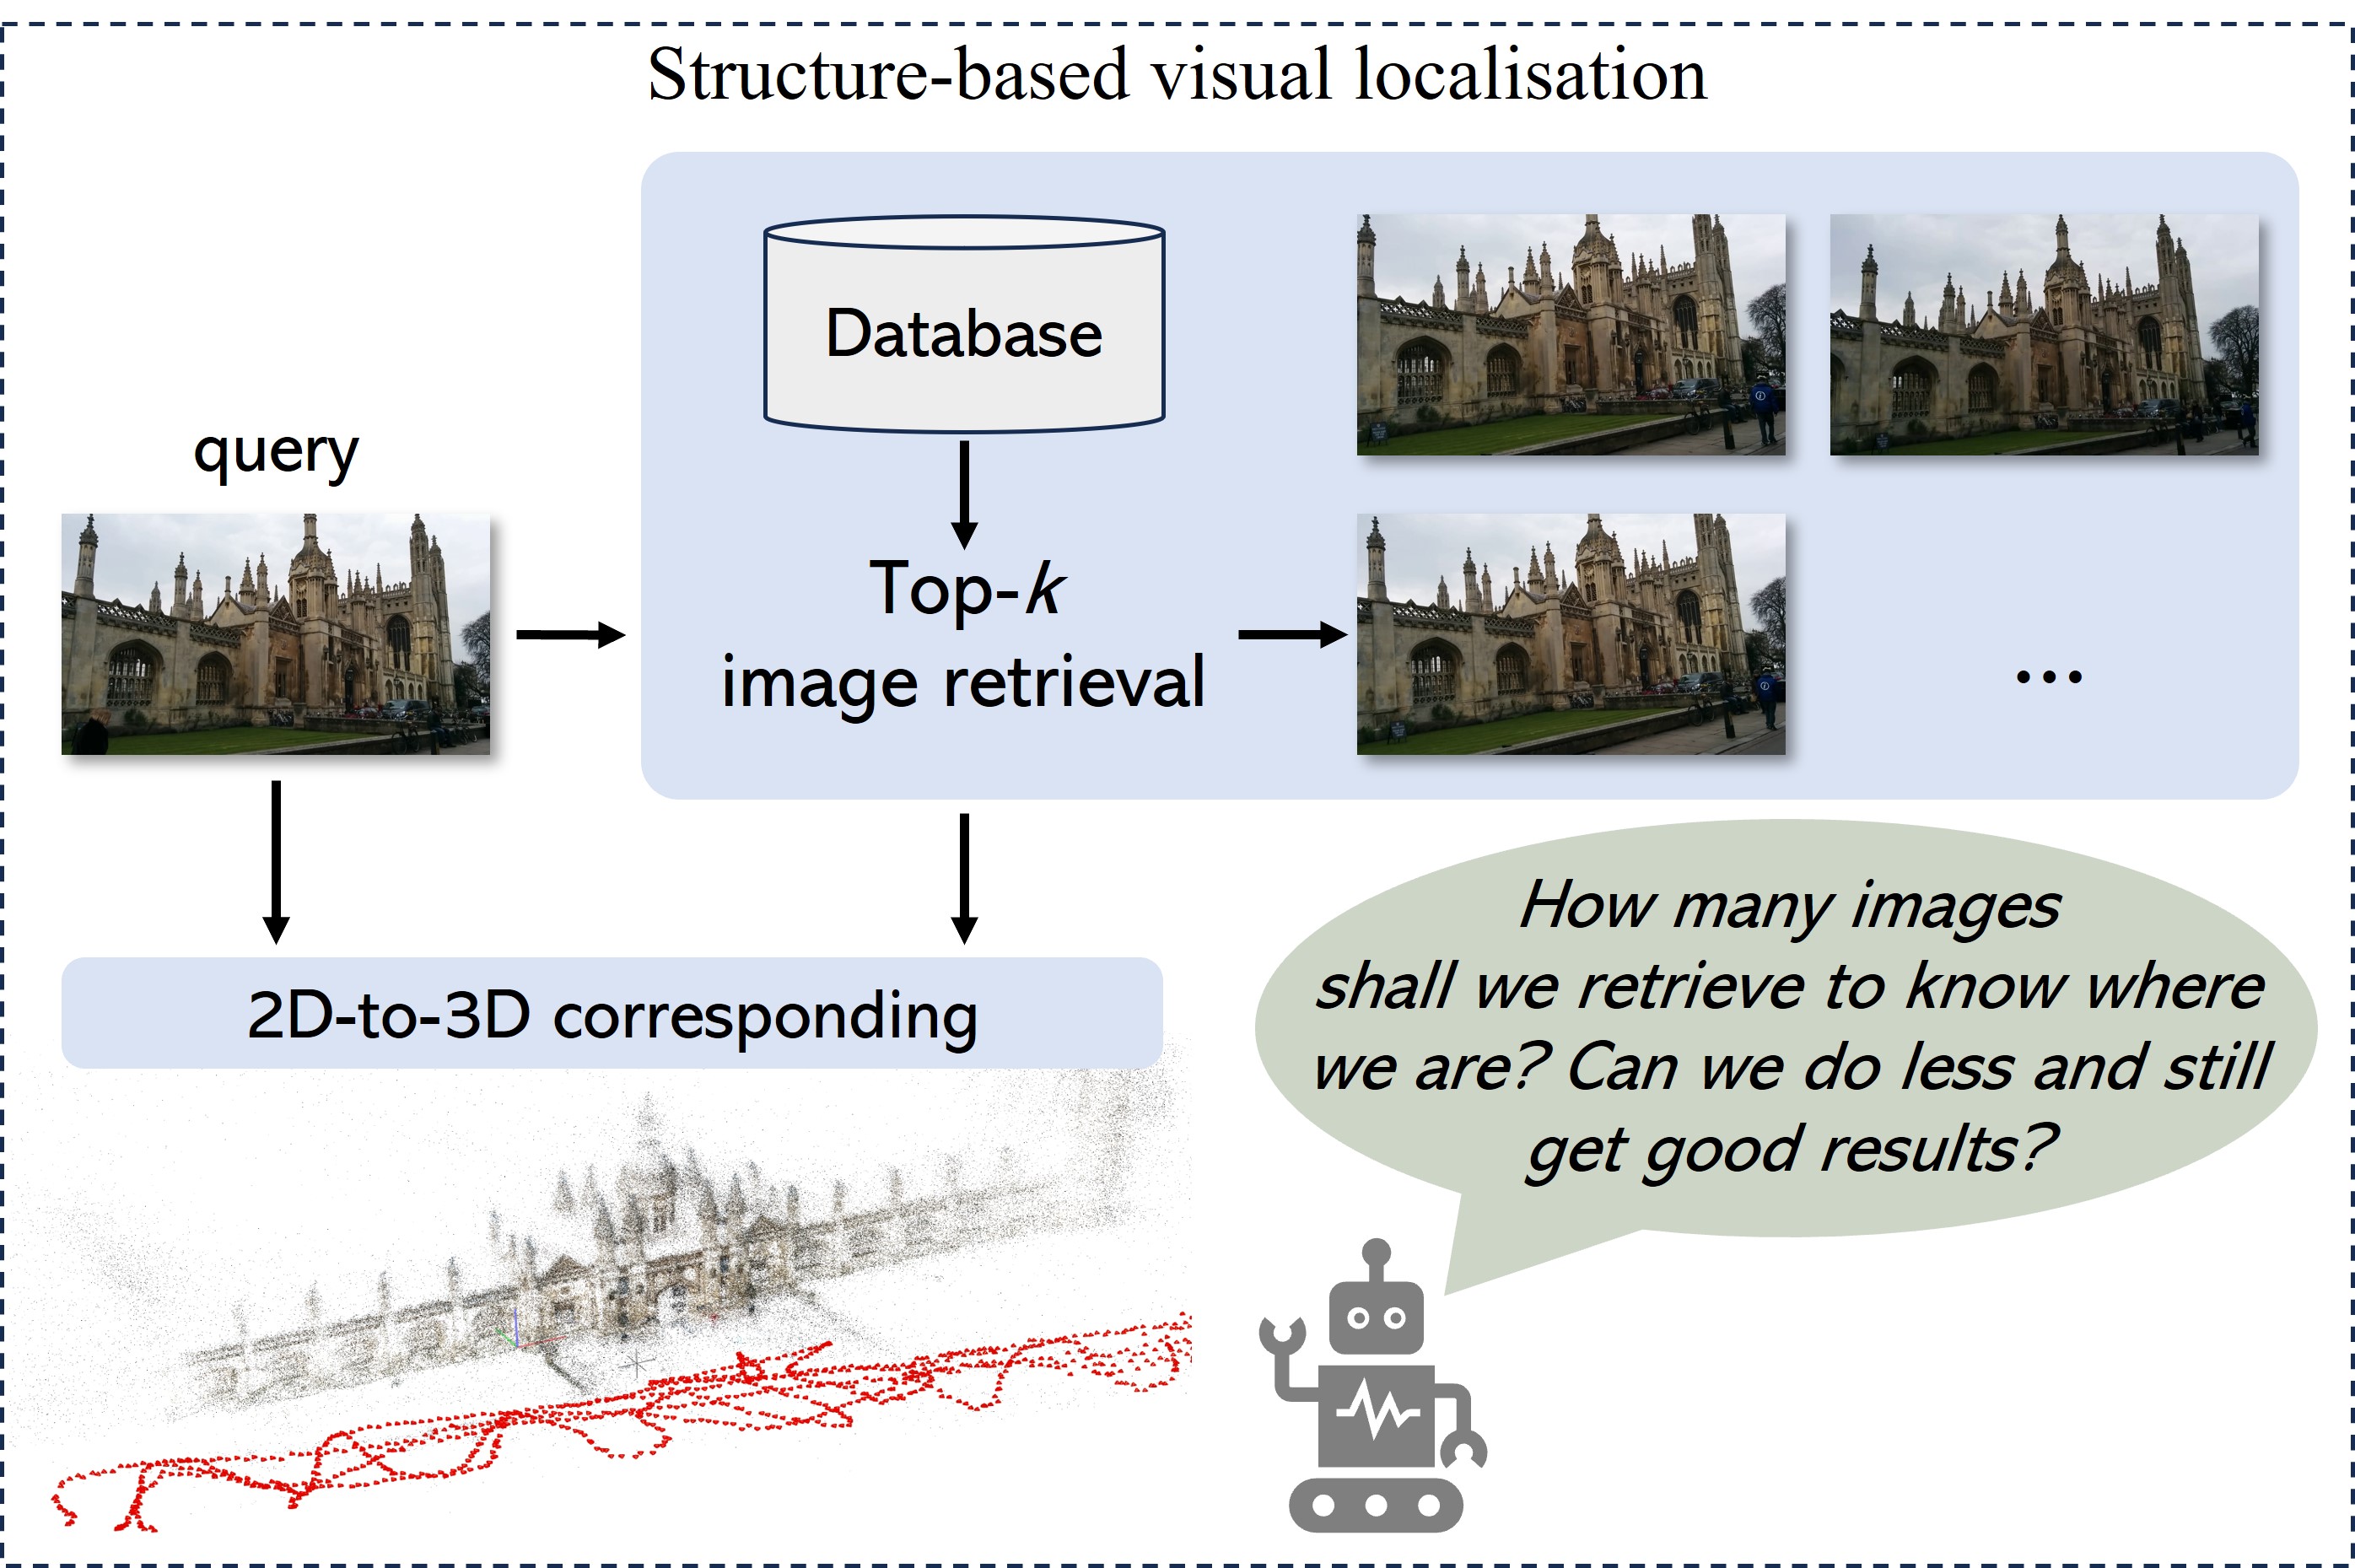
State-of-the-art (SOTA) hierarchical localisation pipelines (HLoc) rely on image retrieval (IR) techniques to establish 2D-3D correspondences by selecting the most similar images from a reference image database for a given query image. Although higher values of enhance localisation robustness, the computational cost for feature matching increases linearly with . In this paper, we observe that queries that are the most similar to images in the database result in a higher proportion of feature matches and, thus, more accurate positioning. Thus, a small number of images is sufficient for queries very similar to images in the reference database. We then propose a novel approach, AIR-HLoc, which divides query images into different localisation difficulty levels based on their similarity to the reference image database. We consider an image with high similarity to the reference image as an easy query and an image with low similarity as a hard query. Easy queries show a limited improvement in accuracy when increasing . Conversely, higher values of significantly improve accuracy for hard queries. Given the limited improvement in accuracy when increasing for easy queries and the significant improvement for hard queries, we adapt the value of to the query’s difficulty level. Therefore, AIR-HLoc optimizes processing time by adaptively assigning different values of based on the similarity between the query and reference images without losing accuracy. Our extensive experiments on the Cambridge Landmarks, 7Scenes, and Aachen Day-Night-v1.1 datasets demonstrate our algorithm’s efficacy, reducing 30%, 26%, and 11% in computational overhead while maintaining SOTA accuracy compared to HLoc with fixed image retrieval.
I INTRODUCTION
Visual localisation systems aim to estimate the 6 degrees of freedom (6DOF) absolute pose for camera query images. Accurate and real-time absolute 6DoF pose estimation is crucial in applications ranging from augmented reality to navigation and decision-making for mobile robots. 3D structure-based methods [1, 2, 3, 4, 5, 6, 7] achieve high accuracy by detecting and matching visual features in query images with a 3D representation of the environment. To reduce the search space in large datasets, typical hierarchical localisation pipelines (HLoc) [3, 7] include an image retrieval module to establish 2D–2D matches between the query image and the top ranked database images. The retrieved images are used to produce 2D-3D correspondences based on a smaller subset of the environment 3D model. Camera pose is finally estimated via RANSAC and Perspective-n-Point (PnP) algorithms [8, 9].
However, these approaches rely on a fixed value for , which is often empirically set as a trade-off between robustness and performance for a specific dataset [10]. A larger provides more potential matches from similar images, thus improving the robustness of localisation for challenging queries and, consequently, the overall positioning accuracy. However, a larger leads to longer processing times for feature matching. It may also introduce noisy matches. On the other hand, a smaller reduces runtime and improves localisation efficiency, but at the cost of decreased localisation accuracy. Previous works [10, 6] recommend selecting a moderate value for , typically between 5 to 20, for all queries. In this paper, we argue that query images present varying levels of difficulty for localisation, depending on their similarity with reference images in the database. Some queries only require a few images, while others need more to reject outliers. Using a fixed value of for all queries is either detrimental to accuracy (small ) or wastes computing power and processing time (large ).
This paper explores how to achieve a better trade-off and setting suitable for different queries in real-life applications with visual localization systems, as shown in Figure 1. To address this issue, given that the global descriptors used by IR methods provide a high-level representation of the image, we calculate the cosine similarity between the global descriptors of the query image and those of the top retrievals as a measure of a scoring mechanism described in Section III-B. The score assigned to a query image reflects its similarity to the images in the reference database. We observe that query images with different scores exhibit varying levels of difficulty for localisation. Higher scores indicate greater similarity and correspond to easier localisation, i.e., only a few images are necessary to establish sufficient 2D-3D correspondences. We propose an adaptive image retrieval (AIR) approach for a hierarchical localisation pipeline, AIR-HLoc. It adaptively determines the required number of retrieved images based on these scores. This approach has two benefits. First, it allows us to retrieve fewer images while maintaining localisation accuracy. Second, the score of each query reflects the uncertainty of pose estimation.
We summarize our main contributions as follows:
-
1.
We first analyze the contribution to match ratio of retrieved images with different cosine similarities. We conduct analysis of query and database images on indoor and outdoor datasets using three mainstream IR models, which reveals that more similar images yield a higher proportion of matches.
-
2.
We then propose to use the cosine similarity of global descriptors to grade the localisation difficulty of queries. We propose an adaptive image retrieval (AIR) approach for a hierarchical localisation pipeline. For an easy query, we retrieve fewer images, and for a hard query, we retrieve more images.
-
3.
Our AIR-HLoc reduces the average matching cost of all queries by 30%, 26%, and 10% on three different datasets, respectively, while maintaining the SOTA accuracy. On the Cambridge dataset, the average runtime of all queries is reduced by 360 ms to 720 ms when . For easy queries, AIR-HLoc reduces runtime by 600 ms to 1200 ms when .
II Related Work
II-A Visual localisation
Structure-based methods estimate camera poses by establishing correspondences between the 2D features of the query image and 3D points of pre-built 3D models. The correspondences can be established indirectly with local feature extraction and matching [3, 11, 7, 12, 13] or directly with scene coordinate regression [14, 15, 16]. However, even though scene coordinate methods achieve high accuracy in small and medium indoor scenes, they are not robust and accurate enough for larger and more complex scenes [17, 16, 18]. HLoc pipeline [3, 7] achieves high accuracy on both indoor and large-scale outdoor scenes by using IR [19, 20, 21] as an intermediate step, allowing it to scale up to larger scenes.
Absolute Pose Regressors (APRs) are end-to-end learning-based methods that directly regress the absolute camera pose from input images. PoseNet [22, 23] and the follower APRs [24, 25, 26, 27, 28] can provide faster predictions than structure-based methods. However, they have low accuracy and robustness and are very difficult to generalize well to novel viewpoints, which are very different from the training set [29]. Therefore, this paper focuses on the HLoc pipeline, the indirect structure-based approach with IR, because it can provide robust and accurate results in large-scale scenes.
II-B Image Retrieval
Image Retrieval (IR) is commonly used for place recognition and visual localisation tasks. IR fetches top relevant and similar database images given query images by extracting global descriptor from pre-trained models [19, 21, 30]. We focus on IR in structure-based localisation in this paper. [10] studies the performance correlation between classical place recognition and localisation tasks and finds almost no improvement in visual localisation when is larger than 20. Mobile sensors’ data are utilized to reduce the database’s research space when doing IR in [31]. [32, 6] use a fusion of global descriptors in the visual localisation task. This study aims to improve the speed of HLoc by adaptively allocating the number of retrieved images for more efficient matching and pose estimation instead of using a constant for all queries in previous work.
III Methods
HLoc pipelines implement IR models to fetch images similar to the query image in a database by ranking the cosine similarity of global descriptors as shown in Figure 1. Feature matching is the bottleneck of the current HLoc pipeline; it takes around 100 to 200 milliseconds for one image pair, even on good modern GPUs. The larger the , the longer it takes to feature matching. We show the detailed data in Section IV-F. Our objective is to reduce the feature-matching cost by retrieving a different number of relevant database images for different queries while maintaining robustness and accuracy. We first investigate several mainstream IR methods, AP-GeM [21], NetVLAD [19], and EigenPlaces [30], to show the match ratio is highly corresponding to visual similarity between query and training images and different queries have different benefits for accuracy when increasing the number of . So we argue that existing methods retrieve an equal number of images for all queries is a waste of processing time and computation power.
III-A Relationship between match ratio and similarity
Given a query image , the image database is . An IR model extracts the global descriptors of the query image as . extracts the global descriptors of reference images as . The similarity between and is
| (1) |
Similarly, a local feature extraction model extracts the local feature of the query image as . extracts the local feature of as . The number of local feature points of is , and the number of matched local features between and is . We define the match ratio as:
| (2) |
, where . In this paper, we use the prevalent SuperPoint [12] and SuperGlue [7] as the feature extractor and matcher.
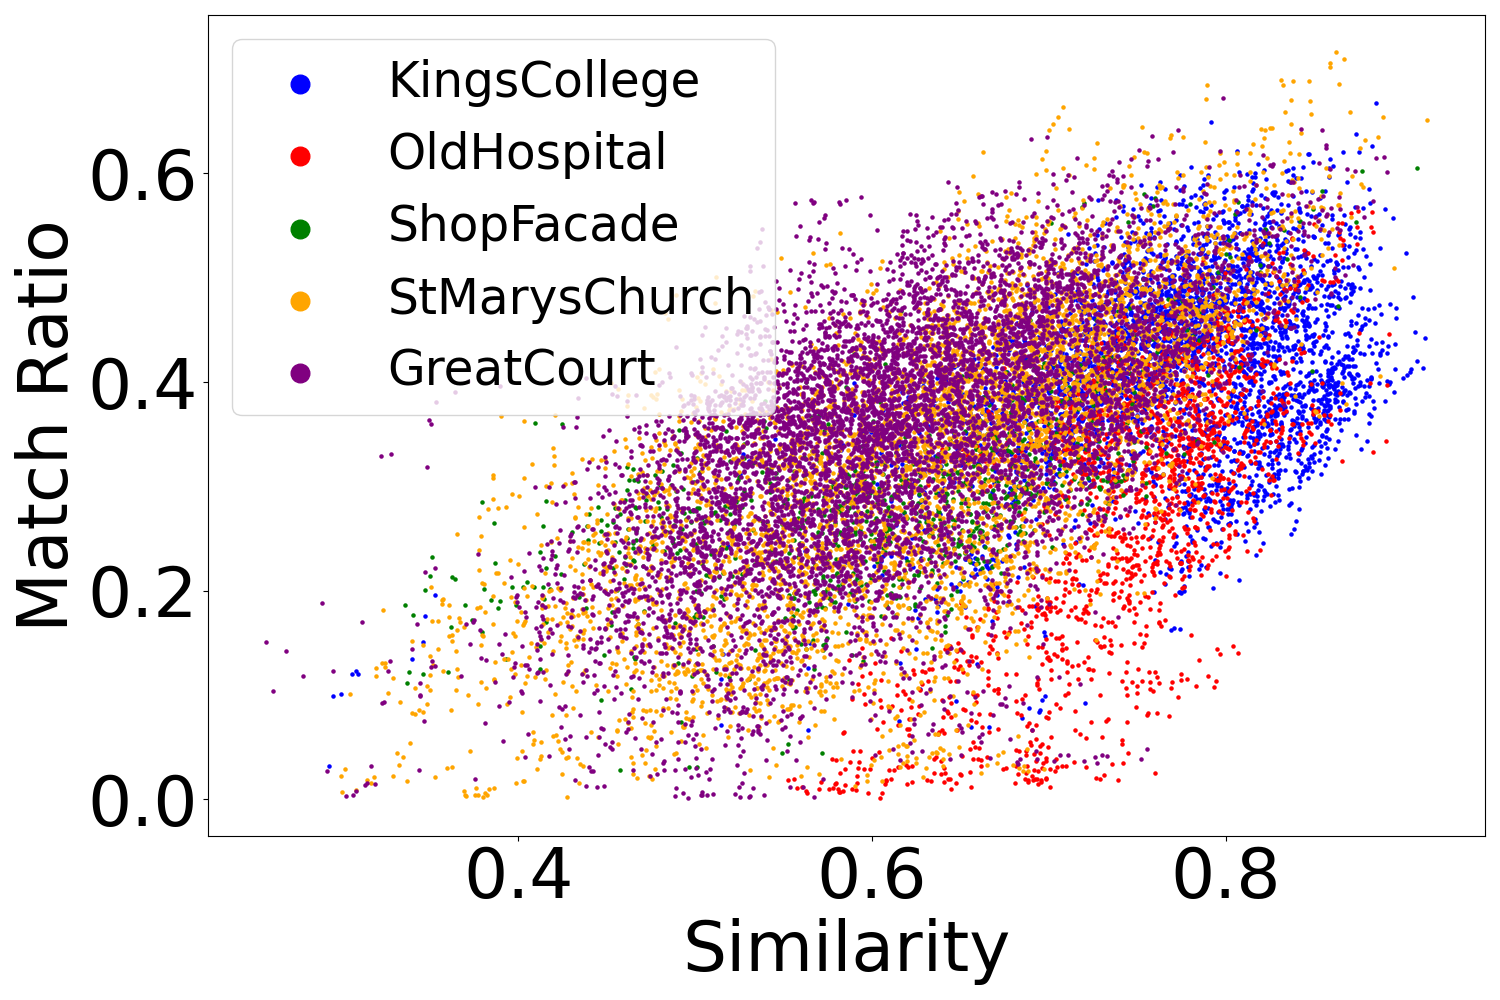
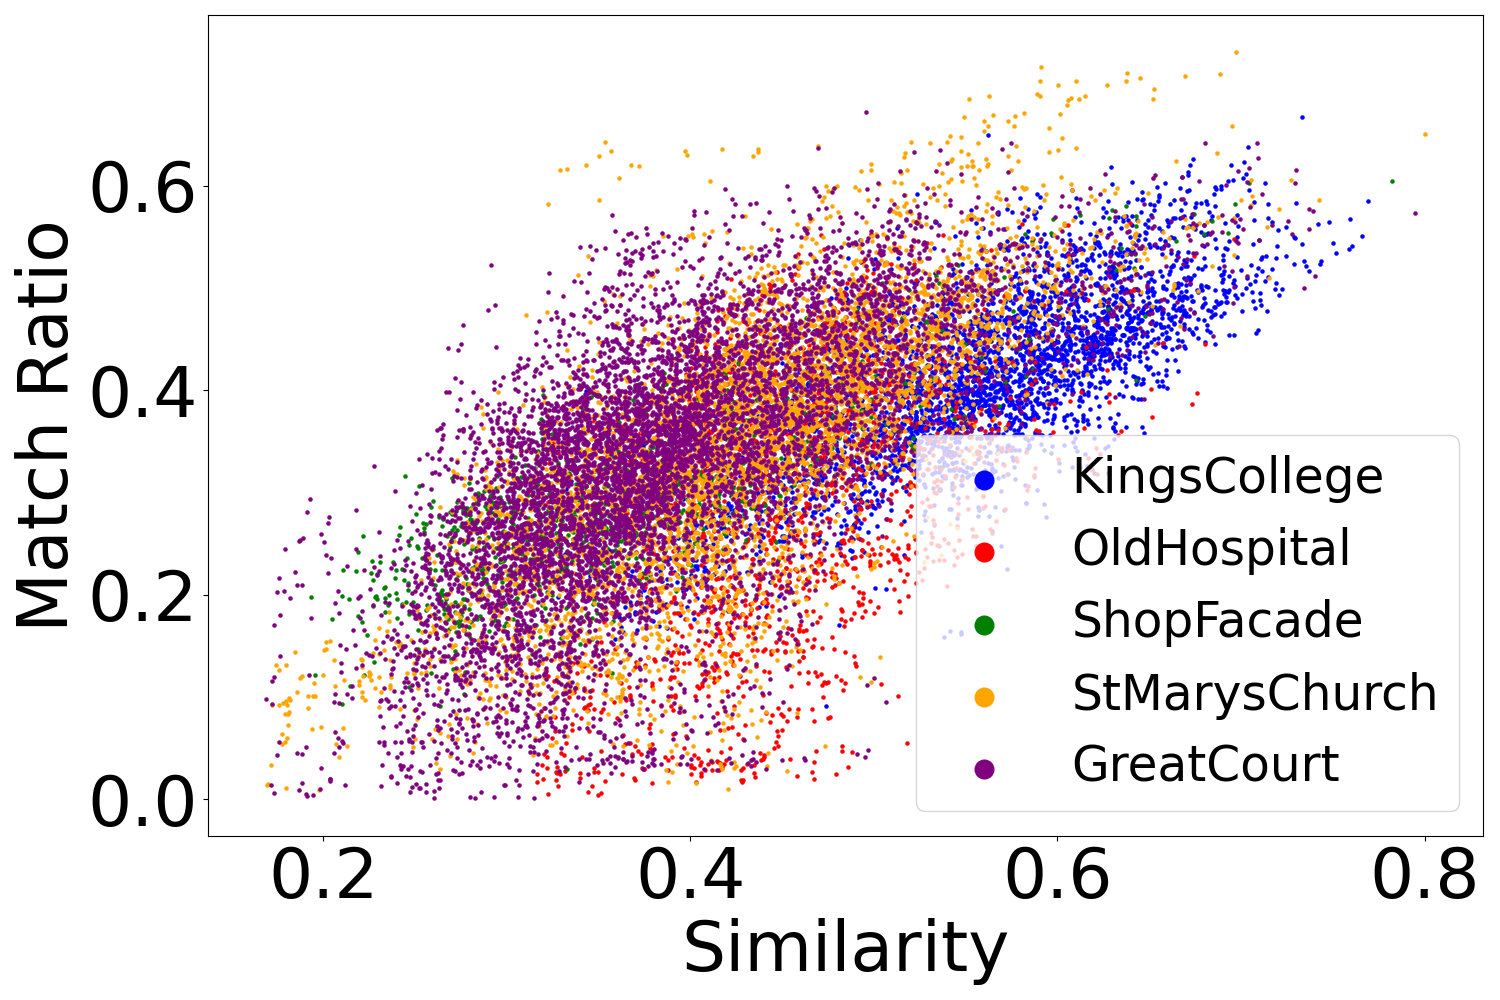
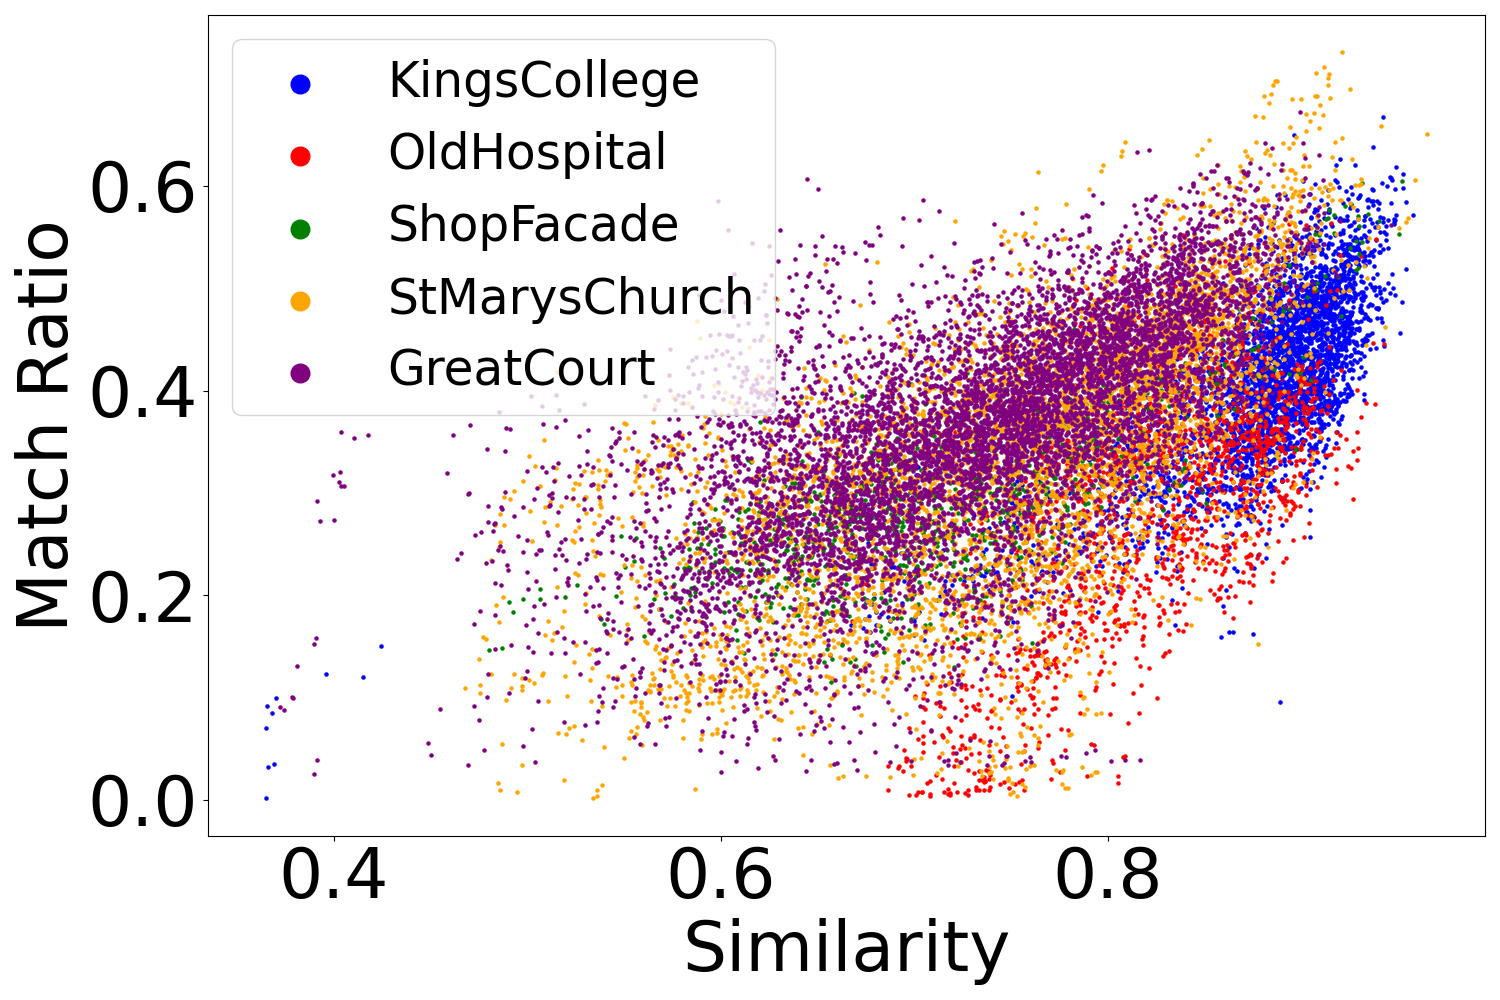
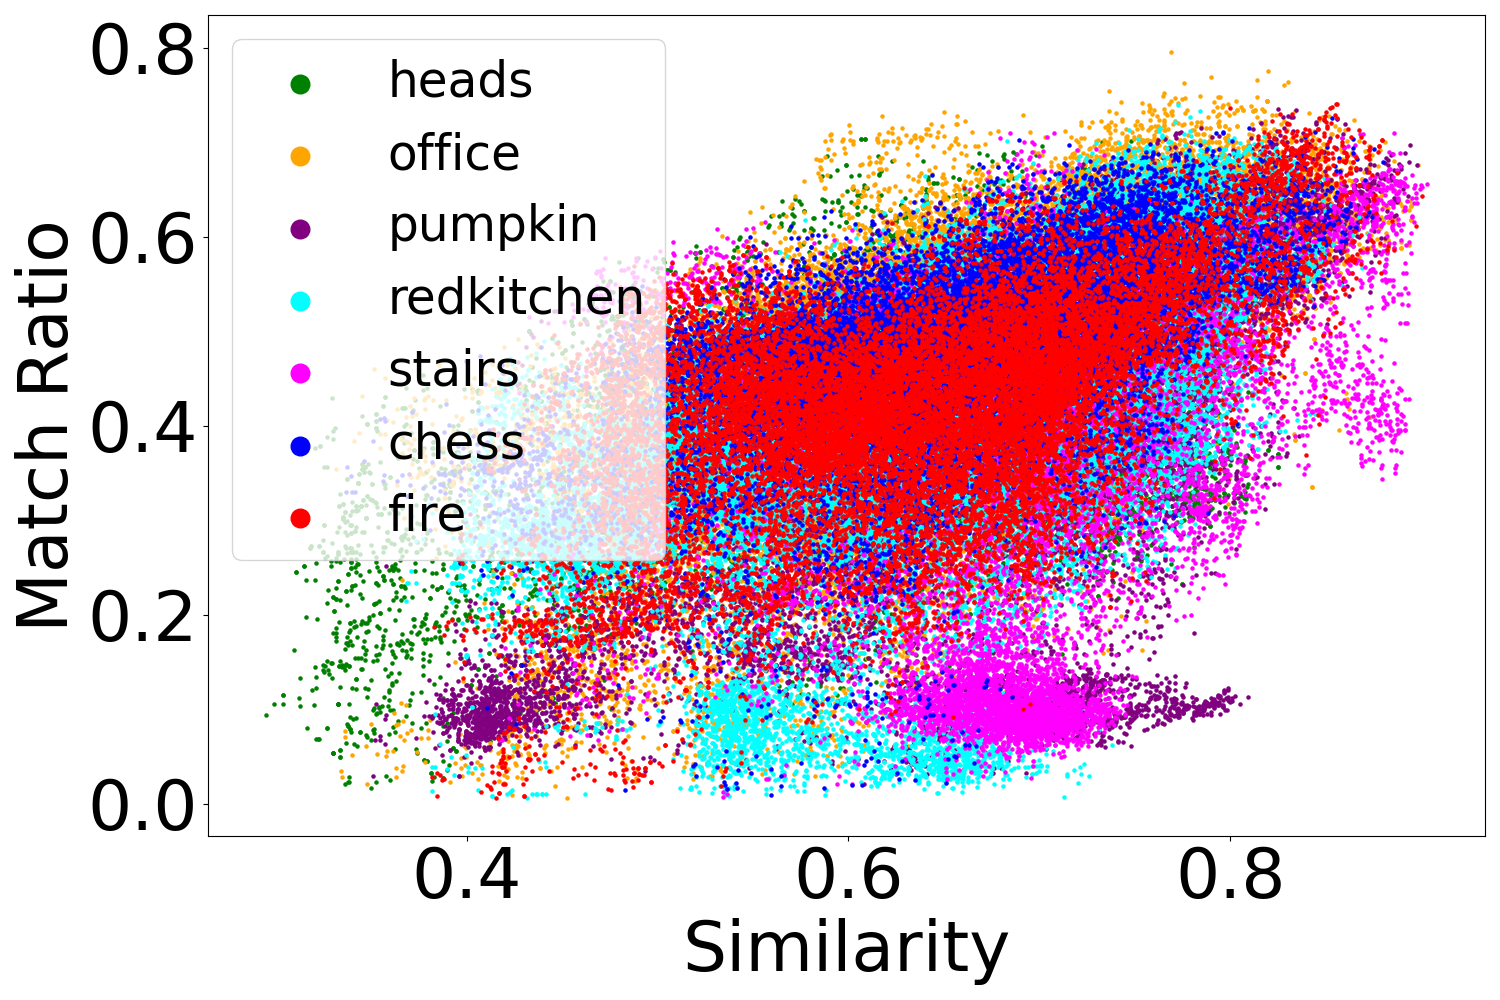
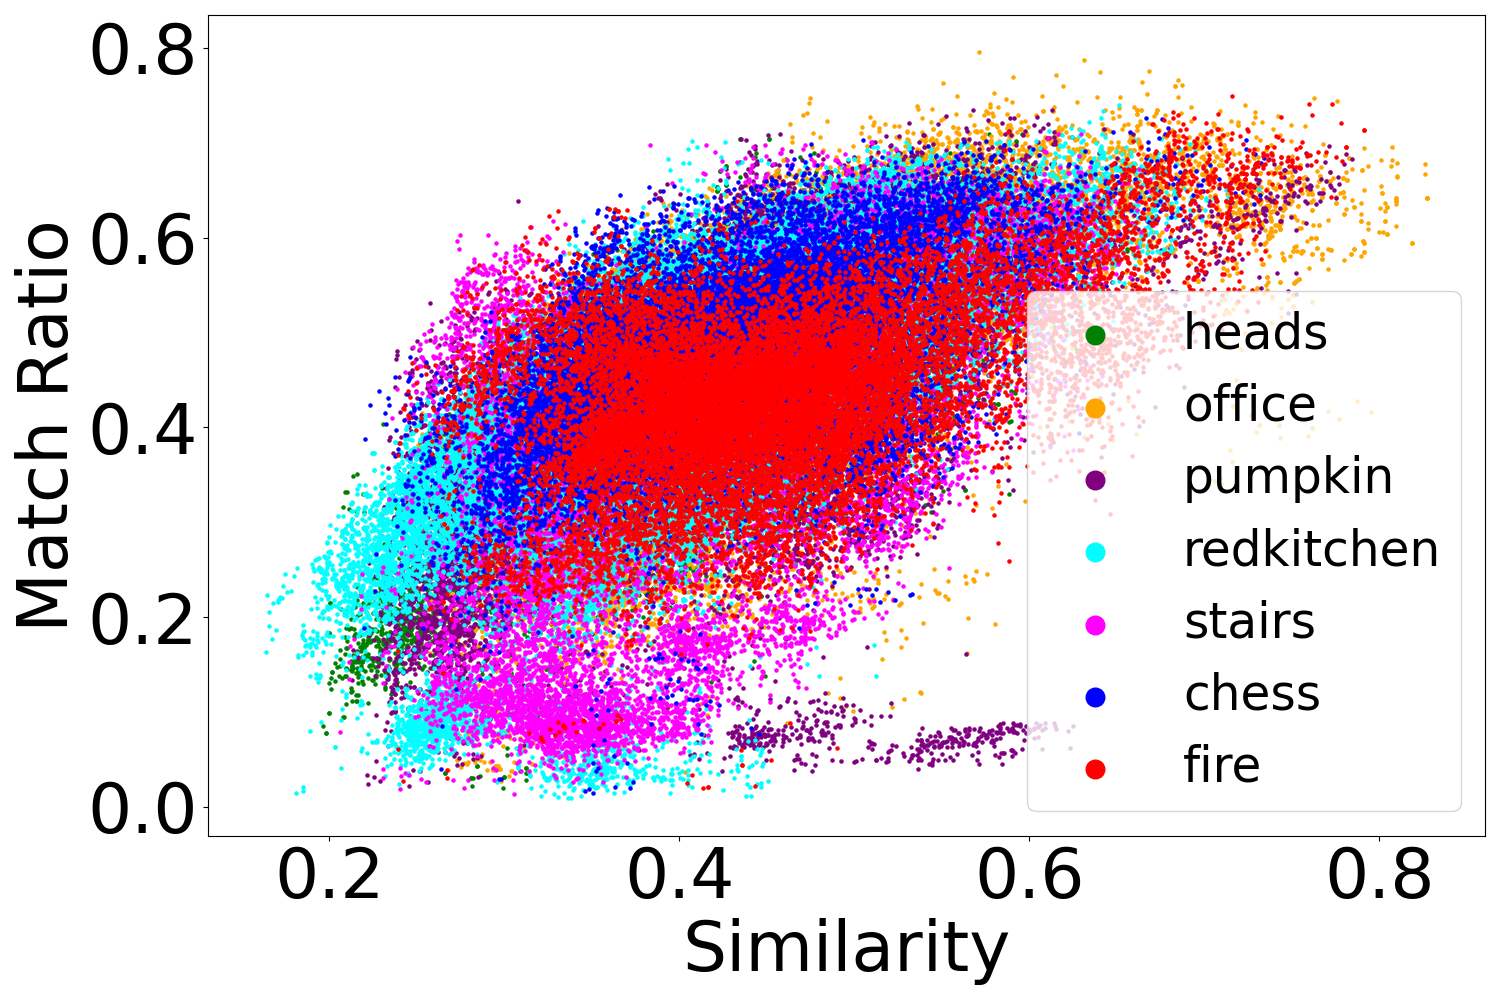
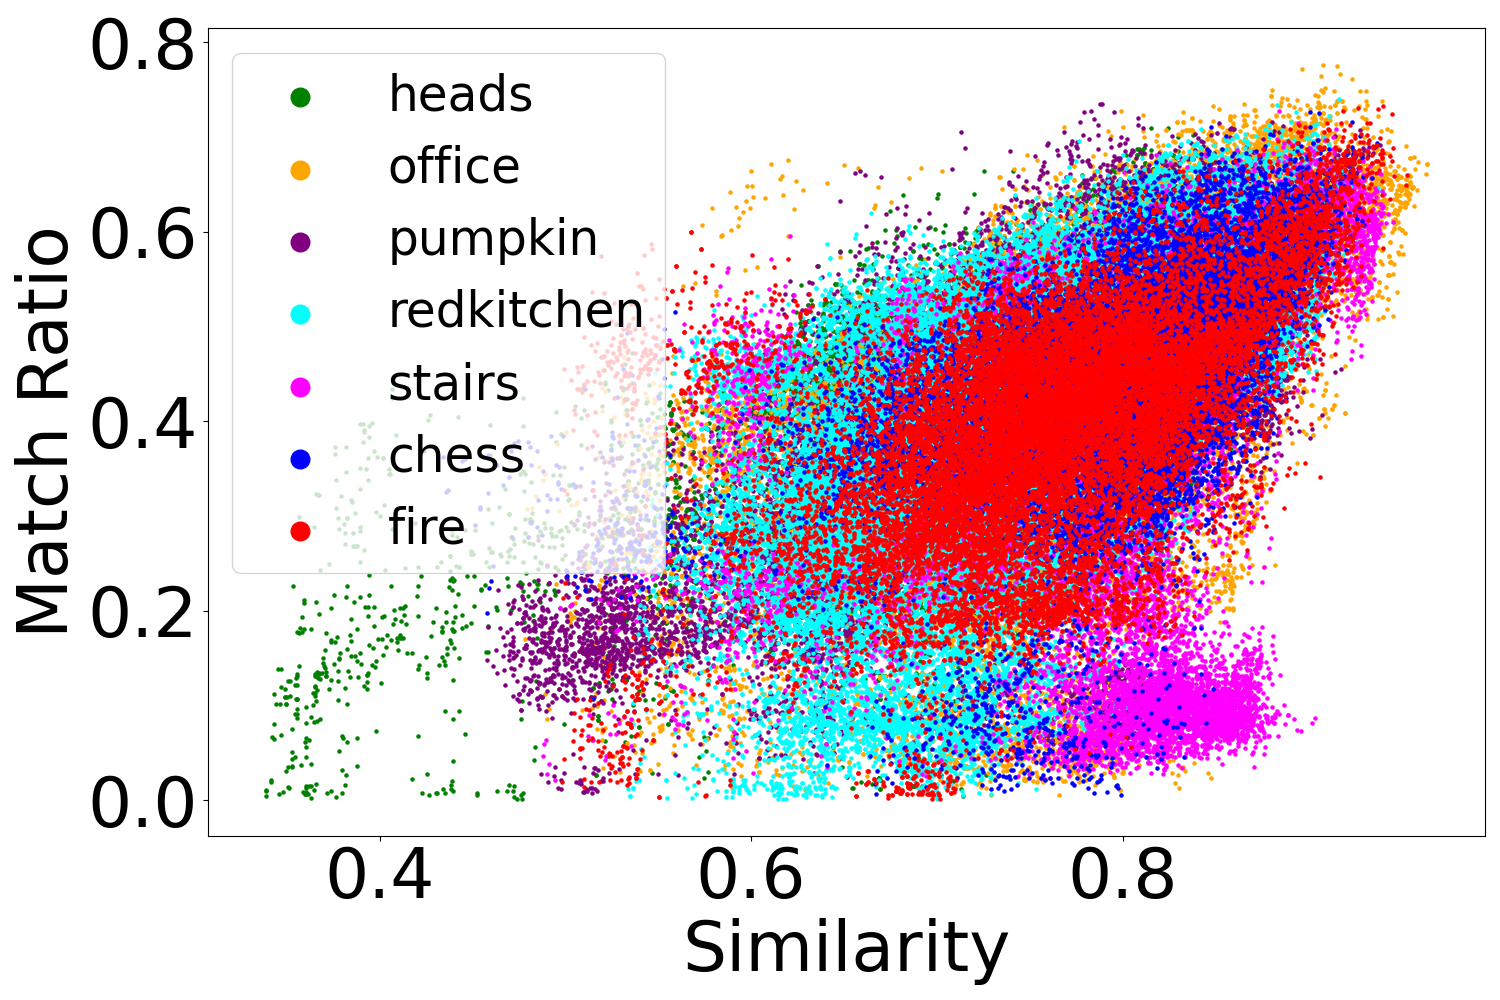
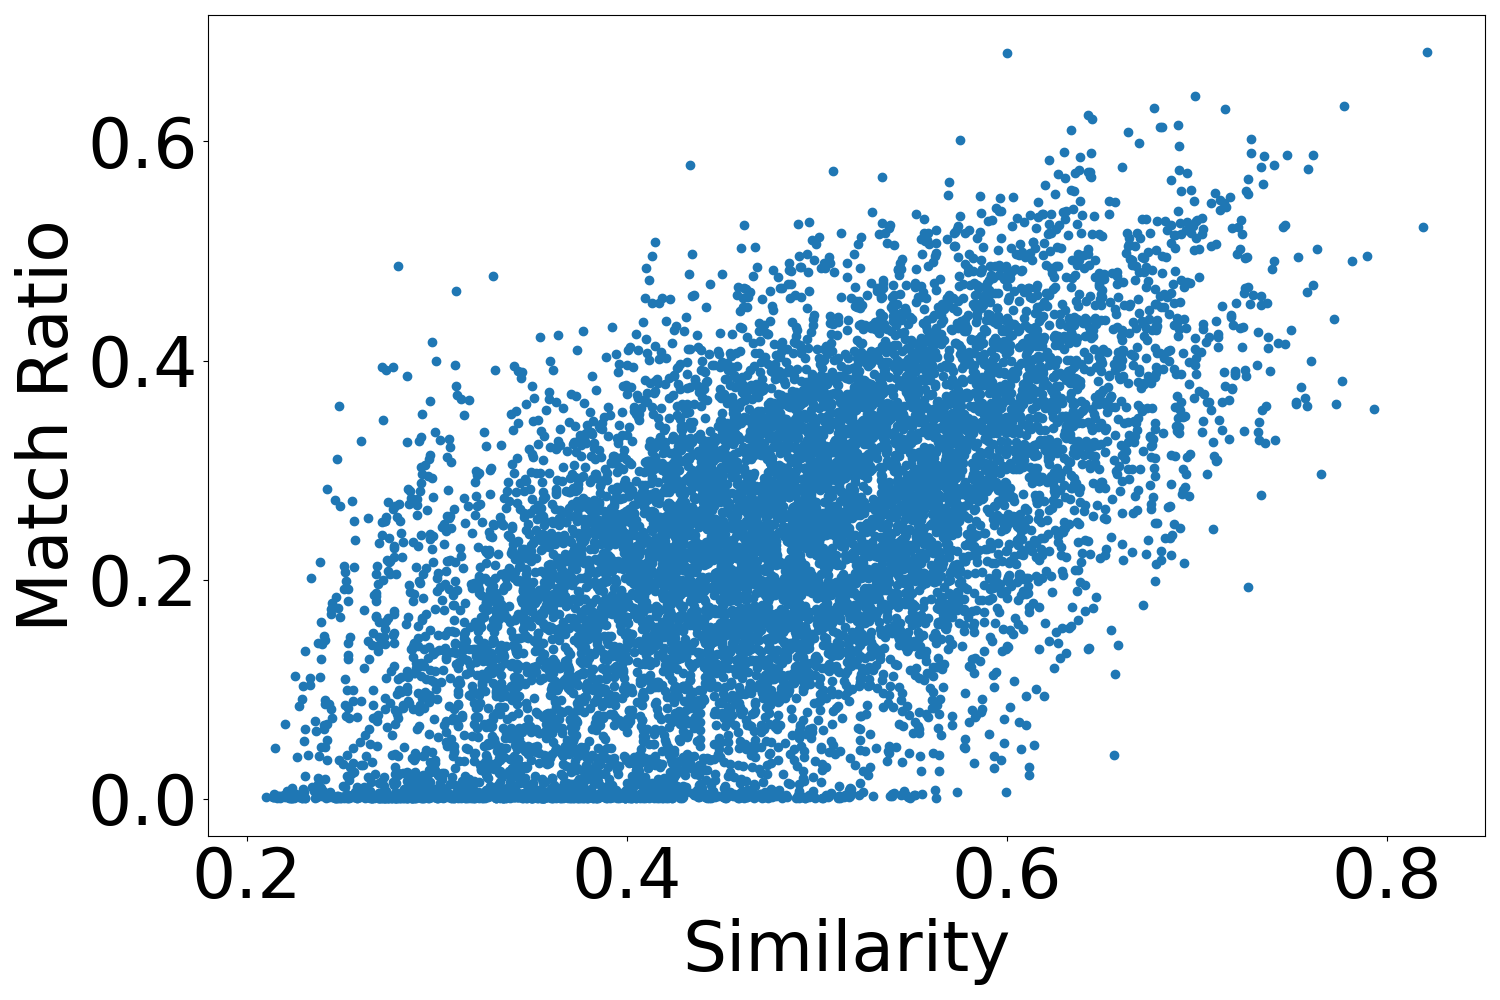
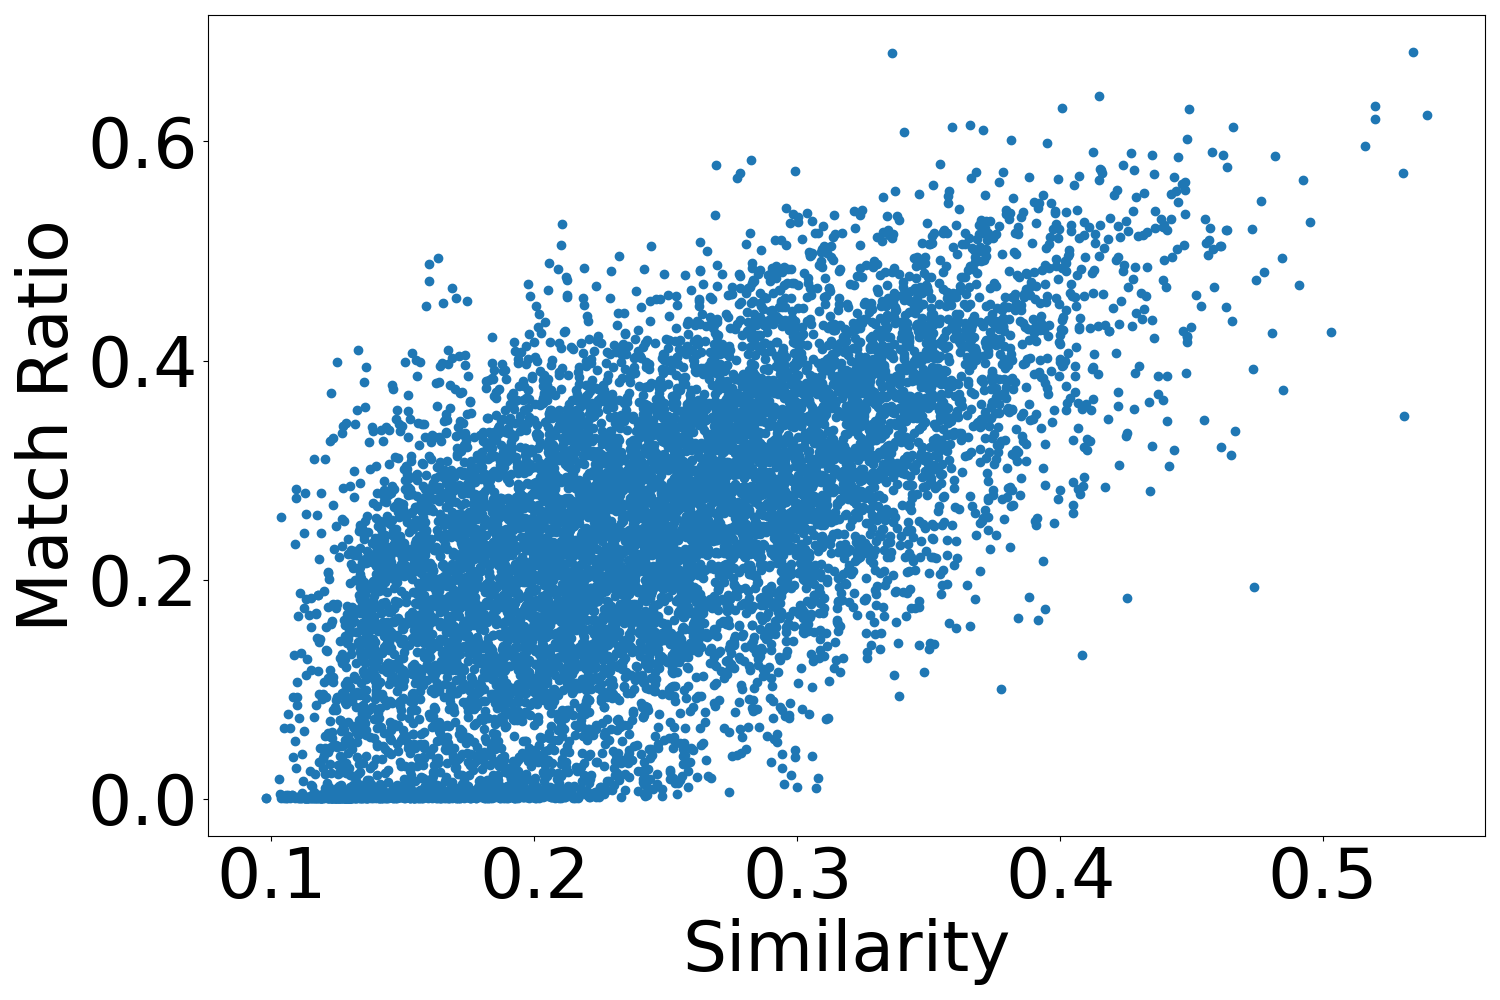
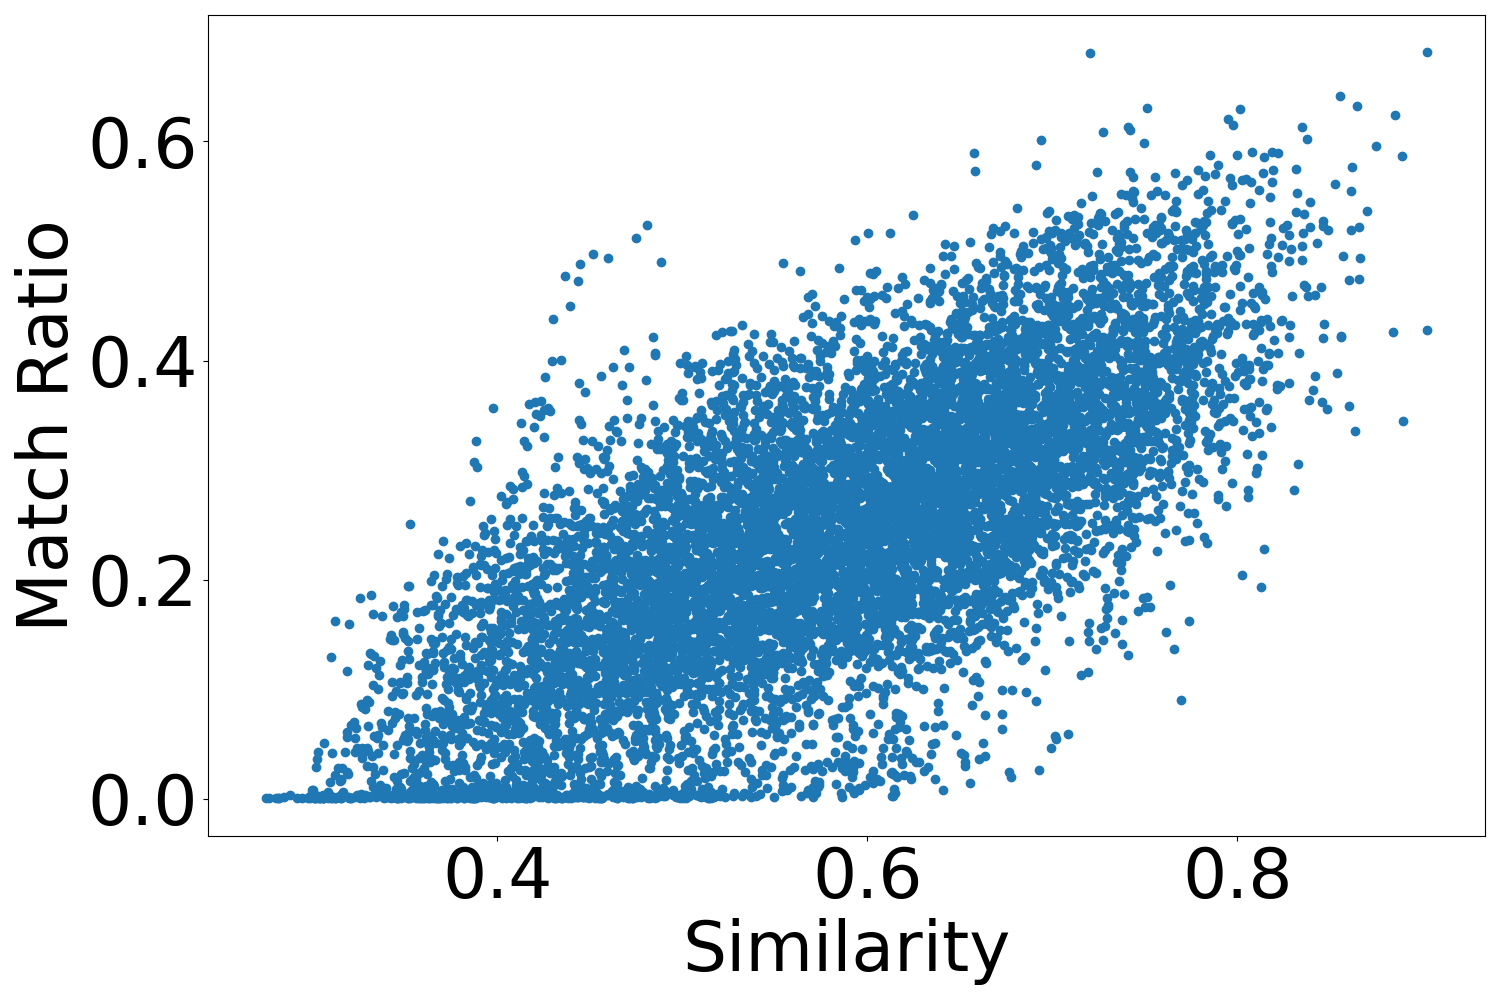
Figure 2 shows the strong correlation between cosine similarity in Equation 1 and match ratio, as described in Equation 2, for each and pair. The number in parentheses of each subplot is the Pearson correlation coefficient (PCC) [33] and Spearman correlation coefficient (SRC) [34] ranges from -1 to 1. A larger PCC value indicates a stronger linear positive correlation, while SRC values close to 1 suggest a strong positive monotonic relationship. We opt to use the match ratio instead of the absolute number of matches in our analysis, as some query images exhibit textureless regions with fewer feature points, yielding only a few matches even when highly similar images are retrieved. Utilizing a match ratio from 0 to 1 provides a more meaningful measure. Our analysis incorporates three distinct IR models (AP-GeM, NetVLAD, and EigenPlaces). AP-GeM and NetVLAD serve as representative IR models in the visual localisation pipeline [6, 3, 10], and EigenPlaces is the SOTA IR model in place recognition task. A strong positive correlation between match ratio and similarity is observed for all three IR models across three different datasets. Therefore, if a query image can find very similar images, then a small number of retrieved images can contribute enough matches for pose estimation. For queries that have difficulty finding similar images, we need more retrieved images. We also posit that the measure of match ratio and similarity can offer novel insights into the research on the correlation between the performance of classical landmark retrieval or place recognition tasks and the performance of visual localisation.
(PCC:0.61, SRC:0.58)
(PCC:0.67, SRC:0.65)
(PCC:0.67, SRC:0.65)
(PCC:0.51, SRC:0.48)
(PCC: 0.61, SRC:0.58)
(PCC:0.51, SRC:0.51)
(PCC:0.63, SRC:0.62)
(PCC:0.68, SRC:0.67)
(PCC:0.72, SRC:0.71)
III-B Adaptive Image Retrieval
According to the correlation observed in Figure 2, we propose to use the similarity between the images database and the query to evaluate the localisation difficulty of query images. We first store the global descriptors of all the images in the reference images database offline. For a query image , we get the global descriptor using a pre-train IR model. Then, we calculate the cosine similarity between and each . The similarity is then ranked from highest to lowest, with the mean of the top being the score of the . In this paper, we set .
We believe that the three most similar images are sufficient to reflect the localisation difficulty of this query. Therefore, instead of retrieving fixed images for all queries, we retrieve different numbers of reference images for different queries depending on . We denote the maximum number of images that are retrieved as for each . Then, for different , we follow the below rules:
-
•
For easy query, , we retrieve images.
-
•
For medium query, , we retrieve images.
-
•
For hard query, , we retrieve images.
, where , is the high similarity threshold. , is the low similarity threshold. are coefficients to reduce the number of retrieved images. is the ceiling function. Since we adaptively assign the retrieved number for different , we call our improved HLoc approach as AIR-HLoc.
IV Evaluation
IV-A Datasets
To fully demonstrate the effectiveness of our approach, we selected three popular visual localisation datasets that encompass indoor scenes, large-scale outdoor scenes, and challenges involving day-night changes, moving objects, and motion blur. The 7Scenes dataset [35, 36] is an indoor dataset consisting of seven small scenes from to . Each scene contains a training set with 1000 to 7000 images and a test set with 1000 to 5000 images. We use the rendered depth maps provided by [15] to improve the accuracy of the sparse point cloud. The Cambridge Landmarks [22] is a large-scale outdoor dataset with six scenes ranging from to . Each scene contains 231 to 1531 training frames and 103 to 760 test frames. We utilize the structure from motion (SfM) model provided in HLoc official code111https://github.com/cvg/Hierarchical-Localization/tree/master/hloc/pipelines/Cambridge. The Aachen Day-Night-v1.1 [37, 38] comprises 6697 training and 1015 test images taken from the Aachen, Germany. The database images were captured during the daytime using handheld cameras, while query images were taken with three mobile phones during both day and night. The test set is divided into two conditions: day and night. Nighttime images are only for testing.
IV-B Implementation details
We integrate NetVLAD and EigenPlaces into AIR-HLoc and conduct a visual localisation experiment. Different IR methods have an impact on similarity thresholds. As shown in Figure 2, although the correlation between the three IR methods is similar for each data set, the range distribution of similarity is slightly different. For Eigenplaces, the distribution of similarity on all data sets is 0.3 to 0.95, but NetVLAD and AP-GeM are not so uniform. For NetVLAD in particular, the range of similarity on Aachen Day-Night-v1.1 dataset is smaller than on Cambridge Landmarks and 7Scenes datasets. There should be two reasons for this. Firstly, the Aachen-V1.1 dataset represents a handheld motion pattern for AR applications in city-scale environments, and Eigenplaces is more robust to camera viewpoint changes than NetVLAD and AP-GeM [30]. Secondly, the Aachen Day-Night-v1.1 dataset has the cross-device domain gap that images in the reference database and query images have different resolutions and camera intrinsic parameters, while images of 7scenes and Cambridge datasets were captured with the same camera and have the same resolution.
Therefore, for NetVLAD, we set and for Cambridge and 7Scenes datasets, and for Aachen-V1.1 dataset. For EigenPlaces, We set and for all three datasets. We set and for all IR methods and all three datasets.
IV-C Evaluation
Given a query images , denotes the estimated global translation, and denotes the estimated quaternion, which encodes the rotation. is the estimated 6DoF absolute camera pose for , and is the ground truth 6DoF pose.
We evaluate the performance of HLoc and AIR-HLoc through two primary metrics. We consider the mean and median absolute translation error (ATE) and absolute rotation error (ARE) as described in Equation (3) and Equation (4) for all test frames in Cambridge Landmarks and 7Scenes datasets. For Aachen Day-Night-v1.1, we analyze the percentage of test images with pose predicted with high (), medium (), and low () accuracy levels proposed by [37] because it does not provide ground truth poses for each test frame.
| (3) |
| (4) |
, where the conjugate of is denoted as .
IV-D Results
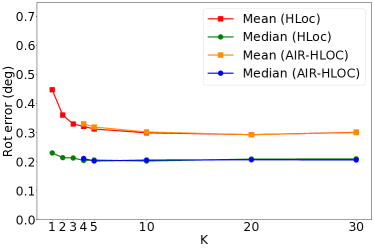
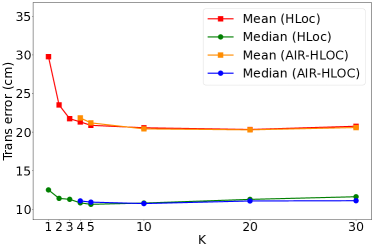
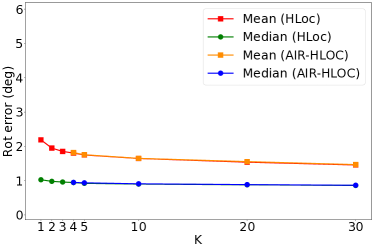
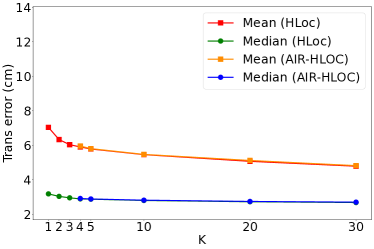
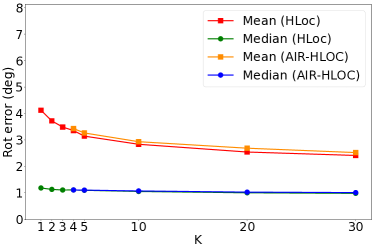
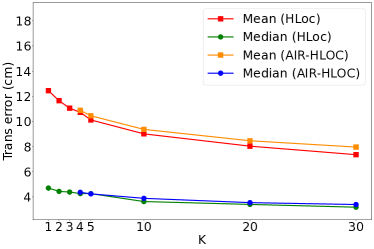
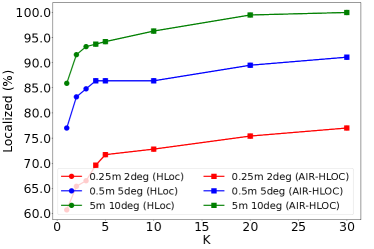
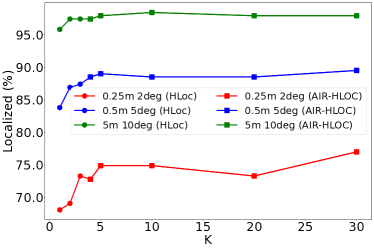
We present the localisation accuracy of HLoc and AIR-HLoc across three distinct datasets, as depicted in Figure 3 and Figure 4, with respect to varying values of . In the case of HLoc, we report the results for and it retrieves the same number of images from the database for all queries. As for our AIR-HLoc, we provide the outcomes for , considering a retrieval of similar images solely for hard queries, images for easy queries, and images for medium queries. We do not give the results for because the optimization space is too small and most data sets achieve much higher accuracy when . The average number of retrieved images for all queries of AIR-HLoc is presented in Table I.
IV-D1 Cambridge Landmarks
For both HLoc and AIR-HLoc, the mean and median pose error is basically convergent when . Subfigures 3 (a)-(d) and Table I show that AIR-HLoc achieves almost the same accuracy of HLoc with up to 30% fewer retrieved images. Using NetVLAD and EigenPlaces as IR module has similar behaviour; for , the mean pose error of using EigenPlaces is much lower than the error using NetVLAD.
IV-D2 7Scenes
IV-D3 Aachen Day-Night-v1.1
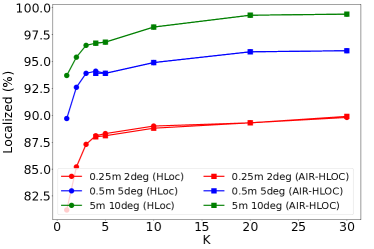
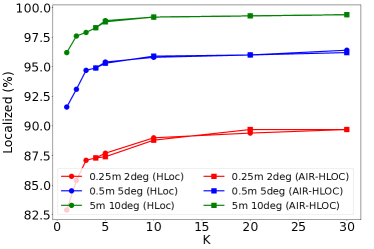
For both HLoc and AIR-HLoc, the three accuracy levels are basically convergent when . Subfigures 4 (a)-(c) and Table I show that AIR-HLoc achieves almost the same accuracy of HLoc with up to 11% fewer retrieved images. And we can find that AIR-HLoc (NetVLAD) has slightly better accuracy than HLoc (NetVLAD) in (0.25m, ) when , and AIR-HLoc (EigenPlaces) have slightly better accuracy than HLoc (EigenPlaces) in (0.25m, ) when in day-time test sequences. This shows that our AIR-HLoc can not only reduce overhead while maintaining accuracy but also improve accuracy in some cases.
|
|||||||||||||||||||||||||||||||||||||||||||||||||||||||||||||||||||||||||||||||||||||||||||||||||||||||||||||||||||||||||
|
|||||||||||||||||||||||||||||||||||||
IV-E Analysis
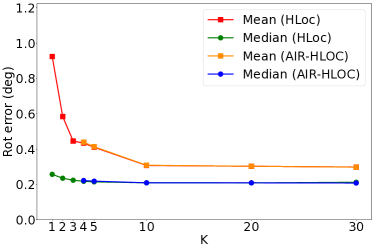
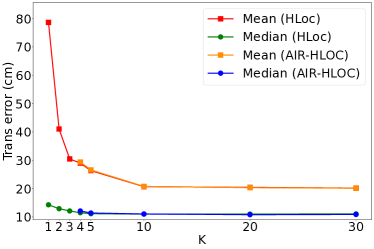
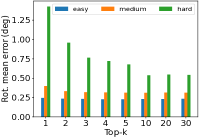
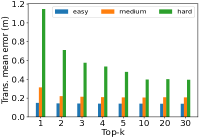
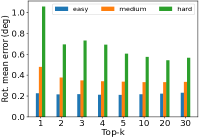
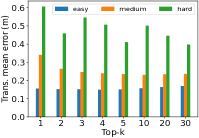
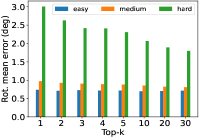
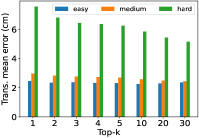
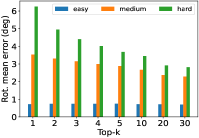
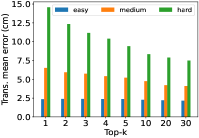
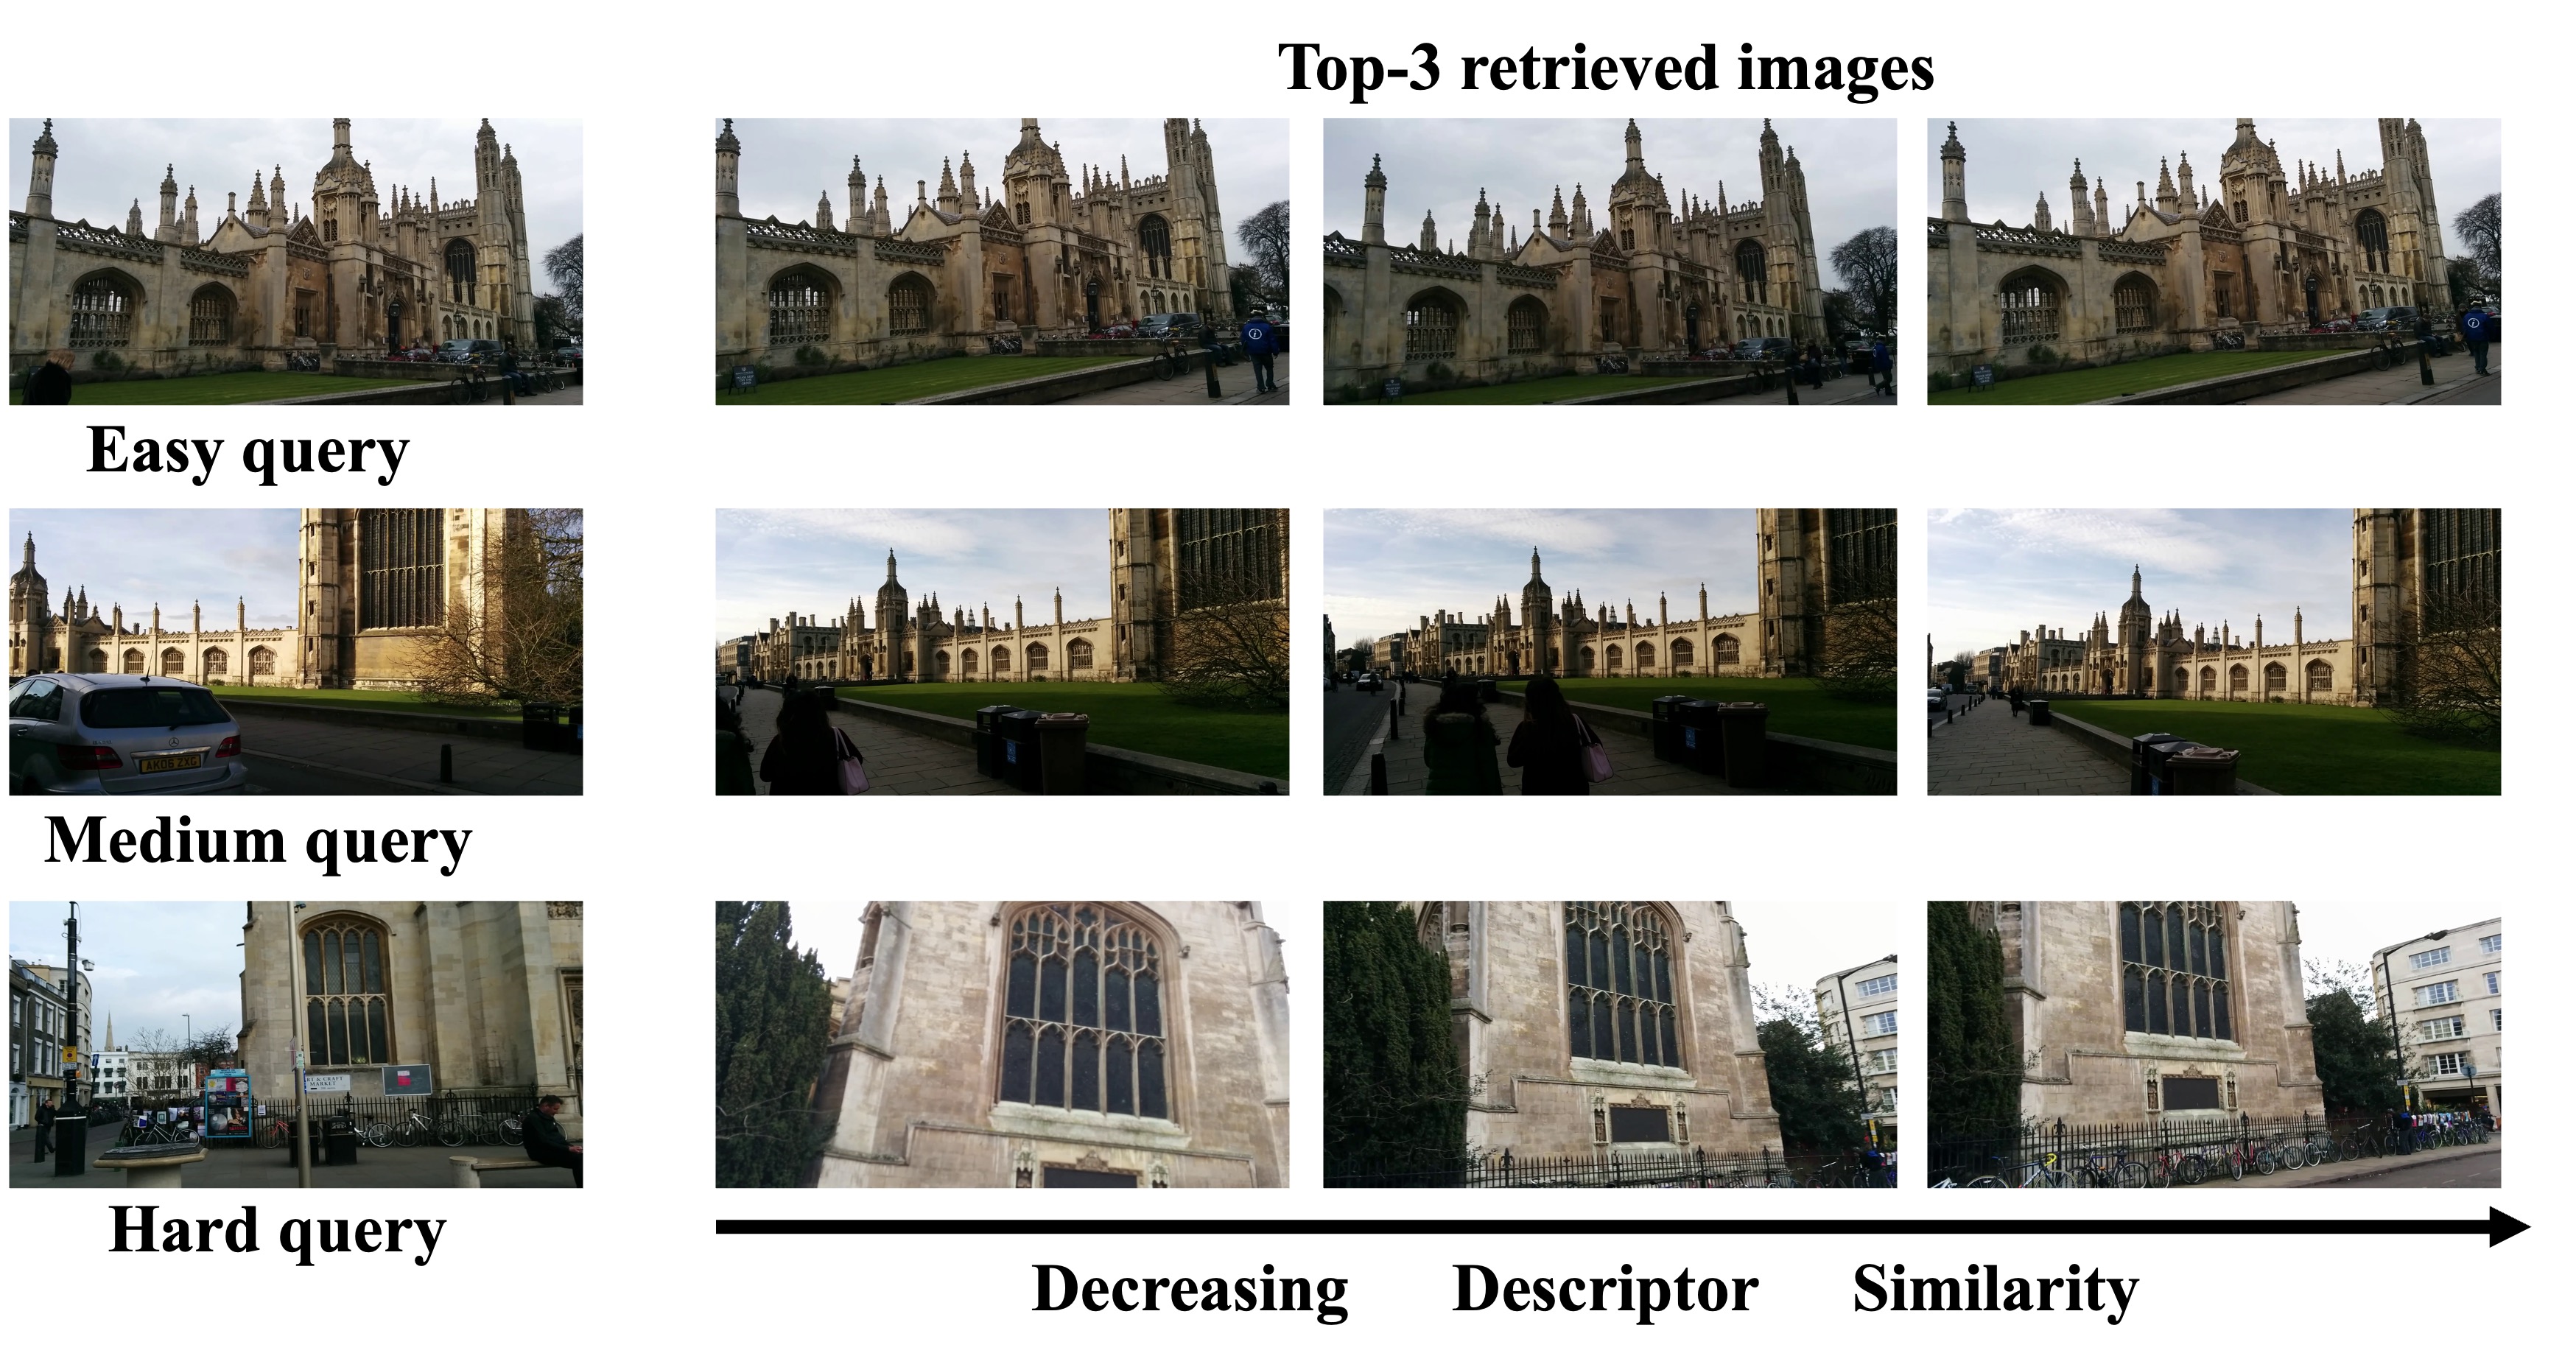
We give some examples of hard, medium, and easy query images and their top 3 retrieved images. Figure 6 describes that easy query images are very similar to some images in the reference database, and there are relatively similar images for medium queries. However, retrieved images for the hard query are even wrong; there is no overlap between the hard query and retrieved images. Table II shows that there are a small proportion of the test frames are hard queries in Cambridge and 7Scenes dataset, and Figure 5 illustrates that increasing has different benefits for different kinds of queries. For easy query images, the accuracy is converged when , but for hard query, the accuracy can still be improved when . Moreover, for both translation and rotation error, when k is the same, easy query medium query hard query. The pose estimated based on an easy query is far more accurate than that estimated based on a hard query when is large enough, which illustrates that the similarity score of each query also reflects the uncertainty of pose estimation. These results fully demonstrate that HLoc’s use of the same number of images to feature matching for all queries is a waste of computing power and demonstrates the rationality of our approach.
IV-F System Efficiency and Application
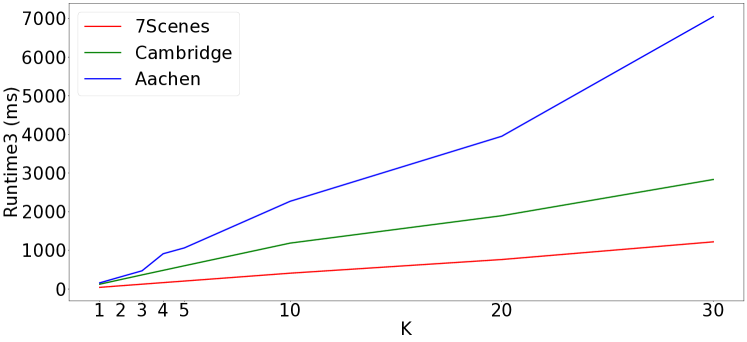
In this paper, we conduct all evaluations using an NVIDIA GeForce GTX 3090 GPU. We first evaluate the whole HLoc pipeline’s runtime. Since global and local feature extraction for reference images database can be done offline, we mainly consider the local feature extraction time for query image (runtime1), IR time (runtime2), feature matching time (runtime3) and pose estimation time (runtime4). The runtime1 and runtime4 are almost constant for a query; runtime2 is related to the size of the image database. For King’s College in the Cambridge landmarks dataset, runtime1 + runtime2 + runtime4 takes about 45ms for each query. We observe that runtime3 exhibits linear growth with an increase in the value of in Figure 7. Note that Cambridge and Aachen-V1.1’s runtime3 is longer than 7scenes’ when is the same because images in Cambridge and Aachen-V1.1 have much higher resolution than images in 7Scenes222We resize all images in Aachen Day-Night-v1.1 with the maximum size 1600 and resize all images in Cambridge landmarks with the maximum size 1024. For 7Scenes, we keep the original resolution with .. This also shows that the higher the image resolution, the higher our method’s optimization effect. Runtime3 dominates a significant portion of the entire pipeline’s execution time, especially when with more than 1000 ms, while most datasets require at least to get the best performance.
The average runtime3 for each pair is 41 ms, 120 ms, and 227 ms, respectively, for 7Scenes, Cambridge and Aachen-V1.1. When , AIR-HLoc reduces the average runtime3 of all queries up to 106 ms, 360 ms, and 227 ms, respectively, for 7Scenes, Cambridge and Aachen-V1.1 as shown in Table I. For easy queries, AIR-HLoc reduces the runtime3 of each up to 205 ms, 600 ms, and 1135 ms, respectively, for 7Scenes, Cambridge, and Aachen-V1.1 datasets.
The typical modern robots involve some form of visual-inertial odometry (VIO) to track the local camera pose across the space. As such, absolute pose estimation is only required to initially align the local tracking coordinate system and the world coordinate system and periodically recalibrate the tracking if needed [39, 40, 41]. With VIO systems being increasingly resilient to drift, such a system can skip isolated hard queries and only periodically realign with easy and medium queries, which have much higher accuracy as shown in Figure 5 and much lower runtime. Relying on VIO would thus further reduce the computational requirements of real-time camera relocalisation while maintaining tracking accuracy using our AIR-HLoc.
V CONCLUSIONS
The IR module in HLoc identifies the most similar images from a database of reference images for a given query image. Increasing enhances localisation robustness for challenging queries but also leads to increased computational cost for feature matching. Feature matching is the bottleneck of the runtime, increasing linearly with . This paper introduces AIR-HLoc, a method that optimizes processing time by adaptively retrieve different number of images based on the similarity between query images and the reference image database. Extensive experiments conducted on the Cambridge Landmarks, 7Scenes, and Aachen Day-Night-v1.1 datasets demonstrate the efficacy of our algorithm, achieving a reduction of 30%, 26%, and 11% in computational overhead while maintaining SOTA accuracy for three datasets, respectively, compared to HLoc with fixed image retrieval.
References
- [1] T. Sattler, T. Weyand, B. Leibe, and L. Kobbelt, “Image retrieval for image-based localization revisited.” in BMVC, vol. 1, no. 2, 2012, p. 4.
- [2] M. Dusmanu, I. Rocco, T. Pajdla, M. Pollefeys, J. Sivic, A. Torii, and T. Sattler, “D2-net: A trainable cnn for joint description and detection of local features,” in Proceedings of the ieee/cvf conference on computer vision and pattern recognition, 2019, pp. 8092–8101.
- [3] P.-E. Sarlin, C. Cadena, R. Siegwart, and M. Dymczyk, “From coarse to fine: Robust hierarchical localization at large scale,” in Proceedings of the IEEE/CVF Conference on Computer Vision and Pattern Recognition, 2019, pp. 12 716–12 725.
- [4] H. Taira, M. Okutomi, T. Sattler, M. Cimpoi, M. Pollefeys, J. Sivic, T. Pajdla, and A. Torii, “Inloc: Indoor visual localization with dense matching and view synthesis,” in Proceedings of the IEEE Conference on Computer Vision and Pattern Recognition, 2018, pp. 7199–7209.
- [5] H. Germain, G. Bourmaud, and V. Lepetit, “Sparse-to-dense hypercolumn matching for long-term visual localization,” in 2019 International Conference on 3D Vision (3DV). IEEE, 2019, pp. 513–523.
- [6] P.-E. Sarlin, M. Dusmanu, J. L. Schönberger, P. Speciale, L. Gruber, V. Larsson, O. Miksik, and M. Pollefeys, “Lamar: Benchmarking localization and mapping for augmented reality,” in European Conference on Computer Vision. Springer, 2022, pp. 686–704.
- [7] P.-E. Sarlin, D. DeTone, T. Malisiewicz, and A. Rabinovich, “Superglue: Learning feature matching with graph neural networks,” in Proceedings of the IEEE/CVF conference on computer vision and pattern recognition, 2020, pp. 4938–4947.
- [8] L. Kneip, D. Scaramuzza, and R. Siegwart, “A novel parametrization of the perspective-three-point problem for a direct computation of absolute camera position and orientation,” in CVPR 2011. IEEE, 2011, pp. 2969–2976.
- [9] M. A. Fischler and R. C. Bolles, “Random sample consensus: a paradigm for model fitting with applications to image analysis and automated cartography,” Communications of the ACM, vol. 24, no. 6, pp. 381–395, 1981.
- [10] M. Humenberger, Y. Cabon, N. Pion, P. Weinzaepfel, D. Lee, N. Guérin, T. Sattler, and G. Csurka, “Investigating the role of image retrieval for visual localization: An exhaustive benchmark,” International Journal of Computer Vision, vol. 130, no. 7, pp. 1811–1836, 2022.
- [11] D. G. Lowe, “Distinctive image features from scale-invariant keypoints,” International journal of computer vision, vol. 60, pp. 91–110, 2004.
- [12] D. DeTone, T. Malisiewicz, and A. Rabinovich, “Superpoint: Self-supervised interest point detection and description,” in Proceedings of the IEEE conference on computer vision and pattern recognition workshops, 2018, pp. 224–236.
- [13] M. Tyszkiewicz, P. Fua, and E. Trulls, “Disk: Learning local features with policy gradient,” Advances in Neural Information Processing Systems, vol. 33, pp. 14 254–14 265, 2020.
- [14] E. Brachmann, A. Krull, S. Nowozin, J. Shotton, F. Michel, S. Gumhold, and C. Rother, “DSAC-Differentiable RANSAC for camera localization,” in CVPR, 2017.
- [15] E. Brachmann and C. Rother, “Visual camera re-localization from RGB and RGB-D images using DSAC,” TPAMI, 2021.
- [16] ——, “Learning less is more - 6D camera localization via 3D surface regression,” in CVPR, 2018.
- [17] ——, “Expert sample consensus applied to camera re-localization,” in Proceedings of the IEEE/CVF International Conference on Computer Vision, 2019, pp. 7525–7534.
- [18] X. Li, S. Wang, Y. Zhao, J. Verbeek, and J. Kannala, “Hierarchical scene coordinate classification and regression for visual localization,” in Proceedings of the IEEE/CVF Conference on Computer Vision and Pattern Recognition, 2020, pp. 11 983–11 992.
- [19] R. Arandjelovic, P. Gronat, A. Torii, T. Pajdla, and J. Sivic, “Netvlad: Cnn architecture for weakly supervised place recognition,” in Proceedings of the IEEE conference on computer vision and pattern recognition, 2016, pp. 5297–5307.
- [20] Y. Ge, H. Wang, F. Zhu, R. Zhao, and H. Li, “Self-supervising fine-grained region similarities for large-scale image localization,” in European Conference on Computer Vision, 2020.
- [21] A. Gordo, J. Almazan, J. Revaud, and D. Larlus, “End-to-end learning of deep visual representations for image retrieval,” IJCV, 2017.
- [22] A. Kendall, M. Grimes, and R. Cipolla, “Posenet: A convolutional network for real-time 6-dof camera relocalization,” in Proceedings of the IEEE international conference on computer vision, 2015, pp. 2938–2946.
- [23] A. Kendall and R. Cipolla, “Geometric loss functions for camera pose regression with deep learning,” in IEEE conference on computer vision and pattern recognition, 2017, pp. 5974–5983.
- [24] Y. Shavit, R. Ferens, and Y. Keller, “Learning multi-scene absolute pose regression with transformers,” in IEEE/CVF International Conference on Computer Vision, 2021, pp. 2733–2742.
- [25] S. Chen, Z. Wang, and V. Prisacariu, “Direct-posenet: absolute pose regression with photometric consistency,” in 2021 International Conference on 3D Vision (3DV). IEEE, 2021, pp. 1175–1185.
- [26] S. Chen, X. Li, Z. Wang, and V. A. Prisacariu, “Dfnet: Enhance absolute pose regression with direct feature matching,” in ECCV 2022. Tel Aviv, Israel, October 23–27, 2022, Part X. Springer, 2022.
- [27] S. Brahmbhatt, J. Gu, K. Kim, J. Hays, and J. Kautz, “Geometry-aware learning of maps for camera localization,” in IEEE conference on computer vision and pattern recognition, 2018.
- [28] A. Moreau, N. Piasco, D. Tsishkou, B. Stanciulescu, and A. de La Fortelle, “Coordinet: uncertainty-aware pose regressor for reliable vehicle localization,” in IEEE/CVF Winter Conference on Applications of Computer Vision, 2022.
- [29] T. Sattler, Q. Zhou, M. Pollefeys, and L. Leal-Taixe, “Understanding the limitations of cnn-based absolute camera pose regression,” in IEEE/CVF conference on computer vision and pattern recognition, 2019.
- [30] G. Berton, G. Trivigno, B. Caputo, and C. Masone, “Eigenplaces: Training viewpoint robust models for visual place recognition,” in Proceedings of the IEEE/CVF International Conference on Computer Vision (ICCV), October 2023, pp. 11 080–11 090.
- [31] S. Yan, Y. Liu, L. Wang, Z. Shen, Z. Peng, H. Liu, M. Zhang, G. Zhang, and X. Zhou, “Long-term visual localization with mobile sensors,” in Proceedings of the IEEE/CVF Conference on Computer Vision and Pattern Recognition, 2023, pp. 17 245–17 255.
- [32] M. Humenberger, Y. Cabon, N. Guerin, J. Morat, J. Revaud, P. Rerole, N. Pion, C. de Souza, V. Leroy, and G. Csurka, “Robust image retrieval-based visual localization using kapture. arxiv 2020,” arXiv preprint arXiv:2007.13867.
- [33] K. Pearson, “Vii. note on regression and inheritance in the case of two parents,” proceedings of the royal society of London, vol. 58, no. 347-352, pp. 240–242, 1895.
- [34] J. L. Myers, A. D. Well, and R. F. Lorch Jr, Research design and statistical analysis. Routledge, 2013.
- [35] B. Glocker, S. Izadi, J. Shotton, and A. Criminisi, “Real-time rgb-d camera relocalization,” in 2013 IEEE International Symposium on Mixed and Augmented Reality (ISMAR). IEEE, 2013, pp. 173–179.
- [36] J. Shotton, B. Glocker, C. Zach, S. Izadi, A. Criminisi, and A. Fitzgibbon, “Scene coordinate regression forests for camera relocalization in rgb-d images,” in Proceedings of the IEEE conference on computer vision and pattern recognition, 2013, pp. 2930–2937.
- [37] T. Sattler, W. Maddern, C. Toft, A. Torii, L. Hammarstrand, E. Stenborg, D. Safari, M. Okutomi, M. Pollefeys, J. Sivic, et al., “Benchmarking 6dof outdoor visual localization in changing conditions,” in Proceedings of the IEEE conference on computer vision and pattern recognition, 2018, pp. 8601–8610.
- [38] Z. Zhang, T. Sattler, and D. Scaramuzza, “Reference pose generation for long-term visual localization via learned features and view synthesis,” International Journal of Computer Vision, vol. 129, pp. 821–844, 2021.
- [39] H. Yu, Y. Feng, W. Ye, M. Jiang, H. Bao, and G. Zhang, “Improving feature-based visual localization by geometry-aided matching,” arXiv preprint arXiv:2211.08712, 2022.
- [40] H. Bao, W. Xie, Q. Qian, D. Chen, S. Zhai, N. Wang, and G. Zhang, “Robust tightly-coupled visual-inertial odometry with pre-built maps in high latency situations,” IEEE Transactions on Visualization and Computer Graphics, vol. 28, no. 5, pp. 2212–2222, 2022.
- [41] C. Liu, Y. Zhao, and T. Braud, “Mobilearloc: On-device robust absolute localisation for pervasive markerless mobile ar,” arXiv preprint arXiv:2401.11511, 2024.