FAUST
XIII. Dusty cavity and molecular shock driven by IRS7B in the Corona Australis cluster
Abstract
Context. The origin of the chemical diversity observed around low-mass protostars probably resides in the earliest history of these systems.
Aims. We aim to investigate the impact of protostellar feedback on the chemistry and grain growth in the circumstellar medium of multiple stellar systems.
Methods. In the context of the ALMA Large Program FAUST, we present high-resolution (50 au) observations of CH3OH, H2CO, and SiO and continuum emission at 1.3 mm and 3 mm towards the Corona Australis star cluster.
Results. Methanol emission reveals an arc-like structure at 1800 au from the protostellar system IRS7B along the direction perpendicular to the major axis of the disc. The arc is located at the edge of two elongated continuum structures that define a cone emerging from IRS7B. The region inside the cone is probed by H2CO, while the eastern wall of the arc shows bright emission in SiO, a typical shock tracer. Taking into account the association with a previously detected radio jet imaged with JVLA at 6 cm, the molecular arc reveals for the first time a bow shock driven by IRS7B and a two-sided dust cavity opened by the mass-loss process. For each cavity wall, we derive an average H2 column density of 71021 cm-2, a mass of 910-3 M⊙, and a lower limit on the dust spectral index of .
Conclusions. These observations provide the first evidence of a shock and a conical dust cavity opened by the jet driven by IRS7B, with important implications for the chemical enrichment and grain growth in the envelope of Solar System analogues.
Key Words.:
Astrochemistry – Stars: formation – ISM: molecules – ISM: evolution – ISM: abundances1 Introduction
Protostellar feedback, resulting from the complex interplay between newly forming Sun-like stars and their environment, plays a crucial role in shaping the chemical composition of the interstellar medium (ISM). The injection of energy and momentum leads to a cascade of physical and chemical processes that influence the molecular composition of the ISM (e.g. Herbst & van Dishoeck, 2009; Frank et al., 2014; Ceccarelli et al., 2023, as reviews).
Feedback mechanisms, including stellar winds, jets, cavities, and outflows, create a dynamic environment (e.g. shocks) that favours the enrichment of chemical species (e.g. Bachiller et al., 2001) and pave the way for the formation of interstellar complex organic molecules (iCOMs111The lower case ‘i’ emphasises that the term ‘complex’ only applies in the context of the ISM.; i.e. organic molecules with at least six atoms; Ceccarelli et al. 2017).
Modern interferometers, such as the Atacama Large Millimeter/submillimeter Array (ALMA), enable astronomers to investigate these processes more thoroughly. However, so far, no clear symmetric dusty cavities opened by protostellar jets have been imaged.
In this context, the ALMA Large Program (LP) Fifty AU STudy of the chemistry in the disk/envelope system of Solar-like protostars (FAUST)222http://faust-alma.riken.jp; see Codella et al. (2021). is designed to characterise the chemical diversity of young solar-like protostars down to a spatial resolution of 50 au.
FAUST has shown that the chemical structure of molecular envelopes on scales of 1000 au is influenced by protostellar outflow activity (e.g. Okoda et al., 2021). New case studies are needed to further investigate the role of protostellar feedback on the different scales of envelope–disc systems.
One of the FAUST targets is the nearby Corona Australis (CrA) complex. This region has been the subject of numerous observational campaigns (e.g. Knacke et al. 1973, Harju et al. 1993 and Neuhäuser & Forbrich 2008). Several Class 0/I protostars have been identified and characterised in terms of both their chemical (e.g. Groppi et al. 2007; Watanabe et al. 2012 and Lindberg et al. 2014) and physical properties (e.g. Nutter et al. 2005; Cazzoletti et al. 2019 and Sandell et al. 2021).
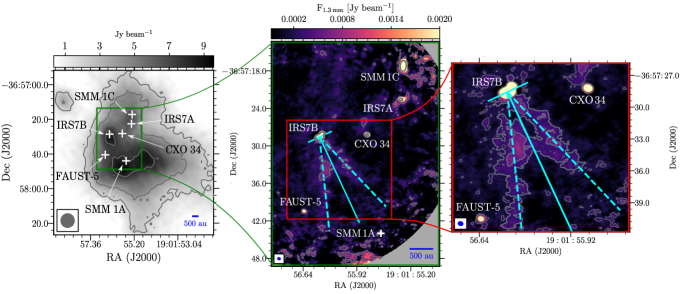
IRS7B is the protostar at the centre of the CrA cluster, and is classified as a transitional Class 0/Class I object (Groppi et al., 2007; Watanabe et al., 2012). Recently, IRS7B was resolved into a binary system formed by IRS7B-a and IRS7B-b (Ohashi et al. 2023), both associated with discs aligned with a position angle (PA) of 115∘ and an inclination of 65∘ (Takakuwa et al., 2024). The cluster also contains CXO 34 and IRS7A, two embedded Class I protostars, and SMM 1C (Class 0; Peterson et al., 2011; Lindberg et al., 2015). These studies also revealed prominent continuum emission from SMM 1A, observed with SCUBA-2 at 450 m (Fig. 1; left) and located 2000 au southwest of IRS7B; its nature is still unclear. SMM 1A has been interpreted as either a quiescent prestellar object (e.g. Nutter et al., 2005) or a filamentary structure affected by external irradiation by the Herbig Ae/Be star R-CrA (e.g. Lindberg & Jørgensen, 2012; Perotti et al., 2023).
The present Letter casts a new light on SMM 1A; we present an investigation of the protostellar feedback of IRS7B on the chemical properties of the ISM in the formation of multiple star–disc systems in CrA.
2 Observations and data reduction
The CrA complex was observed as part of the FAUST ALMA LP between October 2018 and September 2019 (2018.1.01205.L; PI: S. Yamamoto; Codella et al. 2021) at a resolution of 04 (52 au at the CrA distance of 130 pc; Lindberg et al. 2014). We observed three spectral setups, one in Band 3 (85-101 GHz) and two in Band 6 (214-234 GHz and 242-262 GHz). Appendix A summarises the telescope setups for both the 12m array and the Atacama Compact Array (ACA; Band 6 only). The average maximum recoverable scale is 21 (2700 au). All observations were made with a precipitable water vapour of 2.0 mm.
The observations were centred on (). The absolute flux calibration uncertainty is 10%. Data were calibrated employing the CASA pipeline 6.2.1-7 (The CASA Team et al. 2022), including additional routines to correct for system temperature and spectral normalisation issues333https://help.almascience.org/index.php?/Knowledgebase/Article/View/419, and self-calibrated using line-free channels. The final continuum-subtracted line-cubes were cleaned (Hogbom deconvolver) with briggs weighting scheme with robust (App. A). The typical rms noise is 0.08 mJy beam-1 for continuum and 0.8–3 mJy beam-1 per channel for lines. Self-calibration improved the dynamic range of the continuum maps by factors of between 3 and 10 depending on the data set. The primary beam correction was applied to all the
images.
| Transitions | (a) | log | [K km s-1](a) | ||||||
|---|---|---|---|---|---|---|---|---|---|
| (MHz) | (K) | (s-1) | (km s-1) | (104 cm-3) | “A” | “B” | “C” | ||
| CH3OH-A (80,8-71,7) | 95169.391 | 84 | 68 | 1.54 | 1.3 – 1.4 | 8.6 | 4.1 | 6.1 | |
| CH3OH-A (21,2-11,1) | 95914.310 | 22 | 20 | 1.54 | 2.0 – 2.1 | 4.1 | 1.8 | 3.9 | |
| CH3OH-A (31,3-40,4) | 107013.831 | 28 | 28 | 0.17 | 3.2 – 3.5 | 4.5 | 2.8 | ||
| SiO (5-4) | 217104.980 | 31 | 11 | 0.51 | 153.1 – 156.1 | 1.2 | 3.7 | ||
| CH3OH-E (42,3-31,2) | 218440.063 | 46 | 36 | 0.17 | 24.3 – 23.4 | 19.2 | 8.6 | 9.2 | |
| p-H2CO (30,3-20,2) | 218222.192 | 21 | 7 | 0.17 | 160.1 – 183.0 | 14.3 | 8.9 | 17.9 | |
| CH3OH-A (51,4-41,3) | 243915.788 | 50 | 44 | 0.15 | 19.9 – 21.1 | – | 6.9 | 3.9 | |
3 Results
3.1 Continuum emission
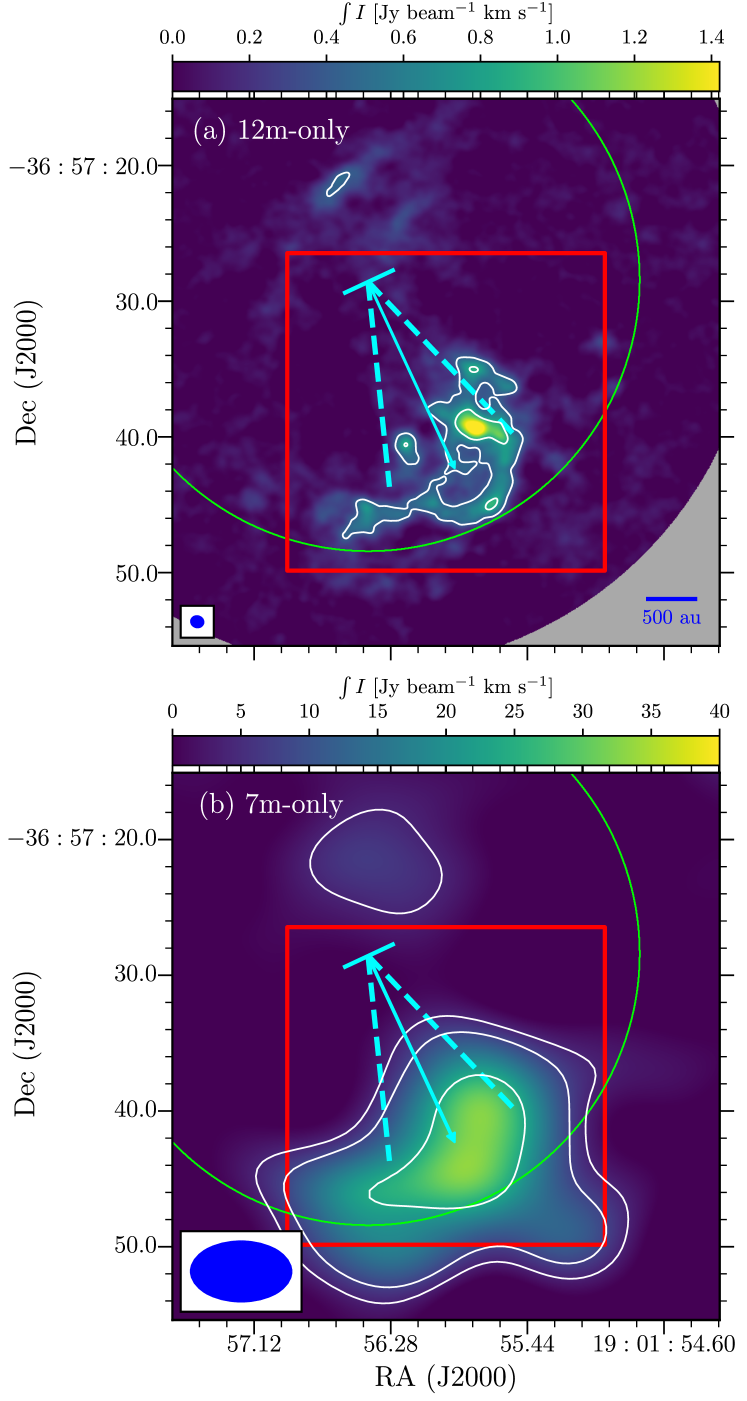
Figure 1 (central) shows the spatial distribution of dust continuum emission at 1.3 mm in the CrA field, where four compact sources are detected: IRS7B, CXO 34, IRS7A, and SMM1-C. For these sources, the position of the 1.3 mm continuum peaks derived with a 2D Gaussian fit (Appendix B) matches the coordinates reported by Lindberg et al. (2014). In addition, a fifth source (labelled FAUST-5) is detected for the first time SE of IRS7B. No compact counterpart has been identified in the molecular lines in FAUST, suggesting a potential extragalactic origin.
More intriguingly, the continuum emission reveals the existence of two elongated structures SW of the field. These structures are detected (3) up to 1000 au (SW) and 1700 au (S), respectively, from IRS7B. A zoom onto the central region (Fig. 1; right) shows that the two structures are symmetric with respect to the normal direction of the disc and extend along the expected direction of the outflow driven by IRS7B, with an opening angle of 50∘ (dashed lines). Following Sabatini et al. (2023), we estimate the H2 column density and mass of the cavity walls, assuming optically thin dust emission, a dust temperature of 30 K (Perotti et al., 2023), a standard gas-to-dust ratio of 100, and a dust opacity of = 0.9 cm2 g-1 (Ossenkopf & Henning, 1994), which are typical values for icy mantle dust grains and well reproduce multi-wavelength observations of low-mass star-forming regions (e.g. Evans et al., 2001; Shirley et al., 2005). The average (H2) and mass of each cavity wall are 71021 cm-2 and 910-3 M⊙, respectively.
This mass corresponds to 0.1 of the IRS7B envelope mass estimated by van Kempen et al. (2009).
Taking into account an uncertainty of 10% in the absolute flux calibration of the ALMA data, 15% in the assumed dust temperature (e.g. Sabatini et al., 2022) and 30% for the dust opacity (e.g. Sanhueza et al., 2019), the overall uncertainty for (H2) and the mass of each cavity wall is 35%.
3.2 Line emission
We mapped the molecular emission of five CH3OH lines, associated with a range of upper level energy, , from 21 K to 84 K, para-H2CO (30,3-20,2), and SiO (5-4) (see Table 1). Figure 2 shows the integrated intensity maps (moment 0 maps) of the brightest lines over the velocity range [0, ] km s-1.
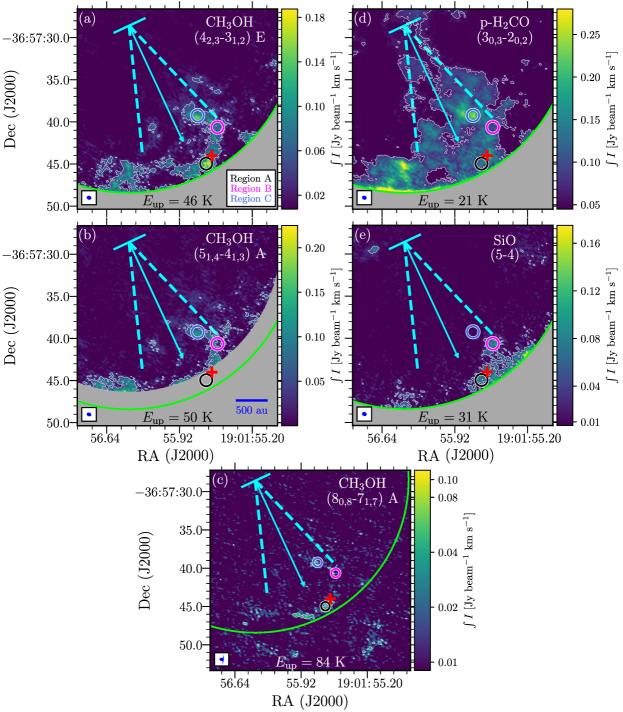
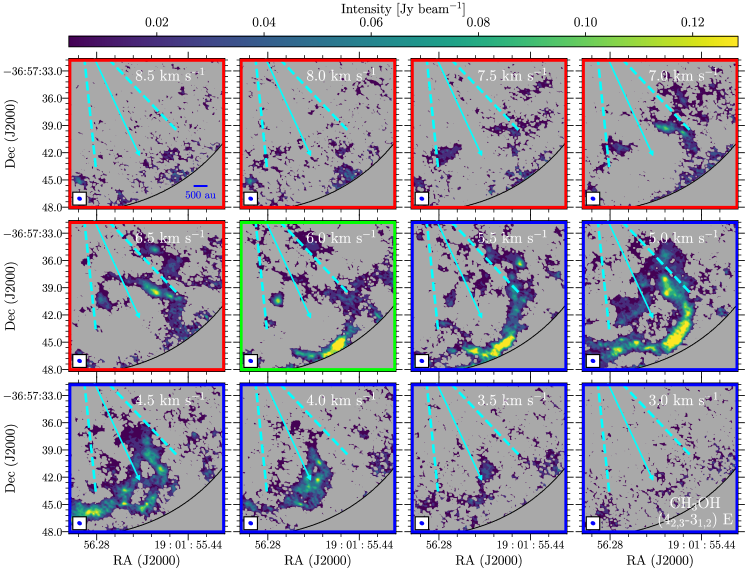
Figure 2a shows the spatial distribution of the CH3OH-E (42,3-31,2), and reveals a molecular-arc structure that is confined within the two elongated structures detected in continuum. The arc has a length of 3000 au and is located at a projected distance from IRS7B of 1800 au, close to the coordinates of SMM 1A (Nutter et al., 2005; Chen & Arce, 2010). Additional information is provided by the channel maps (Fig. 6a). The methanol emission extends from +3.5 to +8.0 km s-1 around the systemic velocity of IRS7B ( +6 km s-1; Ohashi et al. 2023), with most of the emission at blueshifted velocities. Similar structures are traced by the other methanol lines in Fig. 2(b, c). The CH3OH-A (80,8-71,7), detected in Band 3, shows several bright spots consistent with the CH3OH 42,3-31,2 transition, plus fainter spots outside the Band 6 ALMA field of view (FoV; green circle in Fig. 2). This is consistent with the distribution of CH3OH in Band 6 in the ACA-only maps, where the emission is recovered on a larger FoV at the expense of angular resolution (see Appendix A). In the CH3OH-A (51,4-41,3) line, part of the arc structure falls outside the FoV, which is smaller at 244 GHz compared to that at 218 GHz. The other methanol lines with low (i.e. 22 K and 28 K; Table 1) do not allow a clear identification of the arc-like structure. However, these lines are also detected at 3 in the spectra integrated on the brightest emission peaks of the arc structure (Appendix B).
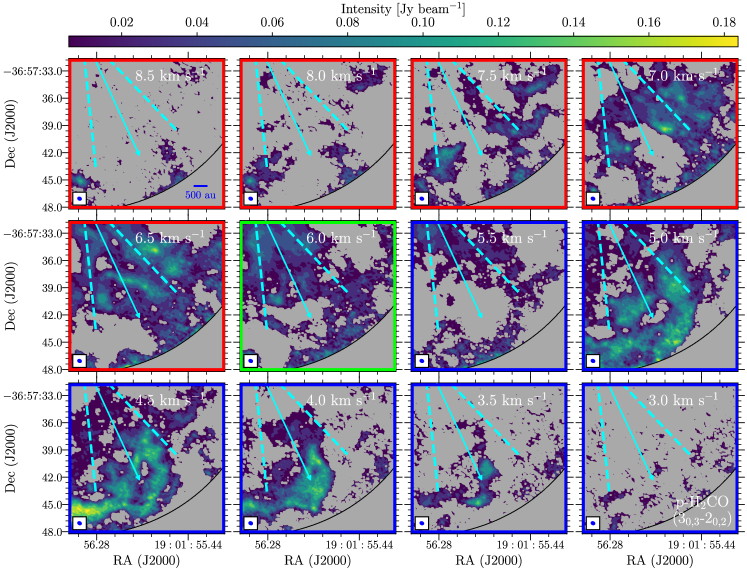
The emission from para-H2CO (30,3-20,2), hereafter referred to as p-H2CO, is more extended than that from methanol; it probes both the arc structure, similarly to CH3OH, and an extended component confined mostly within the boundaries of the cone probed by the dust at 1.3 mm (Fig. 2d). The channel maps show that, at redshifted velocities and close to , the p-H2CO emission is extended over a large portion of the FoV, and therefore it is likely contaminated by envelope emission, while it follows the methanol distribution at blueshifted velocities (Fig. 6b), revealing arc structures.
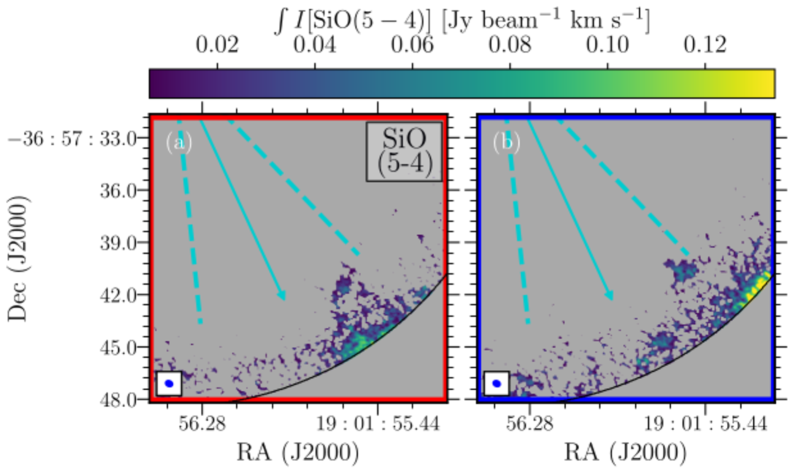
The SiO (5-4) moment 0 map reveals two emitting regions (Fig. 2e): the first overlaps on the SW side of the molecular arc traced by CH3OH and H2CO; the second is located at the edge of the FoV, beyond the CH3OH molecular arc, at a distance of 2100 au from IRS7B. The channel maps show that SiO has the predominant emission component in the blueshifted regime similarly to CH3OH and H2CO (Fig. 7). This suggests that the blueshifted emission of SiO is also associated with the arc-structure revealed by CH3OH and H2CO (see Sect. 5).
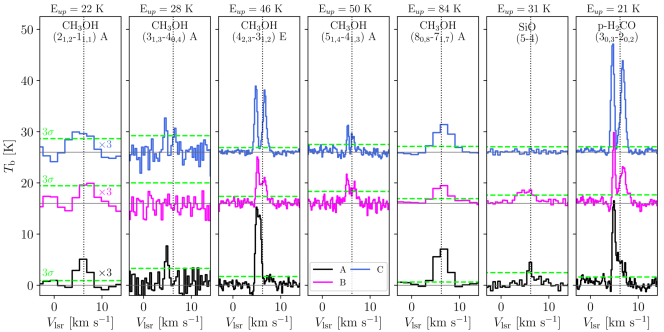
3.3 Physical properties of the molecular arc
To determine the physical conditions of the emitting gas in the molecular arc, we extracted the spectra of all the observed lines at three positions along the arc structure, labelled ‘A’, ‘B’, and ‘C’, and centred at the peak positions of CH3OH (42,3-31,2), SiO (5-4), and p-H2CO (30,3-20,2), respectively (Fig. 2). Each region has an equivalent area of nine ALMA beams. The spectra and the line fitting are discussed in Appendix B.
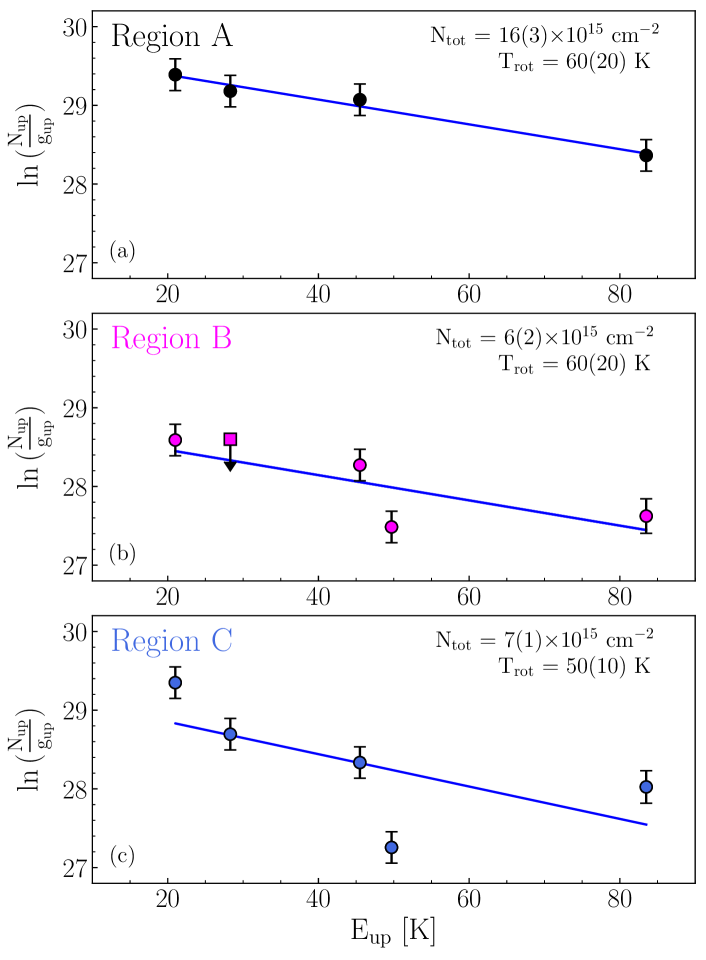
Assuming local thermodynamic equilibrium (LTE) and optically thin emission, we constructed rotational diagrams (RDs) to quantify the column density, , and the rotational temperature, , of CH3OH (Fig. 3) observed in the ‘A’, ‘B’, and ‘C’ positions. It is assumed that the methanol A/E ratio is equal to unity, which is a good approximation for temperatures of K (Wirström et al., 2011; Carney et al., 2019). We derived the critical densities of the observed lines (Table 1) assuming a temperature range of 50-100 K and taking into account downward collision rates in a multi-level system (see Draine, 2011). The critical densities range from 104 cm-3 to 2106 cm-3 —below the average H2 number densities determined for SMM 1A (i.e. 106 cm-3; Lindberg & Jørgensen 2012)—, which supports the assumption of LTE conditions. The RD analysis is obtained using the line intensity integrated on the blueshifted arc component. Taking into account the calibration uncertainty and the rms of the lines spectra, the errors on the integrated intensities is 20%.
The methanol are between 621015 cm-2 and 1631015 cm-2, with of 50-60 K. In region ‘A’, where methanol peaks, we performed a non-LTE large velocity gradient (LVG) analysis using the grelvg code (Ceccarelli et al., 2003). The resulting 70-90 K and 2-61015 cm-2 are in agreement with those derived from the RDs. Indeed the derived line opacities () and gas densities (2107 cm-3) support the LTE and optically thin RD assumptions. Our results are consistent with the previous estimate by Perotti et al. (2023), who observed SMM 1A, combining Submillimeter Array (SMA) and Atacama Pathfinder Experiment (APEX) observations, and assuming a 30 K.
7
Assuming the same range of as that obtained for CH3OH, we derive 0.8–21014 cm-2. Our values are approximately consistent with the values reported for SMM 1A by Lindberg & Jørgensen (2012), 1013–1014 cm-2, which are based on SMA/APEX observations with a resolution of 6″3″, and a 48 K. Finally, we derived the total column density of SiO, a typical shock-induced sputtering tracer (see Section 4), assuming a temperature range of 50-150 K (e.g. Podio et al., 2021), obtaining = 1-3 1013 cm-2 towards the SiO emitting peak (B). The estimated , as well as the [CH3OH]/[SiO] and [CH3OH]/[H2CO] abundance ratios (250-600, and 40-130, respectively), are in agreement with the values derived in shocked regions around low-mass protostars (e.g. Bachiller & Pérez Gutiérrez 1997; Cuadrado et al. 2017; Podio et al. 2021; De Simone et al. 2022).
4 Discussion
The ALMA-FAUST data reveal an extended molecular arc-structure traced by CH3OH, where emission due to H2CO and SiO has also been detected. The arc is located in the SW region of the CrA cluster and matches the coordinates of SMM 1A. The RD analysis of the CH3OH lines supports that the arc is a coherent structure with relatively constant and . The H2CO distribution shows that the arc is connected to the IRS7B system at the CrA cluster centre.
4.1 Physical origin of the molecular arc in CrA
Methanol is one of the most abundant iCOMs detected in star-forming regions and is considered a key precursor of many prebiotic compounds in space (e.g. Herbst & van Dishoeck, 2009; Ceccarelli et al., 2023). The main chemical process for synthesising CH3OH is CO hydrogenation on grains, in which CO is converted to H2CO and then to methanol. This process is extremely efficient in solid phase during the early stages of star formation (e.g. Watanabe & Kouchi, 2002; Fuchs et al., 2009; Santos et al., 2022) when the gas temperatures are 20 K, cm-3, and CO is strongly depleted at the surface of dust grains (e.g. Caselli et al. 1999; Bergin et al. 2002; Sabatini et al. 2019, 2021, 2022). The detection of methanol in the arc-structure in CrA can be associated with either () external irradiation (see e.g. Cuadrado et al., 2017) or () shocked regions (e.g. Ceccarelli et al., 2023, and references therein).
The first interpretation was proposed by Lindberg & Jørgensen (2012), who derived a map of H2CO rotational temperature based on SMA/APEX observations with a resolution of 6″3.
The authors found in the 60-100 K range, and interpreted this high value as a consequence of external illumination by the Herbig Ae/Be star R CrA located at 50″ in the NW direction (i.e. 6500 au at the cluster distance). The interstellar radiation field in SMM 1A would increase by a factor of 750 to 3000 when assuming a luminosity of 100-200 L⊙ for R CrA, respectively. This picture is in agreement with the recent estimates of Sissa et al. (2019), who report an R CrA luminosity of 130 L⊙, and with the relatively small full width at half maximums (FWHMs) of the CH3OH and H2CO lines (1.2 km s-1) fitted in Fig. 8. Nevertheless, the 50 au angular resolution of the FAUST data enabled us to resolve the arc structure with unprecedented accuracy, that is, a factor of 10 greater accuracy than in Lindberg & Jørgensen 2012. The newly discovered arc morphology found in SMM 1A would suggest a source of illumination in the southwest (outside the ALMA FoV) or in the cluster centre. Remarkably, no major illumination source is found in either direction, as only the IRS7B system ( L⊙; Lindberg et al. 2014) and the prestellar source SMM 1As ( L⊙; Sicilia-Aguilar et al. 2013) have been reported in the literature within 50″ of SMM 1A.
On the other hand, the SiO detection at the edge of the CH3OH arc supports the second scenario, in which the arc is the fingerprint of a shocked region. Indeed, SiO is mainly formed by the shock-induced sputtering and/or shattering of the grain mantles and refractory cores (e.g. Caselli et al., 1997; Gusdorf et al., 2008a, b; Jiménez-Serra et al., 2008; Guillet et al., 2011). In this case, the arc-shape suggests the occurrence of a jet driven by IRS7B towards the SW. Moreover, the molecular arc revealed by FAUST is blueshifted, in agreement with the disc flaring reported by Takakuwa et al. (2024), indicating that the near disc-side is to the NE, and therefore the blueshifted jet is towards the SW.
Evidence of outflowing material in CrA was first suggested by Levreault (1988) based on 12CO (2-1) data collected with the Millimeter Wave Observatory (MWO). Although the coarse resolution of the MWO (13) prevented the identification of the driving source(s), the blueshifted wing of the outflow is aligned along the direction connecting IRS7B with SMM 1A.
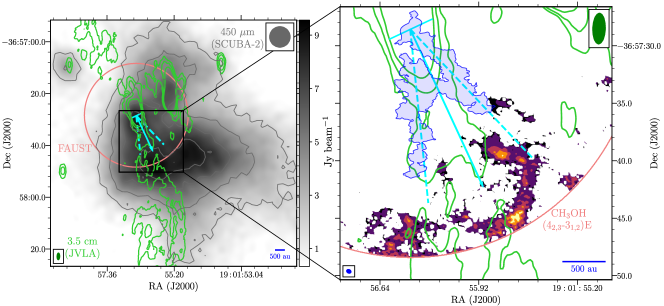
Radio continuum observations with ATCA555Australia Telescope Compact Array (ATCA) at 3, 6, and 20 cm revealed a bipolar structure in the NE-SW direction centred on IRS7B (Harju et al., 2001; Choi et al., 2008; Miettinen et al., 2008). More recently, Liu et al. (2014) also reported an extended (70″ in the SMM 1A direction) bipolar radio jet detected at 3.5 cm with the Karl G. Jansky Very Large Array (JVLA; beam 4″2). In Fig. 4 (left panel), we show the JVLA map (green contrours; Liu et al. 2014) superimposed on the SCUBA-2 map at 450 m (grey scale666Reduced data can be found at the Canadian Astronomy Data Centre (Project-ID: MJLSG35; https://www.cadc-ccda.hia-iha.nrc-cnrc.gc.ca/en/search/).).
What originally appeared in the SCUBA-2 data as an overdensity of cold gas (e.g. Nutter et al., 2005; Chen et al., 2010) overlaps with both () the direction of propagation of the radio-jet discovered by Liu et al. (2014) and () the molecular arc traced by methanol (see Fig. 4, right).
Moreover, the region in which the radio-jet would collide with the arc also corresponds to the zone in which the derived in Lindberg & Jørgensen (2012) reaches its maximum values. In conclusion, based on the arc-shape, the association with the radio jet detected at centimetre wavelengths, and the detection of a typical shock tracer, namely SiO, we conclude that the observed molecular arc is most likely the signature of a bow-shock driven by IRS7B.
4.2 First imaging of symmetric dusty cavity walls
In light of these findings, the ‘V’-shaped structure detected in continuum (Fig. 4, right) traces the dust emission from the cavity walls opened by the IRS7B outflow. This is in agreement with the direction of the JVLA radio jet with the orientation of the cavity observed by ALMA (Fig. 4). To our knowledge, this is the first imaging of symmetric cavity walls of dust opened by a jet (on scales of 50 au) in a low-mass star-forming system.
This provides a unique opportunity to study the dust properties at the edge of an outflow cavity. Under the Rayleigh–Jeans approximation, both the size and the properties of interstellar dust grains can be inferred from the spectral index of the dust spectral energy distribution at (sub)millimetre wavelengths ().
We measure in the cavity walls using Band 6 (1.3 mm) and Band 3 (3mm) continuum maps. In Band 3, the cavity walls are not detected, and so we derive a lower limit .
The spectral index for typical ISM grains is 3.7 (Testi et al., 2014), while low values (down to 1.5) have been observed in the inner few hundred astronomical units (au) around Class 0/I sources. Low values can be due to dust growth (e.g. Chiang et al., 2012; Miotello et al., 2014; Galametz et al., 2019), while recent theoretical calculations and observations show that large grains in the envelope may be the result of transport from the site of growth, the inner dense disc, to the envelope via magnetohydrodynamical (MHD) winds (Wong et al., 2016; Giacalone et al., 2019; Tsukamoto et al., 2021; Cacciapuoti et al., 2024). In this context, the estimated allows the possibility that high-density cavity walls, like those in CrA, are the sites for in situ dust growth in protostellar envelopes.
5 Conclusions
In this Letter, we present high-resolution (50 au) observations of continuum (1.3 and 3 mm) and molecular (CH3OH, H2CO and SiO) emission towards the CrA cluster in the context of the ALMA FAUST LP.
Our analysis indicates that SMM 1A, previously identified as an extended continuum structure, is associated with a shock driven by IRS7B, and mapped in CH3OH, H2CO, and SiO, and with a conical dusty cavity opened by the mass-loss process.
We estimated the H2 column density (71021 cm-2) and mass (910-3 M⊙) in the cavity walls, and a lower limit for the dust spectral index (), which could imply the presence of millimetre-sized grains.
Based on these results, we conclude that the CrA cluster may be a unique laboratory with which to investigate and test models of dust grain growth in the envelope.
Additional higher-sensitivity and higher-resolution observations of shock tracers, such as SiO and CO, are needed to reveal the IRS7B jet. The discovery of a twin system in IRS7B (Ohashi et al., 2023) opens the possibility that there are two jets. Therefore, the SiO knot could be due to precession. Further mapping of CH3OH emission in the SW region around SMM 1A and beyond the FAUST FoV is also needed to reveal additional interactions between the jet and the CrA envelope on a larger scale; our Band-3 maps already suggest their existence. This would allow us to determine the extent to which the jet influences the chemical composition of the CrA cluster. Ultimately, a more accurate estimate of will be made possible with more sensitive observations at longer wavelengths, allowing us to constrain the properties and size distribution of the dust grains in the cavity walls and to probe for the formation and/or entrainment of large grains in the envelope.
Acknowledgements.
The authors thank the anonymous Referee for suggestions that improved the manuscript, and A. Garufi for the fruitful discussion and feedback on the properties of interstellar dust. GS, LP and CC acknowledge the project PRIN-MUR 2020 MUR BEYOND-2p (“Astrochemistry beyond the second period elements”, Prot. 2020AFB3FX), the PRIN MUR 2022 FOSSILS (Chemical origins: linking the fossil composition of the Solar System with the chemistry of protoplanetary discs, Prot. 2022JC2Y93), the project ASI-Astrobiologia 2023 MIGLIORA (Modeling Chemical Complexity, F83C23000800005), and the INAF-GO 2023 fundings PROTO-SKA (Exploiting ALMA data to study planet forming disks: preparing the advent of SKA, C13C23000770005). GS acknowledges the INAF-Minigrant 2023 TRIESTE (“TRacing the chemIcal hEritage of our originS: from proTostars to planEts”; PI: G. Sabatini). LP acknowledges the INAF Mini-Grant 2022 “Chemical Origins” (PI: L. Podio). EB acknowledges support from the Deutsche Forschungsgemeinschaft (DFG, German Research Foundation) under German´s Excellence Strategy – EXC 2094 – 390783311. MB and SV acknowledge support from the European Research Council (ERC) Advanced Grant MOPPEX 833460. SBC was supported by the NASA Planetary Science Division Internal Scientist Funding Program through the Fundamental Laboratory Research work package (FLaRe). LL acknowledges the support of DGAPA PAPIIT grants IN108324 and IN112820 and CONACyT-CF grant 263356. IJ-S acknowledges funding from grants No. PID2019-105552RB-C41 and PID2022-136814NB-I00 from the Spanish Ministry of Science and Innovation/State Agency of Research MCIN/AEI/10.13039/501100011033 and by “ERDF A way of making Europe”. This Letter makes use of the following ALMA data: ADS/JAO.ALMA#2018.1.01205.L (PI: S. Yamamoto). ALMA is a partnership of the ESO (representing its member states), the NSF (USA) and NINS (Japan), together with the NRC (Canada) and the NSC and ASIAA (Taiwan), in cooperation with the Republic of Chile. The Joint ALMA Observatory is operated by the ESO, the AUI/NRAO, and the NAOJ.References
- Bachiller & Pérez Gutiérrez (1997) Bachiller, R. & Pérez Gutiérrez, M. 1997, ApJ, 487, L93
- Bachiller et al. (2001) Bachiller, R., Pérez Gutiérrez, M., Kumar, M. S. N., & Tafalla, M. 2001, A&A, 372, 899
- Balança et al. (2018) Balança, C., Dayou, F., Faure, A., Wiesenfeld, L., & Feautrier, N. 2018, MNRAS, 479, 2692
- Bergin et al. (2002) Bergin, E. A., Alves, J., Huard, T., & Lada, C. J. 2002, ApJ, 570, L101
- Cacciapuoti et al. (2024) Cacciapuoti, L., Testi, L., Podio, L., et al. 2024, ApJ, 961, 90
- Carney et al. (2019) Carney, M. T., Hogerheijde, M. R., Guzmán, V. V., et al. 2019, A&A, 623, A124
- Caselli et al. (1997) Caselli, P., Hartquist, T. W., & Havnes, O. 1997, A&A, 322, 296
- Caselli et al. (1999) Caselli, P., Walmsley, C. M., Tafalla, M., Dore, L., & Myers, P. C. 1999, ApJ, 523, L165
- Cazzoletti et al. (2019) Cazzoletti, P., Manara, C. F., Baobab Liu, H., et al. 2019, A&A, 626, A11
- Ceccarelli et al. (2017) Ceccarelli, C., Caselli, P., Fontani, F., et al. 2017, ApJ, 850, 176
- Ceccarelli et al. (2023) Ceccarelli, C., Codella, C., Balucani, N., et al. 2023, in ASP Conference Series, Vol. 534, ASP Conference Series, ed. S. Inutsuka, Y. Aikawa, T. Muto, K. Tomida, & M. Tamura, 379
- Ceccarelli et al. (2003) Ceccarelli, C., Maret, S., Tielens, A. G. G. M., Castets, A., & Caux, E. 2003, A&A, 410, 587
- Chen et al. (2010) Chen, H.-R., Liu, S.-Y., Su, Y.-N., & Zhang, Q. 2010, ApJ, 713, L50
- Chen & Arce (2010) Chen, X. & Arce, H. G. 2010, ApJ, 720, L169
- Chiang et al. (2012) Chiang, H.-F., Looney, L. W., & Tobin, J. J. 2012, ApJ, 756, 168
- Choi et al. (2008) Choi, M., Hamaguchi, K., Lee, J.-E., & Tatematsu, K. 2008, ApJ, 687, 406
- Codella et al. (2021) Codella, C., Ceccarelli, C., Chandler, C., et al. 2021, FSPAS, 8, 227
- Cuadrado et al. (2017) Cuadrado, S., Goicoechea, J. R., Cernicharo, J., et al. 2017, A&A, 603, A124
- De Simone et al. (2022) De Simone, M., Codella, C., Ceccarelli, C., et al. 2022, MNRAS, 512, 5214
- Draine (2011) Draine, B. T. 2011, Physics of the Interstellar and Intergalactic Medium by Bruce T. Draine. Princeton University Press
- Evans et al. (2001) Evans, Neal J., I., Rawlings, J. M. C., Shirley, Y. L., & Mundy, L. G. 2001, ApJ, 557, 193
- Frank et al. (2014) Frank, A., Ray, T. P., Cabrit, S., et al. 2014, in Protostars and Planets VI, ed. H. Beuther, R. S. Klessen, C. P. Dullemond, & T. Henning, 451–474
- Fuchs et al. (2009) Fuchs, G. W., Cuppen, H. M., Ioppolo, S., et al. 2009, A&A, 505, 629
- Galametz et al. (2019) Galametz, M., Maury, A. J., Valdivia, V., et al. 2019, A&A, 632, A5
- Giacalone et al. (2019) Giacalone, S., Teitler, S., Königl, A., Krijt, S., & Ciesla, F. J. 2019, ApJ, 882, 33
- Ginsburg et al. (2022) Ginsburg, A., Sokolov, V., de Val-Borro, M., et al. 2022, AJ, 163, 291
- Groppi et al. (2007) Groppi, C. E., Hunter, T. R., Blundell, R., & Sandell, G. 2007, ApJ, 670, 489
- Guillet et al. (2011) Guillet, V., Pineau Des Forêts, G., & Jones, A. P. 2011, A&A, 527, A123
- Gusdorf et al. (2008a) Gusdorf, A., Cabrit, S., Flower, D. R., & Pineau Des Forêts, G. 2008a, A&A, 482, 809
- Gusdorf et al. (2008b) Gusdorf, A., Pineau Des Forêts, G., Cabrit, S., & Flower, D. R. 2008b, A&A, 490, 695
- Harju et al. (1993) Harju, J., Haikala, L. K., Mattila, K., et al. 1993, A&A, 278, 569
- Harju et al. (2001) Harju, J., Higdon, J. L., Lehtinen, K., & Juvela, M. 2001, in ASP Conference Series, Vol. 235, Science with the Atacama Large Millimeter Array, ed. A. Wootten, 125
- Herbst & van Dishoeck (2009) Herbst, E. & van Dishoeck, E. F. 2009, ARA&A, 47, 427
- Jiménez-Serra et al. (2008) Jiménez-Serra, I., Caselli, P., Martín-Pintado, J., & Hartquist, T. W. 2008, A&A, 482, 549
- Knacke et al. (1973) Knacke, R. F., Strom, K. M., Strom, S. E., Young, E., & Kunkel, W. 1973, ApJ, 179, 847
- Levreault (1988) Levreault, R. M. 1988, ApJS, 67, 283
- Lindberg & Jørgensen (2012) Lindberg, J. E. & Jørgensen, J. K. 2012, A&A, 548, A24
- Lindberg et al. (2014) Lindberg, J. E., Jørgensen, J. K., Brinch, C., et al. 2014, A&A, 566, A74
- Lindberg et al. (2015) Lindberg, J. E., Jørgensen, J. K., Watanabe, Y., et al. 2015, A&A, 584, A28
- Liu et al. (2014) Liu, H. B., Galván-Madrid, R., Forbrich, J., et al. 2014, ApJ, 780, 155
- Miettinen et al. (2008) Miettinen, O., Kontinen, S., Harju, J., & Higdon, J. L. 2008, A&A, 486, 799
- Miotello et al. (2014) Miotello, A., Testi, L., Lodato, G., et al. 2014, A&A, 567, A32
- Müller et al. (2005) Müller, H. S. P., Schlöder, F., Stutzki, J., & Winnewisser, G. 2005, Journal of Molecular Structure, 742, 215
- Neuhäuser & Forbrich (2008) Neuhäuser, R. & Forbrich, J. 2008, in Handbook of Star Forming Regions, Volume II, ed. B. Reipurth, Vol. 5, 735
- Nutter et al. (2005) Nutter, D. J., Ward-Thompson, D., & André, P. 2005, MNRAS, 357, 975
- Ohashi et al. (2023) Ohashi, N., Tobin, J. J., Jørgensen, J. K., et al. 2023, ApJ, 951, 8
- Okoda et al. (2021) Okoda, Y., Oya, Y., Francis, L., et al. 2021, ApJ, 910, 11
- Ossenkopf & Henning (1994) Ossenkopf, V. & Henning, T. 1994, A&A, 291, 943
- Perotti et al. (2023) Perotti, G., Jørgensen, J. K., Rocha, W. R. M., et al. 2023, A&A, 678, A78
- Peterson et al. (2011) Peterson, D. E., o Garatti, A. C., Bourke, T. L., et al. 2011, ApJS, 194, 43
- Podio et al. (2021) Podio, L., Tabone, B., Codella, C., et al. 2021, A&A, 648, A45
- Rabli & Flower (2010) Rabli, D. & Flower, D. R. 2010, MNRAS, 406, 95
- Sabatini et al. (2021) Sabatini, G., Bovino, S., Giannetti, A., et al. 2021, A&A, 652, A71
- Sabatini et al. (2023) Sabatini, G., Bovino, S., & Redaelli, E. 2023, ApJ, 947, L18
- Sabatini et al. (2022) Sabatini, G., Bovino, S., Sanhueza, P., et al. 2022, ApJ, 936, 80
- Sabatini et al. (2019) Sabatini, G., Giannetti, A., Bovino, S., et al. 2019, MNRAS, 490, 4489
- Sandell et al. (2021) Sandell, G., Reipurth, B., Vacca, W. D., & Bajaj, N. S. 2021, ApJ, 920, 7
- Sanhueza et al. (2019) Sanhueza, P., Contreras, Y., Wu, B., et al. 2019, ApJ, 886, 102
- Santos et al. (2022) Santos, J. C., Chuang, K.-J., Lamberts, T., et al. 2022, ApJ, 931, L33
- Schöier et al. (2005) Schöier, F. L., van der Tak, F. F. S., van Dishoeck, E. F., & Black, J. H. 2005, A&A, 432, 369
- Shirley et al. (2005) Shirley, Y. L., Nordhaus, M. K., Grcevich, J. M., et al. 2005, ApJ, 632, 982
- Sicilia-Aguilar et al. (2013) Sicilia-Aguilar, A., Henning, T., Linz, H., et al. 2013, A&A, 551, A34
- Sissa et al. (2019) Sissa, E., Gratton, R., Alcalà, J. M., et al. 2019, A&A, 630, A132
- Takakuwa et al. (2024) Takakuwa, S., Saigo, K., Kido, M., et al. 2024, arXiv e-prints, arXiv:2401.08722
- Testi et al. (2014) Testi, L., Birnstiel, T., Ricci, L., et al. 2014, in Protostars and Planets VI, ed. H. Beuther, R. S. Klessen, C. P. Dullemond, & T. Henning, 339–361
- The CASA Team et al. (2022) The CASA Team, Bean, B., Bhatnagar, S., et al. 2022, PASP, 134, 114501
- Tsukamoto et al. (2021) Tsukamoto, Y., Machida, M. N., & Inutsuka, S. 2021, ApJ, 913, 148
- van Kempen et al. (2009) van Kempen, T. A., van Dishoeck, E. F., Hogerheijde, M. R., & Güsten, R. 2009, A&A, 508, 259
- Watanabe & Kouchi (2002) Watanabe, N. & Kouchi, A. 2002, ApJ, 571, L173
- Watanabe et al. (2012) Watanabe, Y., Sakai, N., Lindberg, J. E., et al. 2012, ApJ, 745, 126
- Wiesenfeld & Faure (2013) Wiesenfeld, L. & Faure, A. 2013, MNRAS, 432, 2573
- Wirström et al. (2011) Wirström, E. S., Geppert, W. D., Hjalmarson, Å., et al. 2011, A&A, 533, A24
- Wong et al. (2016) Wong, Y. H. V., Hirashita, H., & Li, Z.-Y. 2016, PASJ, 68, 67
Appendix A Details on data reduction
Table 2 summarises the details of the dataset acquired with ALMA for the CrA stellar cluster in the context of the FAUST Large Program (see Codella et al. 2021). The B6 data were acquired over 12 spectral windows (SPWs) with a bandwidth ()/frequency resolution () of 59 MHz/122 kHz (67-82 km s-1/0.17-0.20 km s-1), whilst 6 SPWs of 59 MHz/61 kHz (160-190 km s-1/0.20 km s-1) were observed in B3. In all spectral settings, one additional SPW of 1.9 GHz was dedicated to the thermal dust continuum emission, i.e. 2294 (B6s1), 2404 (B6s2), and 5917 km s-1 (B3). For the latter, was 0.5 MHz for B6s1 (0.72 km s-1) and B3 (1.54 km s-1), and 1.1 MHz (1.39 km s-1) for B6s2. Details of the observations and of the calibrators are summarised in Table 2. The average angular scales covered at these frequencies range from a synthesised beam, , of 0403 to a maximum recoverable scale, , of 21″ ; that is, 52-2700 au at the source distance of 130 pc (Lindberg et al. 2014). The final datacubes were obtained combining different ALMA configurations, including the 12m array and the ACA. Figure 5 shows an example of how the distribution of CH3OH (42,3-31,2) E, observed in B6-s1, varies with the array used.
After the data were calibrated (Sect. 2), we followed a two-step deconvolution procedure for imaging: () An initial deconvolution was performed with a relatively low threshold (4.5 times the dirty noise) and without masking the emission. A reference mask was generated applying the same threshold to the image obtained in this way. () Then, a second deconvolution cycle was performed using the mask generated in step- as starting point for the auto-multithresh option in tclean. This two-step procedure ensures that all channels, including those with strong spatial filtering, have been properly masked.
| Fields | Band 3 | Band 6 | Band 6 |
|---|---|---|---|
| (B3) | (B6s1) | (B6s2) | |
| range (GHz) | 85.0–89.0, | 214.0–219.0, | 242.5–247.5, |
| 97.0–101.0 | 229.0–234.0 | 257.2–262.5 | |
| Configurations | C3-C6 | C1-C4 | C1-C4 |
| Bmin-Bmax | 9–1400 m | 9–1400 m | 15–3600 m |
| ACA | No | Yes | Yes |
| Antennas(a) | 47 | 45–48(12) | 45–48(12) |
| (SPW-lines)(b) | 59 MHz | 59 MHz | 59 MHz |
| 175 km s-1 | 75 km s-1 | 75 km s-1 | |
| (SPW-lines)(b) | 61 kHz | 122 kHz | 122 kHz |
| 0.2 km s-1 | 0.17 km s-1 | 0.17 km s-1 | |
| (c) | |||
| (c) | 27 | 19 | 17 |
| Calibrators | J1924-2914, | J1924-2914, | J1802-3940, |
| J1925-3401, | J2056-4714, | J1924-2914, | |
| J1937-3958 | J1957-3845 | J2056-4714 |
Appendix B Additional notes and results
B.1 Source properties at 1.3 mm
We used the 2D Gaussian fit algorithm provided by CASA (The CASA Team et al. 2022) to analyse the 1.3 mm continuum maps (see Section 3.1) and extract the properties of each source identified in the CrA cluster.
The fitting algorithm provided the positions of the continuum peaks of each source, the intensity of the continuum peaks, , and the integrated flux density, d, over a circular region encompassing the entire 3 continuum emission. A summary of these parameters is presented in Table 3.
| Source-ID | d | |||
|---|---|---|---|---|
| hh:mm:ss.ss | dd:mm:ss.ss | mJy/beam | mJy | |
| IRS7B | 19:01:56.42 | -36:57:28.58 | 190 | 304 |
| SMM 1C | 19:01:55.30 | -36:57:17.23 | 97 | 269 |
| IRS7A | 19:01:55.33 | -36:57:22.60 | 17 | 20 |
| CXO 34 | 19:01:55.79 | -36:57:28.23 | 16 | 16 |
| FAUST-5 | 19:01:56.63 | -36:57:40.49 | 4 | 4 |
B.2 Channel maps, velocity structures, and spectra
In this subsection we report the channel maps of CH3OH (42,3-31,2) and p-H2CO (30,3-20,2) and the integrated intensity maps of the blueshifted and redshifted components of SiO (5-4) emission, respectively, in Figures 6(a,b), and 7. The velocity structures defined by the three molecular tracers are masked at the 3 level. The green framed panels in Figure 6 indicate the systemic velocity of IRS7B, while the blue- and red-framed panels represent the blueshifted and redshifted components of the emission, respectively. The same colour code was used in Figure 7.
Figures 6(a,b) show one velocity channel in steps of three original spectral resolution elements, while in Figure 7 we show the integrated blueshifted and redshifted components of SiO (5-4) in the velocity ranges of [+6.7, +12] km s-1 and [0, +6.2] km s-1, respectively. Cyan lines and arrows follow Figure 1, and trace the supposed outflow cavity walls detected at 1.3 mm with ALMA (Section 4). Notably, the region shown in Figure 7 is the only part of the ALMA FoV where extended integrated SiO emission is observed.
Figure 8 shows the spectra of all the observed lines extracted at three positions along the arc structure, centred at the peak positions of CH3OH (42,3-31,2), SiO (5-4) and p-H2CO (30,3-20,2), labelled A, B and C, respectively. The targeted lines are detected with a signal-to-noise ratio of 3. The exceptions are the CH3OH-A (31,3-40,4) at position B and the SiO (5-4) at position C, where we derived 3 upper limits (Table 1). All the CH3OH and H2CO lines observed with a spectral resolution of 0.5 km s-1 show double-peaked profiles, with the redshifted component associated with extended envelope emission, and the blueshifted one due to the arc (see Appendix B). We used the Python Spectroscopic Toolkit (PySpecKit; Ginsburg et al. 2022) to fit the spectra assuming two Gaussian components. In regions B and C, the blueshifted lines have peak velocities of +5 km s-1 and a narrow FWHM of 1 km s-1. The red components are centred at +6.6 km s-1, and have FWHMs of between 1 and 1.2 km s-1. The low-frequency methanol lines ( = 22 K, and 84 K) observed with a spectral resolution of 1.54 km s-1 show single Gaussian-like profiles. The lines peak between +5.7 and +6.3 km s-1, close to . The detection of a single Gaussian line in the low-resolution data is due to the coarse spectral resolution. On the other hand, the line width of SiO at position B is km s-1.
The integrated line intensities of the multiple CH3OH transitions were used to construct rotational diagrams and quantify the column density and rotational temperature of CH3OH along the molecular arc (see Sect. 3.3).