[1]\fnmSuyanpeng \surZhang
[1]\orgdivDaniel J. Epstein Department of Industrial and Systems Engineering, Viterbi School of Engineering, \orgnameUniversity of Southern California, \orgaddress\street3715 McClintock Ave, \cityLos Angeles, \postcode90089, \stateCA, \countryUSA
2]\orgdivDepartment of Industrial Engineering, \orgnameUniversidad de Chile, \orgaddress\streetBeauchef 850, \citySantiago, \postcode8370451, \stateRegión Metropolitana, \countryChile
Optimizing Vaccine Site Locations While Considering Travel Inconvenience and Public Health Outcomes
Abstract
During the COVID-19 pandemic there were over three million infections in Los Angeles County (LAC). To facilitate distribution when vaccines first became available, LAC set up six mega-sites for dispensing a large number of vaccines to the public. To understand if another choice of mega-site location would have improved accessibility and health outcomes, and to provide insight into future vaccine allocation problems, we propose a multi-objective mixed integer linear programming model that balances travel convenience, infection reduction, and equitable distribution. We provide a tractable objective formulation that effectively proxies real-world public health goals of reducing infections while considering travel inconvenience and equitable distribution of resources. Compared with the solution empirically used in LAC in 2020, we recommend more dispersed mega-site locations that result in a 28% reduction in travel inconvenience and averts an additional 1,000 infections.
keywords:
Vaccine sites, Vaccine allocation, COVID-19, Travel inconvenienceHighlights
-
•
We formulate an optimization model to select vaccination sites that consider commuting patterns and public health outcomes.
-
•
We devise a tractable expression for incorporating health outcomes into the optimization objective that takes into account vaccination targets, prioritization over areas with a higher risk of becoming infectious, and equitable distribution.
-
•
We implement the optimization model with empirical COVID-19 and traffic data in Los Angeles County. We find that with a proper setup, both travel inconvenience and public health outcomes can be improved from the empirically used solution.
1 Introduction
The COVID-19 pandemic resulted in over three million infections in Los Angeles County (LAC), imposing significant burdens on both public health and the economy for the entire population [1]. Months after the COVID-19 outbreak, vaccines were developed to control the spread of COVID-19 as well as prevent severe illness [2, 3].
When COVID-19 vaccines first became available and distribution to local pharmacies had not yet been established, the LAC Department of Public Health needed to quickly and efficiently distribute a large volume of vaccines to a population of 10 million LAC residents. LAC therefore initiated a vaccination program which used large venues such as parking lots, universities, and theme parks, referred to as ‘mega-sites,’ to facilitate mass vaccination efforts [4]. LAC used a total of six mega-sites between January to April, 2021. LAC had a sign-up system where residents provided demographic information and signed up for available mega-site appointments [5]; availability at different sites and times could be restricted depending on demographic characteristics such as age and work industry. This system essentially assigned residents to mega-sites according to rules which changed over time as vaccination restrictions were lifted to prioritize vulnerable residents [6]. In this period, each mega-site was able to administer between 200,000 to 800,000 vaccinations per month.
The locations of mega-sites should be strategically chosen to encourage vaccination for populations in high-risk infection areas, thereby reducing the disease’s spread. Additionally, these sites should be placed to reduce the overall travel inconvenience for individuals, since these additional time costs could present an additional barrier to vaccine access.
Prior work has shown that shorter trips that require less travel inconvenience and less time off work may lead to greater vaccine access [7]. However, the distribution of mega-sites in LAC was generally concentrated near downtown, resulting in long travel times for suburban residents. For example, residents in the northeast corner of LAC would need to travel as far as 60 miles to reach the nearest mega-sites. Reducing travel inconvenience to vaccination centers may expedite the uptake of vaccines, which is critical for controlling outbreaks [7, 8, 9]. Strategically placed mega-sites may therefore improve vaccination coverage.
However, prior work on healthcare facility location and health transportation typically focus on transportation costs, where transportation costs are typically measured as the distance from the home to the medical service center. This generally does not consider patients’ commuting patterns, which may mean this travel inconvenience in traditional literature may not reflect actual inconvenience to vaccine sites.
Exploiting commuting patterns to place health facilities may improve both problem realism and allow for better transportation solutions. Identifying realistic optimal locations for vaccination requires considering how vaccination would be integrated into a patient’s daily life. In particular, travel inconveniences can occur in various situations for commuters, such as when commuting to a vaccination site while on the way to or from work, or when traveling from work or home to a vaccine site and then returning to work or home afterward. LAC residents are notorious for regularly spending long periods of time traveling for work and entertainment; in fact, empirical data shows that workers in LAC travel an average of 54 minutes daily from their residence to their workplace [10]. Commuting patterns must therefore be integrated into decisions for optimal placement of mega-site locations, as individuals may travel to vaccine sites before or after work, and vaccine sites can be conveniently placed next to workplaces or close to home.
In this work, we therefore consider travel inconvenience, which considers commuting patterns, instead of total transportation costs from the home only as in traditional facility location problems. Considering commuting patterns in such an optimization problem is particularly timely, as large datasets on traffic volume, time, and speed have already been collected using road sensor data since 2013 in LAC [11]. While this data has primarily been used for traffic congestion and transportation research, it can be leveraged for critical insights into health resource distribution applications.
It is also important to consider health outcomes in addition to travel inconvenience when choosing vaccine mega-site locations. Residents from a high infection risk area should be able to be assigned to a convenient vaccination mega-site with low travel inconvenience to improve health outcomes such as the number of infections averted [12]. In this paper, we study how to optimize the locations of mega-sites and vaccine assignment for minimizing travel inconvenience and achieving desirable public health outcomes.
To do this, it is critical to understand which group should be prioritized for vaccination in order to mitigate infections. Prior work has demonstrated that geographically targeted prioritization vaccination strategies for vaccine allocation to groups at high risk of becoming infected can be effective at reducing disease burden [13, 14]. Measuring social interaction levels can be one measure to identify groups at a higher risk of infection [15]. Similar to [16], we use regional mobility and traffic flow patterns as a proxy measure for social interaction level to identifying regional subpopulations at higher risk of infection.
It is therefore important to consider commuting patterns and regional vaccine allocation prioritization when choosing vaccination mega-sites to promote vaccine accessibility and reduce disease cases. While many works have studied vaccine allocation and facility location problems for infectious disease, we here take a novel approach by integrating travel inconvenience, public health outcomes, and preferences for equitable accessibility into an optimization model to assist public health decisions around determining vaccine supply locations.
1.1 Literature Review
Prior works have studied vaccination allocation problems as well as locations of vaccination sites. However, to the best of our knowledge, they generally do not integrate both travel inconvenience and public health outcomes into the optimization objective. We review several relevant works here and highlight how our approach differs from these existing works.
There is a rich literature on facility location problems in healthcare. Traditional research on the location of healthcare facilities has primarily focused on accessibility and coverage [17, 18, 19]. Additionally, certain studies on coverage exclude travel inconvenience, focusing instead on probabilistic demand distributions [20, 21, 22]. Besides coverage problems, [23, 24] have developed models for locating medical service stations for emergency situations which focus on estimating demand and routing medical service units while considering inventory control. This contrasts with our approach where individuals travel to a vaccination center with a constant set capacity over time. [25] provided a multiobjective optimization formulation for solving the location and resource allocation problem with a focus on both transportation and equitable access. In this work, we extend this idea to include disease dynamics, expanding the traditional location problems to include multiple objectives on disease outcomes, travel inconvenience, and equitable access. For a more detailed review of works on location problems in healthcare applications, we refer the reader to [18]. In general, prior studies did not integrate commuting patterns in optimizing the locations of vaccine sites [26, 27, 28], which we do here.
A separate literature has considered health outcomes in vaccination distribution problems, but generally focuses on resource allocation as opposed to locating distribution centers [29, 30, 31, 32, 33, 34, 35, 36, 37, 38]. For example, [37] optimizes the allocation of COVID-19 vaccines by state while incorporating prevalence predictions on the future epidemic. [38] developed a linear programming formulation for optimizing vaccine allocation in the Philippines. A prioritization score is assigned to each region and is computed based on the local basic reproduction number. These studies concentrate on the allocation of resources and their impact on public health outcomes. However, they do not take into account travel inconvenience, as the placement of vaccination sites is either predetermined or not a focus of their analyses. In this paper, we not only incorporate commuting patterns into the calculation of travel inconvenience for determining vaccination site locations, but we also derive a straightforward formula that effectively captures the dynamics of infectious diseases resulting in a more efficient solution for addressing the vaccine distribution challenge while taking into account the complexities of disease spread.
We consider regional vaccine allocation prioritization in our formulation. Geographical prioritization strategies for vaccination allocation have demonstrated their efficiency in safeguarding groups at high risk of becoming infected [13, 14, 15, 39, 40, 41, 42, 43, 44]. Numerous techniques have been proposed to geographically prioritize groups at high risk of infection [39, 45, 46]. In this paper, we use traffic flow to proxy for infection risk from increased social contacts as the mobility patterns are strongly correlated with decreased COVID-19 case growth rates [47], and we prioritize vaccination accessibility for regions that have greater transportation activity.
1.2 Contributions
We make several contributions in this study. We formulate an optimization model to select vaccination sites that consider commuting patterns and public health outcomes. While substantial prior literature studies similar facility location problems, we are not aware of any prior work that has considered commuting patterns in such an optimization model. Also, we devise a tractable expression for incorporating health outcomes into the optimization objective that takes into account vaccination targets, prioritization over areas with a higher risk of becoming infectious, and equitable distribution. Specifically, we propose a way to compute vaccination uptake targets (to reach herd immunity) for different geographical areas. Then we evaluate several different vaccine prioritization strategies and identify the one that is most able to reduce infections. We additionally incorporate preferences around the equitable distribution of vaccinations into the objective function to ensure smoothness in vaccination uptake across different regions. Moreover, we implement the optimization model with empirical COVID-19 and traffic data in LAC, the most populous county in the U.S. and an epicenter in the COVID-19 pandemic, and we compare outcomes using the optimal mega-site locations with those used in LAC 2020. We demonstrate that with a proper setup, both travel inconvenience and public health outcomes can be improved from the empirically used solution. This work provides insights to policy-makers when setting up large vaccine sites for controlling transmissible diseases at the initial phase of vaccination in the future.
2 Model Formulation
In this section, we present an optimization formulation for optimizing the location of mega-sites and allocating vaccines to the public. We assume a disease outbreak setting and vaccine is newly introduced with limited supply. In the optimization problem, we focus on two questions: (1) where should the public health department set up mega-sites for large vaccine dispensing; and (2) how to assign individuals for vaccination. We assume that the mega-site locations will not change during the analysis period. We assume each mega-site has a maximum number of vaccines to allocate in each time epoch. We assume each region can have at most one mega-site. Regions can be defined in a variety of ways, and one convenient way may be using pre-existing definitions by health decision-makers; for instance, in LAC, ‘Health Districts’ are used to delineate health resources by geography [48]. We will therefore use the term Health District (HD) to represent regions within an area.
Before we present the formulation, we list the decision variables and parameters that are used in the model.
-
•
Sets:
-
–
: a set of HDs.
-
–
: a set of decision periods.
-
–
-
•
Parameters:
-
–
: Total number of mega-sites that can be opened.
-
–
: the travel inconvenience (minutes) from HD to HD .
-
–
: the additional travel inconvenience (minutes) for people who live in HD , go to work in HD , and get vaccinated at HD .
-
–
: total population at HD .
-
–
: number of people who live in HD and go to work in at HD .
-
–
: number of vaccines available at the mega-site for decision period .
-
–
-
•
Decision variables:
-
–
: open a mega-site in HD .
-
–
: Number of non-commuters who live in HD that are assigned to get vaccinated at HD during the decision period .
-
–
: Number of commuters who live in HD , go to work in HD that are assigned to get vaccinated at HD during the decision period .
-
–
2.1 Minimization of Travel Inconvenience Considering Commuting Patterns
A model that does not account for commuting patterns may be imprecise in estimating the travel inconvenience. Therefore, in this section, we consider two categories of individuals in our population for vaccine assignments: commuters and non-commuters. This allows a more precise estimation of cost quantification. We compute travel inconvenience for commuters based on distances from vaccine sites to both their residence and their workplaces. For instance, if an individual resides in HD and commutes to their workplace in HD , a vaccination site situated near either HD or HD should be regarded as convenient for that person.
The additional travel inconvenience for non-commuters is for people who live in HD and get vaccinated at HD . For commuters, four different possible cases can be considered. An individual who lives in HD , goes to work in HD , and gets vaccinated at HD can choose to get vaccinated either before or after work, during work hours, en route to work, or while returning from work. We assume they will always choose the option that minimizes their total travel inconvenience. We use to denote the additional travel inconvenience (minutes) for people who live in HD , go to work in HD , and get vaccinated at HD . Therefore, the additional travel inconvenience for this individual is defined as , which is known for each commuter.
We consider a traditional mixed integer linear programming (MILP) problem that minimizes additional travel inconvenience:
| (1a) | ||||
| (1b) | ||||
| (1c) | ||||
| (1d) | ||||
| (1e) | ||||
| (1f) | ||||
| (1g) | ||||
| (1h) | ||||
| (1i) | ||||
The objective in P1 is minimizing the total travel inconvenience from home/workplaces to vaccine sites. Constraint 1a limits the number of mega-sites that can be built. Constraints 1b and 1c ensure that all individuals are vaccinated eventually. In this paper, we assume that all people eventually get vaccinated in one of the mega-sites during one of the decision periods . Constraints 1d and 1e ensure that individuals can only get vaccinated in an HD where a mega-site exists. Constraint 1f restricts the number of vaccines that can be administrated by the mega-site at the HD during the decision period . Constraints 1d and 1e are formulated using big-M notation. We implement this model in Gurobi 9.5.2 using Python 3.9 and describe the outcomes in Section 3.
We consider the traditional transportation model that does not include commuting patterns (treat all individuals as non-commuters, i.e., ) as model P0. We compare P1 with P0 in the numerical section.
2.2 Modeling Disease Dynamics
The MILP formulation in P1 only minimizes the total travel inconvenience. However, we are also interested in reducing poor health outcomes due to infectious disease in this population. In the next section, we therefore integrate the public health objective into the optimization model.
2.2.1 Compartmental Model
Vaccines can prevent downstream transmission of disease, so it is important to track disease dynamics over time in order to understand the impact of mega-site location choices and allocation strategies. Compartmental models are commonly used for modeling complex disease dynamics of infectious disease on a population level [29, 30, 31, 32, 33, 34]. In this paper, we formulate a compartmental model that tracks the disease dynamics in different HDs that helps us integrate public health objectives into the optimization model. Due to the complexity of disease dynamics, compartmental models are hard to formulate and often intractable except through simulation. We therefore use a simple susceptible-infectious-recovered (SIR) model with vaccinations which simplifies the disease dynamics to create a tractable objective term, we then use a more detailed compartmental model for evaluating the performance of our model. SIR models have been used extensively in many disease contexts and track health states, transmission, and recovery over time [49, 50, 51]. Our model is additionally stratified by HD to track the number of individuals within each HD in each health state.
In the model, we use to represent the proportion of individuals in each health state (susceptible (), infectious (), and recovered ()) in HD . We capture the transmission rate between HDs using , which denotes the transmission rate from HD to HD . We assume is the geographically invariant clearance rate. Our compartmental model is then:
2.2.2 Herd Immunity Threshold Analysis
Much of the benefits of a population vaccination campaign can be garnered before all individuals have been vaccinated. In epidemiology, the herd immunity threshold is the idea that less than 100% of the population need be immune to the disease to prevent an epidemic [52]. We will use this concept to formulate our vaccine threshold targets.
Many works have studied computation methods for identifying herd immunity thresholds [53, 54, 52] within a population. To compute the herd immunity threshold in this paper, we use a similar approach as [52]. We find the herd immunity threshold such that the spread of disease will start to decrease ().
Then we can write the condition for decreasing prevalence as:
This is achieved when
The herd immunity threshold is the lowest herd immunity level required for the epidemic to decrease. Although herd immunity can be achieved through a rise in the number of recovered or via vaccinations [52], in our paper, we presume that herd immunity is primarily attained through vaccination, given that the number of infected and recovered individuals are relatively small compared to the entire population, particularly as we are interested in the initial stages of a pandemic. Let us define to be the herd immunity level that leads the epidemic to decrease. Then can be approximated by at time for region .
We then make a strong simplifying assumption that the ratio of prevalences between HDs is a time-invariant constant, specifically, .
Then the previous equation can be rewritten as
We therefore set the vaccination target for each HD as the herd immunity threshold . We incorporate these vaccination targets into our optimization objective. We wish to minimize the difference between vaccination levels and targets across all time: . We add this term to the optimization problem to make it a multi-objective formulation.
This objective considers equal weights for each HD in the allocation process. However, we may want to prioritize HDs with residents at higher risk of becoming infected; in this work, we will consider transmission risk proxied by greater transportation movement around the city. In general, weighting each HD by a risk score could capture a wide variety of definitions of risk (due to demographic characteristics, e.g., age, or differences in access to treatment, etc.). We term these weights ‘prioritization scores’ as they allow the optimization model to prioritize specific regions and allocate vaccinations to these areas preferentially. Such prioritization scores for areas with different risks have been used in prior literature to help capture heterogeneity in disease control [39, 55].
We use to define the prioritization score for HD at time period . We let our prioritization score be the flow-out in HD divided by the total flow across all HDs. In Section 3, we examine the performance of our prioritization score and compare it against other common scores in the literature.
2.2.3 Equitable Distribution of Vaccines
We also need to consider vaccination distribution equity. Access to healthcare resources without distinction between individuals is a fundamental tenet of promoting human rights [56, 57]. Thus, in our optimization model, we aim to reduce the disparity in the number of individuals vaccinated across various HDs during the initial vaccination phase () when supply is mostly available through mega-sites and not available in local clinics. As the proportion of vaccinated individuals grows and the urgency of vaccination wanes due to protective effects from herd immunity, equity may be a less pressing concern. Of course, can be set equal to if equity objectives should be considered throughout the time horizon.
2.3 An Multi-Objective Model
Realizing the need to prioritize high risk groups of becoming ill, promote equitable distribution of vaccines, as well as improve accessibility to vaccination, we formulate another model that incorporates these objectives. Let and present the objective value on public health outcome at time for HD and equitable distribution at time respectively, we have a MILP formulation as follows:
| (2a) | ||||
| (2b) | ||||
| (2c) | ||||
| (2d) | ||||
| (2e) | ||||
| (2f) | ||||
| (2g) | ||||
| (2h) | ||||
| (2i) | ||||
| (2j) | ||||
| (2k) | ||||
Unlike P1 in Section 2.1, this new MILP model (P2) includes a public health objective as well as an equitable distribution objective. In the objective, is the remaining unvaccinated population at HD at time relative to the vaccination threshold target . denotes the prioritization score for HD at time . is the maximal difference in the number of vaccines distributed to two HDs at period in the early stages of vaccination . balances the importance of equitable distribution and prioritization over groups with higher risks of becoming infectious. balances the importance of travel inconvenience and public health outcomes. Constraints 2g and 2h compute the value of from the vaccine allocation strategy.
3 Numerical Example
Using the disease modeling framework and the optimization model presented in Section 2, we outline the model’s parameterization, evaluate the model’s performance by the number of infections averted, travel inconvenience, and equitable distribution of vaccines among the 26 HDs within LAC, and compare results to those using the empirically chosen locations in 2021.
3.1 Model Inputs
We use traffic data from Performance Measurement System (PeMS) Data Source [11], Open Route API [58], and population data [59, 60] to parameterize the optimization model. We assume six mega-sites can be built at maximum. We assume each can provide a capacity of 400,000 monthly vaccinations. The optimization model solves monthly decisions across a six months time horizon. In the rest of Section 3.1, we provide a comprehensive explanation of model inputs.
3.1.1 Commuters and Non-commuters
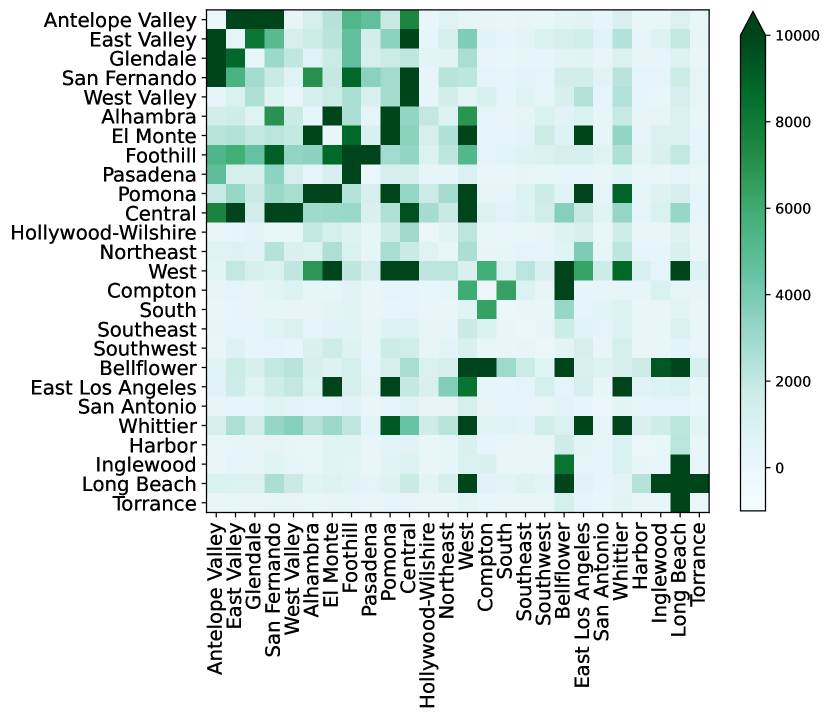
We use traffic volume data from the Performance Measurement System (PeMS) database to compute the number of daily commuters from one HD to another. PeMS contains the number of vehicles passing over a sensor in 5 minutes intervals and the average speed of these vehicles. We approximate the number of vehicles traveling from one region to another region by extending a previously published dynamic origin-destination estimation (DODE) model [61, 62]. We depict a heatmap of the estimated traffic flow volume by number of vehicles on a daily basis in Figure 1. There are a total of 2,876,523 vehicles represented in Figure 1. In the year 2020, there were an estimated 4,396,232 commuters across the LAC [60]. Therefore, we scale up this matrix by multiplying all entries by 1.53 (the subsequent average number of people in each vehicle) to obtain a matrix of the number of commuters in LAC. The number of commuters in each HD can then be computed by summing the corresponding row of the commuter matrix. Then the number of non-commuters can be obtained by taking the difference from the total population in each HD [59].
3.1.2 Parameterization of Travel Cost Matrix
For an individual who lives in or works in a certain HD, we use the geographic centroid of that HD to represent the home or work address. Similarly, we use the geographic centroid of each HD to approximate the potential location of the mega-site in an HD. To parameterize the cost of travel from one HD to another HD , we use Open Route API [58] to compute the time (in minutes) needed to traveling from to () under traffic-free conditions. We use these values to parameterize the travel cost matrices () for commuters and non-commuters as described in Section 2.1.
3.1.3 Herd Immunity Threshold
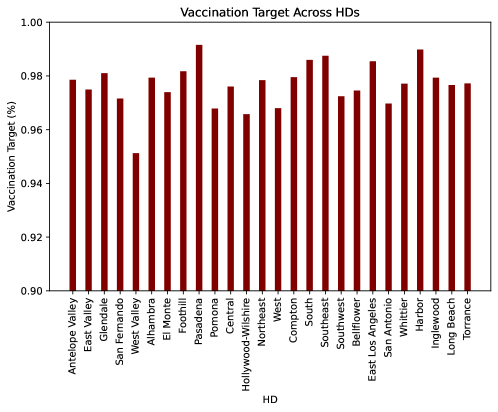
We find the vaccination target for each HD to ensure herd immunity using in Section 2.2.2. High vaccination targets are observed for all HDs due to the relatively high transmission rate compared to the recovery rate. Among all HDs, West Valley has the lowest vaccination target (95.13%), and Pasadena has the highest vaccination target (99.15%). On average, 97.36% of the total population needs to be vaccinated to achieve herd immunity. Detailed herd immunity thresholds across HDs are shown in Appendix C.
3.1.4 Prioritization Score
In formulation P2, we weight the herd immunity level needed in each HD by a prioritization score () to preferentially target more vulnerable HDs first. We prioritize vaccination accessibility for regions that have greater traffic flow. Specifically, we let the score be the number of daily commuters in each HD divided by the total number of commuters in LAC.
3.2 Evaluating Public Health Outcomes
We have incorporated public health outcomes in the optimization problem objective using a simplified model of disease dynamics, so we should evaluate the efficiency of our vaccine allocation strategy in a more realistic way. We therefore use a more detailed compartmental model that more closely captures the empirically observed disease trends in LAC. We formulate a compartmental model that includes the following health and treatment states as shown in Figure 2: susceptible (S), vaccinated (V), exposed (E), identified infectious (I), unidentified infectious (U), hospitalized (H), recovered (R), and dead (D). Each of these states is stratified by HDs to track variation in disease outcomes by region.
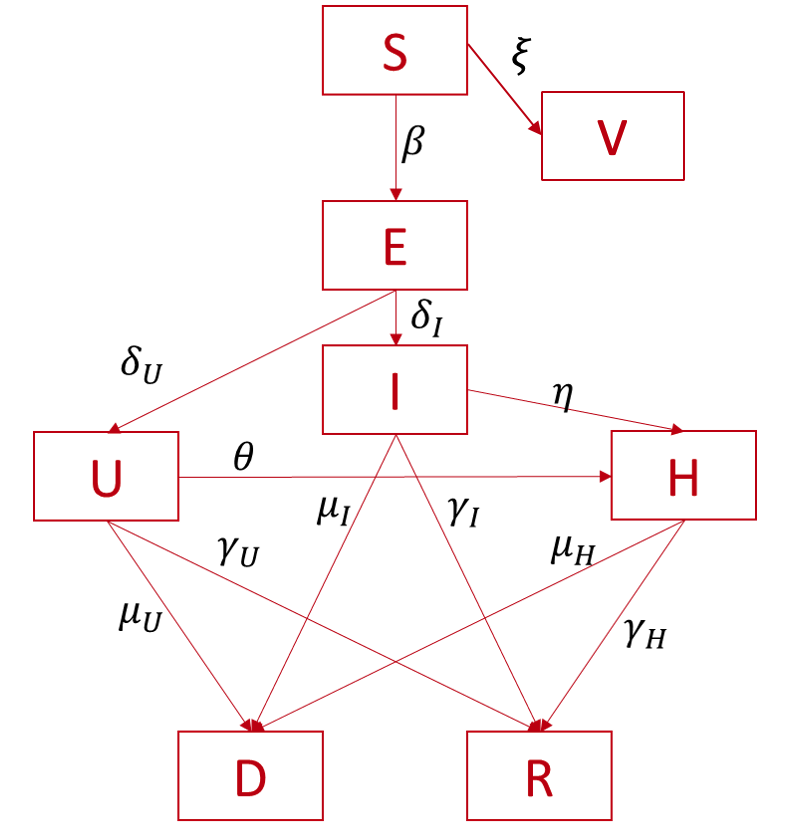
We assume full immunity will be achieved after the first dose of vaccination. We assume that only transmission rates () and vaccination rates () vary geographically by HD. This compartmental model can also be represented as a system of ordinary differential equations, which is shown in Appendix A.
We use publicly available COVID-19 cumulative cases (), cases (), cumulative deaths (), and hospitalizations ()[63] to calibrate the compartmental model. We hereafter use ‘ ’ to represent simulated outcomes from the compartmental model to clearly differentiate them from empirical surveillance report values. The calibration objective is to minimize the error in the simulated cumulative cases (), cases (), cumulative deaths (), and hospitalizations (). We consider the simulation to start on March 1st, 2020 with a 300-day calibration period. Within the calibration interval, we define five calibration intervals in which calibration parameters are allowed to change between intervals. These five intervals are Lock-down (45 days), social events (45 days), re-opening (45 days), second wave (75 days), and holiday season (90 days).
We first calibrated the model without vaccinations. We choose the calibrated parameters: . These parameters are calibrated using ordinary least squares (OLS) on the following objective:
| Compartmental Model System Dynamics in Appendix Section A |
In the OLS, four calibration targets are minimized: cumulative death, cumulative identified infections, identified infections over time, and hospitalizations, where all calibration targets are at HD level. are weights for different calibration objectives. The weight for each HD is determined by comparing its total population to the total population in LAC. are the number of hospitalizations, deaths, recovered, and identified infections from the compartmental model for HD at time . and (cumulative identified cases for HD at time ), are the actual number of deaths, cumulative identified infections, identified infections, and hospitalizations for HD at time , which can be computed from the publicly available data [63].
We calibrate the model sequentially on each of the calibration intervals listed above. The calibrated parameter set from the previous interval is used as the initialization parameter set for the next calibration interval. The calibration results are shown in Appendix B.
We use this calibrated compartmental model to compute the number of infections averted under different mega-site placement and vaccine allocation scenarios. To do this, we first compute the number of cumulative infections between March and December 2020 with no vaccinations (). Then we compute the number of cumulative infections by the end of the year 2020 from the compartmental model with a given vaccination strategy (), assuming that the vaccination starts 6 months prior to the end of the year 2020). To evaluate the vaccination program ’s efficiency in reducing the disease burden, we then calculate the number of infections averted by . By running the simulation, the number of cumulative identified infections () is 625,737. We then use this number to compute the number of infections averted.
3.3 Model Results
Traditional facility location models [19, 21, 22, 20] generally do not capture commuting patterns in mega-sites selection. We therefore first evaluate outcomes using formulation P0, which uses the traditional objective of only considering travel inconvenience assuming all individuals are non-commuters. Next, we solve our model integrating commuting patterns in estimating travel inconvenience (P1). We then solve a model with both travel inconvenience and public health outcome objectives (P2) to understand how health and equity objectives change our solution. We assume the importance weight on the public health objective () is 10, the weight on the smoothness objective () is 150, and the prioritization score () is . These parameters will be varied in sensitivity analyses. We assume the capacity for each mega-site is uniformly 400,000 vaccinations per decision period, and each decision period spans a month, with a total of six such periods.
3.3.1 Effects of Integrating Commuting Patterns
In this section, we study how integrating commuting patterns changes the solution of mega-sites and vaccine allocation, and how these changes impact travel inconvenience and public health outcomes.
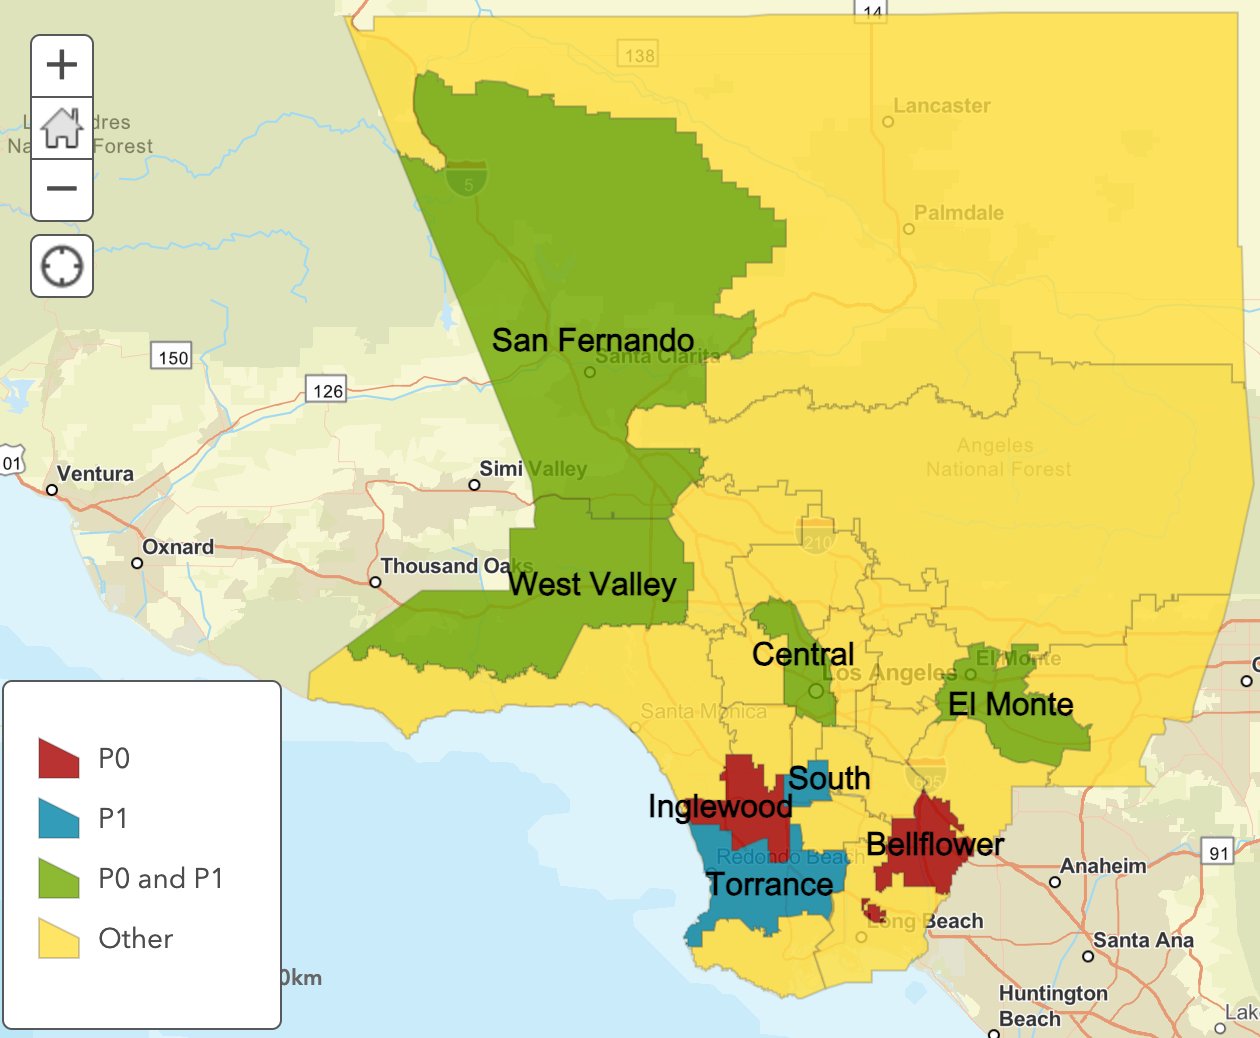
In the traditional model that minimizes the travel inconvenience only from homes (P0), San Fernando, West Valley, Central, El Monte, Inglewood, and Bellflower (shown in Figure 3) are selected as locations of mega-sites. The model incorporating commuting patterns (P1) selects four of the same locations as P0 (see Figure 3). The two differences in location (Torrance and South) result in locations that are generally closer to major freeways in LAC (both Torrance and South are closer to I110 and I405 than Bellflower). P1 locations should therefore be more convenient for commuters, evidenced by the substantially reduced total travel inconvenience (nearly 30% reduction from 276,949,555 minutes to 196,572,213 minutes).
To evaluate and compare public health outcomes between P0 and P1, we find the number of monthly vaccinations in each HD from the optimization model. We use this value to calculate the HD-specific vaccination rate in the compartmental model, as described in Section 2.2.1. Finally, we ran the compartmental to identify the infections averted at the end of 2020 using these vaccination rates (compared to the counterfactual where no vaccination was offered). In the P0 model, 374,538 infections were averted by the end of the year 2020 while the P1 model averted 390,252 infections (4% more than in the P0 model). This indicates that incorporating commuting patterns can also improve disease control even if public health outcomes are not in the objective formulation.
The inequity objective measures the sum of the maximal difference between HDs with the largest and the smallest vaccinated population during . In this study, we choose to be the first two months of vaccination due to the high volume of vaccinations observed during the first two months in LAC [64].
Without incorporating inequity into the objective function, we observe large differences in vaccinations across HDs in the first two months. For instance, in the P0 solution, 400,000 individuals living in San Fernando are vaccinated while none of the individuals living in Antelope Valley are vaccinated in the first month. Similarly in the second month, there are 400,000 vaccinated in San Fernando while Pasadena has no vaccinations for a total of 800,000 in the inequity score. P1 has a similar inequity score of 769,721 (4% less than in the P0 model). To further understand how to improve travel inconvenience, public health outcomes, and equity, a model needs to incorporate all of these objectives.
3.3.2 Multi-Objective Model Results
In this section, we present results of the optimization formulation (P2) that integrates objectives in P1 plus public health and equity objectives. We then compare these results with the previously discussed models.
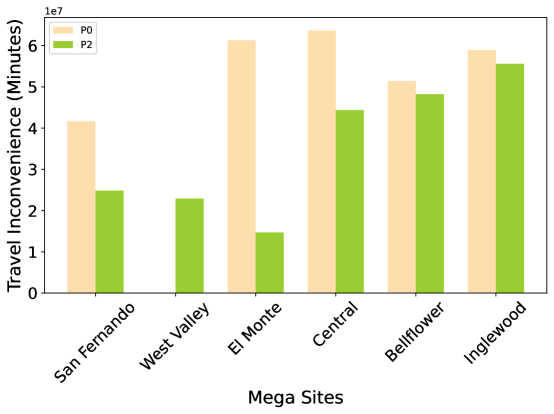
P2 has the same recommendation as P0 on the locations of mega-sites, but the vaccine assignments between the two models are distinct. As shown in Figure 4, the total travel inconvenience in minutes is smaller in P2 for all mega-sites except for those receiving vaccination in West Valley. El Monte experiences the most significant decrease, with a reduction of roughly 70 million minutes. In contrast, West Valley faces an increase in travel inconvenience. This is because P0 only assigns individuals who live in West Valley to the mega-site in West Valley, which results in zero total travel inconvenience for individuals vaccinated there. On the other hand, P1 assigns individuals who do not live or work near West Valley to West Valley as their more convenient locations are already at capacity, which results in higher total travel time. This increase is offset by decreases in travel inconvenience in other mega-sites.
| Model | Travel inconvenience (mins.) | Infections averted | Inequity objective |
|---|---|---|---|
| P0 | 276,949,555 | 374,538 | 800,000 |
| P1 | 196,572,213 | 390,252 | 769,721 |
| P2 | 210,689,712 | 405,522 | 464,405 |
| \botrule |
Table 1 shows that formulation P2 is able to achieve improvements in infections averted and lower inequity while still achieving less travel inconvenience than formulation P0 and only a 7% increase from formulation P1. The P2 locations are able to prevent approximately 15,000 more infections than P1 by the end of year 2020 and achieve a 40% reduction in inequality compared to the P1 solution.
3.3.3 Benchmark Solution: Empirical Locations in LAC
To benchmark our model against a more realistic setup, we compare model outcomes to those if we fixed the mega-site locations to those actually used in LAC from January to May of 2021. More specifically, we solve the optimization problem P2 while fixing the variables to be these empirical mega-sites locations.
In the empirical location model, the mega-sites locations are San Fernando, Central, Northeast, Southeast, Inglewood, and San Antonio. Except for one mega-site in San Fernando, all other mega-sites are located around the Central district. Compared with the empirical mega-sites locations, P2 recommends a more dispersed distribution of mega-sites, with two mega-sites in the northwest, two around the Central district, and two in the east.
The empirical model incurs a total travel inconvenience of 289,945,903 minutes. Compared with the travel inconvenience from the P2 model, the empirical model costs 79,256,191 more minutes in total, or a 38% increase in total travel time. 86.37% of individuals are able to be vaccinated at their most convenient mega-sites. This represents a 2.3% decrease from the P2 solution– approximately 200,000 fewer individuals can now go to the most convenient mega-sites.
In the empirical model, 404,857 infections were averted by the end of the year 2020, approximately 700 less than the P2. However, it has an inequity objective value of 423,343, which is less than that in P2. This indicates there is a trade-off between infections averted and equitable distribution.
Comparing both the results from the public health perspective and transportation perspective, our P2 formulation improves upon the single objective model P1 as well as the model with empirical locations, indicating that both accessibility and public health outcomes can be improved from the empirical setup.
3.4 Sensitivity Analyses
Recall the public health objective in our optimization model is minimizing , which considers prioritization in vaccination allocation () and equity in distribution for the early phase . In this section, we vary the importance weight on equitable distribution and importance weight on public health objectives to understand how the allocation changes with respect to changes in objectives. We made several assumptions when designing our health objective term, so we test whether our health objective is reasonable by assessing its correlation with with the number of infections averted.
3.4.1 Testing Model Assumptions: Evaluating the Health Objective Term for Concordance with Cases Averted
Our public health objective consists of vaccination targets (from a simplified SIR model) and the prioritization score (from commuting patterns in LAC). This objective serves as a proxy for true health goals such as infections averted. We evaluate the validity of this approximation in the LAC COVID-19 context in this section. We do so by varying the importance of the health objective term () and testing if the number of infections reduced is positively correlated to . A good health objective would avert more infections with increasing emphasis on the health objective. This can also serve as a sensitivity analysis on (relative importance of health objective versus travel inconvenience and inequity score).
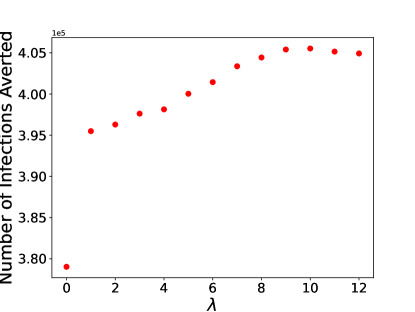
Our health objective term is a reasonable proxy for cases averted when . Figure 5 shows infections averted when varying . When , the number of infections averted increases with . This suggests that the public health objective we have adopted serves as an effective proxy for the real-world goal of reducing infections. However, when surpasses 10, the number of infections averted plateaus and even slightly drops, implying that beyond a certain point of weight on the public health objective, the public health objective does not approximate the reduction in infections well. In those cases, when is exceedingly high, the optimization model prioritized the vaccines only for areas with high risks of becoming infectious while other areas with no vaccine access remain vulnerable, thus not reducing infections effectively.
As expected, when increases, the travel inconvenience contributes less to the overall objective and the optimal solutions have a larger travel inconvenience. The total travel inconvenience increases by about 7% when increases from 0 to 10. Compared with the case when only travel inconvenience is considered in the objective (i.e., ), the locations of mega-sites in southern LAC are more dispersed along the east-west axis. In general, however, the selection of mega-sites locations shows limited variation with .
When is small, a low inequity score can be achieved. However, the inequity score grows dramatically when surpasses five. This shows that there exist trade-offs among transportation inconvenience, averted infections, and equity in distribution. We discovered that setting to 10 yields satisfactory outcomes for all objectives, which validates our choice of for the P2 model.
3.4.2 Changes in Importance Weight on Equitable Distribution
We use the hyperparameter (importance on equitable distribution) to balance between prioritization and equitable distribution. To understand how the importance of equitable distribution influences the solution, we varied from 0 to 1000 while other hyperparameters remained the same.
Locations of mega-sites do not change when varying in the P2 model. However, the inequity score drops from 1,115,427 to 0 as increased from 0 to 1000. By more strongly weighting equitable distribution, the optimization model is configured to assign individuals for vaccination more uniformly across regions within each period.

The number of infections averted is 402,361 when is 0, and 369,733 when is 1000, but is higher when is 150 (405,522 infections averted). When not considering equitable distribution at all (i.e., ), the optimization model prioritized vaccines only to areas at high risk of infection (higher transportation activities) while low-risk areas became more vulnerable due to limited access to the vaccination. The inequity objective value is 1,115,427 in this case, meaning that the sum of the maximal difference between HDs with the largest and the smallest vaccinated population during the first two months is over 1 million. This indicates a significant inequity in vaccine allocation across HDs. Therefore ignoring equity in the objective not only results in unequal distribution but also reduces the number of averted infections. When the importance of equitable distribution overrides the prioritization for areas at a higher risk of becoming infected (i.e., ), the optimization assigns individuals more uniformly for vaccination (thus leads to less than 65,000 inequity objective value), which leads to an ineffective way of distributing limited resources. Combining the results from transportation, public health, and equity perspectives, we choose to balance transportation, prioritization, and equitable distribution across HDs.
3.5 The Influence of Travel Inconvenience on Vaccine Acceptance
Prior work indicates that barriers to access vaccination sites, reflected in higher travel inconvenience, may deter individuals from becoming vaccinated [8, 9]. We may therefore be undervaluing the true benefit of reducing travel inconvenience in our models. To remedy this, in this section, we incorporated a likelihood function that computes an individual’s probability of choosing to get vaccinated based on their travel inconvenience. We re-evaluate the number of infections averted using the compartmental model after accounting for this additional increase in seeking vaccination.
We adopt the method from [65, 66] for computing the likelihood that an individual chooses to become vaccinated as a function of distance traveled. Let denote the minimum travel inconvenience for an individual who lives in , works in , and assigned to get vaccinated at . We first compute the total difference in the travel inconvenience between becoming vaccinated at and at another alternative mega-site :
where the score is normalized by the difference between the largest and smallest travel inconvenience for this individual to get vaccinated across available mega-site locations. Then, we compute the likelihood of an individual choosing to become vaccinated using a logit function:
where denotes the probability of an individual who lives in , works in , and chooses to become vaccinated in . We scale the HD-specific vaccination rates in the compartmental model accordingly to evaluate the number of cases averted.
Given that the decrease in travel inconvenience leads to more people choosing to get vaccinated, 3,226 cases would be averted due to greater access to vaccination using model P2, which now averts 395,507 infections. This is greater than the unadjusted benefit (an additional 665 averted cases when comparing the unadjusted P2 with the unadjusted empirical solution). Because the empirical solution substantially increases travel inconvenience compared to the P2 solution, fewer individuals tend to come to mega-sites for vaccination and thus leads to a worse public health outcome.
In adjusted P2, the public health outcome in our models outperforms the empirical model. This solidifies the decision to employ a multi-objective formulation that accounts for travel inconvenience, prioritization, and equitable distribution when optimizing mega-sites and allocations.
4 Conclusion
We present an optimization formulation for selecting locations of vaccine sites during the early stage of the vaccination. In the optimization model, we integrate multiple objectives including travel inconvenience, prioritization, and equitable distribution.
In formulating the transportation objective, we consider commuter patterns within LAC. We use the estimated origin-destination pair to infer the number of commuters and non-commuters in each HD. We compute the travel inconvenience for the vaccination for each origin-destination pair, considering the accessibility of vaccination sites from both residential and workplace perspectives.
When modeling the public health objective, we establish a straightforward linear goal to pinpoint and prioritize high infection risk zones. This approach guarantees that the optimization model remains solvable and manageable. We also factor in the fair allocation of vaccines across HDs during the initial phases, resulting in a vaccination strategy that upholds equity.
Our numeric case study on COVID-19 vaccination in LAC demonstrates that our model significantly eases travel burden and enhances public health outcomes compared to the empirical approach. It cuts down the total transportation time for vaccinations by roughly 80 million minutes for LAC residents. Furthermore, we contrast the empirical solution’s simulation results on public health outcomes with those from our optimized strategy; our model shows a reduction in infections by an additional 1000 cases.
Furthermore, we conduct sensitivity analyses on the significance of equitable distribution weight, the impact of public health outcome weight, and the choices of different prioritization scores. We demonstrate how travel inconvenience and the number of infections averted changes with respect to changes in these parameters. Additionally, our results reveal that the public health objective value in our model accurately mirrors the variations in the number of infections prevented. We also factor in each individual’s propensity to come to the vaccine site for vaccination, based on their designated location and commuting behaviors. The outcomes continue to indicate that our model surpasses the empirical solution in the effectiveness of reducing infections.
The policy implications for our work are (1) locations of mega-sites for dispensing a large number of vaccinations are recommended to be placed widely across the region for reducing the overall travel inconvenience, and (2) merely minimizing travel inconvenience in determining vaccine site locations and vaccine distribution falls short – it’s also essential to identify and prioritize high infection risk areas to more effectively control disease transmission (3) balancing travel inconvenience, the number of infections prevented, and equity is challenging. However, with an appropriate setup in the optimization model, it’s possible to achieve satisfactory outcomes in all these aspects.
We must acknowledge several limitations of this work. We assume the capacities of different vaccination sites are uniform. In reality, different places might have different capacities based on their size and number of nurses. We only consider individuals’ residence/work HD in vaccine assignment. However, additional factors like age and work industry could also be taken into consideration. Our model assumes that all individuals receive their vaccinations at mega-sites. In practical terms, these mega-sites are operational primarily in the initial stages and are eventually phased out as vaccinations become available at local clinics. Nonetheless, this is unlikely to significantly affect our findings since historically, the majority of vaccinations occur at mega-sites, and minor variations in the number of people getting vaccinated through the optimization model do not substantially alter the solution.
Despite these limitations, we believe that this work provides interesting insights into not only the locations of vaccine sites but also the allocation of vaccines. Our paper provides a tractably solvable optimization formulation and a numerical example to show how to reduce the travel burden and prevent more infections from the empirical approach. These results provide insight into future work on improving vaccination strategies to manage the disease burden in scenarios where an outbreak is ongoing and a new vaccine has just been introduced.
Appendix A Compartmental model dynamics
Appendix B COVID-19 Model Calibration Results
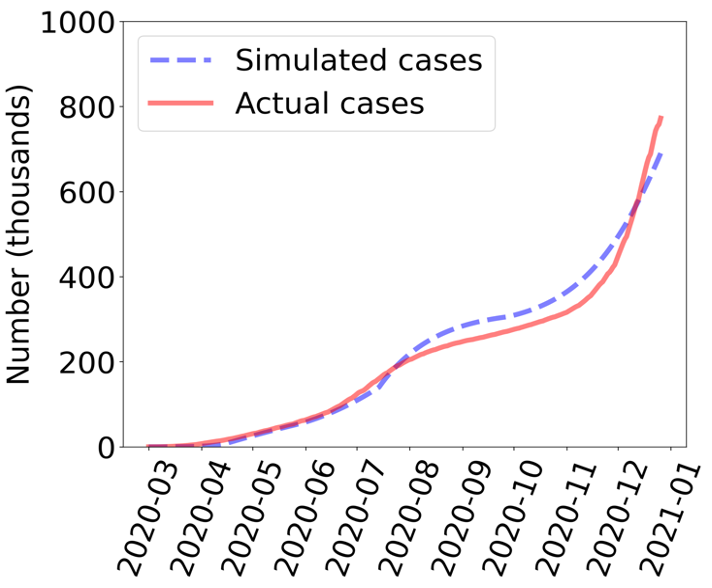
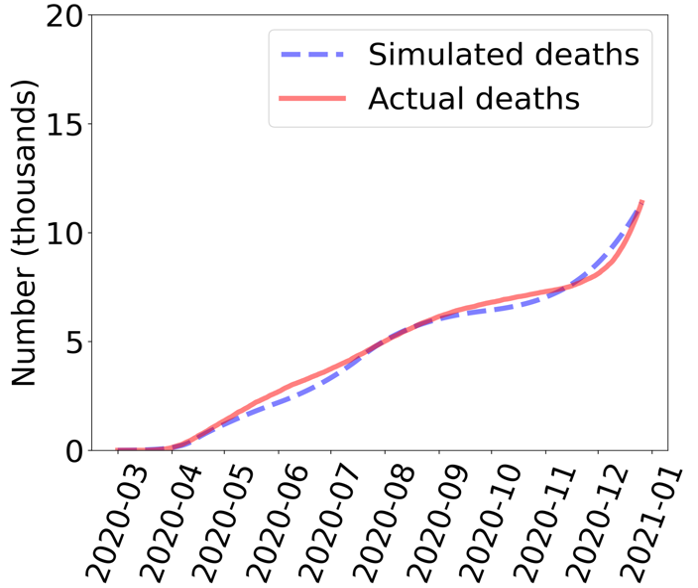
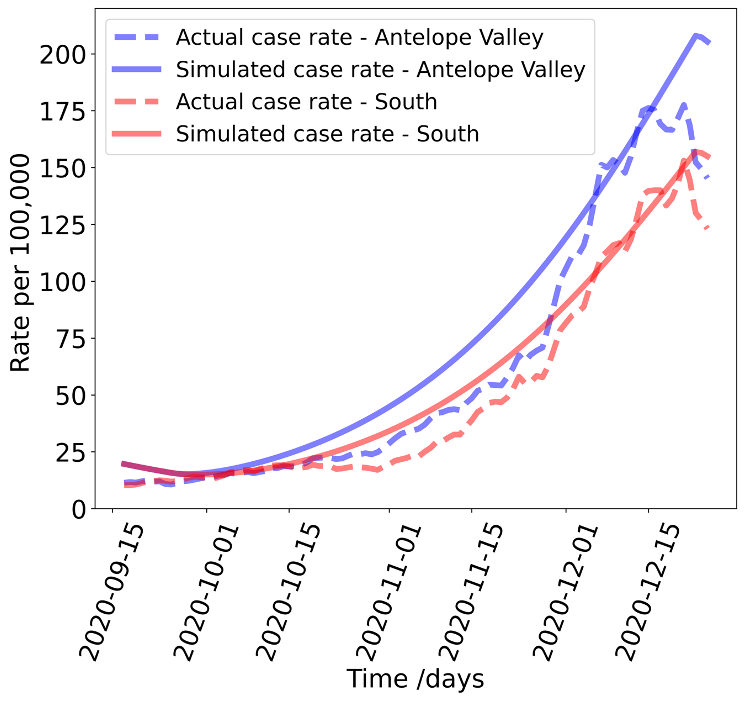
Figure 7 shows the calibration result of cumulative identified infections on the aggregate level. Figure 8 shows the calibration result of cumulative deaths on the aggregate level. Figure 9 shows the calibration result of the case rate on the HD level. All calibration results demonstrate that the calibrated compartmental model is able to capture the disease dynamics in both aggregate and HD levels.
Appendix C Herd Immunity Threshold by HD
References
- \bibcommenthead
- Richards et al. [2022] Richards, F., Kodjamanova, P., Chen, X., Li, N., Atanasov, P., Bennetts, L., Patterson, B.J., Yektashenas, B., Mesa-Frias, M., Tronczynski, K., et al.: Economic burden of COVID-19: a systematic review. ClinicoEconomics and Outcomes Research, 293–307 (2022)
- Alagoz et al. [2021] Alagoz, O., Sethi, A.K., Patterson, B.W., Churpek, M., Alhanaee, G., Scaria, E., Safdar, N.: The impact of vaccination to control COVID-19 burden in the United States: A simulation modeling approach. PloS One 16(7), 0254456 (2021)
- Huang and Kuan [2022] Huang, Y.-Z., Kuan, C.-C.: Vaccination to reduce severe COVID-19 and mortality in COVID-19 patients: a systematic review and meta-analysis. European Review for Medical & Pharmacological Sciences 26(5) (2022)
- Wolak [2022] Wolak, F.: COVID-19 Vaccination Mega Sites. Availible at https://www.filipwolak.com/aerial-photography/covid-vaccination-mega-sites/ (accessed October 30, 2023) (2022)
- California Department of Public Health [2024] California Department of Public Health: California’s Vaccine Appointment Site. Availible at https://myturn.ca.gov/ (accessed January 4, 2024) (2024)
- Ostrov [2021] Ostrov, B.: Educators, food workers join California’s priority list for vaccines. Availible at https://calmatters.org/health/coronavirus/2021/01/teachers-food-workers-california-priority-vaccines/ (accessed January 4, 2024) (2021)
- Papastergiou et al. [2014] Papastergiou, J., Folkins, C., Li, W., Zervas, J.: Community pharmacist–administered influenza immunization improves patient access to vaccination. Canadian Pharmacists Journal/Revue des Pharmaciens du Canada 147(6), 359–365 (2014)
- Lacombe-Duncan et al. [2018] Lacombe-Duncan, A., Newman, P.A., Baiden, P.: Human papillomavirus vaccine acceptability and decision-making among adolescent boys and parents: A meta-ethnography of qualitative studies. Vaccine 36(19), 2545–2558 (2018)
- Schmitzberger et al. [2022] Schmitzberger, F.F., Scott, K.W., Nham, W., Mathews, K., Schulson, L., Fouche, S., Berri, N., Shehab, A., Gupta, A., Salhi, R.A., et al.: Identifying strategies to boost COVID-19 vaccine acceptance in the United States. RAND Health Quarterly 9(3) (2022)
- KCAL News [2017] KCAL News: Survey: LA Ranks #1 Most Stressful Commute in US. Availible at https://www.cbsnews.com/losangeles/news/survey-la-ranks-1-most-stressful-commute-in-us/#:~:text=L.A.%20ranks%20eighth%20in%20terms,national%20average%20of%2049.1%20minutes. (2017)
- Caltrans [2023] Caltrans: PeMS Data Source Performance Measurement System (PeMS) Data Source. Availible at https://dot.ca.gov/programs/traffic-operations/mpr/pems-source (accessed October 30, 2023) (2023)
- Haas et al. [2022] Haas, E.J., McLaughlin, J.M., Khan, F., Angulo, F.J., Anis, E., Lipsitch, M., Singer, S.R., Mircus, G., Brooks, N., Smaja, M., et al.: Infections, hospitalisations, and deaths averted via a nationwide vaccination campaign using the Pfizer–BioNTech BNT162b2 mRNA COVID-19 vaccine in Israel: a retrospective surveillance study. The Lancet Infectious Diseases 22(3), 357–366 (2022)
- Araz et al. [2012] Araz, O.M., Galvani, A., Meyers, L.A.: Geographic prioritization of distributing pandemic influenza vaccines. Health Care Management Science 15, 175–187 (2012)
- Wrigley-Field et al. [2021] Wrigley-Field, E., Kiang, M.V., Riley, A.R., Barbieri, M., Chen, Y.-H., Duchowny, K.A., Matthay, E.C., Van Riper, D., Jegathesan, K., Bibbins-Domingo, K., et al.: Geographically targeted COVID-19 vaccination is more equitable and averts more deaths than age-based thresholds alone. Science Advances 7(40), 2099 (2021)
- Karmakar et al. [2021] Karmakar, M., Lantz, P.M., Tipirneni, R.: Association of social and demographic factors with COVID-19 incidence and death rates in the us. JAMA network open 4(1), 2036462–2036462 (2021)
- Hu et al. [2021] Hu, T., Wang, S., She, B., Zhang, M., Huang, X., Cui, Y., Khuri, J., Hu, Y., Fu, X., Wang, X., et al.: Human mobility data in the COVID-19 pandemic: characteristics, applications, and challenges. International Journal of Digital Earth 14(9), 1126–1147 (2021)
- Daskin and Dean [2004] Daskin, M.S., Dean, L.K.: Location of health care facilities. Operations Research and Health Care: A Handbook of Methods and Applications, 43–76 (2004)
- Ahmadi-Javid et al. [2017] Ahmadi-Javid, A., Seyedi, P., Syam, S.S.: A survey of healthcare facility location. Computers & Operations Research 79, 223–263 (2017)
- Marianov and Taborga [2001] Marianov, V., Taborga, P.: Optimal location of public health centres which provide free and paid services. Journal of the Operational Research Society 52(4), 391–400 (2001)
- Jia et al. [2007] Jia, H., Ordóñez, F., Dessouky, M.: A modeling framework for facility location of medical services for large-scale emergencies. IIE Transactions 39(1), 41–55 (2007)
- Silva and Serra [2008] Silva, F., Serra, D.: Locating emergency services with different priorities: the priority queuing covering location problem. Journal of the Operational Research Society 59(9), 1229–1238 (2008)
- Chan et al. [2016] Chan, T.C., Demirtas, D., Kwon, R.H.: Optimizing the deployment of public access defibrillators. Management Science 62(12), 3617–3635 (2016)
- Mete and Zabinsky [2010] Mete, H.O., Zabinsky, Z.B.: Stochastic optimization of medical supply location and distribution in disaster management. International Journal of Production Economics 126(1), 76–84 (2010)
- Zhang and Li [2015] Zhang, Z.-H., Li, K.: A novel probabilistic formulation for locating and sizing emergency medical service stations. Annals of Operations Research 229, 813–835 (2015)
- Beheshtifar and Alimoahmmadi [2015] Beheshtifar, S., Alimoahmmadi, A.: A multiobjective optimization approach for location-allocation of clinics. International Transactions in Operational Research 22(2), 313–328 (2015)
- Rastegar et al. [2021] Rastegar, M., Tavana, M., Meraj, A., Mina, H.: An inventory-location optimization model for equitable influenza vaccine distribution in developing countries during the COVID-19 pandemic. Vaccine 39(3), 495–504 (2021)
- Chen et al. [2022] Chen, Y., Tao, R., Downs, J.: Location optimization of COVID-19 vaccination sites: Case in Hillsborough county, Florida. International Journal of Environmental Research and Public Health 19(19), 12443 (2022)
- Valizadeh et al. [2023] Valizadeh, J., Boloukifar, S., Soltani, S., Hookerd, E.J., Fouladi, F., Rushchtc, A.A., Du, B., Shen, J.: Designing an optimization model for the vaccine supply chain during the COVID-19 pandemic. Expert Systems with Applications 214, 119009 (2023)
- Buckner et al. [2020] Buckner, J.H., Chowell, G., Springborn, M.R.: Optimal dynamic prioritization of scarce COVID-19 vaccines. Medrxiv, 2020–09 (2020)
- Choi and Shim [2020] Choi, W., Shim, E.: Optimal strategies for vaccination and social distancing in a game-theoretic epidemiologic model. Journal of Theoretical Biology 505, 110422 (2020)
- Deng et al. [2021] Deng, J., Tang, S., Shu, H.: Joint impacts of media, vaccination and treatment on an epidemic filippov model with application to COVID-19. Journal of Theoretical Biology 523, 110698 (2021)
- Mukandavire et al. [2020] Mukandavire, Z., Nyabadza, F., Malunguza, N.J., Cuadros, D.F., Shiri, T., Musuka, G.: Quantifying early COVID-19 outbreak transmission in South Africa and exploring vaccine efficacy scenarios. PloS One 15(7), 0236003 (2020)
- Foy et al. [2021] Foy, B.H., Wahl, B., Mehta, K., Shet, A., Menon, G.I., Britto, C.: Comparing COVID-19 vaccine allocation strategies in India: A mathematical modelling study. International Journal of Infectious Diseases 103, 431–438 (2021)
- Shim [2021] Shim, E.: Optimal allocation of the limited COVID-19 vaccine supply in South Korea. Journal of Clinical Medicine 10(4), 591 (2021)
- Becker and Starczak [1997] Becker, N.G., Starczak, D.N.: Optimal vaccination strategies for a community of households. Mathematical Biosciences 139(2), 117–132 (1997)
- Aaby et al. [2006] Aaby, K., Herrmann, J.W., Jordan, C.S., Treadwell, M., Wood, K.: Montgomery county’s public health service uses operations research to plan emergency mass dispensing and vaccination clinics. Interfaces 36(6), 569–579 (2006)
- Bertsimas et al. [2020] Bertsimas, D., Ivanhoe, J., Jacquillat, A., Li, M., Previero, A., Lami, O.S., Bouardi, H.T.: Optimizing vaccine allocation to combat the COVID-19 pandemic. MedRxiv, 2020–11 (2020)
- Buhat et al. [2021] Buhat, C.A.H., Lutero, D.S., Olave, Y.H., Quindala, K.M., Recreo, M.G.P., Talabis, D.A.S., Torres, M.C., Tubay, J.M., Rabajante, J.F.: Using constrained optimization for the allocation of COVID-19 vaccines in the Philippines. Applied Health Economics and Health Policy 19, 699–708 (2021)
- Wilder et al. [2020] Wilder, B., Suen, S.-c., Tambe, M.: Allocating outreach resources for disease control in a dynamic population with information spread. IISE Transactions 53(6), 629–642 (2020)
- Bubar et al. [2021] Bubar, K.M., Reinholt, K., Kissler, S.M., Lipsitch, M., Cobey, S., Grad, Y.H., Larremore, D.B.: Model-informed COVID-19 vaccine prioritization strategies by age and serostatus. Science 371(6352), 916–921 (2021)
- Choi et al. [2021] Choi, Y., Kim, J.S., Kim, J.E., Choi, H., Lee, C.H.: Vaccination prioritization strategies for COVID-19 in Korea: a mathematical modeling approach. International Journal of Environmental Research and Public Health 18(8), 4240 (2021)
- Tatapudi et al. [2021] Tatapudi, H., Das, R., Das, T.K.: Impact of vaccine prioritization strategies on mitigating COVID-19: an agent-based simulation study using an urban region in the United States. BMC Medical Research Methodology 21(1), 1–14 (2021)
- Lee et al. [2015] Lee, E.K., Yuan, F., Pietz, F.H., Benecke, B.A., Burel, G.: Vaccine prioritization for effective pandemic response. Interfaces 45(5), 425–443 (2015)
- Lee et al. [2021] Lee, E.K., Li, Z.L., Liu, Y.K., LeDuc, J.: Strategies for vaccine prioritization and mass dispensing. Vaccines 9(5), 506 (2021)
- Chang et al. [2021] Chang, S., Pierson, E., Koh, P.W., Gerardin, J., Redbird, B., Grusky, D., Leskovec, J.: Mobility network models of COVID-19 explain inequities and inform reopening. Nature 589(7840), 82–87 (2021)
- Zachreson et al. [2021] Zachreson, C., Mitchell, L., Lydeamore, M.J., Rebuli, N., Tomko, M., Geard, N.: Risk mapping for COVID-19 outbreaks in Australia using mobility data. Journal of the Royal Society Interface 18(174), 20200657 (2021)
- Badr et al. [2020] Badr, H.S., Du, H., Marshall, M., Dong, E., Squire, M.M., Gardner, L.M.: Association between mobility patterns and COVID-19 transmission in the USA: a mathematical modelling study. The Lancet Infectious Diseases 20(11), 1247–1254 (2020)
- Guevara et al. [2015] Guevara, R.E., Motala, T., Terashita, D.: The changing epidemiology of coccidioidomycosis in Los Angeles (LA) County, California, 1973–2011. PLoS One 10(8), 0136753 (2015)
- Weiss [2013] Weiss, H.H.: The SIR model and the foundations of public health. Materials Matematics, 0001–17 (2013)
- Cooper et al. [2020] Cooper, I., Mondal, A., Antonopoulos, C.G.: A SIR model assumption for the spread of COVID-19 in different communities. Chaos, Solitons & Fractals 139, 110057 (2020)
- Tang et al. [2020] Tang, L., Zhou, Y., Wang, L., Purkayastha, S., Zhang, L., He, J., Wang, F., Song, P.X.-K.: A review of multi-compartment infectious disease models. International Statistical Review 88(2), 462–513 (2020)
- Chowdhury et al. [2021] Chowdhury, S., Roychowdhury, S., Chaudhuri, I.: Universality and herd immunity threshold: Revisiting the SIR model for COVID-19. International Journal of Modern Physics C 32(10), 2150128 (2021)
- Fine et al. [2011] Fine, P., Eames, K., Heymann, D.L.: “herd immunity”: a rough guide. Clinical Infectious Diseases 52(7), 911–916 (2011)
- Aguas et al. [2020] Aguas, R., Corder, R.M., King, J.G., Gonçalves, G., Ferreira, M.U., Gomes, M.G.M.: Herd immunity thresholds for SARS-CoV-2 estimated from unfolding epidemics. MedRxiv, 2020–07 (2020)
- Chen et al. [2021] Chen, J., Hoops, S., Marathe, A., Mortveit, H., Lewis, B., Venkatramanan, S., Haddadan, A., Bhattacharya, P., Adiga, A., Vullikanti, A., et al.: Prioritizing allocation of COVID-19 vaccines based on social contacts increases vaccination effectiveness. MedRxiv, 2021–02 (2021)
- Aborode et al. [2021] Aborode, A.T., Olofinsao, O.A., Osmond, E., Batubo, A.P., Fayemiro, O., Sherifdeen, O., Muraina, L., Obadawo, B.S., Ahmad, S., Fajemisin, E.A.: Equal access of COVID-19 vaccine distribution in Africa: Challenges and way forward. Journal of Medical Virology 93(9), 5212–5215 (2021)
- Bollyky et al. [2020] Bollyky, T.J., Gostin, L.O., Hamburg, M.A.: The equitable distribution of COVID-19 therapeutics and vaccines. JAMA 323(24), 2462–2463 (2020)
- Open Route Service [2022] Open Route Service: Open Route Service. Availible at https://openrouteservice.org/ (accessed October 30, 2023) (2022)
- Los Angeles County Department of Public Health [2023] Los Angeles County Department of Public Health: Los Angeles County Health Survey. Availible at http://publichealth.lacounty.gov/ha/hasurveyintro.html(accessedOctober30,2023) (2023)
- U.S. Census Bureau [2022] U.S. Census Bureau: Commuting by Workers Los Angeles County. Availible at https://www.laalmanac.com/employment/em22.php (accessed October 30, 2023) (2022)
- Ma and Qian [2018] Ma, W., Qian, Z.S.: Estimating multi-year 24/7 origin-destination demand using high-granular multi-source traffic data. Transportation Research Part C: Emerging Technologies 96, 96–121 (2018)
- Yu et al. [2024] Yu, H., Zhang, S., Suen, S.-c., Dessouky, M., Ordonez, F.: Extending dynamic origin-destination estimation to understand traffic patterns during COVID-19. arXiv preprint arXiv:2401.10308 (2024)
- City of Los Angeles Public Health [2023] City of Los Angeles Public Health: LA County COVID-19 Data. Availible at http://publichealth.lacounty.gov/media/Coronavirus/data/ (accessed October 30, 2023) (2023)
- Los Angeles County Department of Public Health [2024] Los Angeles County Department of Public Health: COVID-19 VACCINE. Availible at http://publichealth.lacounty.gov/media/coronavirus/vaccine/vaccine-dashboard.html (accessed January 4, 2024) (2024)
- Zhu et al. [2020] Zhu, X., Wang, F., Chen, C., Reed, D.D.: Personalized incentives for promoting sustainable travel behaviors. Transportation Research Part C: Emerging Technologies 113, 314–331 (2020)
- Ghafelebashi et al. [2023] Ghafelebashi, A., Razaviyayn, M., Dessouky, M.: Congestion reduction via personalized incentives. Transportation Research Part C: Emerging Technologies 152, 104153 (2023)