Ferroelectric to paraelectric structural transition in LiTaO3 and LiNbO3
Abstract
The ferroelectric to paraelectric phase transition in LiTaO3 and in pure as well as Mg doped LiNbO3 is investigated theoretically by atomistic calculations in the framework of the density functional theory, as well as experimentally by calorimetry and electrical conductivity measurements. First principles models within the stochastic self-consistent harmonic approximation (SSCHA) allow to consider anharmonic effects and thus to obtain a realistic estimate of the Curie temperature of both ferroelectrics. Ab initio molecular dynamics (AIMD) calculations performed on large supercells confirm the Curie temperatures estimated with the SSCHA approach. Moreover, they also suggest that the structural phase transition is a continuous process beginning at temperatures well below . According to AIMD, significant ionic displacements occurr already at temperatures of about 100 K and 300 K below in LiTaO3 and LiNbO3, respectively. To asses whether and how far the ionic displacements affect the materials properties, the AIMD results are compared with measurements of the electrical conductivity and of the heat capacity across the phase transition. Our first principles calculations moreover show that Mg ions, a frequently employed dopant, raise the Curie temperature in LiNbO3.
I Introduction
Lithium niobate (LiNbO3, LN) and lithium tantalate (LiTaO3, LT) are two isomorph ferroelectrics, which are among the most widely used electro-optic materials [1]. LN is characterized by unusually large pyroelectric, piezoelectric, electro-optic, and photo-elastic coefficients [1]. The magnitude of these coefficients is less pronounced in LT, which features, however, higher thermal stability. As an example, at high temperatures LT exhibits a much lower increase in electrical conductivity than LN, when the oxygen partial pressure is decreased [2]. Lithium niobate and tantalate are birefringent, have useful acoustic wave properties [3] and a rather large acousto-optic figure-of-merit. The wealth of physical effects and, more important, their magnitude, render LN and LT ideal candidates for acoustic and optical applications, exploiting both their bulk and surface properties [4].
Despite this wide range of applications, many aspects of the physics underlying the properties of LN and LT are not fully understood. This is particularly true for the phase transition between the paraelectric and the ferroelectric phases of the materials. This lack of knowledge is problematic. From an academic point of view, phase transitions are a fascinating topic which deserves an accurate investigation. Morever, the investigation of the ferroelectric to paraelectric transition is of technological relevance. Indeed, devices such as, e.g., sensors, are often operated at high temperatures, even close to the transition temperature.
The ferroelectric to paraelectric structural transition in LiNbO3 and LiTaO3 is a phase transition of the second order [5, 6] according to the Ehrenfest notation. Accordingly, the spontaneous polarization steadily grows with decreasing temperature from 0 to a value of 71(62) C/cm2 and 60(55) C/cm2 for congruent (nearly stoichiometric) LiNbO3 [7] and LiTaO3 [8], respectively. The onset temperature is known as transition or Curie temperature , and has been measured to be in the range 1413 K (1140 ∘C) – 1475 K (1202 ∘C) for LiNbO3 [7, 9] and in the range 874 K (601 ∘C) – 958 K (685 ∘C) for LiTaO3 [8, 10], respectively. The large scattering of the measured values is in part due to the intrinsic difficulty to perform measurements at about 1500 K and in part to the nature of the phase transition, which is not a singular event occuring at but rather a continuous transition taking place in a temperature interval around [11, 12].
It has been controversially discussed whether the transition is of displacive or order-disorder type. A typical signature of displacive transitions is the presence of one or more optical phonon modes, which become soft close to the Curie temperature . No soft modes exist in order-disorder transitions, instead. Therefore, many different studies have been focused on the investigation of the phonon modes of LN [13, 14, 15, 16] and LT [13, 17, 18, 19]. Some of the investigations, including Rayleigh scattering, Raman spectroscopy and infrared reflectivity, demonstrated the existence of a (TO) optical phonon becoming soft at high temperatures, suggesting a displacive nature of the transition [20, 21, 22]. This interpretation was corroborated by Wood et al., who measured the birefringence of lithium niobate tantalate crystals (LiNb1-xTaxO3) for various compositions and temperatures, finding that it changes continuously across the Curie temperature, as expected for a displacive-type transition [23]. Yet, no mode softening could be observed in other studies, including neutron and Raman scattering experiments, suggesting the order-disorder nature of the ferroelectric to paraelectric phase transition [24, 25, 26]. Theoretical investigations based on the modeling of the phonon modes within the frozen phonon approach supported an order-disorder model for the oxygen atoms as the driving mechanism for the ferroelectric instability [27, 28].
This apparent contradiction was solved later by ab initio [11] and classic [12] molecular dynamics simulations, which showed that the ferroelectric to paraelectric phase transition is (at least in LiNbO3) of both order-disorder and displacive type. More in detail, the calculations demonstrated that the structural transformation is a process involving a displacive transition of the Nb sublattice and an order-disorder transition in the Li-O planes, which is completed at about . Thus, the phase transition is a continuous process that takes place within a larger temperature interval and not an abrupt one as known, e.g., for solid to liquid structural transitions.
Although the contribution of the atomistic simulations has been crucial for the interpretation of the phase transition, the insight obtained in these studies must be considered of qualitative nature. Ab initio molecular dynamics simulations have been performed in smaller supercells [11], thus failing to accurately estimate the transition temperature. Finite size effects indeed lead to the underestimation of . Classic molecular dynamics can deal with larger supercells, however they have limited predictive power. Calculations performed using different potentials predict a different behavior of the Nb-sublattice below the Curie temperature [12, 29]. Moreover, the theoretical investigations performed so far neglected the thermal expansion, which might be a problematic approximation for high values of . For these reasons, the exact theoretical value of for LiNbO3, LiTaO3 and, more important, the temperature range in which the structural transformation occurs, are still to be determined.
An usual way to calculate the transition temperature from first principles is based on the estimate of the free energy of the two phases [30], with the vibrational contribution to the entropy accounted for in harmonic approximation. This procedure has been attempted also for LiNbO3 and LiTaO3 as well [17]. However, the presence of imaginary phonon modes in the paraelectric structure does not allow the accurate calculation of the transition temperature. Moreover, the harmonic approximation is questionable at temperatures close to of the investigated system. A recent study pointed out the crucial role of anharmonicity in understanding the high temperature behavior, e.g., in thermal transport, of LT and, even more, of LN [31].
In this work we employ two different approaches to investigate the behavior of LiNbO3 and LiTaO3 in the temperature interval enclosing the Curie temperature. On the one hand, we employ the stochastic self-consistent harmonic approach (SSCHA) for a realistic estimate of the transition temperature. On the other hand, we perform ab initio molecular dynamics (AIMD) simulations on large supercells to estimate the temperature interval at which the structural transition occurs and investigate the mechanisms of the phase transition itself. We consider thereby the thermal expansion of the crystals. Both approaches can take anharmonicity into account and allow to investigate differences and similarities between LiNbO3 and LiTaO3.
Calculations within the SSCHA approach yield a reliable phonon dispersion of the two phases and a realistic assessment of the transition temperature, which is calculated at 808 K for LiTaO3 and at 1408 K for LiNbO3. AIMD models confirm that the phase transition is a complex process involving a displacive transition of the Nb ions with the oxygen octahedra at a temperature below and an order-disorder transition in the Li ions, which is completed at . In particular substantial ion displacement is predicted at temperatures below of about 100 K for LiTaO3 and 300 K for LiNbO3. This temperature interval is further investigated by transport and calorimetry experiments. The measurements reveal modifications of the conductivity in a temperature range similar to the calculated interval, while the heat capacity continuously varies from the value of the ferroelectric phase to the value of the paraelectric phase in a more restricted interval.
It is moreover predicted that Mg doping, often used to enhance the resistance to optical damage, raises the transition temperature of stoichiometric LiNbO3. Density functional theory calculations within the nudged elastic band (NEB) method reveal that during the phase transition Mg has to overcome an energy barrier which is at least an order of magnitude larger than for the Li atoms, thus locally pinning the ferroelectric phase. This confirms previous dielectric measurements of the Curie temperature as a function of the MgO content [32].
II Methodology
II.1 Stochastic self-consistent harmonic approximation
For the accurate estimate of the Curie temperature, we calculate the free energy per unit cell of the ferroelectric and of the paraelectric phase as a function of the temperature. The free energy per unit cell is given as:
| (1) |
where are the phononic frequencies of mode at q-point q. We note that the frequencies parametrically depend on the unit cell volume, which is itself a function of temperature. Due to the large fundamental gap of LiTaO3 and LiNbO3, the electronic entropy can be neglected in first approximation [33].
To estimate energies and frequencies in equation 1, the DFT as implemented in VASP [34, 35, 36] is employed. PAW potentials [37, 38] with PBEsol exchange-correlation functional [39] and electronic configurations 1s22s1, 4p64d35s2, 5s25p65d36s2 and 2s22p4 for Li, Nb, Ta and O respectively, are used. Our calculations include collinear spin-polarization. Hubbard corrections according to the simplified approach proposed by Dudarev et al. [40] are applied to the orbitals of Ta and Nb. Thereby we employ effective values of = 4 eV for Nb and = 5 eV for Ta, according to reference [41]. Rhombohedral unit cells with and symmetries model the ferroelectric and paraelectric phase of LN and LT, respectively. A Monkhorst-Pack K-point mesh [42], as well as an energy cutoff of 500 eV are needed to converge electronic energies to 10 meV. A Gaussian smearing with width 0.02 eV is applied to the Fermi occupancies. The ionic positions are optimized, such that all forces acting on the ions are lower than 0.005 eV/Å.
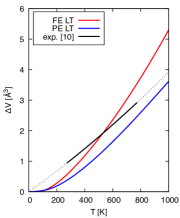
In order to obtain the unit cell volume as a function of temperature, we employ the quasi-harmonic approximation (QHA) as implemented in phonopy [43, 44]. Following the procedure outlined in Ref. [45], we calculate harmonic phonon frequencies using the finite differences method with supercells at different volumina. Using the Parlinski-Li-Kawazoe method to interpolate the phonon frequencies to arbitrary q-points [46], we obtain the harmonic phonon frequencies on a mesh. This yields phononic free energies converged within 1 meV with respect to a twice as dense q-point mesh. These frequencies and volumina are then used to calculate the Gibbs energy at different temperatures (assuming no internal pressure, see Eq. 2). Fitting the Gibbs energy via the Murnaghan-Birch equation of state, we obtain the equilibrium volume as a function of temperature. This is shown exemplarily for LiTaO3 in figure 1. The corresponding data for LiNbO3, as well as a table with the unit cell volume and the lattice parameters calculated for each considered temperature is shown in the SI.
| (2) |
Here, we consider rather high temperatures. It is therefore not reasonable to assume the validity of the harmonic approximation. Furthermore, the harmonic phonon frequency spectrum of the paraelectric (PE) phase of LT contains imaginary modes [47]. An approach beyond the harmonic estimate of the phonon frequencies, which includes thermal fluctuations, is needed.
Thermal fluctuations (in particular anharmonic fluctuations) are often neglected in atomistic calculations. However, they affect the atomic structure, the phonon spectrum and thus the free energy of crystalline solids. The stochastic self-consistent harmonic approximation (SSCHA) method is an approach that allows to perform crystal geometry relaxation on the quantum mechanically calculated free energy landscape, optimizing the free energy with respect to all degrees of freedom of the crystal structure [48]. In order to account for nuclear thermal fluctuations, however, the full Born-Oppenheimer energy surface, as well as its derivatives with respect to ionic positions (forces) and cell parameters (stress tensor) must be known, i.e., they must be calculated, e.g., by DFT within the stochastic approach as described in the following. Within this approach, we get access to the thermodynamics of crystals accounting for nuclear thermal anharmonic fluctuations.
We use the SSCHA [49, 50, 51, 52] as implemented in python-sscha [48] to include anharmonic phononic effects. The formalism being used is described in detail in Ref.[48]. We adopt the nomenclature established therein.
In a first step, to sample the free energy landscape, a set of random ionic configurations is created in a chosen supercell according to the Gaussian probability distribution for the ions. Due to the severe computational cost, we only calculate anharmonic effects for selected temperatures using supercells (80 atoms). The equilibrium volume at a given temperature is assumed to be the one calculated within the QHA.
For PE LT and LN, we generate up to 400 structures per ensemble (see SI). As ferroelectric (FE) LT and LN have a lower symmetry, a larger ensemble size is necessary. Here, we use up to five times as many structures as for paraelectric LT or LN. On average, four ensembles are needed to find the free energy minimum. Lastly, another ensemble is created to calculate the anharmonic phonon frequencies. This last ensemble includes 10000 structures, in order to achieve convergence of the phonon frequencies of around 5 cm-1, compared to a twice as large ensemble size. We assume the so called bubble-approximation (see reference [48]), as its first order correction has only a minimal effect on the phonon frequencies. Again, these frequencies are then interpolated onto a mesh. The SSCHA calculated phonon dispersion for LiTaO3 and LiNbO3 is shown in the SI.
The electronic energy is calculated using a stochastic average over this last ensemble, where the electronic energy of each structure is weighted according to the given temperature and dynamical matrix. The resulting stochastic uncertainty of the electronic energies is less than 1 meV.
Finally, inserting the calculated anharmonic phonon frequencies and electronic energies into Eq.1, we can compare the free energy of both phases as a function of temperature.
II.2 Molecular dynamics
While standard DFT calculations model atomic systems at 0 K, molecular dynamics runs allow to model atomic structures at finite temperatures by coupling the system with a thermostat. The latter initializes the velocities of the atoms according to the Maxwell-Boltzmann distribution at the considered temperature. The time evolution of the system is obtained by solving the Newton equation of motion by means of a Verlet algorithm within a given time step. At each time step, the forces acting on the ions are calculated within quantum mechanics. In our calculations, we employ a time step of 2 fs and model the time evolution for about 5 ps. The first 1 ps of the MD trajectories, in which the system reaches thermal equilibrium is discarded and not considered for the data analysis. For the calculations of the MD trajectories, the Nosé-Hoover thermostat [53, 54] is employed, which models a canonical ensemble.
AIMD calculations are performed within the numerical approach described in the previous section, i.e., the DFT as implemented in VASP [34, 35, 36], in combination with PAW potentials [37, 38] and the PBEsol [39] exchange-correlation potential is employed. The wave functions are expanded in a plane wave basis up to 400 eV. In order to avoid self-correlation effects due to the periodic boundary conditions, very large supercells consisting of a 444 repetition of the rhombohedral unit cell (640 atoms) are employed. Accordingly, the volume of the Brillouin zone is rather limited and the energy integration is performed at the zone center (-point). The volume of the cells in real space is calculated within the QHA at each considered temperature, as described in the previous section. Test calculations reveal that neglecting the thermal expansion and using supercell of smaller size lead to results that are qualitatively similar. However, a serious underestimation of the transition temperature occurs as discussed in the next section.
From the AIMD runs a real time polarization can be extrapolated. Strictly speaking, the macroscopic polarization for a supercell must be calculated within the modern theory of polarization as a Berry phase of the Bloch orbitals [55, 56, 57]. Yet, this approach is time consuming and cannot be applied to thousands of configurations of supercells containing 640 atoms. We employ therefore a simplified, approximated approach, in which the macroscopic polarization is defined as dipole moment per volume unit calculated with respect to a reference phase with (e.g., the paraelectric phase). More details about the calculation of are given in the SI.
II.3 Sample growth and calorimetry
A LiTaO3 crystal was grown via induction heating using the Czochralski process. The process was carried out in a protective argon atmosphere with a small addition of oxygen (less than 1 vol %). The starting materials were mixtures of lithium carbonate (Li2CO3, Alfa Aesar, 5N) and tantalum pentoxide (Ta2O5, Fox Chemicals, 4N). The crystal was grown along the -axis at a 0.5 mm/h rate. Samples cut from the grown material are labeled by IKZ in the following. For comparison, a commercial Lithium Tantalate (LT) sample was utilized in this study. A wafer of congruent composition was purchased from Precision MicroOptics Inc. (PMO, USA) and was cut into wafers of dimensions 650.5 mm3, with both X-cut and Z-cut orientations. Samples cut from the commercial wafer are labeled by PMO in the following. Lithium Niobate (LN) purchased from the same company and cut in the same state as LT was also employed in this research.
Differential scanning calorimetry (DSC) was applied to determine . Thereby, a NETZSCH STA 449C ”F3” thermal analyzer was used. Following the ASTM E1269 standard, three consecutive measurements were done under identical conditions with empty crucibles (reference and sample), Al2O3 powder as standard with known values, and the powdered sample. Four subsequent measurements were conducted up to 1463 K in a flow mixture of 40 ml/min Ar and 20 ml/min O2, with isothermal sections for equilibration. Subsequently, these heating segments’ functions from the last three measurements were averaged and used for further evaluation.
II.4 Conductivity
To measure the electrical conductivity of LiNbO3 and LiTaO3 single crystals, platinum electrodes are deposited on the samples through screen printing. The thickness of the electrodes is around 3 µm. Subsequently, the pieces are annealed at 1000 ∘C for about an hour with a 2 K/min heating rate.
An AC impedance spectroscopy is performed within a frequency range of 1 Hz to 1 MHz with an excitation AC voltage of 50 mV to measure the conductivity. An impedance/gain-phase analyzer (Solartron 1260, Ametek Scientific Instruments, Hampshire, UK) is used for this purpose. The measurements are carried out in air, in a tube furnace that can heat up to 1580 K at atmospheric pressure, starting from room temperature with a heating rate of 1 K/min. Precise temperature control is maintained using a Type S thermocouple to measure sample temperature and a Pt100 thermoresistor to compensate for cold-end temperature variations of the thermocouple.
Modeling the electrical properties of the samples was done using a single equivalent circuit consisting of a bulk resistor () in parallel with a constant phase element (CPE) based on the obtained single semicircular EIS features. The bulk conductivity is calculated using the formula , where and represent the sample thickness and electrode area, respectively.
The activation energy is determined using the Arrhenius relation as follows:
| (3) |
Here, , and represent a constant pre-exponential coefficient, the Boltzmann constant, and the absolute temperature, respectively. The Nernst-Einstein relation states that reflects the connection between mobility, which affects electrical conductivity, and thermally activated diffusion. Equation 3 provides the activation energy if a single conduction mechanism dominates over an extensive temperature range, reflected by a constant slope in the Arrhenius representation. The logarithmic slope of in Eq. 4 is used for analysis as the Arrhenius plot does not show differences in electrical conductivity at high temperatures (more details on the procedure can be fond, e.g., in Ref. [41]).
| (4) |
The consideration of is discussed in the following.
III Results
III.1 Transition temperature
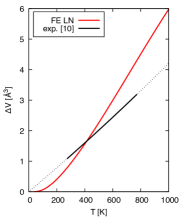
The Curie temperature of the structural transition between the ferroelectric and the paraelectric phase is obtained inserting the phonon frequencies including anharmonic contributions as estimated in the SSCHA framework and the electronic energies into equation 1. The data are calculated considering the thermal expansion as estimated within the QHA, as shown in figure 2. The calculated data are in overall good agreement with the measured thermal expansion of LiTaO3 and LiNbO3 as given by the coefficients from Ref. [10]. The calculated values slightly overestimate the measured volumes in both materials by around 2%, as known from GGA based exchange and correlation functionals. The deviations might also be related to the stoichiometric composition of the measured samples or by anharmonic contributions disregarded in the QHA.
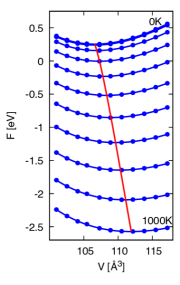
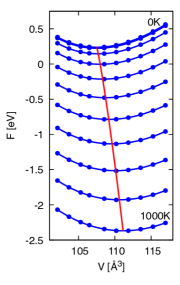
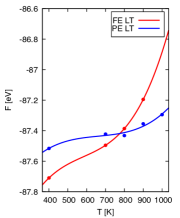
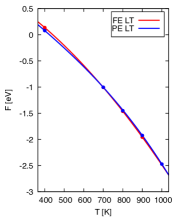
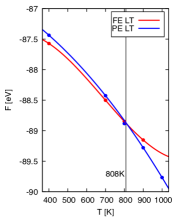
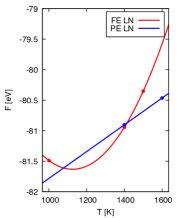
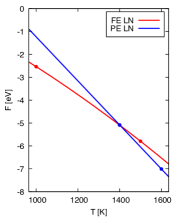
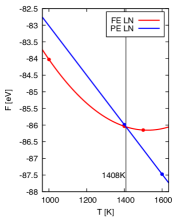
Figure 3 shows the free energy of the unit cell of the ferroelectric and paraelectric structure of LT (upper part) and LN (lower part) as a function of the temperature. Electronic and vibrational contributions (as calculated with equation 1) are shown in 3 (a) and 3 (b), respectively, while 3 (c) shows the total free energy. Assuming a minor dependence on the pressure (a resonable approximation for solids), the groundstate configuration for a certain volume is given at each temperature by the structure with the lower free energy. The Curie temperature is the intersection of both curves. In our calculation the intersection occurs at around 808 K and 1408 K for LiTaO3 and LiNbO3, respectively. They are rather close to the experimentally determined value of 874 K [8, 10] and 1413 K [7], respectively, although the value calculated for LT underestimates somehow the measured value.
(a) (b) (c)
The transition temperature of LiNbO3 was estimated in Ref. [47] comparing the free energies of the paraelectric and ferroelectric phases, similarly to the approach we apply, however within the harmonic approximation. The calculated transition temperature was estimated to be 1000 K using the DFT calculated equilibrium volume and 1160 K using the high-temperature experimental volume. Our calculations based on the SSCHA formalism predict for LiNbO3 a transition temperature of 1408 K and thus confirm not only the obvious consideration that quasi-harmonic contribution are of fundamental importance, but also allow to quantify their impact on the overall results. Comparing the results obtained neglecting and including non-harmonic effects, we can conclude that they cause a shift of the transition temperature of ca. 250 K, greatly improving the agreement between measured and calculated transition temperatures.
III.2 Transition dynamics
After determining the Curie temperatures for the ferroelectric to paraelectric transition in LiTaO3 and LiNbO3 within the SSCHA approach, we adopt a microscopic perspective to investigate the atomic displacements at the phase transition. This yields information about the mechanisms of the phase transition at the atomic scale and about the width of the temperature interval at which the structural transition occurs.
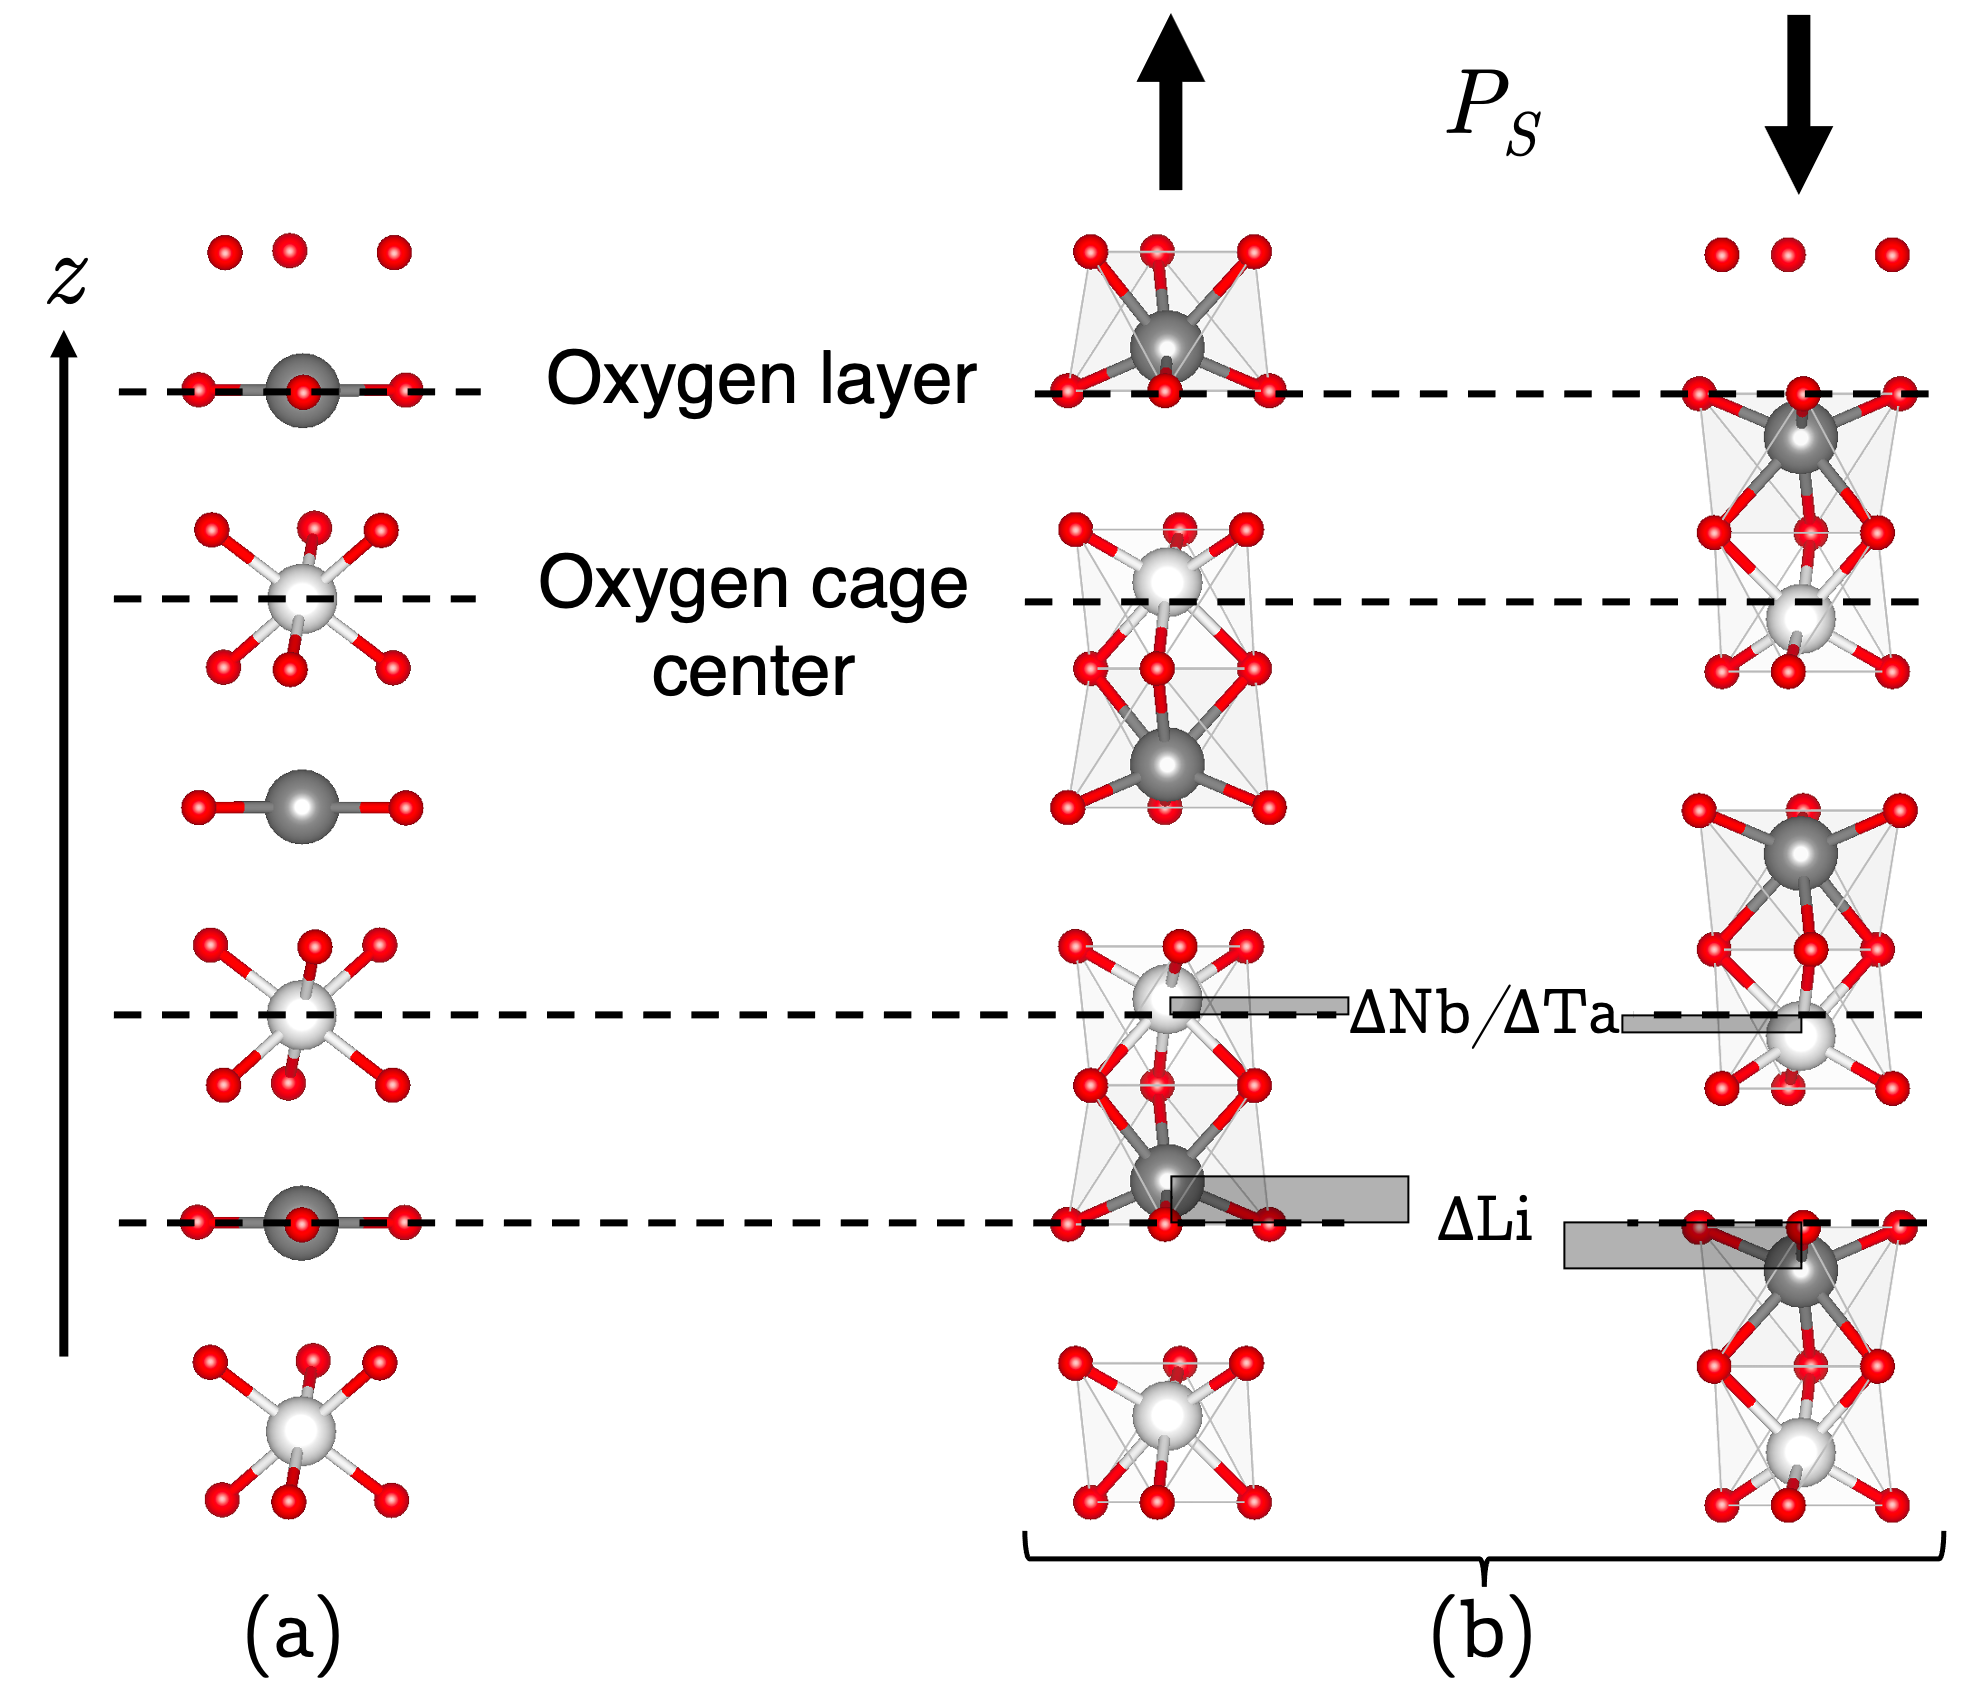
In order to understand the atomic displacement at the structural transformation, it is crucial to describe the microscopic structure of the two phases involved in the transition. LiTaO3 and LiNbO3 can be both thought of as oxygen octahedra piled along the crystal axis. These octahedra may be empty or host Li and Ta/Nb atoms. In the ferroelectric structure, the octahedra occupation follows the order (from bottom to top) Li, Ta/Nb, empty, Li, Ta/Nb, empty, and so forth, as shown in figure 4. The Nb/Ta atoms are not at the center of the oxygen octahedra, while the Li atoms are just above (or below) an oxygen plane. This atomic arrangement is non-centrosymmetric (space group ). The center of mass of the positive (Nb5+, Ta5+, Li+) and negative (O2-) charges are displaced, giving rise to a spontaneous polarization along the -axis as large as 0.60 C/m2 for LiTaO3 [8] and 0.71 C/m2 for LiNbO3 [7], as discussed in the introduction.
The high temperature phase of LiTaO3 and LiNbO3 (above 874 K [8] and 1411 K [7], respectively) is paraelectric and belongs to the space group . According to the general understanding of this structure, the Li ions lie exactly within the oxygen planes, while the Ta and Nb atoms sit exactly at the center of oxygen octahedra, as shown in figure 4. The structure has a higher symmetry than the ferroelectric phase. In particular, the centers of mass of the positive and negative charges coincide, and the crystal shows no spontaneous polarization. We remark that this picture has been previously questioned [11]. It has been suggested that it only holds in time average, while the instantaneous configuration features Li ions randomly distributed above or below the oxygen planes, so that oppositely directed microscopic dipole moments sum up to a zero net polarization [11].
The deviation of the atomic positions in the ferroelectric and paraelectric structure can be quantified by the displacement of the Nb/Ta ions from the oxygen cage center (Nb, Ta) and of the Li ions from the oxygen planes (Li). According to our calculations, at 0 K (in the ferroelectric phase) the displacements assume the value Nb = 0.279 Å, Li = 0.717 Å in LiNbO3, and Ta = 0.188 Å, Li = 0.643 Å in LiTaO3, respectively.
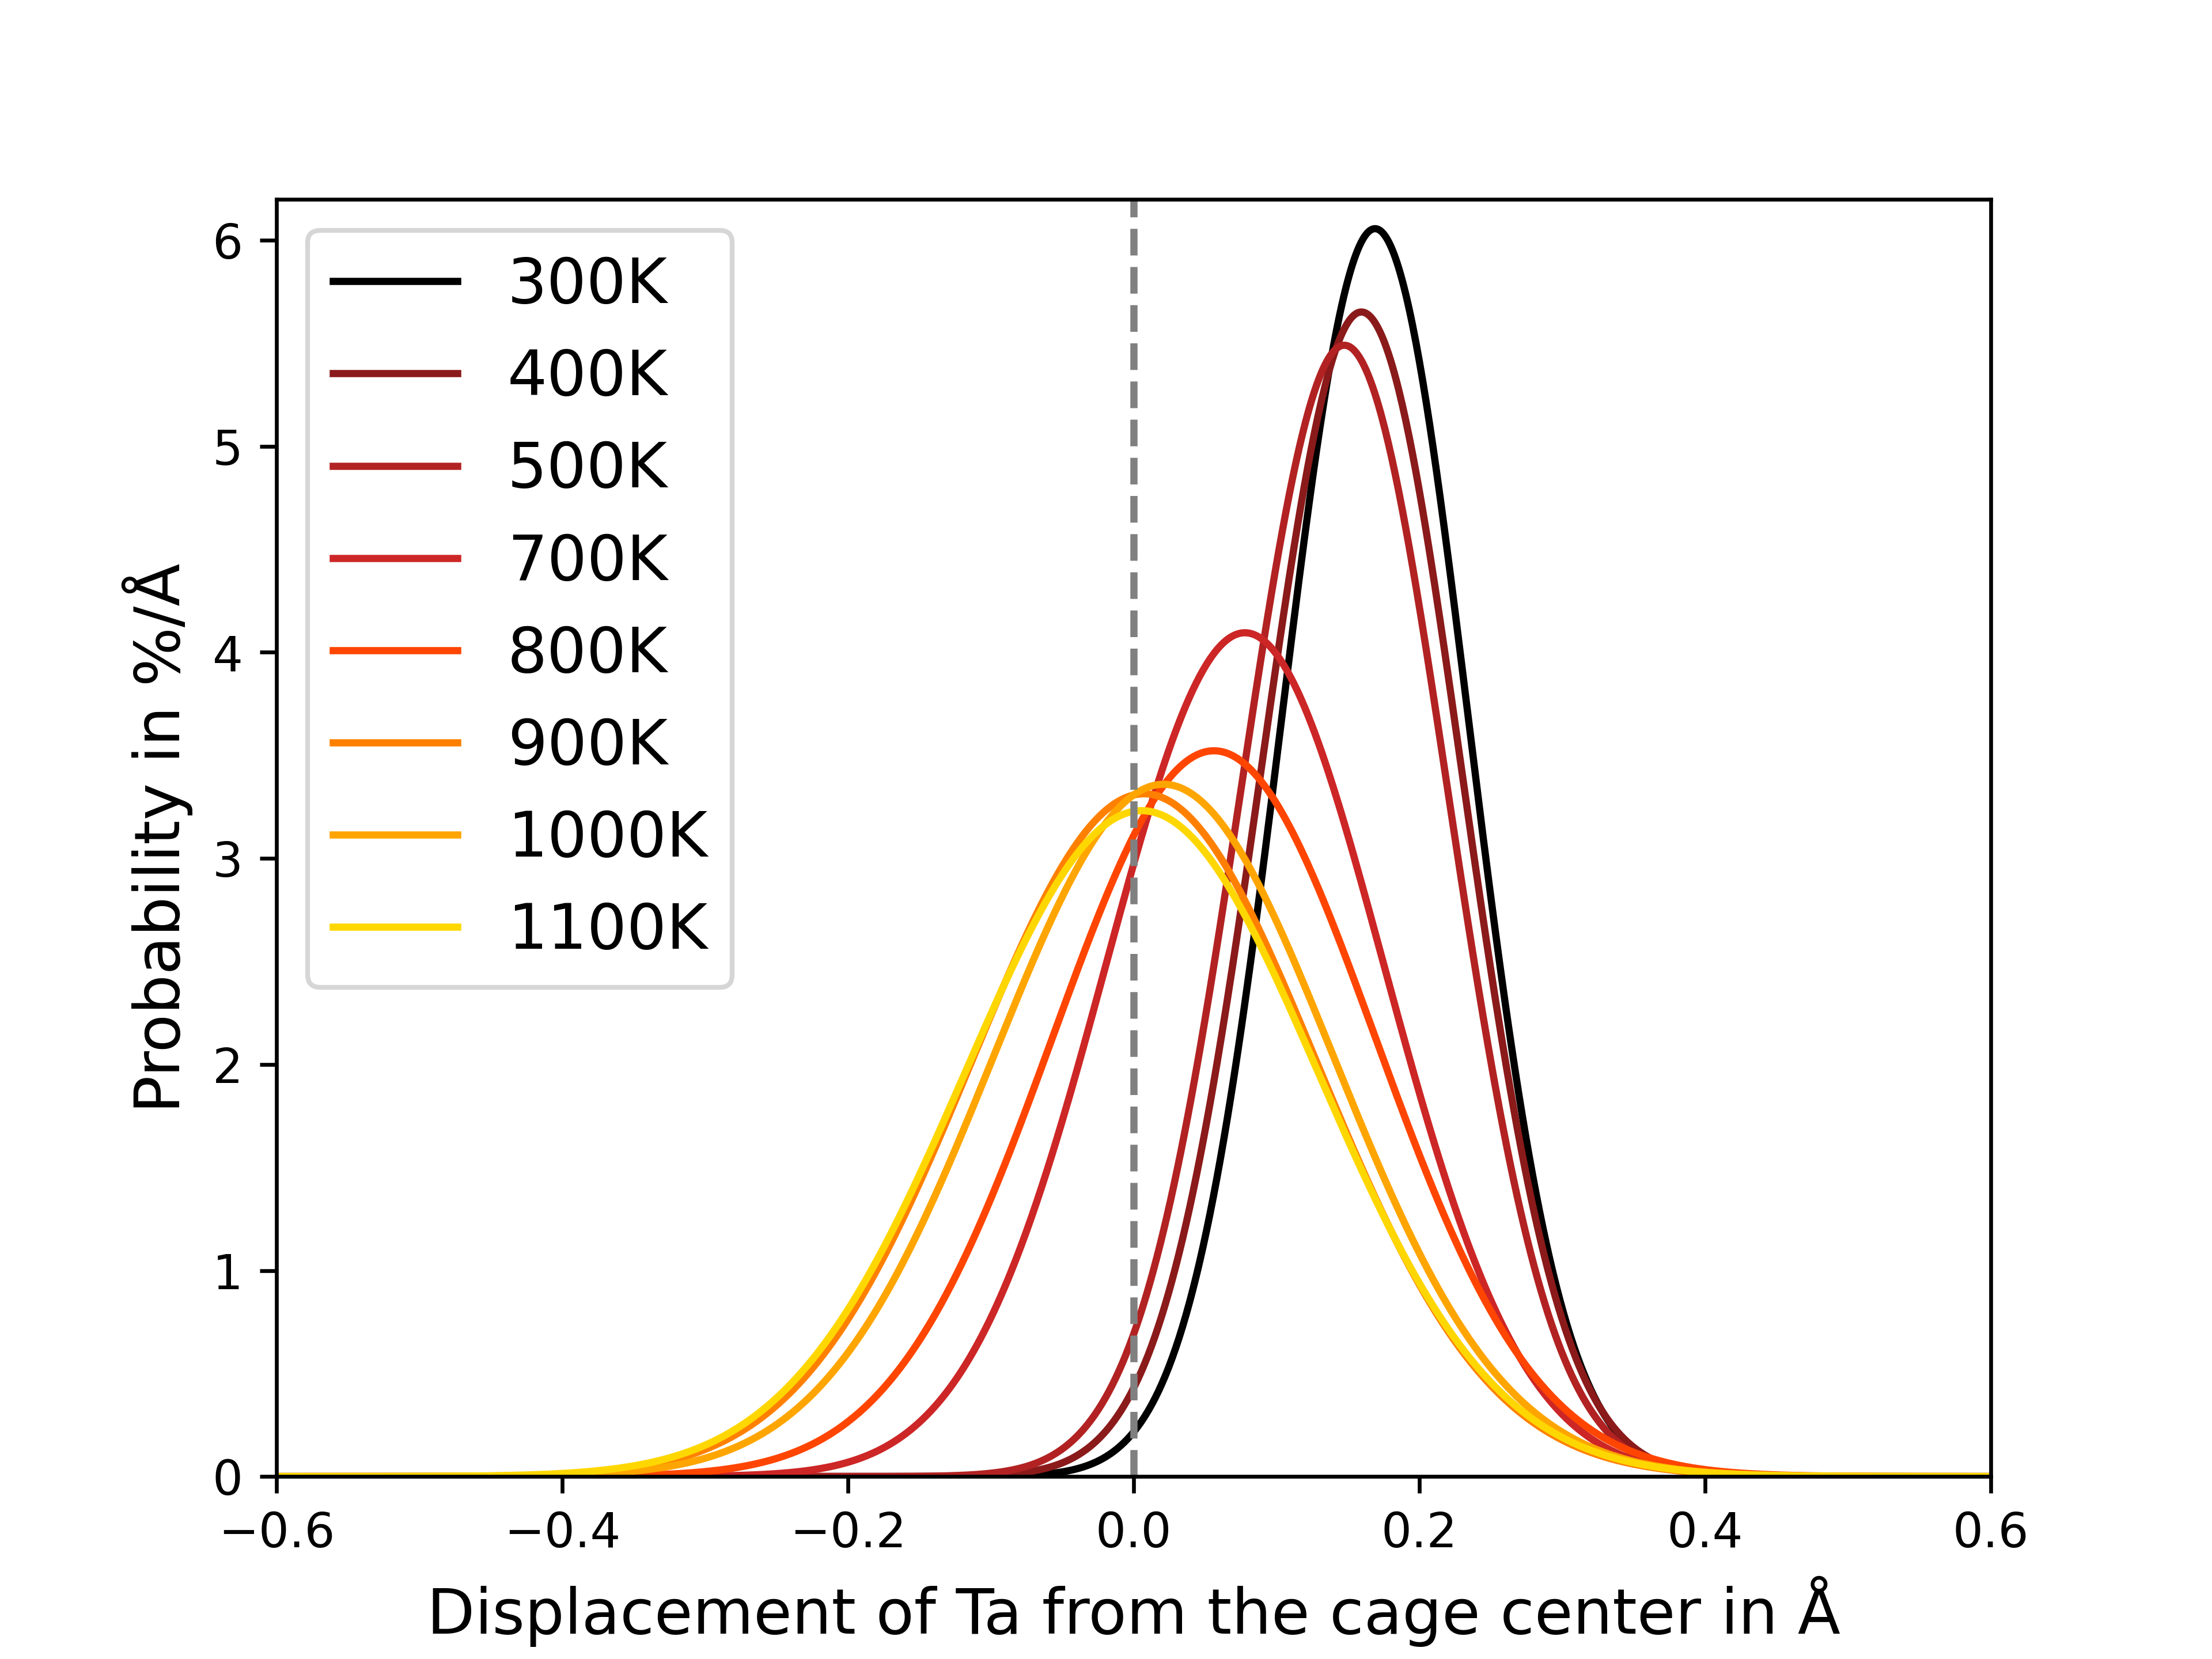
To investigate the dynamics of the phase transition, we estimate the temperature dependence of the parameters Li and Nb, Ta, which we extract from the AIMD runs performed at different temperatures. Let us start our discussion with LiTaO3. From the crystal structure shown in figure 4, it can be expected that above the Curie temperature Li and Ta are distributed about a value of zero, while at low temperatures they are distributed around the value calculated for 0 K of 0.188 Å for Ta and 0.643 Å for Li, respectively.
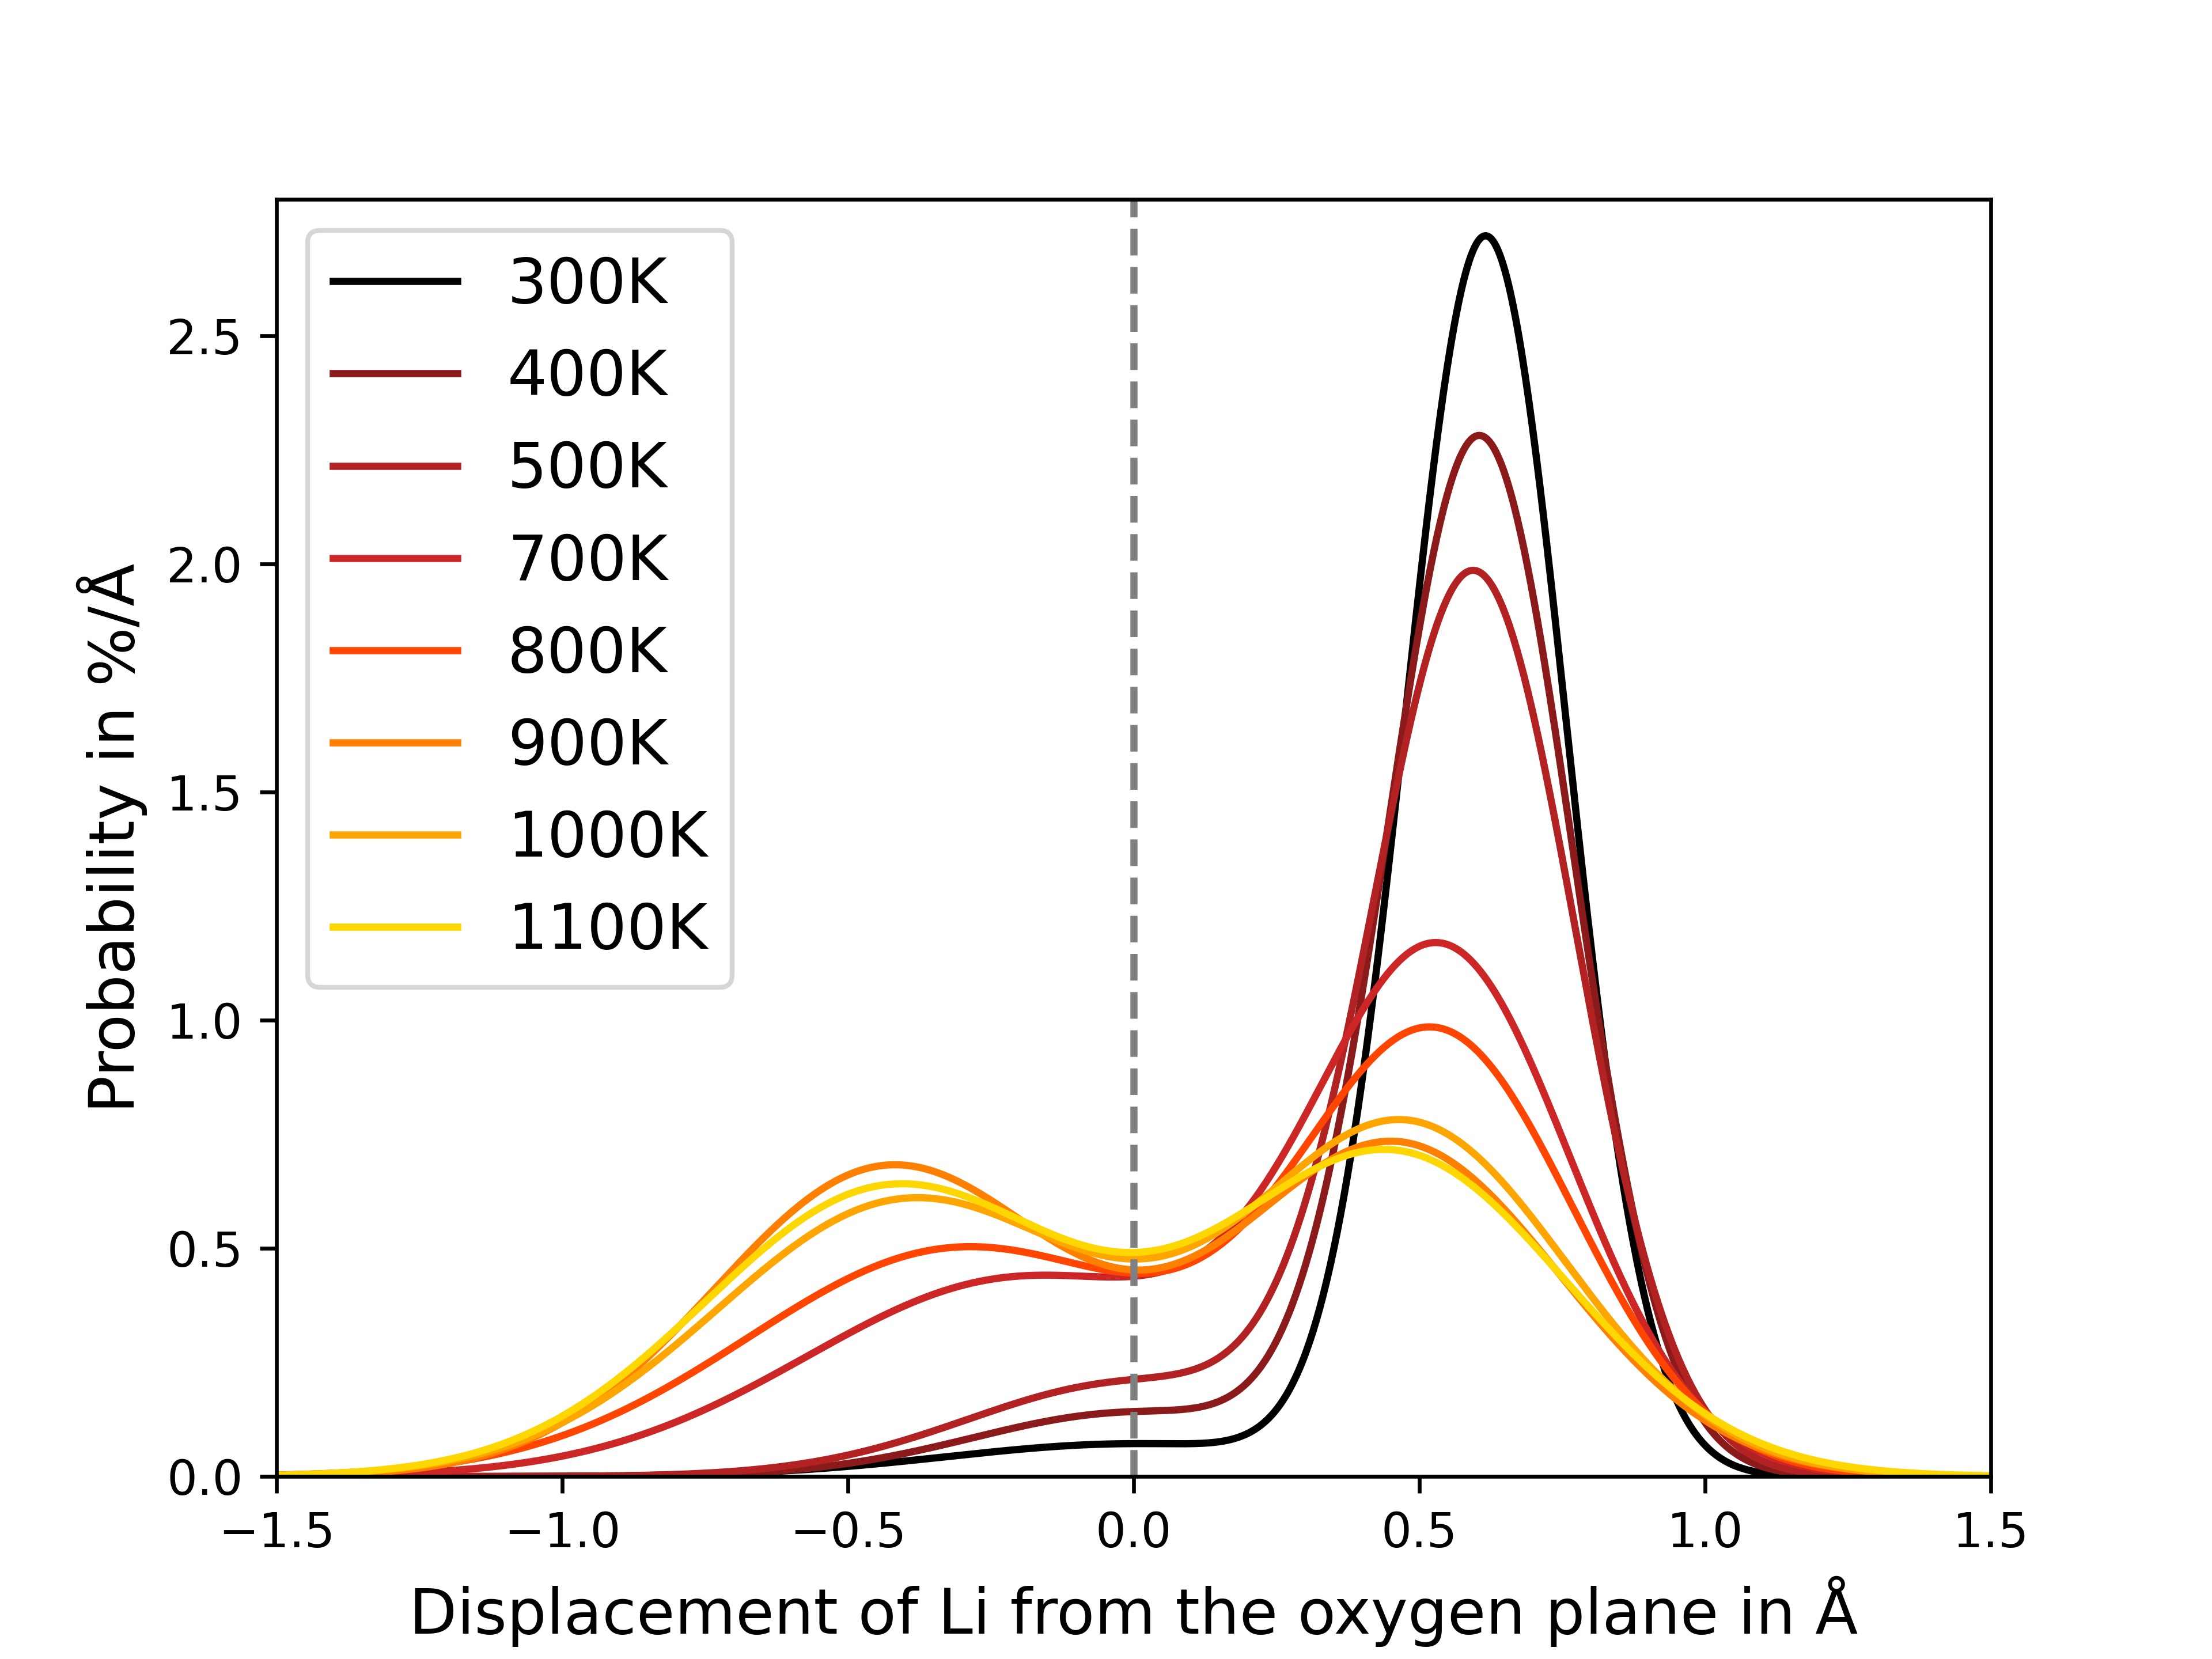
In figure 5 the distributions of Li (lhs) and Ta (rhs) extracted from AIMD runs of LiTaO3 at different temperatures are shown (gaussian fit, the raw data are shown in the SI). The distribution Li and Ta well below (e.g., at 300 K, black curve) are indeed centered at the expected values. The form of the distribution is gaussian, as expected for the thermal broadening of the sharp peak of the ideal, rigid ferroelectric structure. In particular, we observe that the Li probability distribution is unimodal, suggesting that all the Li ions are above the oxygen planes, as expected for the ferroelectric phase.
Figure 5 (rhs) shows the probability distribution of Ta at different temperatures (Gaussian fit). The distribution is unimodal at each investigated temperature, as expected for a displacive transition. With increasing temperature, the distribution broadens, since the atoms vibrate with larger amplitude about the equilibrium positions. Moreover, the distribution smoothly moves toward Ta = 0. This can be interpreted as a consequence of the fact that Ta atoms can move relatively free within the oxygen octahedra, as they do not need to overcome any energy barrier to move from the ferroelectric to the paraelectric configuration.
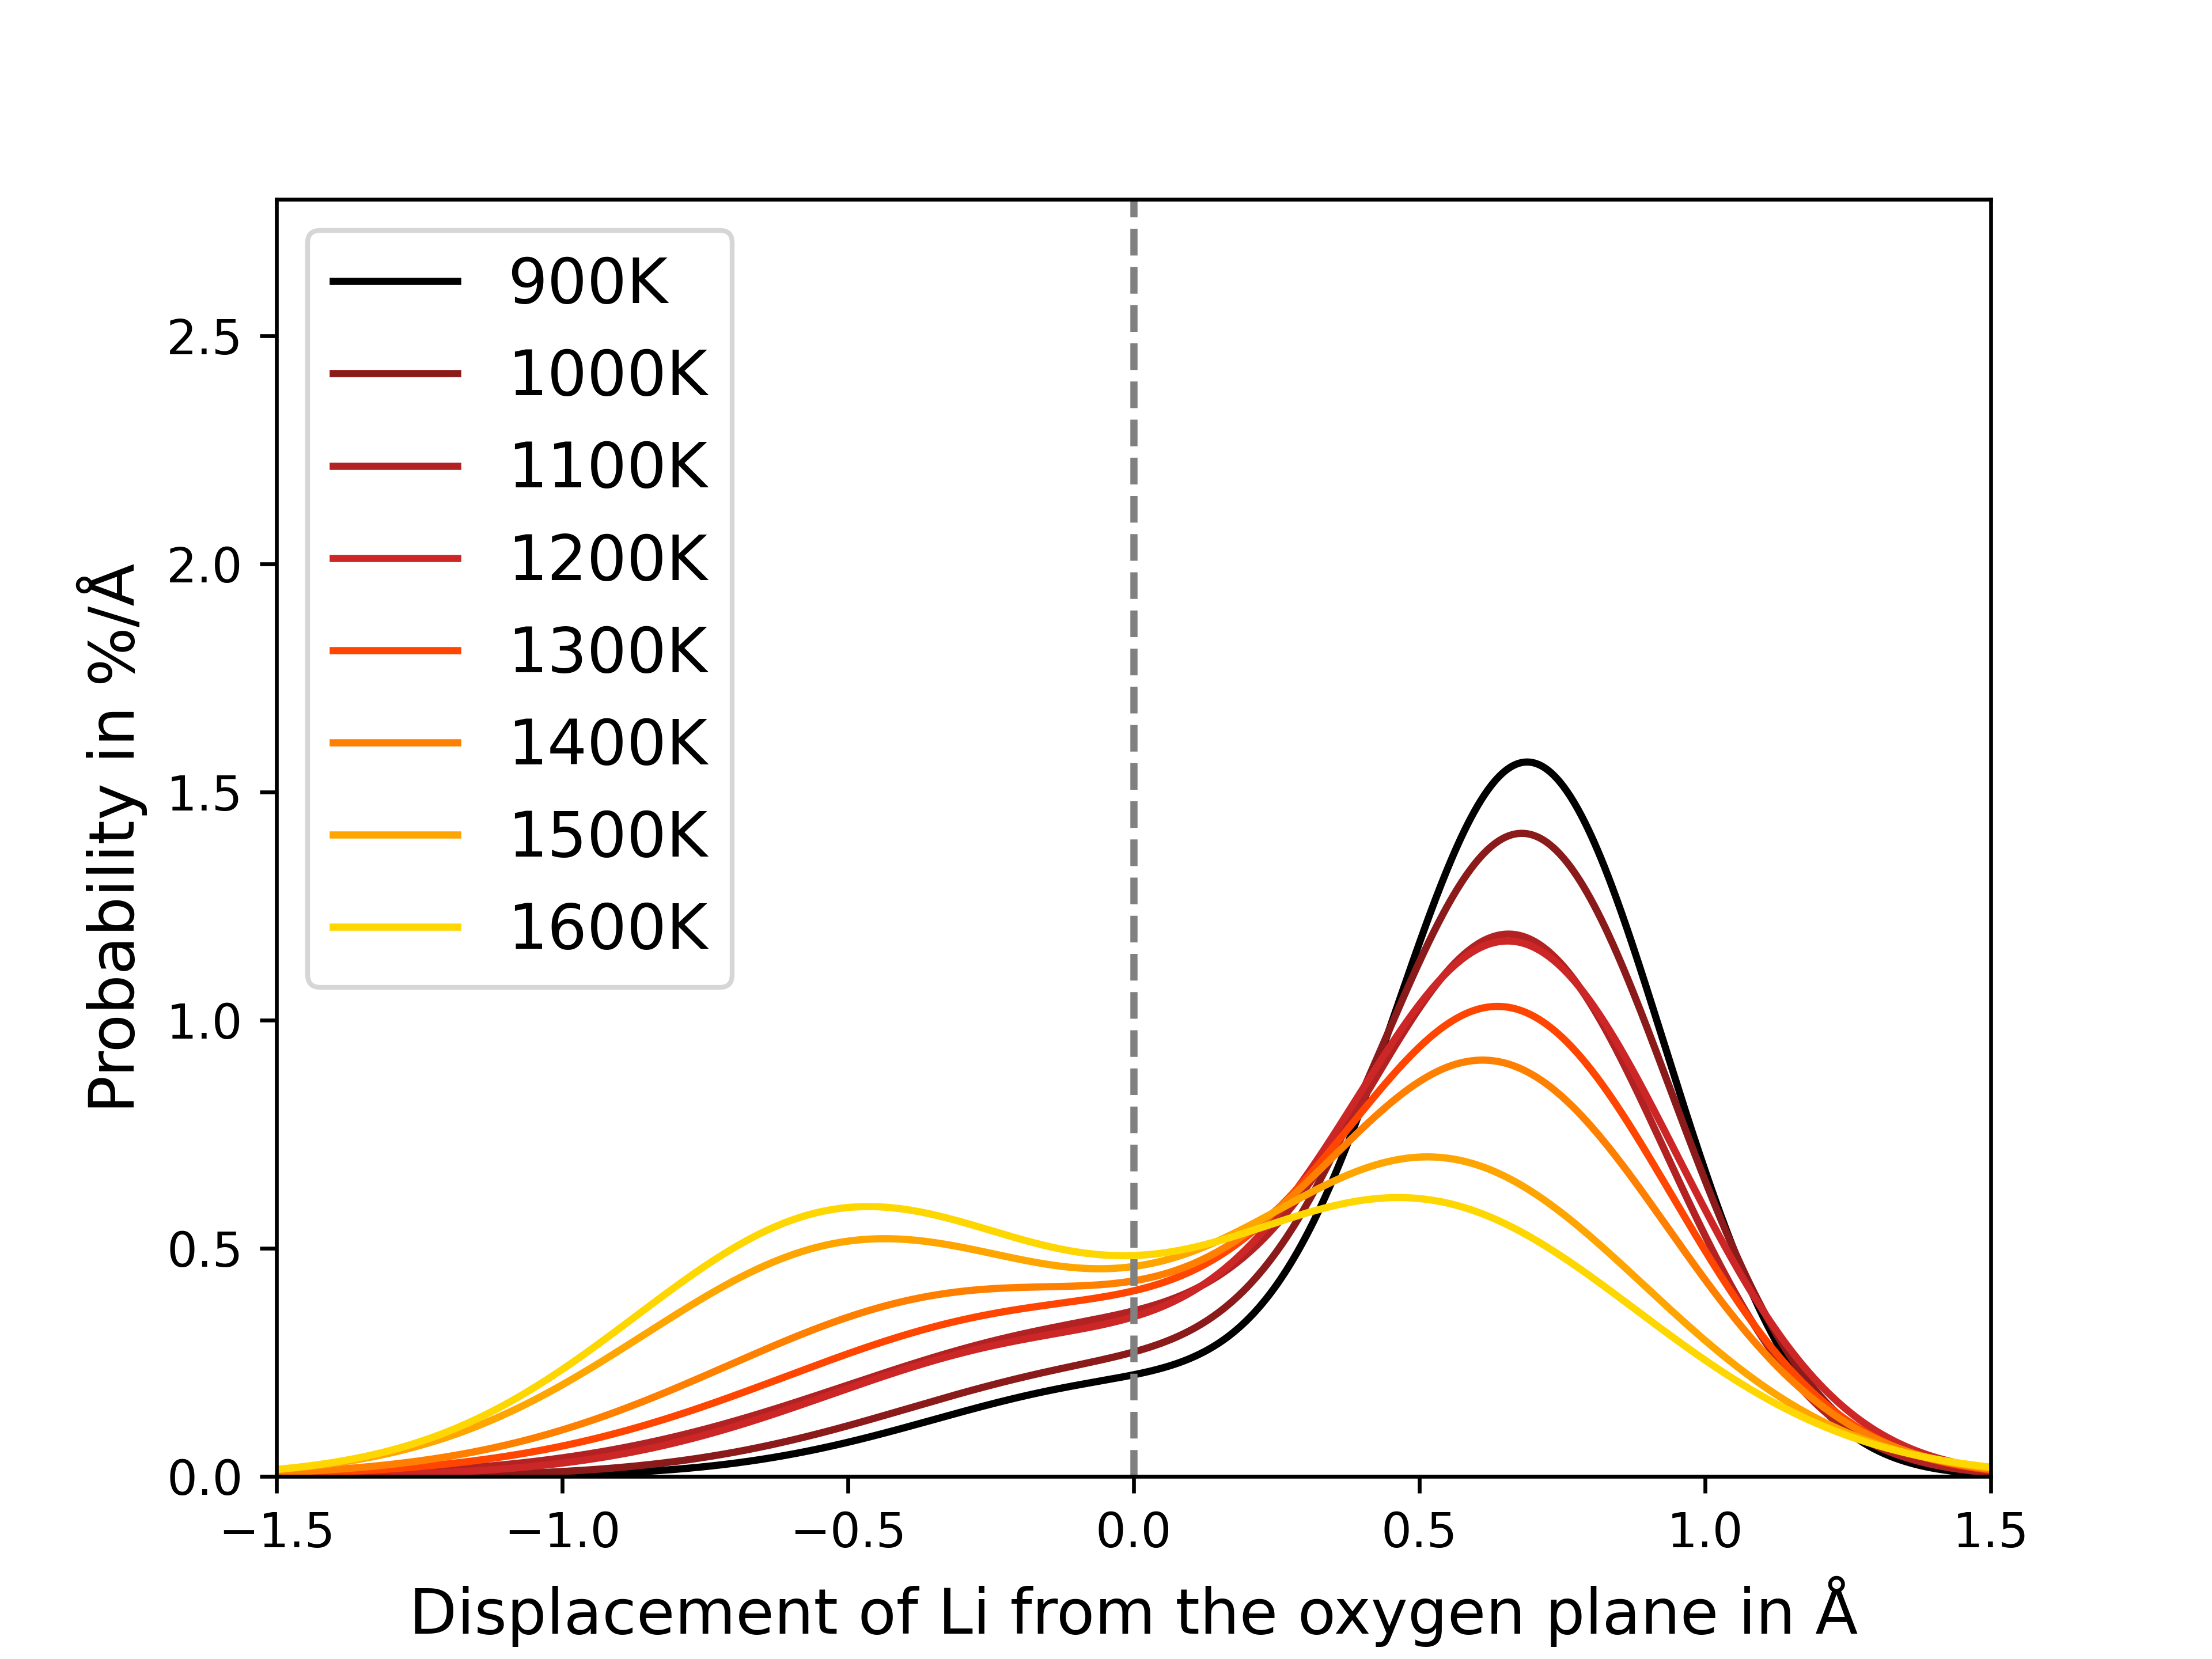
The temperature dependence of the probability distribution of Li, shown in figure 5 (lhs) is in striking contrast with the probability distribution of Ta. With growing temperatures, the distribution does not substantially shift toward Li = 0. Instead, it becomes bimodal. Well above the structural transition, the distribution is symmetric with respect to Li = 0 (oxygen lattice plane), which represents a local minimum. Only a small fraction of the Li atoms lies exactly in the plane, independently from the temperature. While the oxygen plane has been regarded as an energetic barrier (at least for LiNbO3) in the past [12], it can also be stated that when the Li atoms oscillate around Li = 0 their velocity is maximal and their probability to be found at this point is minimal.
The calculated curves shown in figure 5 (lhs) demonstrate that for temperatures well below almost all Li atoms are distributed about the positions they assume in the ferroelectric structure. With increasing temperature a growing fraction of Li atoms possesses enough thermal energy to pass the oxygen plane. Above all Li atoms have sufficient energy to move across the oxygen plane, so that they are distributed roughly with the same probability above or below an oxygen plane. The sum of all Li contributions to the spontaneous polarization vanishes. However, is exactly zero only in average, as each unit cell still has a finite, randomly distributed, dipole moment. This feature is compatible with an order-disorder type structural transition. This is in agrement with a recent X-ray diffraction investigation shwowing that ordering of the disordered Li ion in the polar direction accompanied by deformation of the oxygen octahedra leads to the ferroelectric phase transition [58].
We observe that already at temperatures significantly lower than the probability distributions for both Li and Ta (e.g., already at 700 K) substantially differ from the distributions calculated for low temperatures (e.g., 300 K). This suggests that the phase transition does not occur abruptly at a given temperature, but is rather a continuous process, occurring dynamically over a certain range of temperatures. The width of this temperature range will be explored in the next sections.
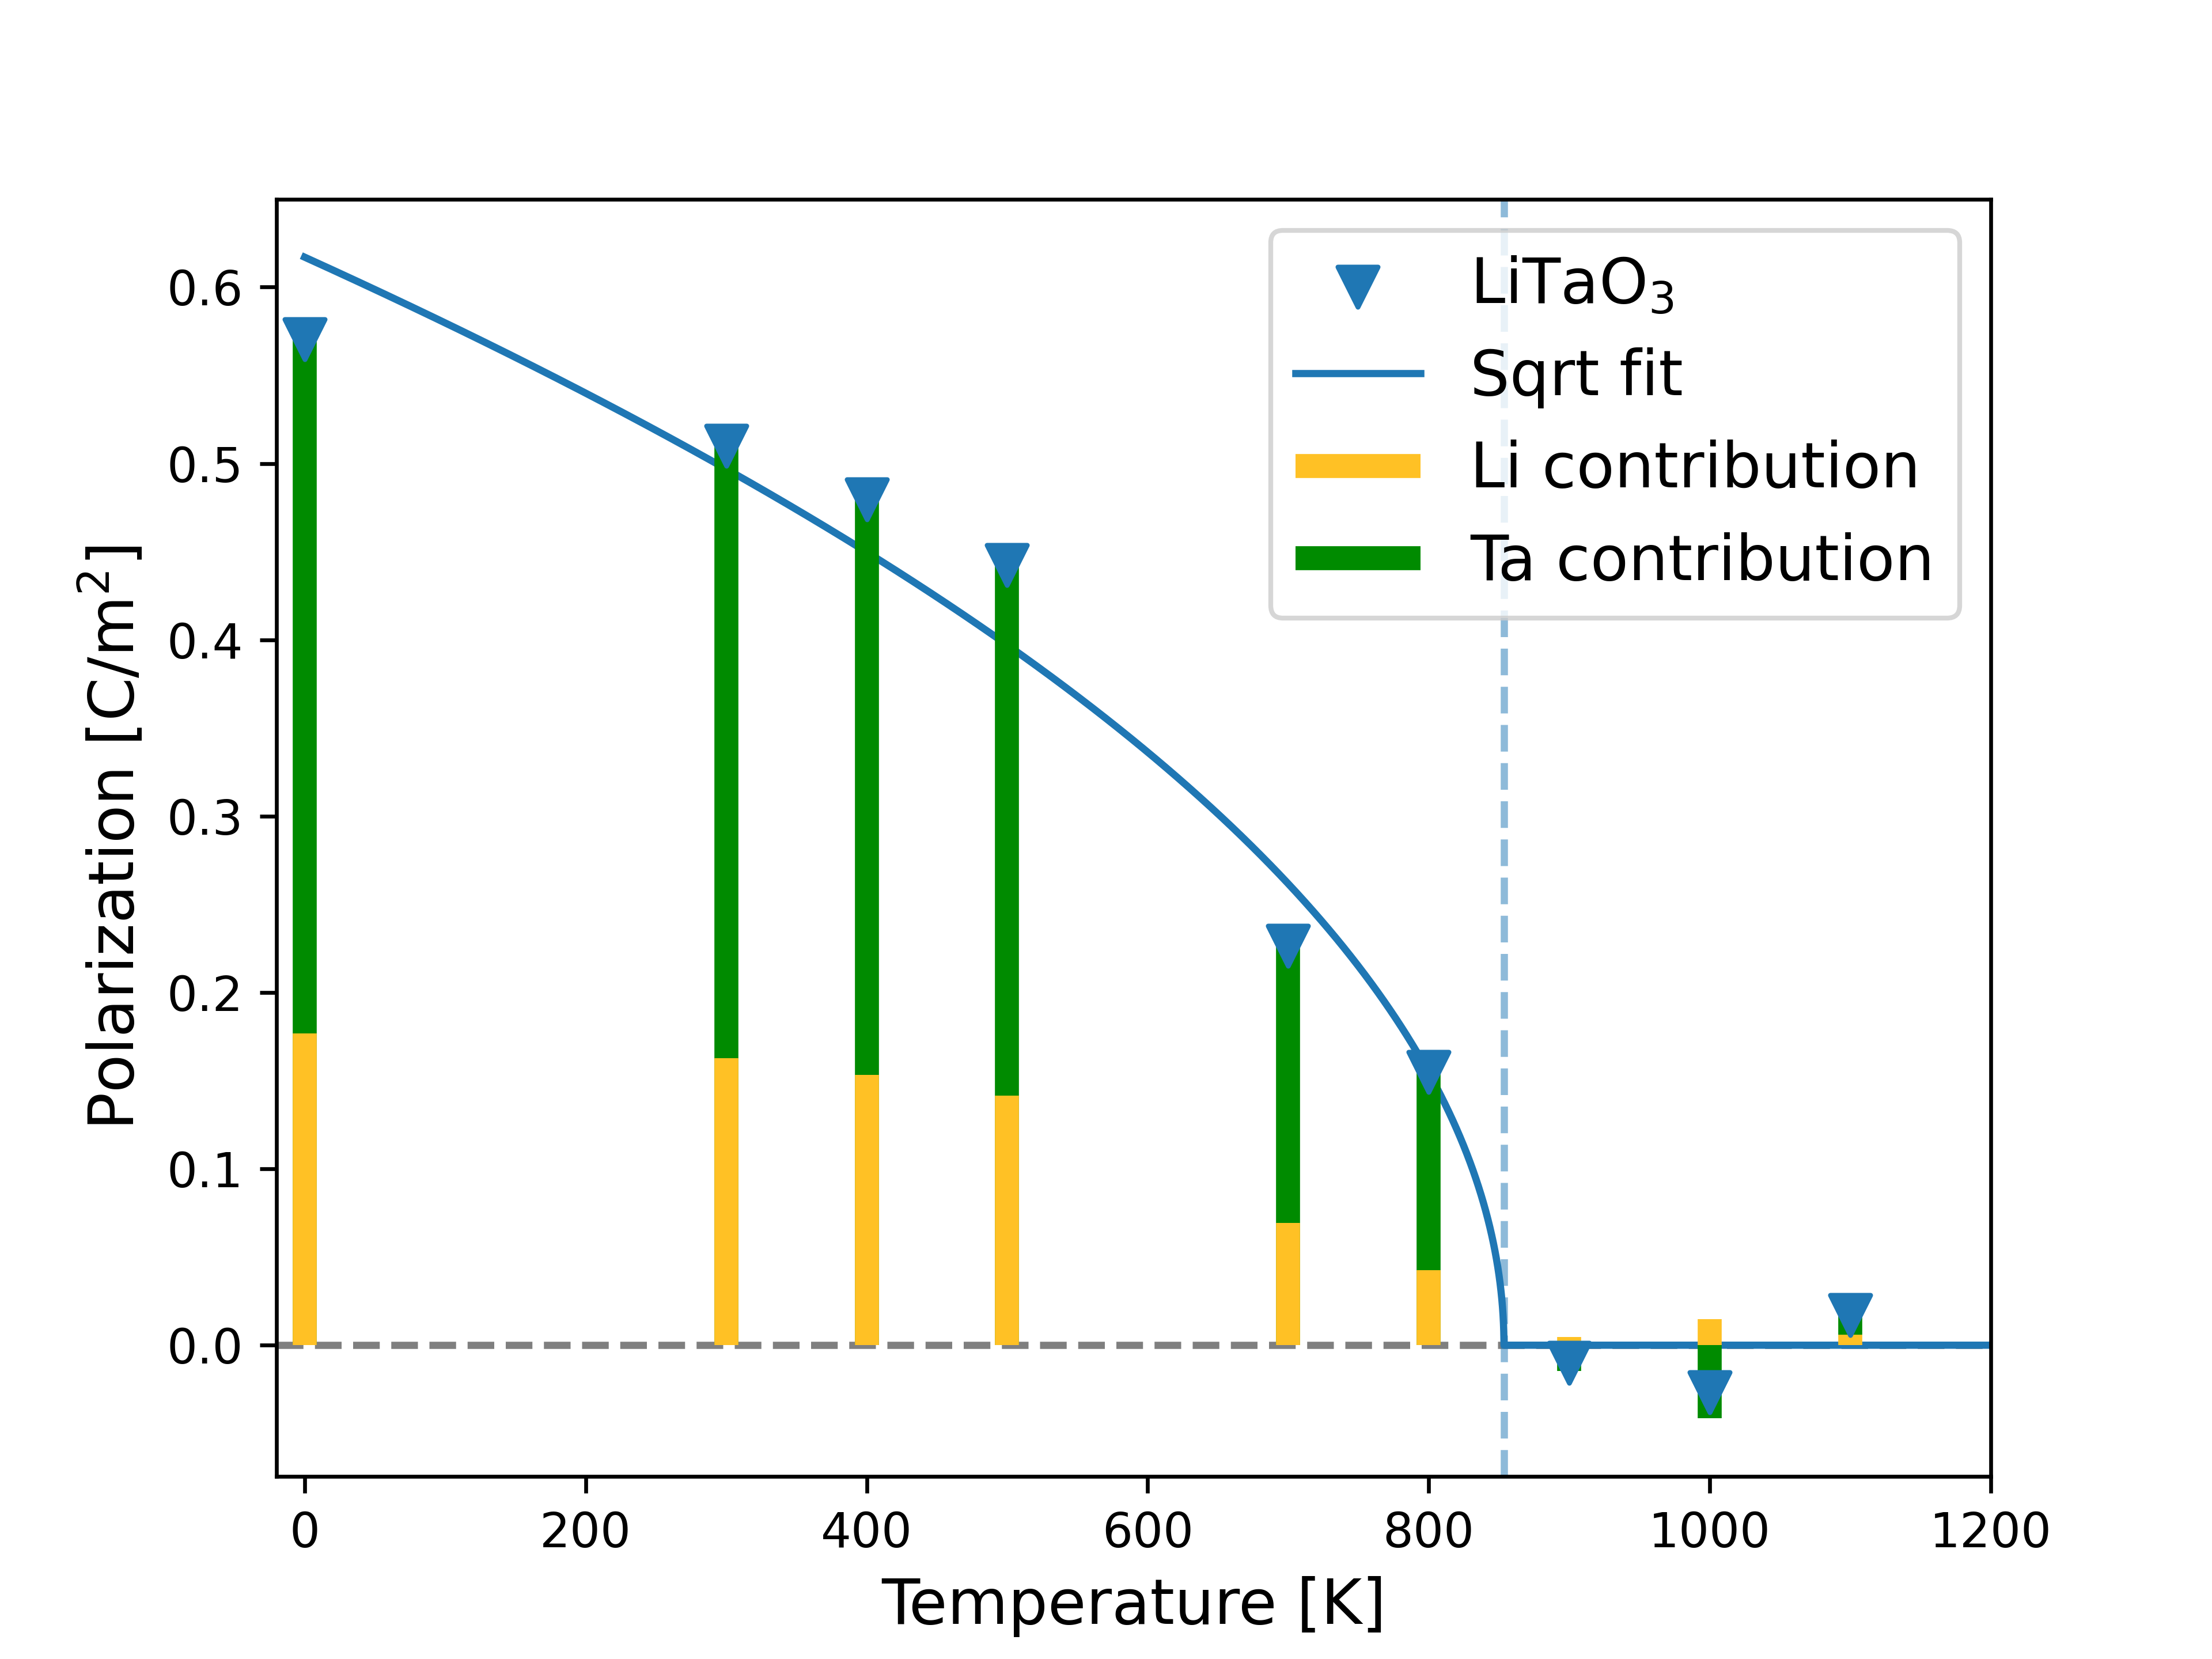
The instantaneous spontaneous polarization can be extrapolated from the AIMD snapshots with the simplified approach explained in the methodological section. The average polarization of LiTaO3 as a function of the temperature is shown in figure 6(a). The calculated data can be fitted by a root function. The critical exponent of the order parameter in a mean field theory such as the Landau-Ginzburg theory is 0.5, however lower exponents are calculated within other approaches. In this work, we chose a square root fit of the spontaneous polarization as a function of the temperature, as expected for a second-order phase transition in the Landau-Ginzburg theory. The square root function equals zero at 841 K. At this temperature, the polarization vanishes and the crystal is in the paraelectric configuration. This value is in excellent agreement with the experimentally determined transition temperature of 873-878 K [59, 8, 60].
The contribution to the polarization of the different species is also shown in figure 6(a). It can be observed that both the Li and Ta contribution are roughly a square root function of the temperature. The Ta atoms, which experience limited shifts but carry a high (nominal) charge of electrons, have a larger contribution to the total polarization than the Li atoms, which undergo larger displacements but carry a much lower (nominal) charge of electrons.
Summarizing, the AIMD calculations reveal that the ferroelectric to paraelectric transition in LiTaO3 is a dynamical process of displacive type in the Ta sublattice and of order-disorder type in the Li sublattice. The square root fit of the spontaneous polarization vanishes at 841 K, which can be considered as the value predicted by AIMD. A similar behavior has been previously proposed for LiNbO3 [11, 12].
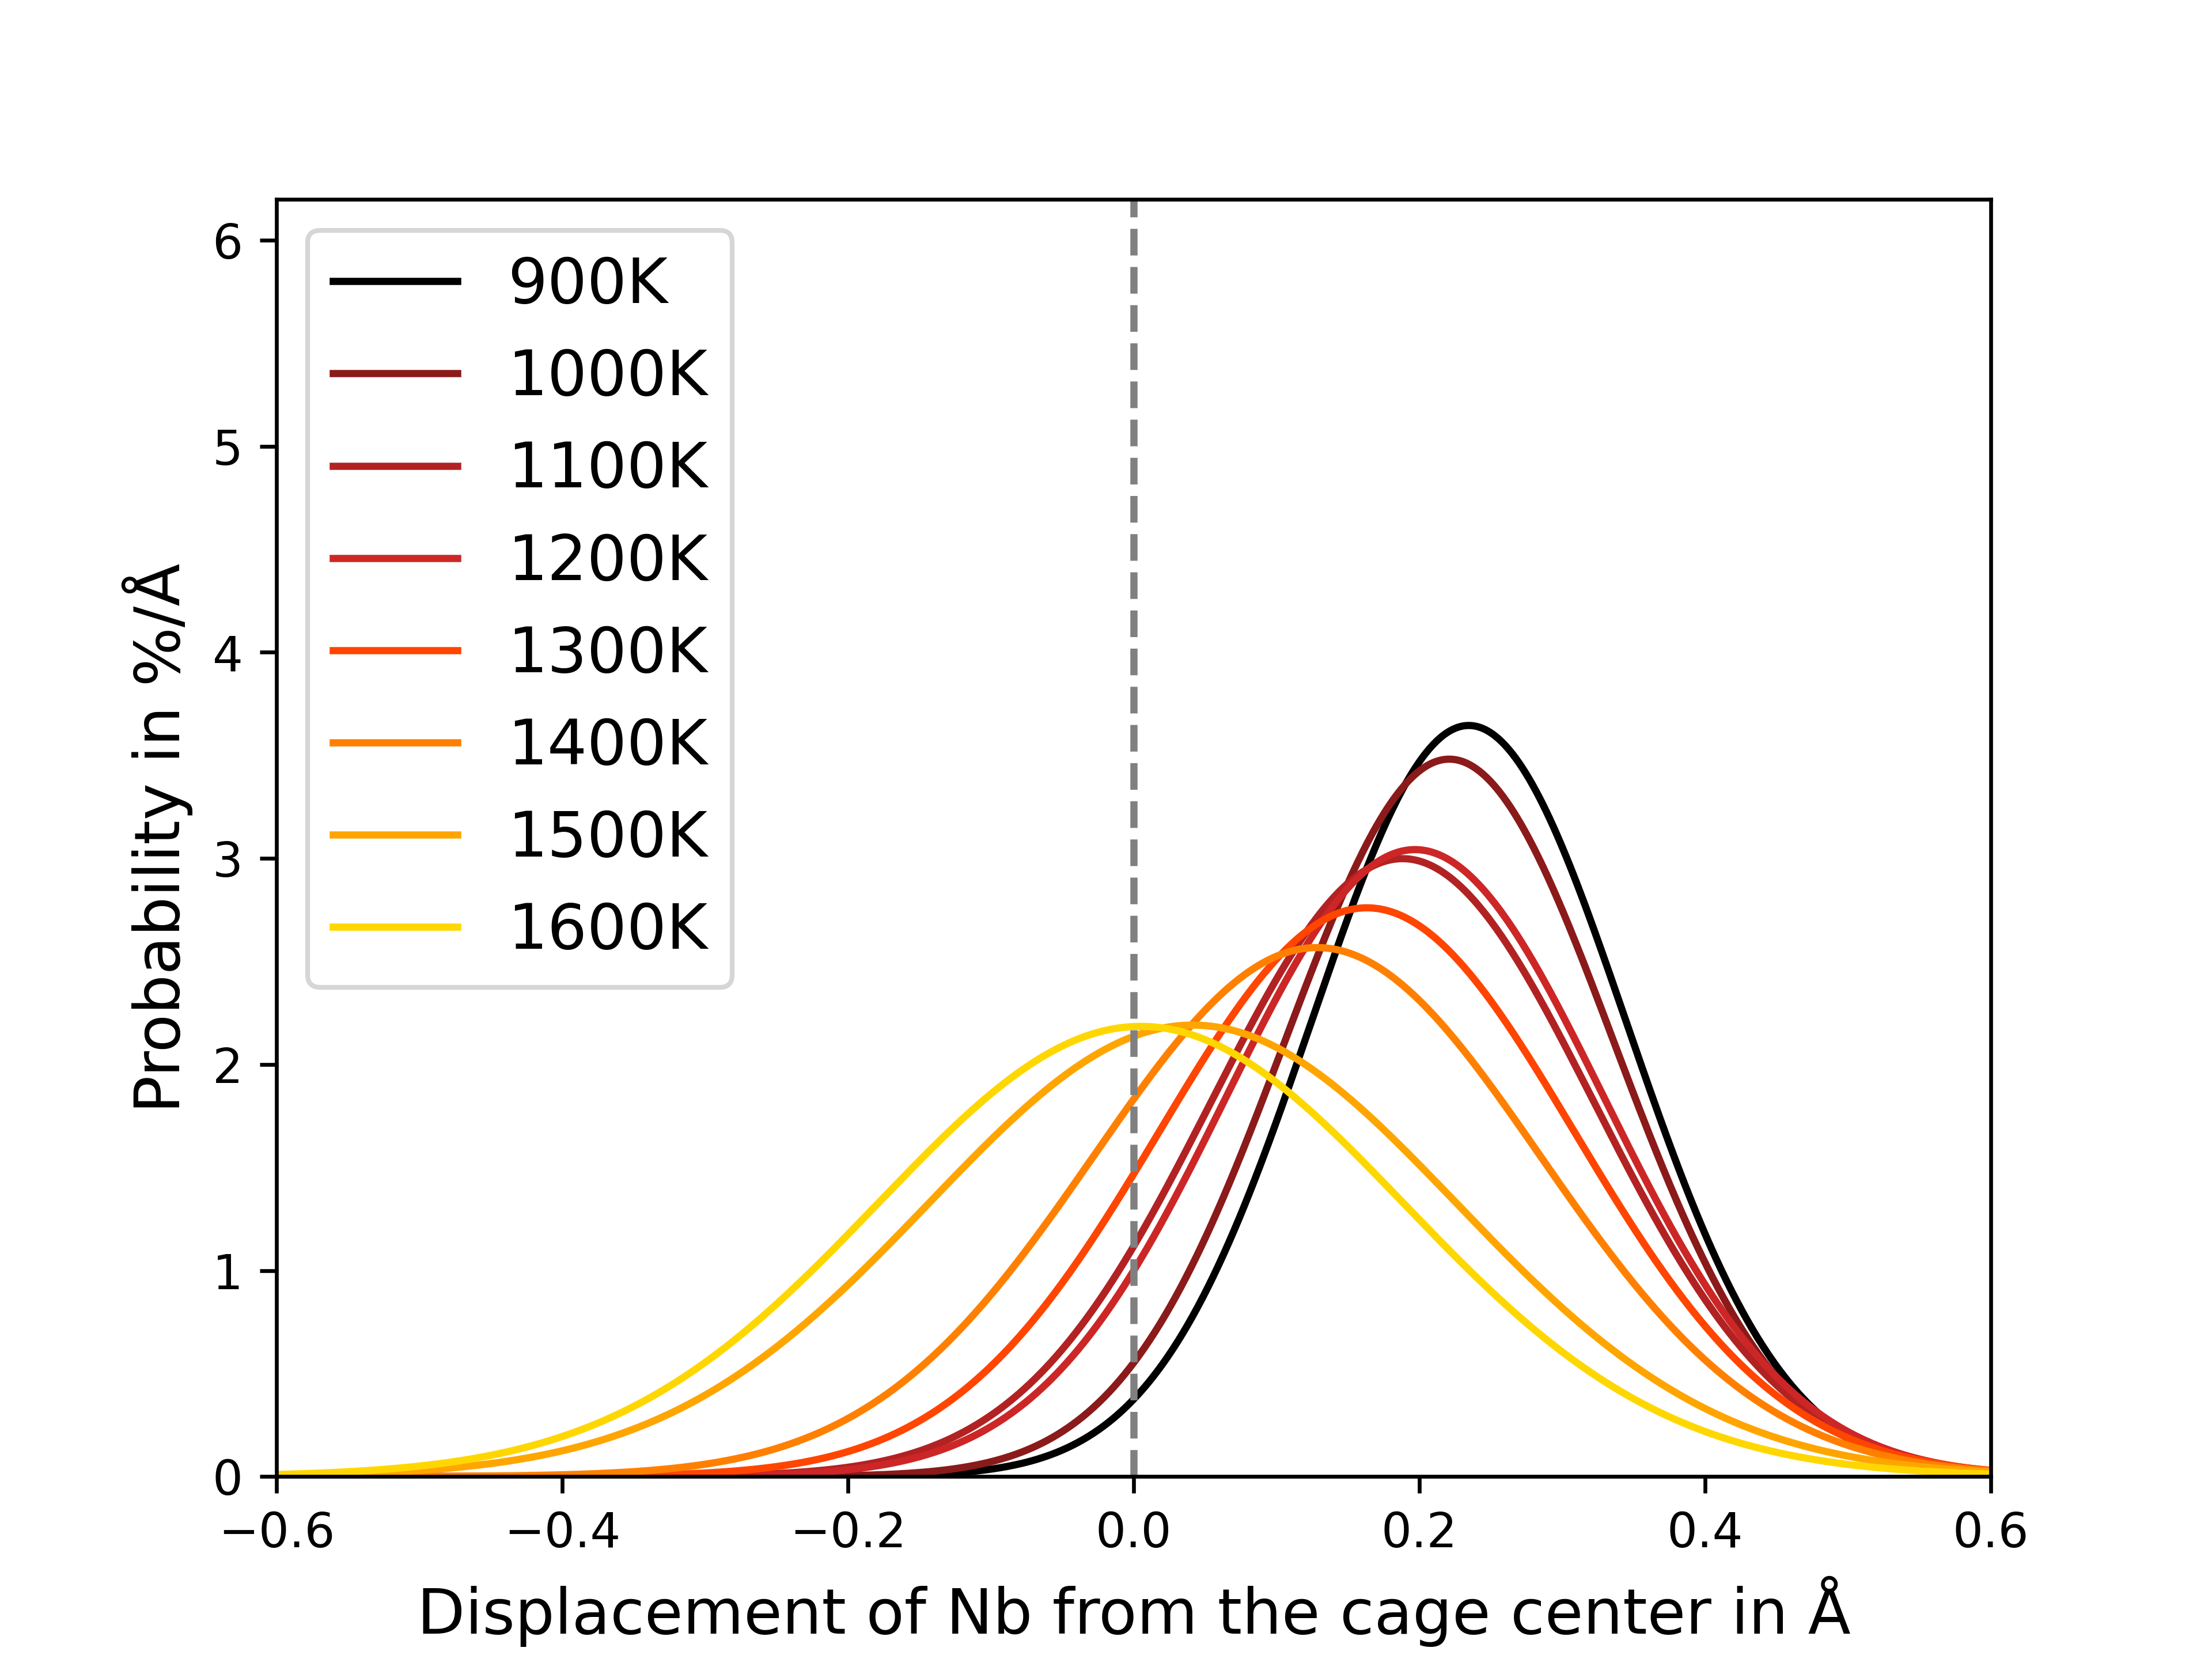
Figure 7 shows the temperature dependent probability distribution for Li and Nb for LiNbO3 extrapolated from the AIMD trajectories. The overall behavior is qualitatively similar to LiTaO3. The distributions can be fitted by one (Nb) or two (Li) gaussian curves, with the distribution Nb unimodal for all investigated temperatures. The distribution of Li is bimodal and again symmetric with respect to the oxygen plane in the paraelectric configuration, and unimodal at low temperatures. As the relevant temperatures in LiNbO3 are higher than in LiTaO3, the gaussian distributions are broader. We point out that caution is due in the interpretation of the displacement distribution at 1600 K in figure 7, as this temperature is beyond the melting point of LiNbO3. Due to known deficiencies of MD in the estimation of the nucleation free energy barrier between the solid and the liquid phases [61], the material is modelled at this temperature as an overheated phase.
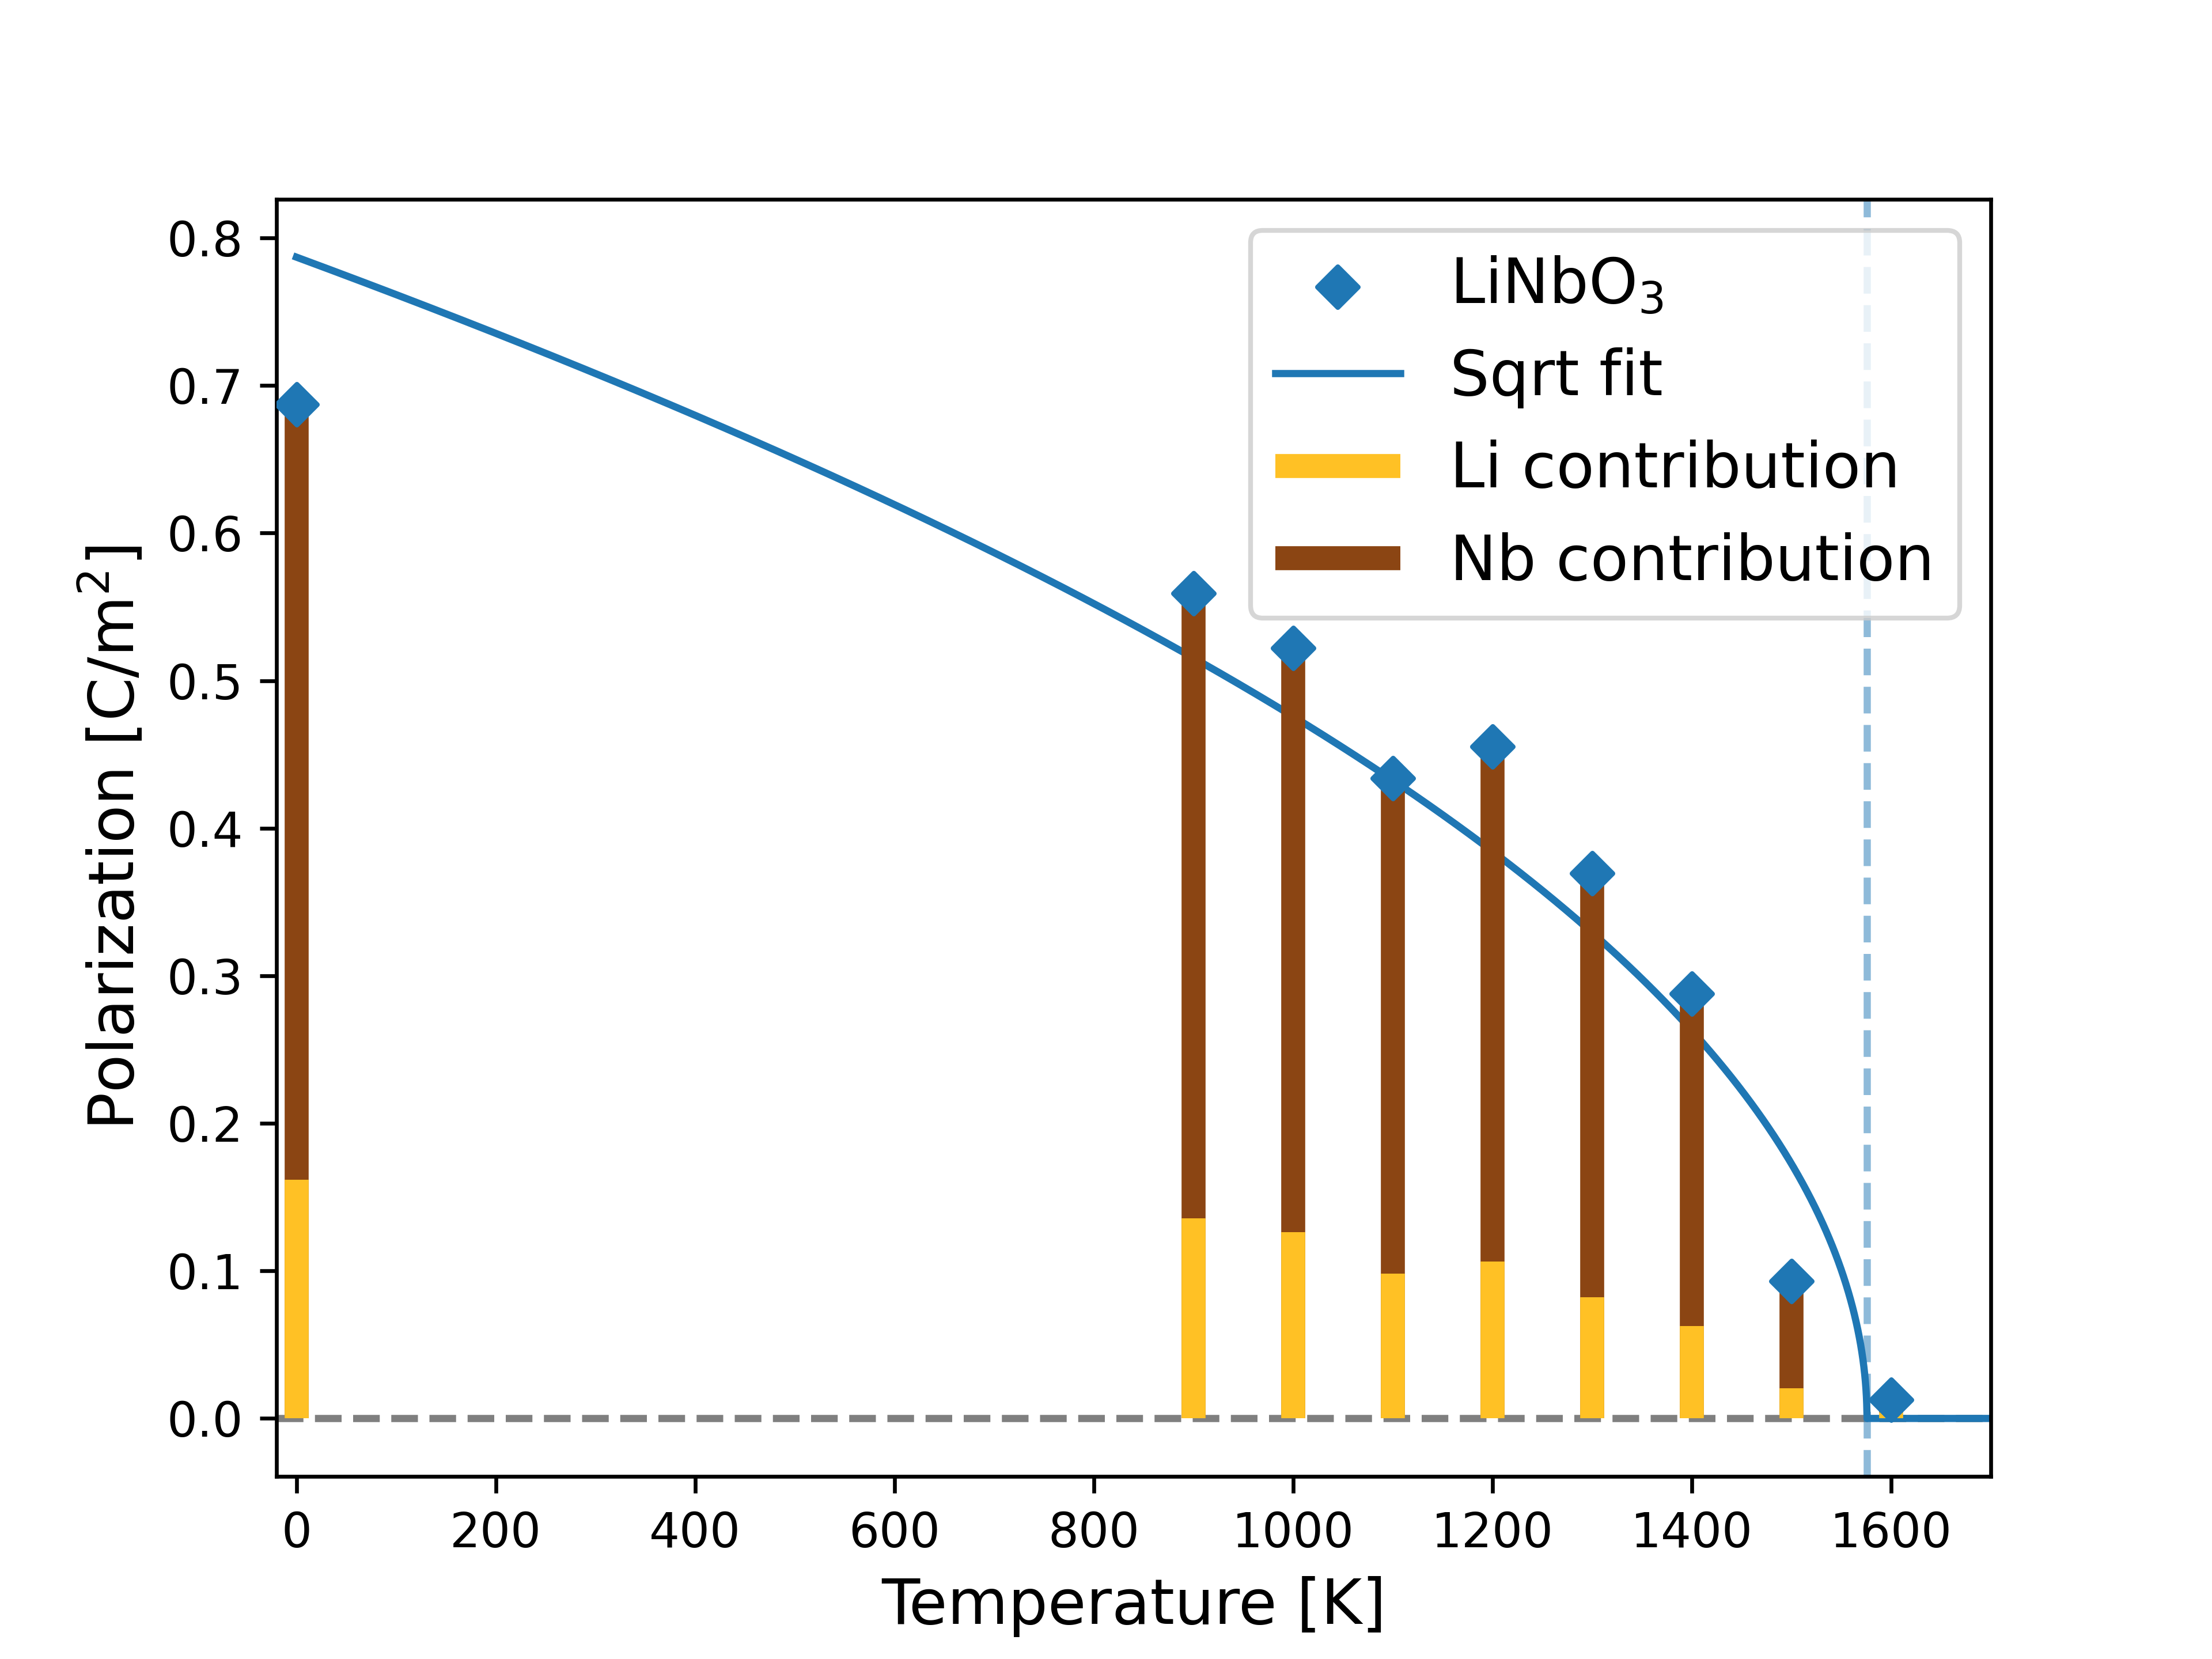
The spontaneous polarization, shown in figure 6(b), is fitted by a square root function which vanishes at 1524 K, which slightly overestimates the experimentally determined transition temperature of 1430-1475 K [59, 7, 60]. Again, the Li sublattice has a smaller contribution to the spontaneous polarization than the Nb sublattice. Considering the thermal expansion is fundamental for a realistic estimate of the transition temperature. A comparison of the values calculated with and without thermal expansion is given in the SI.
Our calculations for LiNbO3 confirm the suggestion first made in [11, 12] that the phase transition is of mixed displacive and order-disorder type, as it involves a displacive transition of the Nb ions within the oxygen octahedra and an order-disorder transition of the Li sublattice. The atomic structure and the spontaneous polarization change gradually between the ferroelectric and paraelectric phase, so that the transition does not occur abruptly at a well defined temperature but rather over a temperature range of several 100 K, which will be further investigated later.
III.3 Effect of Mg doping on the transition temperature
In a final step, we investigated how Mg doping affects the Curie temperature of LiNbO3. Mg is the chief dopant for LiNbO3, if the optical damage resistance has to be enhanced. Indeed, a concentration of Mg exceeding a so called threshold of about 5 mol% leads to a reduction of the optical damage of more than two orders of magnitude [6]. The mechanism leading to the optical resistance is quite indirect. The Mg incorporation leads to the formation of Mg substitutionals [62], which inhibit the formation of Nb antisites (small bound polarons) that are crucial for the photorefractivity. In LiTaO3, doping with Mg lowers the photorefraction as well [63], however, we limit our investigation to LiNbO3.
Whether Mg increases or decreases depends on the sample composition (nearly stoichiometric or congruent) and on the Mg concentration [64]. In our models, we consider a number of Mg substitutionals in stoichiometric LN which corresponds to 5.56 mol.%. This is a typical doping concentration of the LN samples used, e.g., for the fabrication of optical waveguides. As no experimental evidence of Mg clustering in LN is available, we assume a homogeneous distribution.
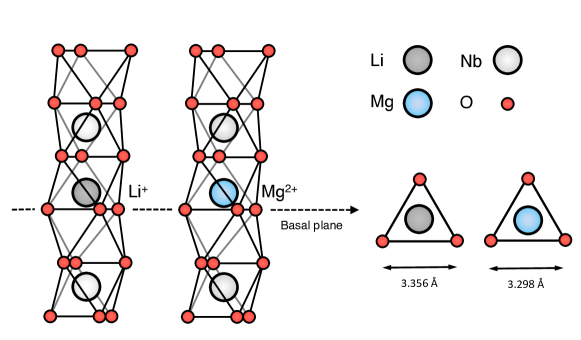
The position of Li+ and Mg2+ within the oxygen octahedra is different. Although the distance to the three oxygen ions below them is roughly the same (2.013 Å and 2.022 Å for Li+ and Mg2+, respectively), the distance to the three oxygen ions above them is much shorter for Mg2+ (2.172 Å) than for Li+ (2.291 Å). Thus, the oxygen octahedra occupied by the Mg substitutional is more contracted than the octahedron occupied by a regular Li+ ion. The contraction is also visible in the oxygen-oxygen interatomic distance, which is much shorter in the Mg2+ octahedron (3.298 Å vs 3.356 Å), as shown in Figure 8. In this configuration, Mg doping does not induce localized defect states in the LiNbO3 bandgap. The calculated band structure of Mg doped LiNbO3 is shown in the SI.
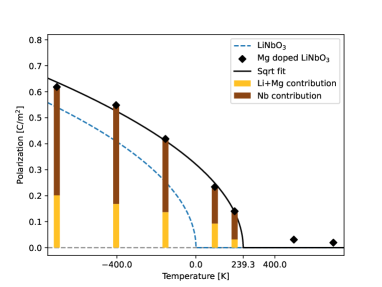
The AIMD runs of supercells containing Mg show the same qualitative trend as the supercells modelling the undoped material. The probability distributions of Li and Nb have a similar form and temperature dependence as in the case of the undoped crystals, however, they are shifted to higher temperatures. Correspondingly, the spontaneous polarization vanishes at temperatures of about 240 K higher, as shown in Figure 9. This value, which must be considered as a rough estimate, is in qualitative agreement with the experimental observation. For a doping of 1.2 atom %, a Curie temperature of 1493 ∘C is measured [65], which is 80 K higher than the value of 1413 ∘C measured for the undoped samples [7].
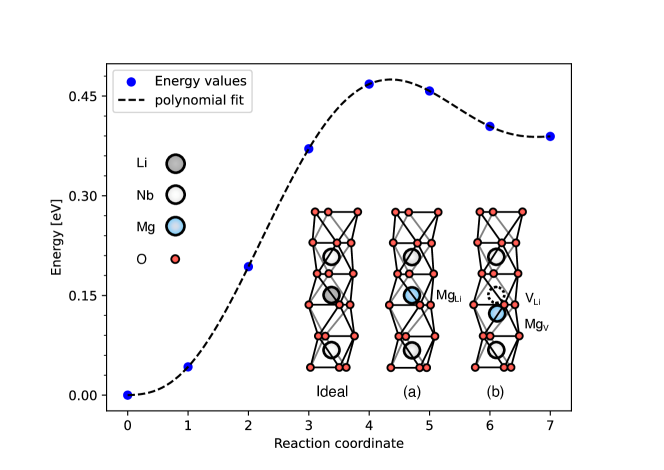
This effect can be explained by different factors. The Mg ions pin the polarization locally, as they require more energy than Li ions to pass the oxygen layer. The minimum energy path for the migration of the Mg substitutional to the empty octahedron interstitial position has been calculated by the NEB method, considering 6 images between start and end configuration. Start and end configuration are shown in the inset of Figure 10.
The calculated energy barrier of 0.47 eV is roughly an order of magnitude higher than the barrier that we calculate, e.g., for a similar migration path of Li in hydrogenated LiNbO3. The reason for such a striking difference of the barrier heights cannot be merely geometric, as Mg and Li have nearly identical ionic radii (0.90 Å for Li+ and 0.86 Å for Mg2+ in octahedral coordination [66]). However, the position of the two ions within the oxygen octahedra is different. In particular, the oxygen octahedra occupied by the Mg substitutional is more contracted than the octahedron occupied by a regular Li+ ion, probably due to the larger Coulomb attraction between the cation and the anions. Thus, the oxygen ions in the basal plane that has to be crossed during the phase transion build a tighter mesh for Mg2+ (O-O distance 3.298 Å) than for Li2+ (O-O distance 3.356 Å), as shown in Figure 8. We thus suggest that on the one hand a larger deformation of the oxygen octahedra, and on the other hand a stronger Mg-O bond than the Li-O bond, both contribute to locally pin the polarization and thus the ferroelectric phase.
III.4 Comparison with experimental results
Although the calculated Curie temperatures reasonably match the experimental data, it becomes clear from the AIMD that the atomic positions start to shift at temperatures well below . An interval of about 100 K and 300 K for LiTaO3 and LiNbO3, respectively, can be identified, in which the largest part of the structural modifications occur.
In order to define more closely this interval, we compare the calculated value of the spontaneous polarization as well as the octahedra occupation with physical quantities that can be observed experimentally by characterizing the crystals across the phase transition. In the following, we start our discussion with LiTaO3, which is easier to characterize experimentally due to the lower .
To characterize the phase transition, we define the occupation of the regular Li octahedra as a reaction coordinate. In the ferroelectric phase and at very low temperatures, the occupation of the regular Li octahedra is roughly 100%. For increasing temperature, the Li atoms may possess enough thermal energy to overcome the energy barrier represented by the oxygen plane and migrate into the vacant oxygen octahedra (see, e.g., figure 4). In the paraelectric phase, the Li atoms jump continuously between the Li octahedra and the vacant octahedra, resulting in an occupation of 50% of the regular Li octahedra. The occupation of the regular Li octahedra is shown in figure 11 (black triangles). The solid line is a fit of the calculated data by a sigmoid function (fits with other functions are possible as well) which only serves as a guide to the eye.
The interval at which the occupation of the Li octahedra changes from 100% to 50% is an estimate of the temperature interval at which the phase transition occurs. In the case of LT, the width of this interval is roughly 100 K.
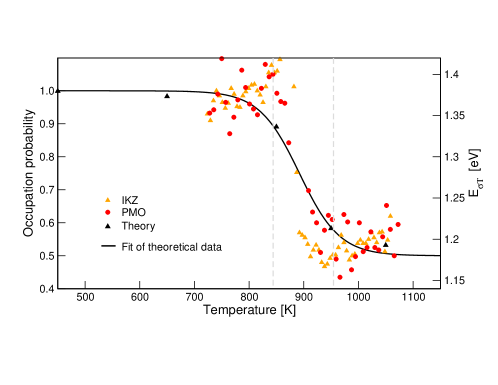
It is known that the electrical conductivity of LT changes at the transition from the ferroelectric to the paraelectric phase, at which the measured activation energy decreases from a value of 1.38 eV to 1.19 eV [2]. Accurate experiments have been performed on different PMO samples (see experimental details) to explore the temperature range around and establish whether the octahedra occupation correlates with the crystal conductivity. The corresponding measurements are shown in figure 11. The temperature interval at which the slope varies from 1.38 eV to 1.19 eV roughly corresponds to the theoretically predicted range, confirming that the phase transition is a continuous process extending over a larger temperature interval. The comparison between calculated and measured data also shows a correlation between octahedra occupation and conductivity. The analysis of this correlation is, however, beyond the scope of this manuscript and is discussed elsewhere [59]. Although the measurement clearly show that the conductivity starts to change well below the Curie temperature, the scattering of the measured data (due to the calculation of the derivative of the conductivity) does not allow a more precise estimate of the interval width at which the transformation occurs.
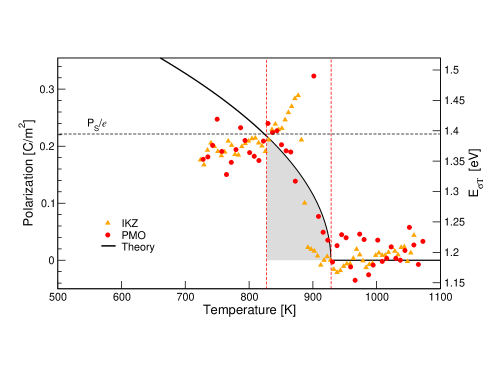
For that reason, we correlate the measured conductivity with the spontaneous polarization as a function of the temperature, as shown in figure 12. Indeed, the order parameter has at least a well defined point at which it vanishes, namely , which can be considered the end of the temperature interval at which the transition occurs. The starting point can be arbitrarily chosen to be the point at which the order parameter has grown to a factor of the 0 K value. This region is marked in gray in figure 12 and corresponds to about 100 K. Interestingly, the conductivity jumps roughly in this temperature range from the value of the paraelectric to the value of the ferroelectric phase. This confirms, again, that the geometry modification starts to affect the material properties below .
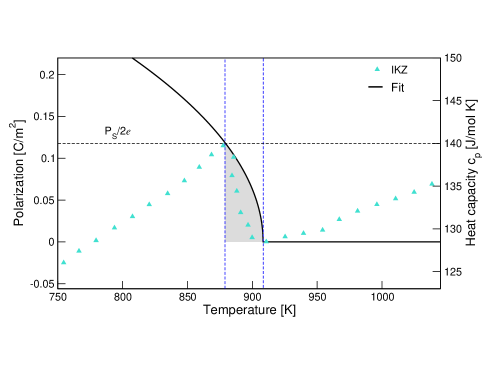
Another thermodynamical quantity which is expected to be affected by the phase transition is the heat capacity. As the ferroelectric and the paraelectric phase have different symmetry, also the phonon population is different and with it the capacity of the material to store energy. In order to verify in which temperature range the thermal capacity of LiTaO3 jumps from the value measured for the ferroelectric phase to the value measured for the paraelectric phase, calorimetry experiments have been performed. The corresponding measurements are shown in figure 13 and again compared with the theoretically predicted order parameter. The jump of takes place in a temperature range which is narrower than the range at which the octahedra occupation or the conductivity changes. The involved temperature range corresponds to the interval at which the spontaneous polarization grows from zero to a value roughly smaller than the 0 K value. Thus, although the measurements corroborate the hypothesis that the structural transition is a continuous process affecting the materials properties already below , the temperature interval depends on how the microscopic structure affects the measured quantity.
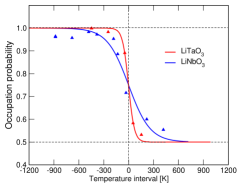
A comparison of the experimental data from transport and calorimetry measurements with the theoretically predicted temperature dependent order parameter (e.g., the spontaneous polarization) can be found in the SI. Also in the case of LiNbO3 it becomes evident that similarly to LiTaO3 the atomic displacements have an influence on the conductivity and on the heat capacity below . Again, the temperature interval depends on the investigated property. Finally, the octahedra occupation of LiTaO3 and LiNbO3 as a function of temperature is compared. It might be supposed that the energy needed from the Li atoms to pass the oxygen plane is of the same order of magnitude in the two compounds. It is therefore reasonable to assume that the Li ions begin their migration at similar temperatures in the two crystals. However, as the Curie temperature of LN is much higher than the Curie temperature of LT, it is expected that the structural transition in LN occurs in a somewhat larger temperature interval. The AIMD trajectories confirm this hypothesis. Figure 14 shows the occupation of the Li octahedra for the two compounds. While in LT the occupation sinks from 100% to 50% within 100 K, in LN the same occurs within a substantially larger temperature range of about 300 K.
Finally, we remark that, besides doping, also the intrinsic defect structure will affect the ferroelectric phase transition in LiNbO3 and LiTaO3. In LiNbO3, specific structural defects are known, that are likely to be formed [67, 68]. In particular, a NbLi antisite that is charge compensated by four Li vacancies (Li vacancy model) is currently assumed to be the dominant defect cluster. In LiTaO3, the defect structure is more complex, yet a Ta at an interstitial position and charge compensated by five Li vacancies has been identified as an energetic favorable structure [69]. The dipole moments associated with the defect clusters will locally affect the materials properties and locally pin the polarization. The diffusivity of the lithium vacancies is low at room temperature, which indicates that the defect complexes are rather stable. Even at high temperatures, although the Li vacancies become very mobile [70], the reported cohesive energy of above 4 eV of the clusters [67] suggests that the clusters may still affect the transition temperature by locally pinning the crystal structure. The local pinning will result in an extension of the temperature range of the transition temperature. A quantitative analysis of this effect is beyond the goals of this investigation.
IV Summary and outlook
The ferroelectric to paraelectric phase transition in LiTaO3 and LiNbO3 has been investigated theoretically and experimentally. First principle calculations in the framework of the SSCHA formalism predict a transition temperature of 808 K and 1408 K, for LiTaO3 and LiNbO3, respectively, which are in rather good agreement with the measured values. AIMD calculations give insight into the mechansims of the phase transition. The latter is a complex process, in which Li and Nb/Ta behave differently. The Li sublattice undergoes an order-disorder structural transition, while the Nb/Ta-sublattice undergoes a displacive type transition. For both LiTaO3 and LiNbO3, substantial atomic displacements are predicted for temperatures smaller than . From an atomistic perspective, we interpret the transition as a structural modification, whose magnitude is a function of the temperature and which results in a non-vanishing polarization at . Starting from the transition temperature and moving towards lower temperatures, the polarization continuously grows. On top of this structural modification, the presence of structural defects and defect clusters will affect the atomic movement.
The structural modifications are detectable, to a certain extent, in transport and calorimetry experiments. Experimental measurements of the conductivity of both LT and LN demonstrate signatures of the structural modifications well below , while the heat capacity is modified in a narrower interval, instead.
Finally, the Curie temperature of LN is found to be raised by Mg doping. MgLi substitutionals are found to locally pin the ferroelectric polarization, thus acting against thermal disorder. The presented AIMD calculations allow to investigate how dopants influence the Curie temperature of the samples and can be applied to other common dopants such as Ti, Fe, or Ni.
Another field in which a similar approach is expected to be of large benefit concerns the study of LNT solid solutions. The solid solutions, grown specifically to combine the optical and acoustic properties of LN with the thermal stability of LT, represent a rather new field of research, for which the characterization of the thermal behavior will be of crucial relevance.
Acknowledgements.
We gratefully acknowledge financial support by the Deutsche Forschungsgemeinschaft (DFG) through the research group FOR5044 (Grant No. 426703838 [71], SA1948/3-1, SU1261/1-1, SCHM 1569/39-1, FR1301/42-1). Calculations for this research were conducted on the Lichtenberg high-performance computer of the TU Darmstadt and at the Höchstleistungrechenzentrum Stuttgart (HLRS). The authors furthermore acknowledge the computational resources provided by the HPC Core Facility and the HRZ of the Justus-Liebig-Universität Gießen.References
- Weis and Gaylord [1985] R. S. Weis and T. K. Gaylord, Lithium niobate: Summary of physical properties and crystal structure, Applied Physics A 37, 191 (1985).
- Yakhnevych et al. [2024] U. Yakhnevych, F. El Azzouzi, F. Bernhardt, C. Kofahl, Y. Suhak, S. Sanna, K.-D. Becker, H. Schmidt, and H. Ganschow, Steffen Fritze, Oxygen partial pressure and temperature dependent electrical conductivity of lithium- niobate-tantalate solid solutions, Solid State Ionics (2024), submitted.
- Lee et al. [2003] T.-C. Lee, J.-T. Lee, M. A. Robert, S. Wang, and T. A. Rabson, Surface acoustic wave applications of lithium niobate thin films, Applied Physics Letters 82, 191 (2003).
- Sanna and Schmidt [2017] S. Sanna and W. G. Schmidt, surfaces from a microscopic perspective, Journal of Physics: Condensed Matter 29, 413001 (2017).
- Räuber [1978] A. Räuber, Chemistry and physics of lithium niobate, Current Topics in Materials Science, Vol. 1 (Elsevier Science Publishing, Amsterdam, 1978).
- Volk and Wöhlecke [2009] T. Volk and M. Wöhlecke, Lithium Niobate, Defects, Photorefraction and Ferroelectric Switching, Springer Series in Materials Science, Vol. 115 (Springer, Berlin Heidelberg, 2009).
- Chen et al. [2001] Y.-L. Chen, J.-J. Xu, X.-J. Chen, Y.-F. Kong, and G.-Y. Zhang, Domain reversion process in near-stoichiometric LiNbO3 crystals, Optics Communications 188, 359 (2001).
- Kitamura et al. [1998] K. Kitamura, Y. Furukawa, K. Niwa, V. Gopalan, and T. E. Mitchell, Crystal growth and low coercive field 180° domain switching characteristics of stoichiometric LiTaO3, Applied Physics Letters 73, 3073 (1998).
- Nakamura et al. [2008] M. Nakamura, S. Takekawa, S. Kumaragurubaran, and K. Kitamura, Curie temperature and [Li]/([Li] + [Nb]) ratio of near-stoichiometric crystal grown from different Li-rich solutions, Japanese Journal of Applied Physics 47, 3476 (2008).
- Kim and Smith [1969] Y. S. Kim and R. T. Smith, Thermal expansion of lithium tantalate and lithium niobate single crystals, Journal of Applied Physics 40, 4637 (1969).
- Sanna and Schmidt [2012] S. Sanna and W. G. Schmidt, Ferroelectric phase transition in : Insights from molecular dynamics, IEEE Transactions on Ultrasonics, Ferroelectrics, and Frequency Control 59, 1925 (2012).
- Phillpot and Gopalan [2004] S. R. Phillpot and V. Gopalan, Coupled displacive and order–disorder dynamics in by molecular-dynamics simulation, Applied Physics Letters 84, 1916 (2004).
- Sanna et al. [2015] S. Sanna, S. Neufeld, M. Rüsing, G. Berth, A. Zrenner, and W. G. Schmidt, Raman scattering efficiency in and crystals, Phys. Rev. B 91, 224302 (2015).
- Margueron et al. [2012] S. Margueron, A. Bartasyte, A. M. Glazer, E. Simon, J. Hlinka, I. Gregora, and J. Gleize, Resolved E-symmetry zone-centre phonons in LiTaO3 and LiNbO3, Journal of Applied Physics 111, 104105 (2012), https://pubs.aip.org/aip/jap/article-pdf/doi/10.1063/1.4716001/13053433/104105_1_online.pdf .
- Friedrich et al. [2015] M. Friedrich, A. Riefer, S. Sanna, W. G. Schmidt, and A. Schindlmayr, Phonon dispersion and zero-point renormalization of LiNbO3 from density-functional perturbation theory, Journal of Physics: Condensed Matter 27, 385402 (2015).
- Ridah et al. [1997] A. Ridah, P. Bourson, M. D. Fontana, and G. Malovichko, The composition dependence of the raman spectrum and new assignment of the phonons in LiNbO3, Journal of Physics: Condensed Matter 9, 9687 (1997).
- Friedrich et al. [2016a] M. Friedrich, A. Schindlmayr, W. G. Schmidt, and S. Sanna, phonon dispersion and ferroelectric transition calculated from first principles, physica status solidi (b) 253, 683 (2016a).
- Caciuc and Postnikov [2001] V. Caciuc and A. V. Postnikov, Ab initio zone-center phonons in Comparison to , Phys. Rev. B 64, 224303 (2001).
- Raptis [1988] C. Raptis, Assignment and temperature dependence of the raman modes of studied over the ferroelectric and paraelectric phases, Phys. Rev. B 38, 10007 (1988).
- Barker and Loudon [1967] A. S. Barker and R. Loudon, Dielectric properties and optical phonons in , Phys. Rev. 158, 433 (1967).
- Johnston and Kaminow [1968] W. D. Johnston and I. P. Kaminow, Temperature dependence of raman and rayleigh scattering in and , Phys. Rev. 168, 1045 (1968).
- Servoin and Gervais [1979] J. Servoin and F. Gervais, Soft vibrational mode in and , Solid State Communications 31, 387 (1979).
- Wood et al. [2008] I. G. Wood, P. Daniels, R. H. Brown, and A. M. Glazer, Optical birefringence study of the ferroelectric phase transition in lithium niobate tantalate mixed crystals: , Journal of Physics: Condensed Matter 20, 235237 (2008).
- Chowdhury et al. [1974] M. R. Chowdhury, G. E. Peckham, R. T. Ross, and D. H. Saunderson, Lattice dynamics of lithium niobate, Journal of Physics C: Solid State Physics 7, L99 (1974).
- Kojima [1999] S. Kojima, Order-disorder nature of ferroelectric phase transition in stoichiometric crystals, Ferroelectrics 223, 63 (1999).
- Penna et al. [1976] A. F. Penna, A. Chaves, P. d. R. Andrade, and S. P. S. Porto, Light scattering by lithium tantalate at room temperature, Phys. Rev. B 13, 4907 (1976).
- Inbar and Cohen [1996] I. Inbar and R. E. Cohen, Comparison of the electronic structures and energetics of ferroelectric and , Phys. Rev. B 53, 1193 (1996).
- Yu and Park [1997] J. Yu and K.-T. Park, First principles total energy study of ferroelectric transitions in , Physica B: Condensed Matter 237-238, 341 (1997), proceedings of the Yamada Conference XLV, the International Conference on the Physics of Transition Metals.
- Lee et al. [2010] D. Lee, H. Xu, V. Dierolf, V. Gopalan, and S. R. Phillpot, Structure and energetics of ferroelectric domain walls in from atomic-level simulations, Phys. Rev. B 82, 014104 (2010).
- Sanna et al. [2011] S. Sanna, C. Thierfelder, S. Wippermann, T. P. Sinha, and W. G. Schmidt, Barium titanate ground- and excited-state properties from first-principles calculations, Phys. Rev. B 83, 054112 (2011).
- Fu et al. [2021] Y. Fu, H. Wei, L. Wei, H. Zhang, X. Wang, B. Liu, Y. Zhang, X. Lv, J. Zhou, and H. Yu, Origin of the difference in thermal conductivity and anharmonic phonon scattering between and , Cryst. Eng. Comm. 23, 8572 (2021).
- Grabmaier and Otto [1986] B. Grabmaier and F. Otto, Growth and investigation of MgO-doped , Journal of Crystal Growth 79, 682 (1986), proceedings of the Eighth International Conference on Crystal Growth.
- Riefer et al. [2013] A. Riefer, S. Sanna, and W. G. Schmidt, LiNb1-xTaxO3 electronic structure and optical response from first-principles calculations, Ferroelectrics 447, 78 (2013).
- Kresse and Hafner [1993] G. Kresse and J. Hafner, Ab initio molecular dynamics for liquid metals, Physical Review B 47, 558 (1993).
- Kresse and Furthmüller [1996a] G. Kresse and J. Furthmüller, Efficient iterative schemes for ab initio total-energy calculations using a plane-wave basis set, Physical Review B - Condensed Matter and Materials Physics 54, 11169 (1996a).
- Kresse and Furthmüller [1996b] G. Kresse and J. Furthmüller, Efficiency of ab-initio total energy calculations for metals and semiconductors using a plane-wave basis set, Computational Materials Science 6, 15 (1996b).
- Blöchl [1994] P. E. Blöchl, Projector augmented-wave method, Phys. Rev. B 50, 17953 (1994).
- Joubert [1999] D. Joubert, From ultrasoft pseudopotentials to the projector augmented-wave method, Physical Review B - Condensed Matter and Materials Physics 59, 1758 (1999).
- Perdew et al. [2008] J. P. Perdew, A. Ruzsinszky, G. I. Csonka, O. A. Vydrov, G. E. Scuseria, L. A. Constantin, X. Zhou, and K. Burke, Restoring the density-gradient expansion for exchange in solids and surfaces, Physical Review Letters 100, 1 (2008).
- Dudarev et al. [1998] S. L. Dudarev, G. A. Botton, S. Y. Savrasov, C. J. Humphreys, and A. P. Sutton, Electron-energy-loss spectra and the structural stability of nickel oxide: An LSDA+U study, Phys. Rev. B 57, 1505 (1998).
- Krampf et al. [2021] A. Krampf, M. Imlau, Y. Suhak, H. Fritze, and S. Sanna, Evaluation of similarities and differences of LiTaO3 and LiNbO3 based on high-t-conductivity, nonlinear optical fs-spectroscopy and ab initio modeling of polaronic structures, New Journal of Physics 23, 033016 (2021).
- Pack and Monkhorst [1977] J. D. Pack and H. J. Monkhorst, ”special points for Brillouin-zone integrations”-a reply, Physical Review B 16, 1748 (1977).
- Togo et al. [2010] A. Togo, L. Chaput, I. Tanaka, and G. Hug, First-principles phonon calculations of thermal expansion in , , and , Physical Review B 81, 1 (2010).
- Togo [2023] A. Togo, First-principles Phonon Calculations with Phonopy and Phono3py, Journal of the Physical Society of Japan 92, 012001 (2023).
- Togo and Tanaka [2015] A. Togo and I. Tanaka, First principles phonon calculations in materials science, Scripta Materialia 108, 1 (2015).
- Parlinski et al. [1997] K. Parlinski, Z. Q. Li, and Y. Kawazoe, First-principles determination of the soft mode in cubic ZrO2, Physical Review Letters 78, 4063 (1997).
- Friedrich et al. [2016b] M. Friedrich, A. Schindlmayr, W. G. Schmidt, and S. Sanna, LiTaO3 phonon dispersion and ferroelectric transition calculated from first principles, Physica Status Solidi (B) Basic Research 253, 683 (2016b).
- Monacelli et al. [2021] L. Monacelli, R. Bianco, M. Cherubini, M. Calandra, I. Errea, and F. Mauri, The stochastic self-consistent harmonic approximation: Calculating vibrational properties of materials with full quantum and anharmonic effects, Journal of Physics Condensed Matter 33, 363001 (2021).
- Errea et al. [2013] I. Errea, M. Calandra, and F. Mauri, First-principles theory of anharmonicity and the inverse isotope effect in superconducting palladium-hydride compounds, Physical Review Letters 111, 1 (2013).
- Errea et al. [2014] I. Errea, M. Calandra, and F. Mauri, Anharmonic free energies and phonon dispersions from the stochastic self-consistent harmonic approximation: Application to platinum and palladium hydrides, Physical Review B - Condensed Matter and Materials Physics 89, 1 (2014).
- Bianco et al. [2017] R. Bianco, I. Errea, L. Paulatto, M. Calandra, and F. Mauri, Second-order structural phase transitions, free energy curvature, and temperature-dependent anharmonic phonons in the self-consistent harmonic approximation: Theory and stochastic implementation, Physical Review B 96, 1 (2017).
- Monacelli et al. [2018] L. Monacelli, I. Errea, M. Calandra, and F. Mauri, Pressure and stress tensor of complex anharmonic crystals within the stochastic self-consistent harmonic approximation, Physical Review B 98, 24106 (2018).
- Nosé [1984] S. Nosé, A unified formulation of the constant temperature molecular dynamics methods, The Journal of Chemical Physics 81, 511 (1984).
- Holian et al. [1995] B. L. Holian, A. F. Voter, and R. Ravelo, Thermostatted molecular dynamics: How to avoid the Toda demon hidden in Nosé-Hoover dynamics, Phys. Rev. E 52, 2338 (1995).
- Resta [1994] R. Resta, Macroscopic polarization in crystalline dielectrics: the geometric phase approach, Rev. Mod. Phys. 66, 899 (1994).
- King-Smith and Vanderbilt [1993] R. D. King-Smith and D. Vanderbilt, Theory of polarization of crystalline solids, Phys. Rev. B 47, 1651 (1993).
- Resta [1993] R. Resta, Macroscopic electric polarization as a geometric quantum phase, Europhysics Letters 22, 133 (1993).
- Zhang et al. [2018] Z.-G. Zhang, T. Abe, C. Moriyoshi, H. Tanaka, and Y. Kuroiwa, Synchrotron-radiation x-ray diffraction evidence of the emergence of ferroelectricity in LiTaO3 by ordering of a disordered li ion in the polar direction, Applied Physics Express 11, 071501 (2018).
- El Azzouzi et al. [2024] F. El Azzouzi, D. Klimm, L. M. Verhoff, N. A. Schäfer, S. Ganschow, K.-D. Becker, S. Sanna, and H. Fritze, Phase Transformation in Lithium Niobate-Lithium Tantalate Solid Solutions (LiNb1-xTaxO3), Phys. Stat. Sol. (a) (2024), submitted.
- Bashir et al. [2023] U. Bashir, K. Böttcher, D. Klimm, S. Ganschow, F. Bernhardt, S. Sanna, M. Rüsing, L. M. Eng, and M. Bickermann, Solid solutions of lithium niobate and lithium tantalate: crystal growth and the ferroelectric transition, Ferroelectrics 613, 250 (2023).
- Zou et al. [2020] Y. Zou, S. Xiang, and C. Dai, Investigation on the efficiency and accuracy of methods for calculating melting temperature by molecular dynamics simulation, Computational Materials Science 171, 109156 (2020).
- Li et al. [2017] Y. Li, L. Li, X. Cheng, and X. Zhao, Microscopic Properties of Mg in Li and Nb Sites of LiNbO3 by First-Principle Hybrid Functional: Formation and Related Optical Properties, The Journal of Physical Chemistry C 121, 8968 (2017).
- Nitanda et al. [1995] F. Nitanda, Y. Furukawa, S. Makio, M. Sato, and K. I. K. Ito, Increased Optical Damage Resistance and Transparency in MgO-Doped LiTaO3 Single Crystals, Japanese Journal of Applied Physics 34, 1546 (1995).
- Bryan et al. [1984] D. A. Bryan, R. Gerson, and H. E. Tomaschke, Increased optical damage resistance in lithium niobate, Applied Physics Letters 44, 847 (1984).
- Furukawa et al. [2001] Y. Furukawa, K. Kitamura, A. Alexandrovski, R. K. Route, M. M. Fejer, and G. Foulon, Green-induced infrared absorption in MgO doped LiNbO3, Applied Physics Letters 78, 1970 (2001).
- of Sheffield [2023] T. U. of Sheffield, WebElements, https://www.webelements.com (2023), last accessed 10th October 2023.
- Li et al. [2015] Y. Li, W. G. Schmidt, and S. Sanna, Defect complexes in congruent and their optical signatures, Phys. Rev. B 91, 174106 (2015).
- Xu et al. [2008] H. Xu, D. Lee, J. He, S. B. Sinnott, V. Gopalan, V. Dierolf, and S. R. Phillpot, Stability of intrinsic defects and defect clusters in from density functional theory calculations, Phys. Rev. B 78, 174103 (2008).
- Vyalikh et al. [2018] A. Vyalikh, M. Zschornak, T. Köhler, M. Nentwich, T. Weigel, J. Hanzig, R. Zaripov, E. Vavilova, S. Gemming, E. Brendler, and D. C. Meyer, Analysis of the defect clusters in congruent lithium tantalate, Phys. Rev. Mater. 2, 013804 (2018).
- Kofahl et al. [2023] C. Kofahl, L. Dörrer, B. Muscutt, S. Sanna, S. Hurskyy, U. Yakhnevych, Y. Suhak, H. Fritze, S. Ganschow, and H. Schmidt, Li self-diffusion and ion conductivity in congruent and single crystals, Phys. Rev. Mater. 7, 033403 (2023).
- Ganschow et al. [2021] S. Ganschow, H. Schmidt, Y. Suhak, M. K. Imlau, M. Rüsing, L. M. Eng, H. Fritze, and S. Sanna, Periodic low-dimensional defect structures in polar oxides (2021).