The influence of baryons on low-mass haloes
Abstract
The Voids-within-Voids-within-Voids (VVV) project used dark-matter-only simulations to study the abundance and structure of dark matter haloes over the full mass range populated in the standard CDM cosmology. Here we explore how baryonic effects modify these results for halo masses in the range to , below the threshold for galaxy formation. Our main study focuses on three simulations from identical initial conditions at , one following dark matter only, one including non-radiative gas, and one additionally including the baryonic physics relevant in this halo mass range (cooling and photoheating). In the non-radiative simulation, above , halo abundance and internal structure are very similar to the dark-matter-only simulation, and the baryon to dark matter ratio is everywhere close to the cosmic value. At lower mass, this ratio drops and haloes are less concentrated and less massive in the non-radiative case. Test simulations at higher resolution show this to be mainly a resolution effect; the expected drop in baryon content due to residual pressure effects only becomes substantial for haloes below . However, gas is heated by reionization at in our “full physics” run, and this results in almost complete expulsion of gas from all haloes in our simulated mass range. This suppresses the halo mass function by , lowers halo concentration, and consequently weakens the dark matter annihilation signal by .
keywords:
dark matter – galaxies: haloes – galaxies: formation – dark ages, reionization, first stars – methods: numerical1 Introduction
Measurements of the cosmic microwave background (CMB) have revealed that dark matter is the dominant component () of cosmic matter (Planck Collaboration et al., 2020). Despite its important role as the principal driver within the framework of the growth both of -scale structure and of galaxies (Davis et al., 1985; White & Frenk, 1991) the nature of dark matter is still uncertain, and numerous elementary particle candidates have been proposed (e.g. weakly interacting massive particles a.k.a. "WIMPs", sterile neutrinos, axions, see Bertone et al. 2005 and Roszkowski et al. 2018 for reviews).
Various probes involving the present-day properties of small-scale (sub)structures have emerged as possible constraints on the nature of dark matter (e.g. their abundance, concentration, and dark matter annihilation signals, see Frenk & White, 2012, for a review). The properties of dark matter particles set the minimum scale for structure in the post-recombination universe, and this in turn determines the minimum mass of the nonlinear structures that form at later times (e.g. Bode et al., 2001; Avila-Reese et al., 2003). A detailed understanding of how this is reflected in the abundance and structure of low-redshift mini-haloes may thus be key in constraining dark matter. Until recently, such understanding has come from extrapolating results for much larger haloes, or from approximate structure formation theories (e.g. Press & Schechter, 1974; Bond et al., 1991; Sheth et al., 2001). Recently, however, the full halo mass range relevant for WIMP dark matter was resolved in the VVV multi-zoom dark matter simulation suite of Wang et al. (2020). This suite uses nine levels of resimulation to span over 20 orders of magnitude in halo mass, resolving present-day halo structure all the way from rich cluster masses () down to the Earth mass limit expected in a typical WIMP model (). The VVV simulations thus provide a direct prediction for the abundance and structure of present-day mini-haloes (Zheng et al., 2024). This contrasts with earlier work on low-mass halo formation which concentrated on halo properties at high redshift and did not follow evolution until the present day (e.g. Diemand et al., 2005; Ishiyama et al., 2010; Angulo et al., 2017).
These predictions can be improved by taking baryonic physics into consideration, which, as pointed out in many studies, can alter low-redshift halo properties such as abundance (or halo mass) and density profile (or concentration), thus affecting the predicted luminosity in annihilation radiation. The effect on halo abundance depends on halo mass and on the baryonic physics considered. For example, in simulations with reionization, star formation and supernovae feedback, Sawala et al. (2013) report a decrease in the cumulative halo mass function at to , and Grand & White (2021) report a decrease in halo abundance and a factor of two decrease in halo dark matter annihilation luminosity for haloes in the mass range to For simulations additionally including black hole feedback, Schaller et al. (2015) report a decrease in the halo mass function at to , and Vogelsberger et al. (2014) report a similar decrease for to .
We note that the above studies focus on relatively large mass scales (), and cannot be applied to haloes with shallower potential wells and no star formation at all (Rees, 1986; Thoul & Weinberg, 1996; Gnedin, 2000). Recently, Benitez-Llambay & Frenk (2020) presented a detailed model of gas cooling in haloes as a function of redshift and mass, defining a ‘halo occupation fraction’ as the fraction of haloes containing at least some stars as a function of halo mass; they found this halo occupation fraction to drop to zero at . This is very convenient for simulations of even lower mass haloes, since only relatively clean baryonic physics need be included, i.e. the cooling and reionization of gas. In this study, we carry out high-resolution hydrodynamic simulations, based on the dark-matter-only (DMO) simulations of Wang et al. (2020) in order to investigate the impact of baryons on such low-mass haloes, and how that impact depends on halo mass.
Our results are useful for making accurate predictions for halo properties relevant to dark matter detection based on methods focusing on mini-haloes, , such as strong gravitational lensing (Dalal & Kochanek, 2002; Koopmans, 2005), density fluctuations in tidal streams (Ibata et al., 2002; Johnston et al., 2002; Banik et al., 2021), and -ray emission from dark matter annihilation (e.g. Bergström et al., 1999; Stoehr et al., 2003; Springel et al., 2008; Grand & White, 2021).
2 Simulation Details
To investigate baryonic effects on the properties of mini-haloes we concentrate on three high-resolution zoom simulations with the gadget-4 code (Springel et al., 2021). We adopt the same cosmological model parameters and generate initial conditions using the same methods as Wang et al. (2020) for the vvv project. The vvv simulations, which model dark matter only, consist of a single CDM simulation of a cosmological volume on a side (the L0 volume), and a nested series of zoom simulations within L0 that target smaller and smaller low-density regions (the L1-L8 volumes). A visual representation of this set-up is shown in Figure 1 of Wang et al. (2020). Each of these nested zoom simulations contains a core region that can be simulated all the way to redshift zero without being contaminated by heavier particles. For the current paper it proved convenient to reuse a set of initial conditions created for the vvv project. We took a region called ‘L3-pilot’ which is located within the L2 core region. The high-resolution region of the L3-pilot initial conditions is close both in size and in position to the L3 volume, but it has a particle mass that is 64 times larger than in the vvv-L3 simulation.
In Table 1, we list the parameters of our three simulations: dark matter only (DM hereafter, identical to the original L3-pilot); dark matter plus non-radiative primordial gas (NR), and dark matter plus primordial gas that is heated by reionization and able to cool through atomic cooling (RI). We take the DM simulation as the fiducial simulation to compare against. The initial conditions for the NR simulation is generated from the DM initial conditions using a feature of the gadget-4 code that splits each high-resolution dark matter particle into a dark matter particle with less mass and a gas particle. We set the initial gas temperature to 245 K according to the fitting formula provided by Tseliakhovich & Hirata (2010) evaluated at our starting redshift of 127. We adopt a smoothed particle hydrodynamics (SPH) neighbour number, , and the artificial viscosity constant, . The RI simulation further includes radiative cooling (Katz et al., 1996) and photoheating by a uniform UV/X-ray background from galaxies and quasars (Haardt & Madau, 1996). The gadget-4 code implements cooling and heating assuming ionisation equilibrium at all times. The UV background is turned on at redshift six triggering prompt reionization of hydrogen at that redshift. Since atomic cooling has virtually no effect before reionization (the temperature of almost all gas is well below ), we adapt a snapshot of the NR simulation at as the initial condition for the RI simulation. Baryonic processes such as star formation and stellar feedback are not included, since the minimum halo mass for star formation is (Benitez-Llambay & Frenk, 2020), which is above the mass range present in our simulations.
| Name of simulations | ] | () | |||
|---|---|---|---|---|---|
| DM | – | ||||
| NR | |||||
| RI |
The cosmological parameters of these simulations are taken from Planck Collaboration et al. (2014): , , , , and . These are the same parameters used in the EAGLE project (Schaye et al., 2015). The same linear matter power spectrum is also used but is extended to higher wavenumbers as explained in Wang et al. (2020). We note that our procedures lead to a small inconsistency between our initial conditions and those expected in a Planck cosmology including baryons, since the growth of small-scale linear fluctuations () between recombination and is slightly weaker in a universe containing both dark matter and baryons than in one containing dark matter only, and furthermore the distributions of baryons and dark matter differ slightly on small scales (see, for example, Delos & White, 2023). This causes us to overestimate slightly the abundance and concentration of haloes at masses below about , but we prefer our simpler set-up since all differences between the DM run and the two runs with baryons are then due to baryonic effects during the simulated time period.
We use gadget-4 to identify haloes and subhaloes, and to construct halo merger trees. Dark matter haloes are identified using the "friends-of-friends" (fof) algorithm (Davis et al., 1985), with a dimensionless linking length of 0.2 and a minimum of 32 dark matter particles. Gas particles are attached to these haloes as the secondary link types. The subfind algorithm (Springel et al., 2001) is then used to identify gravitationally bound subhaloes with at least 20 particles. In this paper, only central haloes are considered. We adopt to define the mass of haloes, where is the mass within a sphere centred on the potential minimum with a mean enclosed density of 200 times the mean matter density of our Universe. The merger tree construction follows Springel et al. (2005), and the merger trees provide the mass accretion history of haloes.
For each simulation output we conservatively define a fiducial region as a sphere of radius, containing only high-resolution particles and with no larger mass particles close by. Specifically, we take the centre of the sphere to be the centre of mass of all the high-resolution particles and its radius to be , where is the distance from the centre to the closest more massive particle. We use only particles or haloes whose centre lies within this sphere for all our quantitative analysis. In practice, at any given output time the spherical regions in the DM, NR and RI simulations are almost identical allowing accurate like-with-like comparisons to be made.
3 Results
3.1 Large-scale structure
| Name of simulations | |||||
|---|---|---|---|---|---|
| DM | 555.56 | 0.07474 | 0.07474 | – | |
| 0 | NR | 560.32 | 0.07358 | 0.07359 | 0.07355 |
| RI | 565.39 | 0.07195 | 0.07309 | 0.06585 | |
| DM | 373.72 | 0.27287 | 0.27287 | – | |
| 3.06 | NR | 375.65 | 0.27018 | 0.27014 | 0.27041 |
| RI | 375.66 | 0.27021 | 0.27116 | 0.26520 | |
| DM | 317.36 | 0.41056 | 0.41056 | – | |
| 5.72 | NR | 318.56 | 0.40728 | 0.40726 | 0.40740 |
| RI | 318.59 | 0.40719 | 0.40717 | 0.40728 | |
| DM | 283.22 | 0.52991 | 0.52991 | – | |
| 9.27 | NR | 283.83 | 0.52687 | 0.52685 | 0.52695 |
| RI | 283.77 | 0.52705 | 0.52704 | 0.52709 |
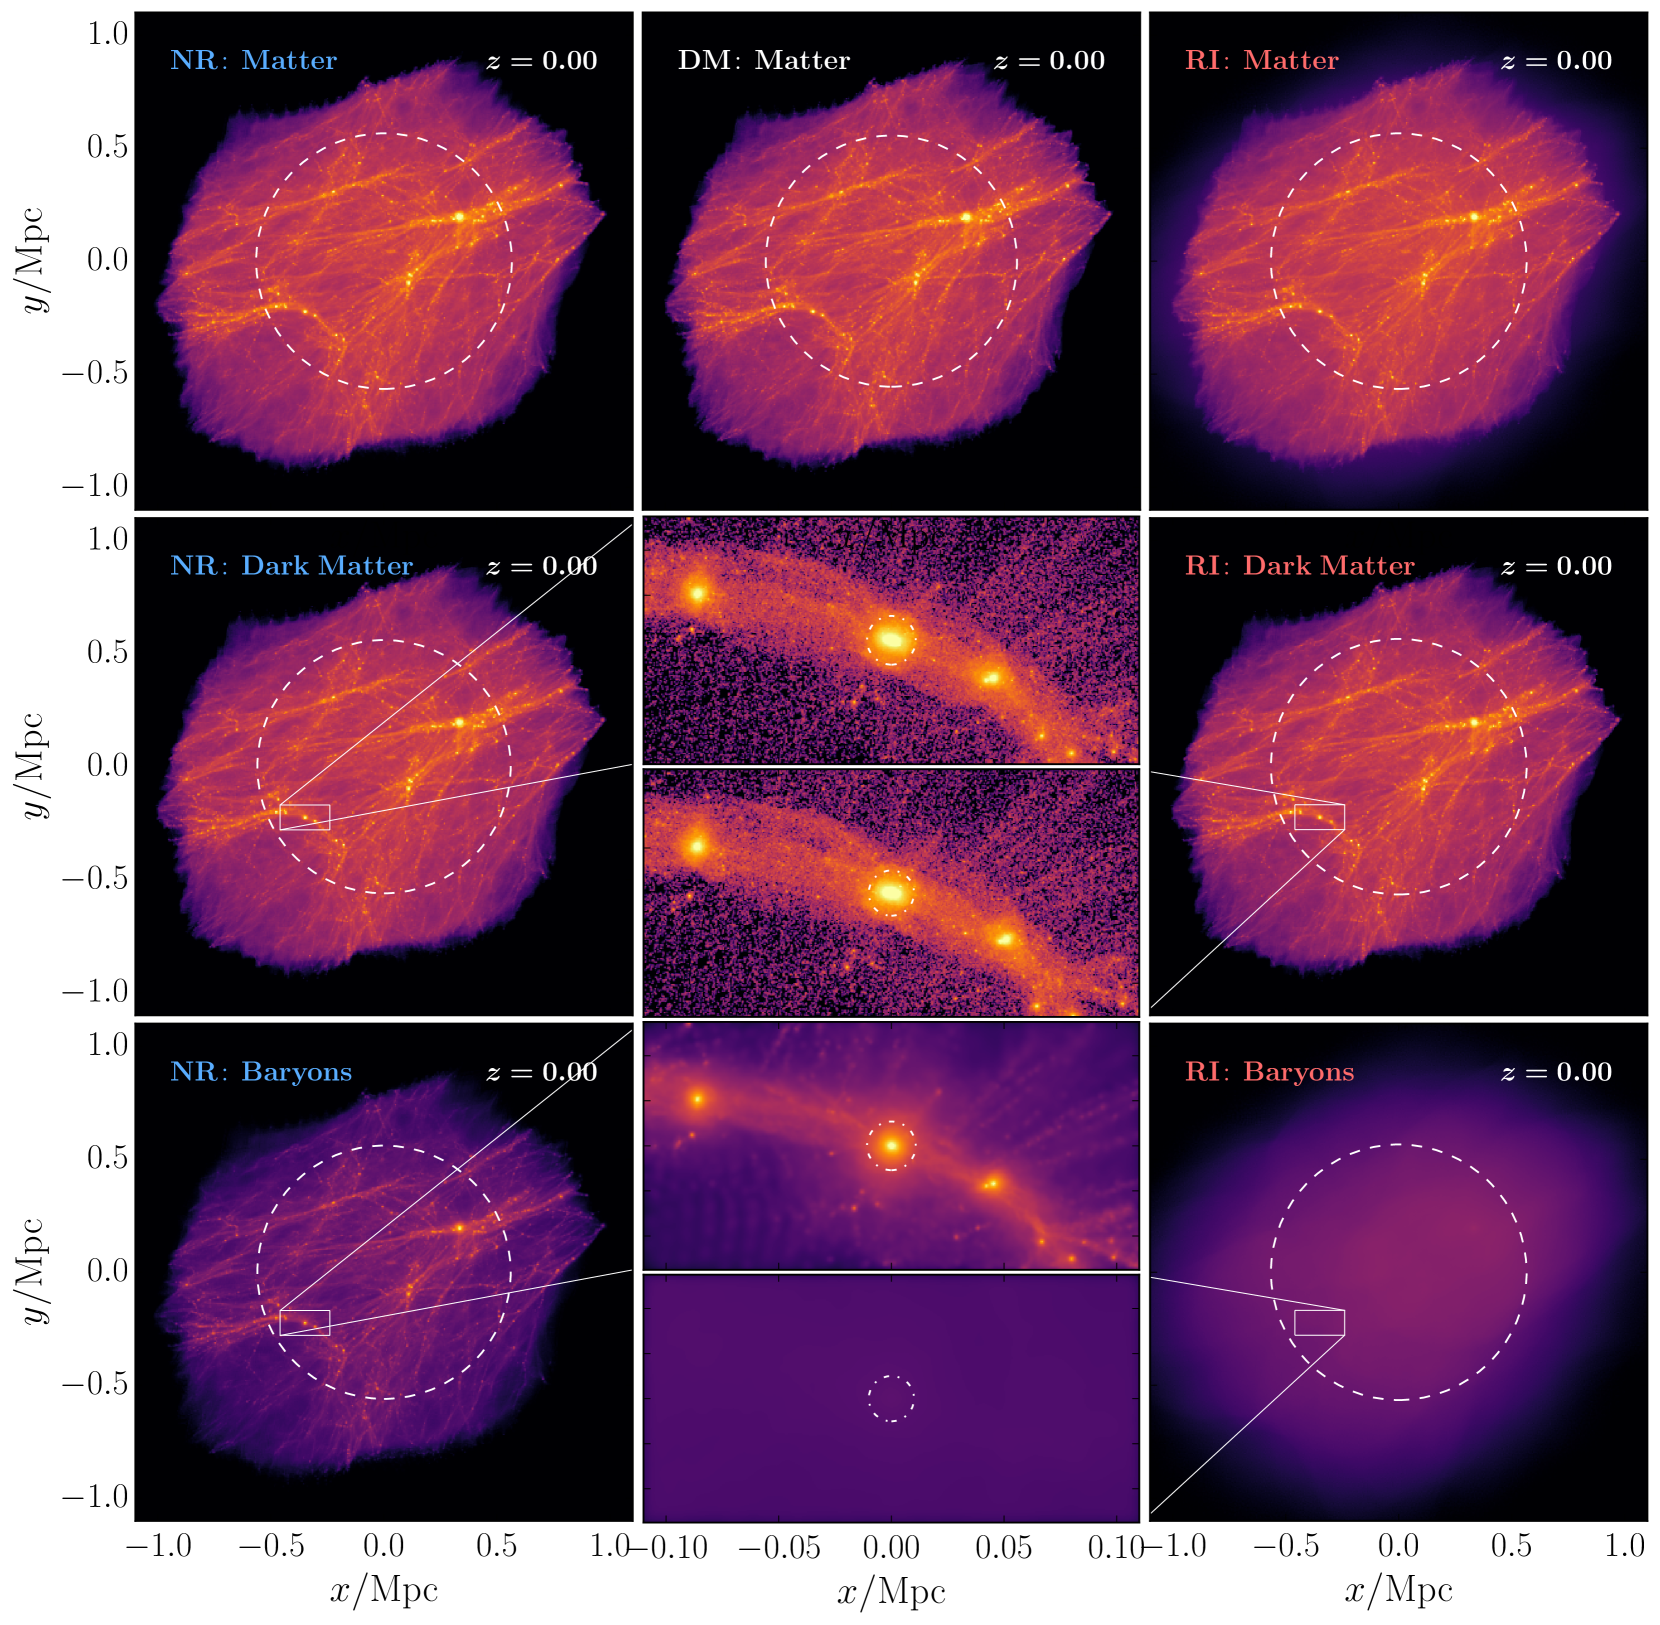
We show the projected total matter, dark matter and baryonic matter surface densities in the high resolution regions of our three zoom simulations in Fig. 1. The dark matter distribution on large scales is virtually the same in all three simulations and the shape and size of the high-resolution region is almost unchanged. The distribution of gas in the NR simulation closely traces the dark matter structure, while in the RI simulation, where the the gas has been heated by a UV background, the gas is diffuse everywhere and is not concentrated to any visible extent in any of the dark matter haloes within the volume. In the RI simulation some of the gas has left the high resolution region by redshift zero. This is a result of our not including gas in the low-resolution region, so that there is, in effect, a zero-pressure boundary condition on the high-resolution region.
In Table 2 we list the total, dark matter and baryonic densities within our fiducial regions, normalised by the corresponding cosmic mean densities of these components. Unsurprisingly, given the selection of the underdense L3-pilot region, the total matter density is much lower than the cosmic mean matter density with the ratio decreasing with time. The scaled dark matter and baryon densities, , and agree extremely well at all redshifts in the NR simulation. This contrasts with the RI simulation where the the difference is at and rises to at . The difference is driven by photoheating which raises the temperature of the gas in the RI simulation abruptly at redshift six, leading to the outflow visible at the edges of the gas distribution in the lower right panel of Fig.1.
3.2 The halo mass function and the baryonic mass fractions within haloes
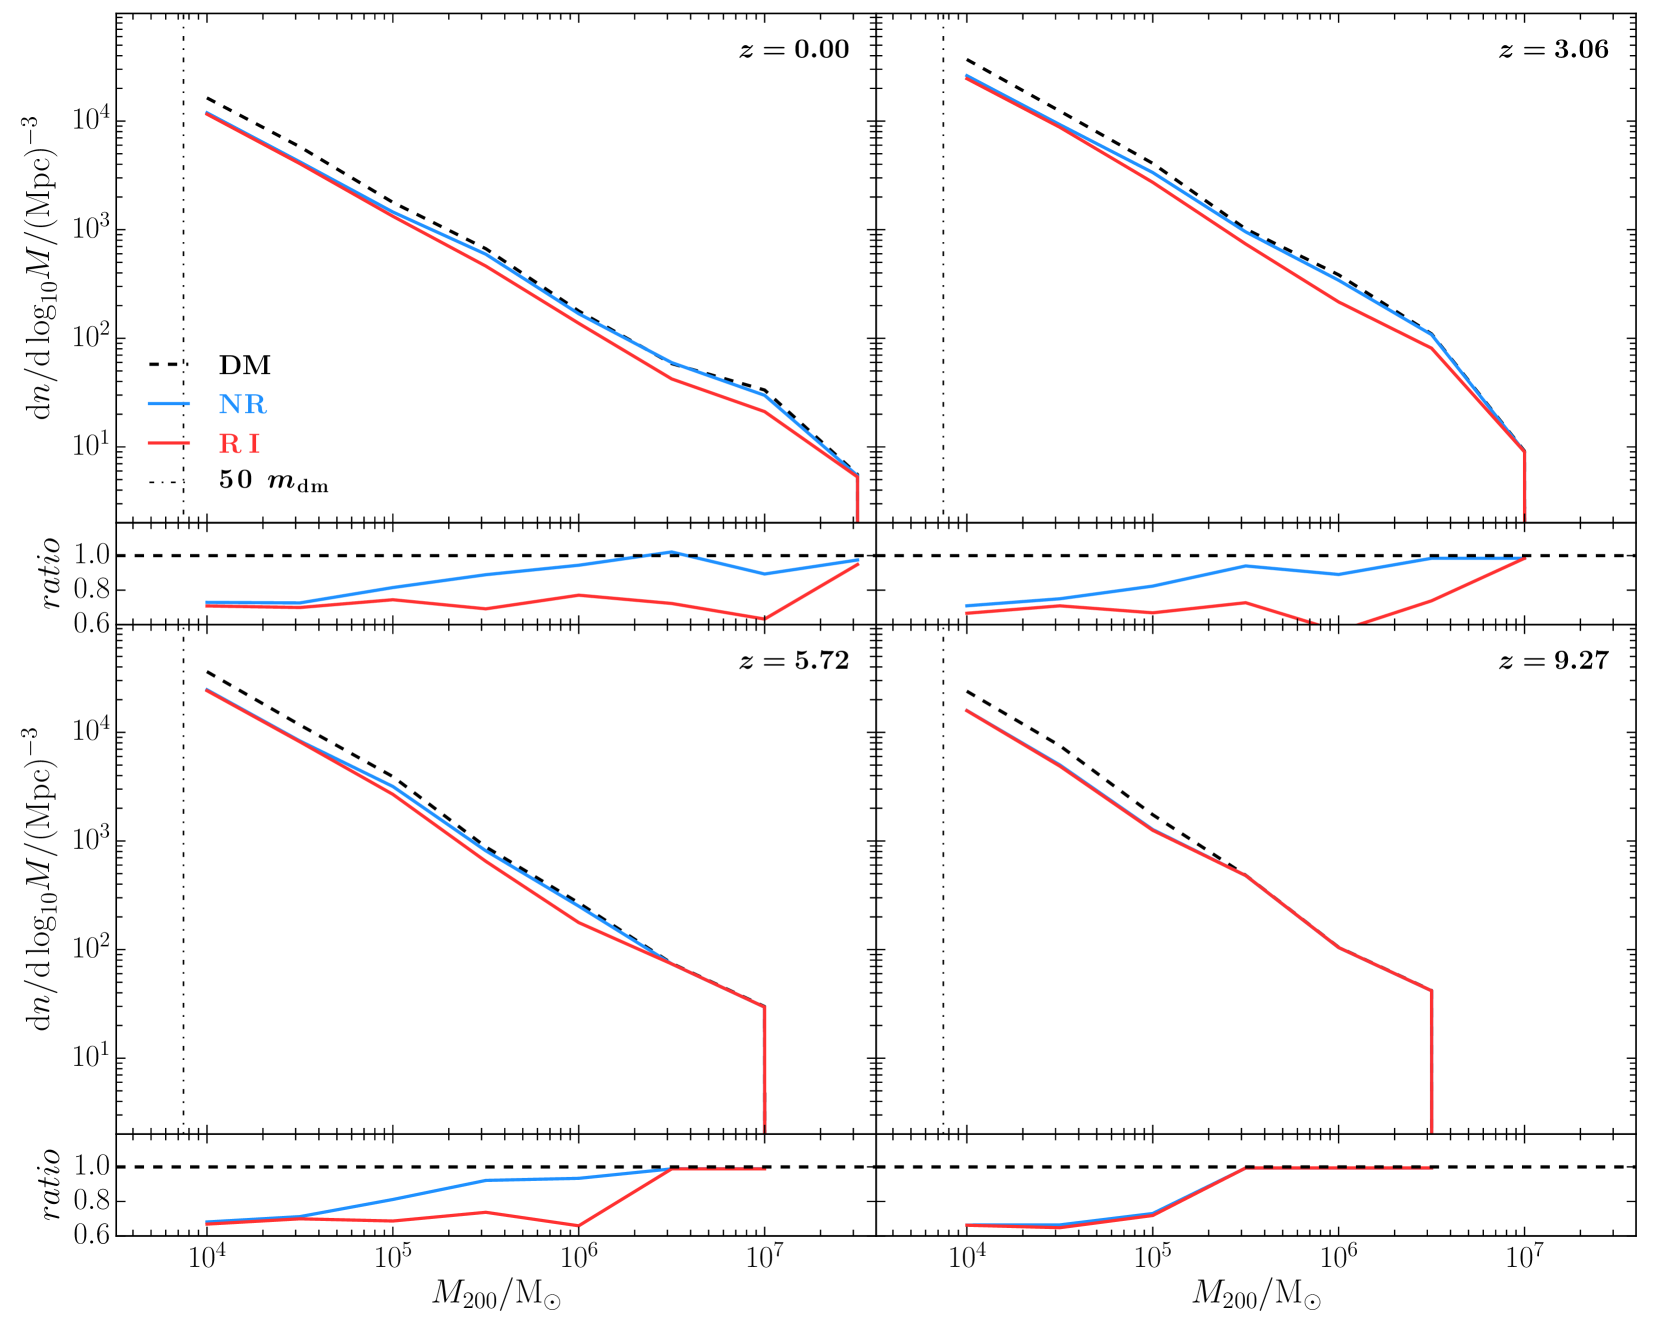
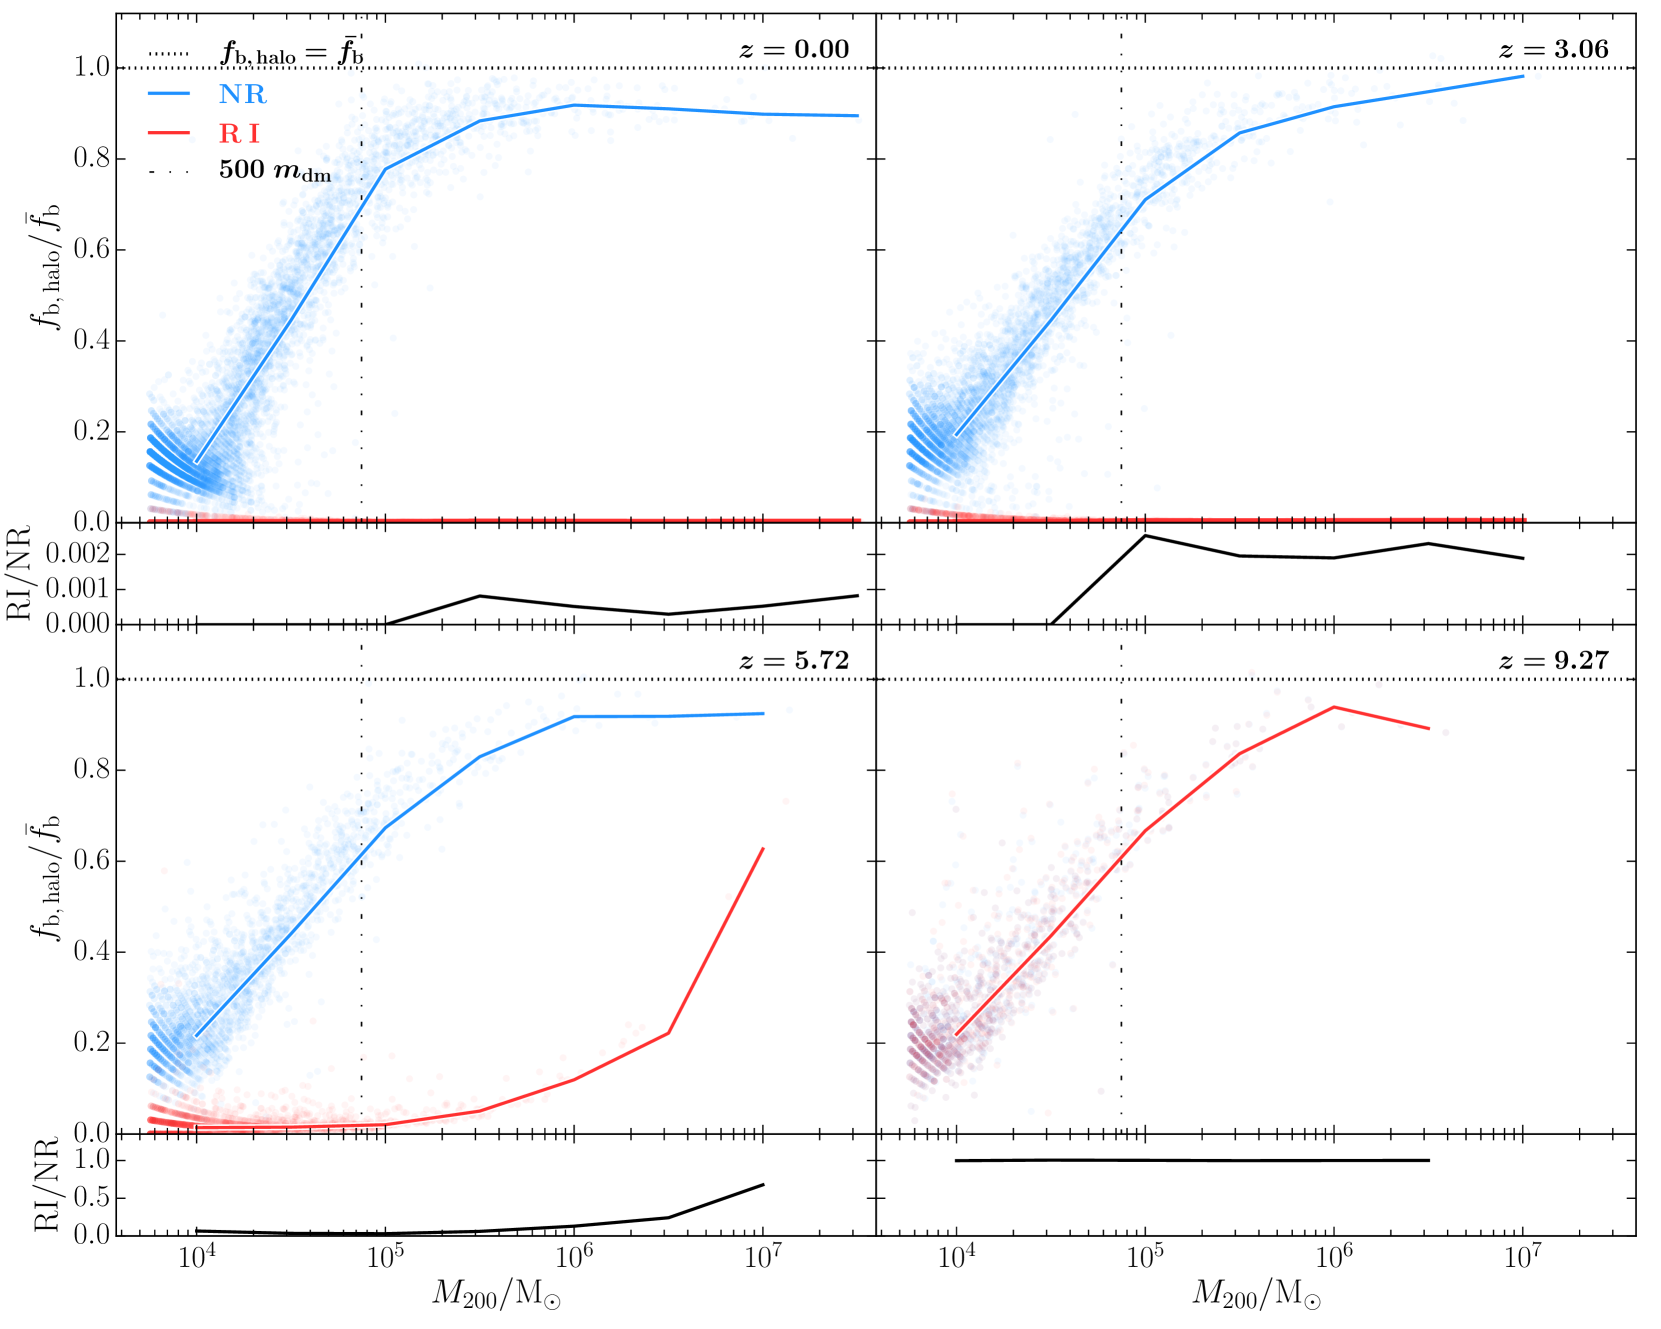
The evolution of the halo mass function and of the halo baryonic fractions are shown in Figs. 2 and 3 respectively. Both of these quantities are evaluated within our fiducial analysis regions defined at the end of Section 2. The number of haloes in each mass bin in the DM simulation is given in column 2 of Table 3.
In the NR simulation, the halo mass function of mini-haloes () is suppressed by relative to the dark matter only simulation, but the mass function is hardly affected for larger haloes (). The baryonic fraction in haloes of decreases with halo mass at all redshifts. We discuss this trend further in Section 4 where we also determine the number of particles in a halo required for the mass function and the baryonic fractions to be reliably determined. For the NR simulation, the halo mass function converges to within about 20% for haloes with more than 50 particles (here ) whereas the halo baryonic fractions converge for 500 particles (here ).
In the RI simulation the effect of reionization () is evident. At , before reionization, the halo mass function and halo baryonic fractions overlap with those of the NR simulation. After reionization, haloes rapidly lose baryons by photo-evaporation, beginning with the smaller haloes which have shallower gravitational potentials. At the largest haloes still retain most of their baryons but at lower redshift ( and ), all of the haloes are nearly gas-free, and the halo mass function is suppressed by in all mass bins.
Most previous studies comparing haloes in dark matter only and hydrodynamic simulations have focused on much more massive objects than we consider here, but a few reach sufficiently low mass that their behaviour is dominated by the same effects that are relevant in our mass range. Schaller et al. (2015) found the halo mass function over the range to in the EAGLE simulations (Schaye et al., 2015) to be suppressed by while Grand & White (2021) found the abundance of field haloes in the range to in the Auriga simulations to be reduced by 30% relative to DMO versions evolved from the same initial conditions.
All simulations that have compared models with non-radiative gas to DMO models from the same initial conditions have found that the abundance and internal structure of haloes are very similar in the two cases. Crain et al. (2007) discussed how post-reionization photoheating affects the baryonic fraction of haloes of mass between and . In their purely non-radiative simulation, the median baryonic fraction within the halo virial radius is of the cosmic mean value and does not depend either on redshift or on halo mass down to their smallest mass bin (). Our results extend this conclusion, showing that above , haloes in the NR case retain 90% of their baryons, while below the gas fraction is greatly reduced (see Fig. 9). This transition is independent of redshift. In contrast, in their photoheating simulation, Crain et al. (2007) found that low-mass haloes are unable to keep all their gas, with the baryonic fraction falling to approximately half the cosmic value at , and approaching zero at . Similar results at higher redshift were obtained by Okamoto et al. (2008), with the baryonic fraction in haloes dropping from the cosmic mean value at to nearly zero for haloes ten times smaller in mass at . These results are corroborated by our finding that well after reionization for all the haloes in our RI simulation.
3.3 Present day density profiles
| 7.25-7.75 | 2 | 2 | 2 |
| 6.75-7.25 | 12 | 11 | 10 |
| 6.25-6.75 | 21 | 20 | 20 |
| 5.75-6.25 | 64 | 62 | 60 |
| 5.25-5.75 | 240 | 225 | 223 |
| 4.75-5.25 | 641 | 607 | 602 |
| 4.25-4.75 | 2082 | 1829 | 1801 |
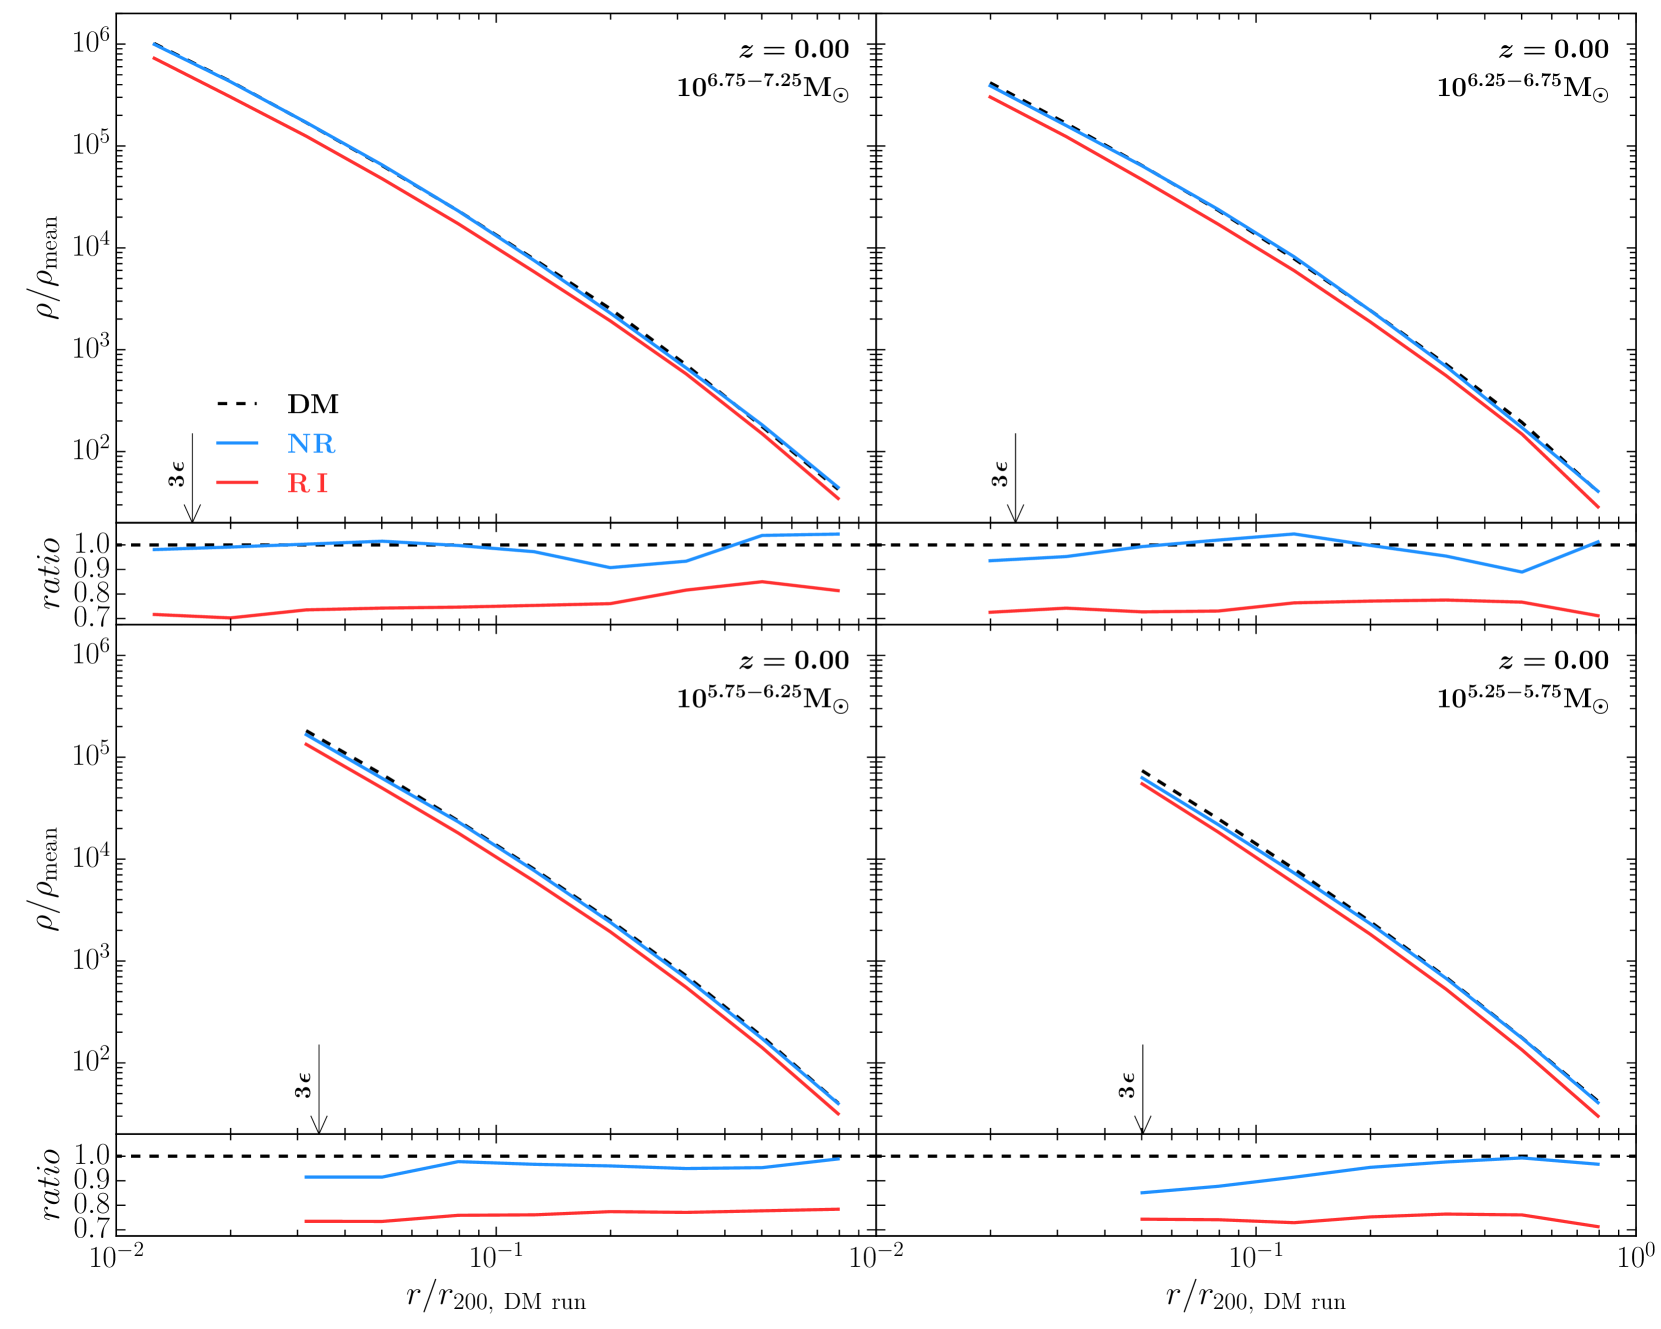
In this section we compare the radial density profiles of haloes in the NR and RI simulations with their counterparts in the DM simulation. To find counterparts we make use of the common dark matter particle IDs in the three simulations and assume a match if the DM halo and the halo from the other simulation share more than half of the same particles. The third column of Table 3 shows the number of DM haloes in bins of halo mass that have a counterpart in both the NR and RI simulations. Almost all haloes in the mass bins we study are successfully matched. We focus on four mass bins, each of width 0.5dex, in the mass range ().
In Fig. 4, the haloes are binned by their mass in the DM simulation, and we compare the bin averaged total matter density profiles of the matched haloes for the three simulations. When comparing the density profiles in the three simulations we must bear in mind that individual profiles are affected near the centre by the gravitational softening and by two-body relaxation (Power et al., 2003; Navarro et al., 2004). Recent work by Zhang et al. (2019) suggests that the Power et al. radius (Power et al., 2003) can be too conservative by about a factor of two. In the plots we mark the radius corresponding to three times the gravitational softening, which for our simulations is close to half the Power et al. radius.
In the highest mass bin, the density profiles in the NR simulation are virtually unaffected by the inclusion of baryons. There is a trend, however, in all but the highest mass bin for the central densities to be lower than those of the DM counterparts by 5-15%. The concentration in the two largest mass bins are barely changed.
By contrast, the density profiles in the RI simulation are strongly affected in all the mass bins. The total total matter density at a fixed physical radius is 25-30% lower than in the DM case near the centre and 15-20% lower close to . Fitting the density profiles111We are only able to fit the halo profiles in two largest mass bins () because of resolution limitations: in the smaller haloes, , the radius where the logarithmic slope is -2, is smaller than 3, which would cause the fits to be unreliable. with either an NFW profile (Navarro et al., 1996) or an Einasto profile (Einasto, 1965; Navarro et al., 2004) with fixed following Wang et al. (2020), we find that the concentration parameter in the RI haloes is also typically reduced by .
3.4 Mass accretion history
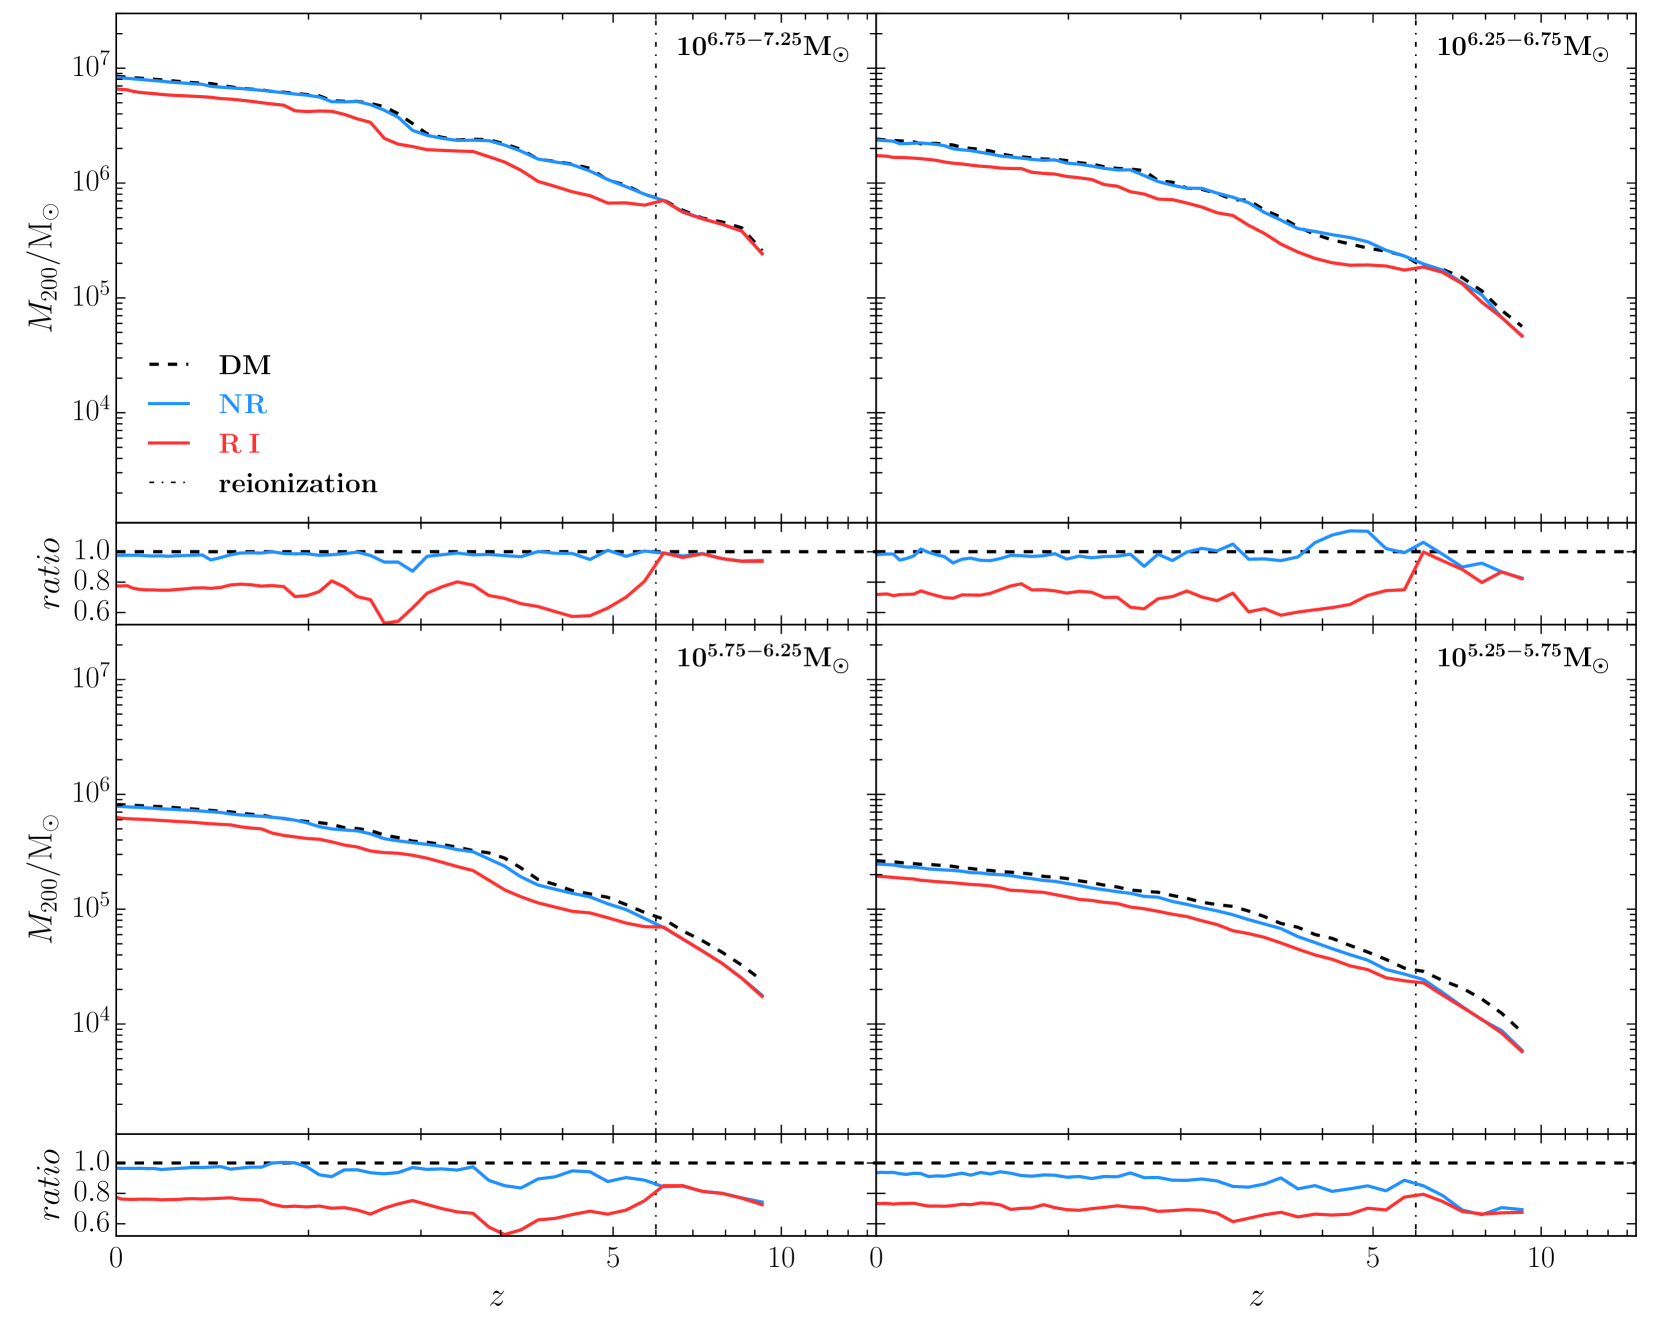
We investigate the mass accretion histories of haloes using the same matched samples as the previous subsection – apart from excluding a small number of haloes that have split off a larger halo in the recent past. This makes only a small difference to the sample sizes which are listed in the fourth column of Table 3. The mass accretion histories, computed by following the main branch of the merger trees (produced by gadget-4) back from the present, are shown in Fig. 5.
For the NR simulation, in the two largest mass bins (), haloes follow very similar mass accretion histories to their counterparts in the DM simulation, showing that just including non-radiative gas makes little difference. For the two smaller mass bins (), haloes in the NR simulation are only smaller than their counterparts in the DM simulation at , while the difference is much larger, , at earlier redshifts (e.g. ). The agreement between the NR and DM mass accretion histories improves once the halo mass exceeds regardless of the redshift when this occurs, which suggests that this effect is numerical rather than physical in the non-radiative case. This is discussed further in Section 4.
For the RI simulation, the history before reionization is almost the same as in the NR simulation, suggesting that cooling processes have no significant impact on haloes of these masses. However, as soon as reionization is triggered, haloes in the RI simulation begin to follow different tracks from their NR counterparts; this reflects the fact that gas is no longer able to accrete onto low-mass haloes.
3.5 Annihilation signals
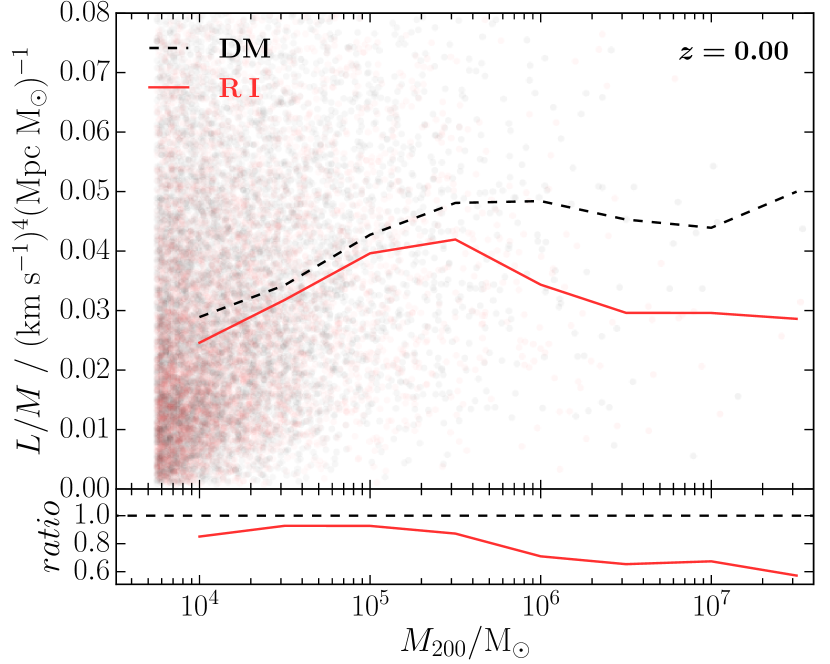
We have found that the presence of baryons reduces both the abundance and the concentration of haloes. Both effects lead to a reduction of any annihilation signal coming from the smooth component of haloes and subhaloes. We follow Wang et al. (2020), estimating the luminosity per unit mass of a halo from:222This formula should be corrected by multiplying by , as baryons do not contribute to dark matter annihilation. However, in the cases we focus on here (i.e. comparing the RI and DM runs at ), all haloes are almost empty of baryons.
| (1) |
Here, the halo maximum circular velocity and the radius where this maximum occurs are denoted by and , respectively.
In Fig. 6 we quantify the reduction in for mini-haloes in the RI simulation compared to the DM simulation. We see from the lower subpanel that the signal decreases by in the mean for (though we note there are only a few haloes in these mass bins), and by at . Convolving with the suppression of the halo mass function in the RI simulation, we estimate that the annihilation signal per unit volume in the RI case is lower than in the DM-only case when averaged over haloes in the mass range to .
4 Resolution and gas pressure effects in simulations with non-radiative gas
We expect that haloes in our NR simulations that are not resolved with a sufficient number of SPH particles will have artificially low gas fractions. There is also a physical effect arising from the choice of the initial entropy of the non-radiative gas which leads to the gas being too hot for small haloes to be able to capture or retain it. In this subsection we make use of additional non-radiative simulations to separate the numerical and physical effects and to establish their relative importance for the results presented in Section 3.2.
In Appendix A we derive a simple expression for a characteristic halo mass, , (eqn. 21) below which we expect haloes to be largely gas-free because of the effects of gas pressure. This scale is a function of redshift and of the initial entropy of the non-radiative gas, or equivalently of the temperature of the gas in our initial conditions at .
We make use of a suite of cosmological simulations within periodic boxes from Liao et al. (2017) to test this characteristic mass scale. These are suitable for our purposes because they include simulations differing only in the gas temperature in the initial conditions. The parameters of the simulations are listed in Table 4. The values of the cosmological parameters are close to, but not identical to those of the VVV simulations and we do not expect the differences to be important for our purposes.
| Name of simulations | ] | ] | |||
|---|---|---|---|---|---|
| Ln | |||||
| Fn | |||||
| Hn | |||||
| Lf | |||||
| Ff | |||||
| Hf |
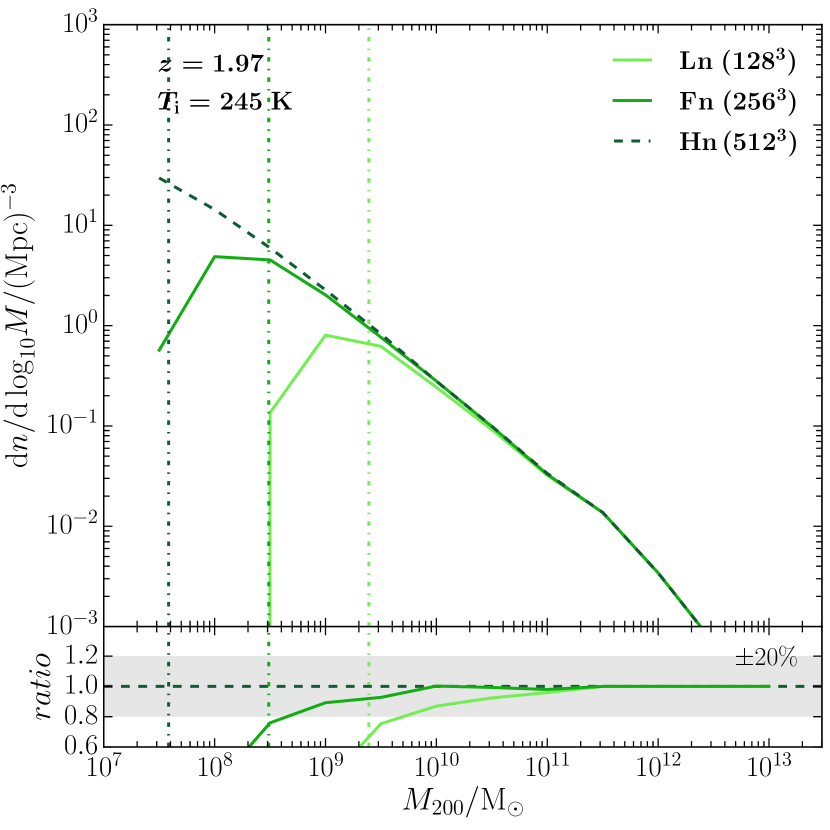
We test numerical convergence in halo properties in the absence of significant effects from the initial gas pressure using the Ln, Fn and Hn simulations, which have the same initial redshift and temperature (i.e. , ) as our fiducial simulations but substantially lower resolution.. We define convergence to be agreement within 20% with a simulation of higher resolution. Fig. 7 shows that the halo mass function converges at a mass corresponding to dark matter particles.
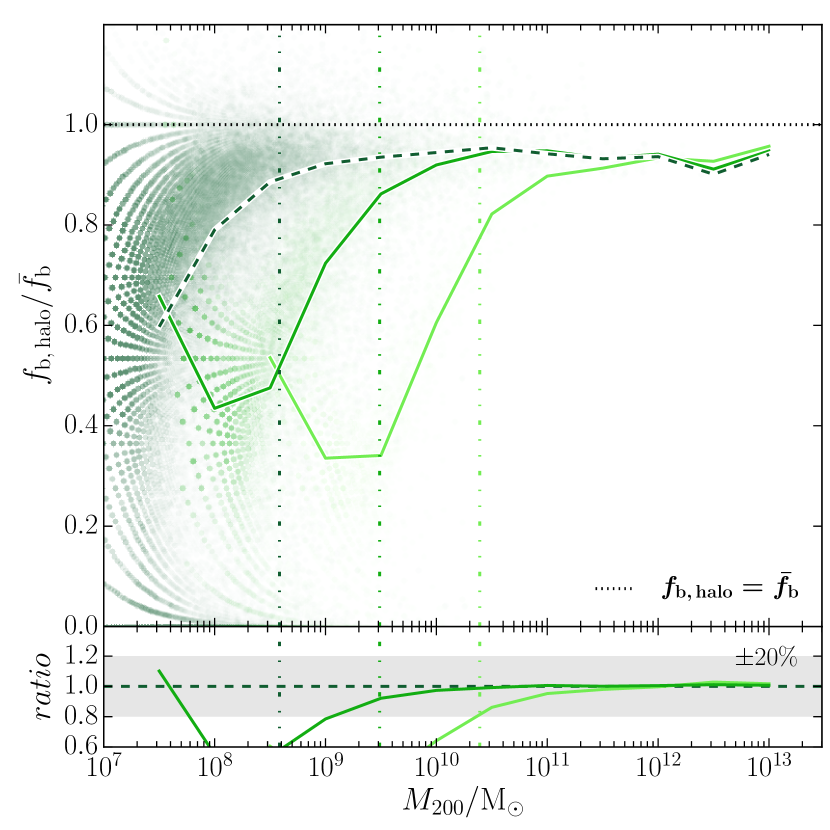
In all three simulations, the baryonic fraction starts to drop below the cosmic value at radii containing fewer then 500 dark matter particles. Even for the highest resolution case (Hn) this is at halo masses far above those where there is any appreciable drop in our fiducial NR simulation (see Fig. 3). For all these simulations, the model of Appendix A predicts that physical effects due to the finite entropy of the gas will lead to a characteristic mass of , well below the mass scale where the baryonic fraction drops in any of these simulations, indicating that our adopted initial gas temperature is too low to have any physical effect on the baryonic fractions of haloes, in particular, also in our fiducial NR simulation.
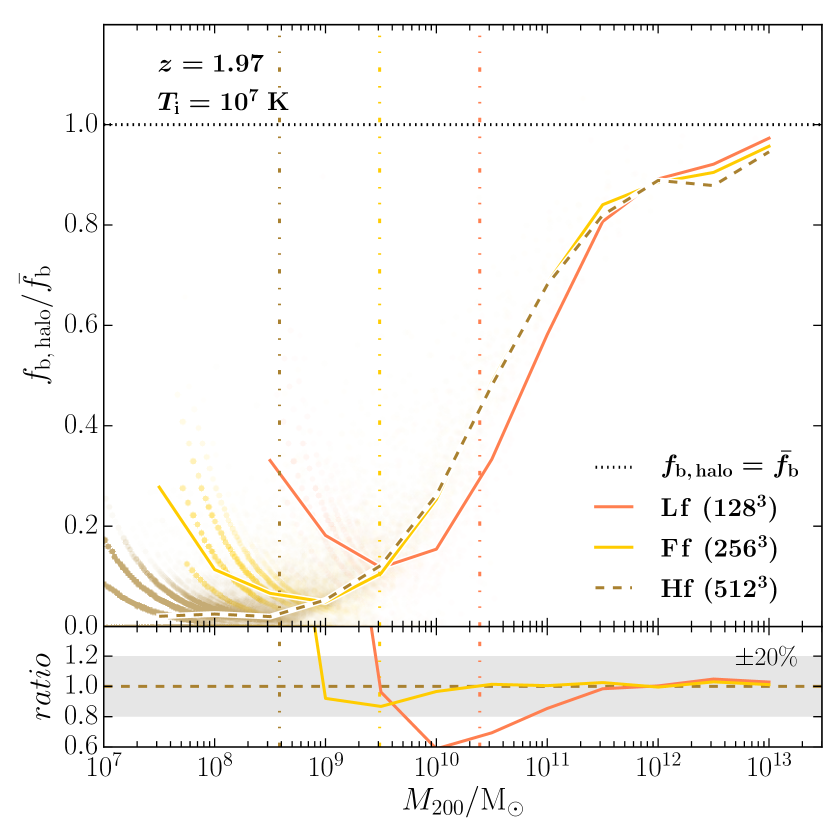
In Fig. 8, we show that non-radiative simulations in which the initial gas temperature is much higher, , do show an authentic drop in baryonic fraction. The baryonic fraction resolved in the Ff simulation () is closely aligned with that in the Hf simulation (). Interpolating values of , defined by , we find and for the Ff and Hf simulations respectively. a factor of just 1.3 larger than our predicted value, . The lowest resolution run, Lf, has comparable to the predicted value of and it clearly overestimates the characteristic mass. Thus, inferring the baryonic fraction reliably in a non-radiative simulation requires the characteristic mass to be resolved with at least 500 dark matter particles. This is consistent with the conclusion of Okamoto et al. (2008) that the drop in baryonic fraction that they found prior to reionization below ( in their ‘reference’ simulation) was a numerical artefact.
The characteristic mass, , as a function of redshift for our main simulation is for haloes with a concentration (see Appendix A). This is well below the minimum requirement of 500 dark matter particles per halo to avoid numerical suppression of the halo baryonic fraction at all redshifts of interest here. We do expect that the initial gas entropy will affect the baryon fractions in very small haloes but simulations of higher numerical resolution are needed to show this.
We carried out such a simulation, NR-H, making use of higher resolution initial conditions created originally for the VVV project (the L4-pilot simulation). The mass of the dark matter particles in the high-resolution region of this resimulation is , while the mass of gas particles is and the softening length for all particles is . Once again we took at . The characteristic mass, , is well resolved at all redshifts in this case, so we would expect small mass haloes with more than 500 dark matter particles to show a genuine suppression of the baryon fraction due to the initial gas entropy. This NR-H simulation was expensive and was stopped at .
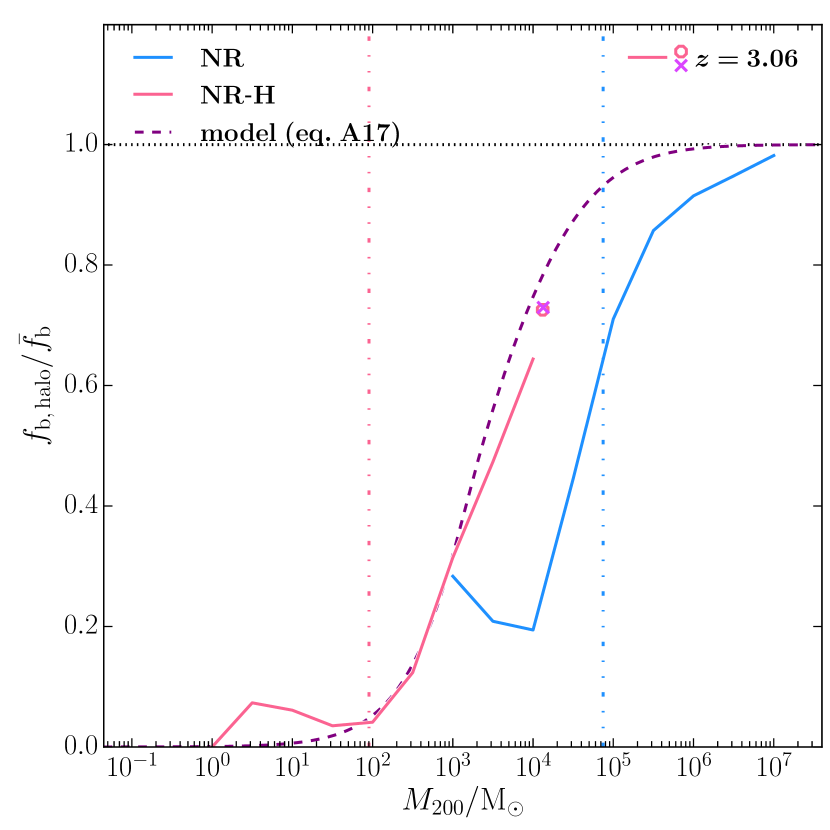
In Fig. 9, we compare the baryonic fraction in the NR and NR-H simulations with our model prediction at . The value found for NR-H matches the model prediction, remarkably well, and, indeed, the model matches the full shape of the simulated suppression as a function of halo mass quite accurately. We have checked that similar agreement occurs also at redshifts and and we list the characteristic masses in Table LABEL:tab:tableA1. Finally we also resimulated the largest halo in the NR-H simulation at with eight times higher resolution. We show the baryonic fractions found for this one halo in the two simulations as symbols in Fig. 9. The two symbols agree very well with each other and with our theoretical prediction.
In conclusion, we have determined that at least 500 dark matter particles per halo are needed in non-radiative simulations to obtain the baryonic fraction of small haloes to better than 20%. Provided this condition is met, the baryonic fraction of haloes is insensitive to large increases in numerical resolution and thus appears well converged. We have also shown that the effect of the initial gas entropy on the baryonic fraction of small haloes can be seen, given sufficient numerical resolution, and that both the dependence of this suppression on halo mass and the characteristic mass at which it occurs are well reproduced by the simple physical model of Appendix A. It is notable that the halo mass function is less sensitive to resolution; we find that a minimum of just 50 particles is sufficient to determine it in non-radiative simulations to an accuracy of 20%.
5 Discussion
The NR and RI simulations model the baryons in a very simple way. In this section we consider some of the limitations of our simulations and how the effects of additional physical processes that have not been modelled might affect our results.
5.1 Applicability of our results to haloes of lower masses
We have focused on mini-haloes with mass between but we expect in the cold dark matter cosmogony that there will be haloes of much smaller mass down to the (unknown) cut-off in the matter power spectrum. From our model predictions in Appendix A and the results of the highest resolution simulations shown in Fig. 9, we find that the gas fractions of haloes with masses below (at ) or (at ) are very low in non-radiative simulations simply because the gas entropy is too high for such small haloes to have accreted any gas. We expect that this would lead to an even stronger suppression of the low-redshift halo mass function and of low-redshift halo concentrations relative to a dark matter-only simulation than we saw for haloes in the range of in the RI simulation, where reionization drives gas out of all haloes after redshift 6.
5.2 Effect of early relative streaming motions between baryons and dark matter
A streaming velocity, , between dark matter and baryons is generated at early times because the baryons are coupled strongly to radiation much longer than the dark matter. The typical root-mean-square value of at the recombination time is , and then decays as (Tseliakhovich & Hirata, 2010). This streaming velocity is thought to have a major impact on the formation of the first baryonic structures: Tseliakhovich & Hirata (2010) show that it would suppress the halo mass function for haloes at by . A similar conclusion may be found in McQuinn & O’Leary (2012) at . According to Greif et al. (2011), Fialkov (2014) and Schauer et al. (2019), the streaming velocity may hinder the formation of the first stars.
Although the effects of the streaming velocity are important at high redshift, they become less so at lower redshift. For example, Naoz et al. (2012) show that the halo abundance at at is almost unaffected for ; to make a difference of at the same redshift, an extreme value of as high as would be required for an appreciable effect, which would be a rare case according to Ahn (2016) and Ahn & Smith (2018). Thus, while streaming might induce a sizeable suppression of halo formation and baryonic fractions at , the majority of haloes in our void region form much later than this and we expect only minor changes from our results at .
5.3 Molecular hydrogen cooling
Another issue that needs addressing is the possibility of Pop III star formation before reionization. These first stars could produce additional feedback that could expel baryons from haloes at early times. As we focus on an extremely underdense region, halo growth is suppressed (e.g. in our simulations, the mass of the largest halo only exceeds at ), leading to delayed Pop III star formation. Most previous studies (e.g. Yoshida et al., 2003; Reed et al., 2005; Gao et al., 2007; Wise et al., 2008) have focussed on regions of average or above average density. For example, Regan (2023) performed zoom simulations of three clusters and one region of cosmic mean density, and found Pop III star formation before in all three clusters, while the cosmic mean density region showed a slower halo mass accretion history and no sign of star formation when the simulation ended at .
In their hydrodynamical simulations, Yoshida et al. (2003) found a critical halo mass, , for Pop III star formation to occur at (mostly at the intersections of filaments). Gao et al. (2007, 2010) suggested a threshold virial temperature, , for molecular hydrogen production to be boosted and cooling to become efficient, allowing the first stars to form with a redshift delay, , in haloes whose mass increases from to between . By comparison, the largest haloes in our simulation have masses of , and , virial temperatures of , and at and 10.08 respectively. This suggests that first star formation could occur in our simulation at .
However, the possibility of background Lyman-Werner (LW) radiation released by an earlier generation of Pop III stars complicates the situation considerably. Yoshida et al. (2003) found that even a low value of LW radiation of (where denotes the intensity of the radiation in units of ) could increase the critical virial temperature from to due to the dissociation of molecular hydrogen by the background photons; this could, however, be largely compensated by self-shielding. They also found that a value of would almost entirely prevent gas from cooling and collapsing. Reed et al. (2005) found a similar result for and argued that shielding of LW radiation is unimportant in this case. (The transmission factor is reduced to 0.1 only over a large distance, ; by comparison, the radius of our high resolution region at is ).
In our case, the first stars are very likely to form outside our underdense high-resolution region before the haloes in our simulations gain enough mass to form stars. The outcome is highly uncertain due to the competing effects (Bromm & Larson, 2004; Reed et al., 2005) of: i) LW radiation; ii) X-ray and UV radiation, which may increase the free electron density and catalyze molecular hydrogen production; iii) the explosion of the first SNe and the associated blast wave into the surrounding intergalactic gas which may remove some or all of the gaseous envelopes of haloes, preventing further cooling; iv) metal enrichment which enhances cooling; v) photodetachment, which suppresses the production of molecular hydrogen. Thus, whether or not Pop III stars could form in our simulation may depend crucially on the influence of regions outside our simulation.
6 Conclusion
In this paper we study the properties of mini-haloes () using a suite of very high resolution hydrodynamic simulations (, ). This work builds upon the methods and results of the VVV multi-zoom simulation project (Wang et al., 2020) that modelled the formation of haloes of all masses in a dark matter only universe up to the present day. Our simulations consist of a "DM simulation" (only dark matter), an "NR simulation" (non-radiative gas), and an "RI simulation" where radiative cooling and photoheating of gas by a UV background is turned on at leading to prompt reionization. We make use of initial conditions created originally for the VVV project and model the formation of mini-haloes in a low density region approximately 1 Mpc across today.
On the scale of the region as a whole, the large-scale structure at the present day is very similar in all three simulations. The gas in the NR simulation traces the dark matter closely at all times. However, after reionization the gas in the RI simulation is heated to the point that it becomes diffuse and smooth on the scale of even the largest haloes in the region.
The halo mass function and baryonic fraction are almost identical in the NR and RI simulations before reionization, demonstrating that cooling has only a minor effect on haloes in this mass range. After , gas flows out of all haloes in the RI simulation leading to a suppression of the halo mass function by at .
In the NR simulation we see a drop in the baryonic fraction at , but we conclude that this is mostly a numerical artefact. In Section 4 we show that the baryonic fraction in non-radiative simulations is suppressed by numerical effects in haloes with less than 500 dark matter particles. We also show that non-radiative simulations with sufficient resolution are able to model the physical suppression of the baryonic fraction due to the initial gas entropy. In Appendix A we set up a simple analytic model for this suppression as a function of halo mass and redshift and show that it reproduces quite well the evolution found in simulations with sufficient numerical resolution. Thus, small haloes ( at ; at ) will never be able to capture gas, even in non-radiative runs without reionization. In consequence, the streaming velocity between baryons and dark matter at early times will have little effect on such small haloes.
We identify corresponding haloes in our three different simulations in order to study baryon effects on individual haloes, comparing results from the NR and RI simulations with those from the reference DM simulation. The density profiles and mass accretion histories of haloes more massive than are very similar in the NR and DM simulations, while for smaller haloes, , the density profile in the central regions, 0.1, is lower in the NR case; in this mass range, halo masses at high redshift are suppressed by up to in the NR case. In the RI simulation, the loss of gas from haloes gives rise to shallower density profiles and a reduction of in mass at low redshift over the entire mass range, showing that reionization reduces halo potential wells.
The RI simulation allows an improved prediction for dark matter annihilation signals from the smooth dark matter component of haloes. We find that the lowered abundance and concentration combine to reduce the annihilation rate per volume for mini-haloes in the mass range by .
Acknowledgements
We acknowledge support from the National Natural Science Foundation of China (Grant No. 11988101, 11903043, 12073002, 11721303) and the K. C. Wong Education Foundation. HZ acknowledges support from the China Scholarships Council (No. 202104910325). SB is supported by the UK Research and Innovation (UKRI) Future Leaders Fellowship [grant number MR/V023381/1]. CSF acknowledges support by the European Research Council (ERC) through Advanced Investigator grant, DMIDAS (GA 786910). JW acknowledges the support of the research grants from the Ministry of Science and Technology of the People’s Republic of China (No. 2022YFA1602901), the China Manned Space Project (No. CMS-CSST-2021-B02), and the CAS Project for Young Scientists in Basic Research (Grant No. YSBR-062). This work used the DiRAC@Durham facility managed by the Institute for Computational Cosmology on behalf of the STFC DiRAC HPC Facility (www.dirac.ac.uk). The equipment was funded by BEIS capital funding via STFC capital grants ST/K00042X/1, ST/P002293/1, ST/R002371/1 and ST/S002502/1, Durham University and STFC operations grant ST/R000832/1. DiRAC is part of the UK National e-Infrastructure.
Data availability
The data presented in this article will be shared upon reasonable request to the corresponding author.
References
- Ahn (2016) Ahn K., 2016, ApJ, 830, 68
- Ahn & Smith (2018) Ahn K., Smith B. D., 2018, ApJ, 869, 76
- Angulo et al. (2017) Angulo R. E., Hahn O., Ludlow A. D., Bonoli S., 2017, MNRAS, 471, 4687
- Avila-Reese et al. (2003) Avila-Reese V., Colín P., Piccinelli G., Firmani C., 2003, ApJ, 598, 36
- Banik et al. (2021) Banik N., Bovy J., Bertone G., Erkal D., de Boer T. J. L., 2021, MNRAS, 502, 2364
- Benitez-Llambay & Frenk (2020) Benitez-Llambay A., Frenk C., 2020, MNRAS, 498, 4887
- Bergström et al. (1999) Bergström L., Edsjö J., Gondolo P., Ullio P., 1999, Phys. Rev. D, 59, 043506
- Bertone et al. (2005) Bertone G., Hooper D., Silk J., 2005, Phys. Rep., 405, 279
- Bode et al. (2001) Bode P., Ostriker J. P., Turok N., 2001, ApJ, 556, 93
- Bond et al. (1991) Bond J. R., Cole S., Efstathiou G., Kaiser N., 1991, ApJ, 379, 440
- Bromm & Larson (2004) Bromm V., Larson R. B., 2004, ARA&A, 42, 79
- Crain et al. (2007) Crain R. A., Eke V. R., Frenk C. S., Jenkins A., McCarthy I. G., Navarro J. F., Pearce F. R., 2007, MNRAS, 377, 41
- Dalal & Kochanek (2002) Dalal N., Kochanek C. S., 2002, ApJ, 572, 25
- Davis et al. (1985) Davis M., Efstathiou G., Frenk C. S., White S. D. M., 1985, ApJ, 292, 371
- Delos & White (2023) Delos M. S., White S. D. M., 2023, J. Cosmology Astropart. Phys., 2023, 008
- Diemand et al. (2005) Diemand J., Moore B., Stadel J., 2005, Nature, 433, 389
- Einasto (1965) Einasto J., 1965, Trudy Astrofizicheskogo Instituta Alma-Ata, 5, 87
- Fialkov (2014) Fialkov A., 2014, International Journal of Modern Physics D, 23, 1430017
- Frenk & White (2012) Frenk C. S., White S. D. M., 2012, Annalen der Physik, 524, 507
- Gao et al. (2007) Gao L., Yoshida N., Abel T., Frenk C. S., Jenkins A., Springel V., 2007, MNRAS, 378, 449
- Gao et al. (2010) Gao L., Theuns T., Frenk C. S., Jenkins A., Helly J. C., Navarro J., Springel V., White S. D. M., 2010, MNRAS, 403, 1283
- Gnedin (2000) Gnedin N. Y., 2000, ApJ, 542, 535
- Grand & White (2021) Grand R. J. J., White S. D. M., 2021, MNRAS, 501, 3558
- Greif et al. (2011) Greif T. H., White S. D. M., Klessen R. S., Springel V., 2011, ApJ, 736, 147
- Haardt & Madau (1996) Haardt F., Madau P., 1996, ApJ, 461, 20
- Ibata et al. (2002) Ibata R. A., Lewis G. F., Irwin M. J., Quinn T., 2002, MNRAS, 332, 915
- Ishiyama et al. (2010) Ishiyama T., Makino J., Ebisuzaki T., 2010, ApJ, 723, L195
- Johnston et al. (2002) Johnston K. V., Spergel D. N., Haydn C., 2002, ApJ, 570, 656
- Katz et al. (1996) Katz N., Weinberg D. H., Hernquist L., 1996, ApJS, 105, 19
- Koopmans (2005) Koopmans L. V. E., 2005, MNRAS, 363, 1136
- Liao et al. (2017) Liao S., Gao L., Frenk C. S., Guo Q., Wang J., 2017, MNRAS, 470, 2262
- McQuinn & O’Leary (2012) McQuinn M., O’Leary R. M., 2012, ApJ, 760, 3
- Naoz et al. (2012) Naoz S., Yoshida N., Gnedin N. Y., 2012, ApJ, 747, 128
- Navarro et al. (1996) Navarro J. F., Frenk C. S., White S. D. M., 1996, ApJ, 462, 563
- Navarro et al. (2004) Navarro J. F., et al., 2004, MNRAS, 349, 1039
- Okamoto et al. (2008) Okamoto T., Gao L., Theuns T., 2008, MNRAS, 390, 920
- Planck Collaboration et al. (2014) Planck Collaboration et al., 2014, A&A, 571, A16
- Planck Collaboration et al. (2020) Planck Collaboration et al., 2020, A&A, 641, A6
- Power et al. (2003) Power C., Navarro J. F., Jenkins A., Frenk C. S., White S. D. M., Springel V., Stadel J., Quinn T., 2003, MNRAS, 338, 14
- Press & Schechter (1974) Press W. H., Schechter P., 1974, ApJ, 187, 425
- Reed et al. (2005) Reed D. S., Bower R., Frenk C. S., Gao L., Jenkins A., Theuns T., White S. D. M., 2005, MNRAS, 363, 393
- Rees (1986) Rees M. J., 1986, MNRAS, 218, 25P
- Regan (2023) Regan J., 2023, The Open Journal of Astrophysics, 6, 12
- Roszkowski et al. (2018) Roszkowski L., Sessolo E. M., Trojanowski S., 2018, Reports on Progress in Physics, 81, 066201
- Sawala et al. (2013) Sawala T., Frenk C. S., Crain R. A., Jenkins A., Schaye J., Theuns T., Zavala J., 2013, MNRAS, 431, 1366
- Schaller et al. (2015) Schaller M., et al., 2015, MNRAS, 451, 1247
- Schauer et al. (2019) Schauer A. T. P., Glover S. C. O., Klessen R. S., Ceverino D., 2019, MNRAS, 484, 3510
- Schaye et al. (2015) Schaye J., et al., 2015, MNRAS, 446, 521
- Sheth et al. (2001) Sheth R. K., Mo H. J., Tormen G., 2001, MNRAS, 323, 1
- Springel et al. (2001) Springel V., White S. D. M., Tormen G., Kauffmann G., 2001, MNRAS, 328, 726
- Springel et al. (2005) Springel V., et al., 2005, Nature, 435, 629
- Springel et al. (2008) Springel V., et al., 2008, Nature, 456, 73
- Springel et al. (2021) Springel V., Pakmor R., Zier O., Reinecke M., 2021, MNRAS, 506, 2871
- Stoehr et al. (2003) Stoehr F., White S. D. M., Springel V., Tormen G., Yoshida N., 2003, MNRAS, 345, 1313
- Taylor & Navarro (2001) Taylor J. E., Navarro J. F., 2001, ApJ, 563, 483
- Thoul & Weinberg (1996) Thoul A. A., Weinberg D. H., 1996, ApJ, 465, 608
- Tseliakhovich & Hirata (2010) Tseliakhovich D., Hirata C., 2010, Phys. Rev. D, 82, 083520
- Vogelsberger et al. (2014) Vogelsberger M., et al., 2014, MNRAS, 444, 1518
- Wang et al. (2020) Wang J., Bose S., Frenk C. S., Gao L., Jenkins A., Springel V., White S. D. M., 2020, Nature, 585, 39
- White & Frenk (1991) White S. D. M., Frenk C. S., 1991, ApJ, 379, 52
- Wise et al. (2008) Wise J. H., Turk M. J., Abel T., 2008, ApJ, 682, 745
- Yoshida et al. (2003) Yoshida N., Abel T., Hernquist L., Sugiyama N., 2003, ApJ, 592, 645
- Zhang et al. (2019) Zhang T., Liao S., Li M., Gao L., 2019, MNRAS, 487, 1227
- Zheng et al. (2024) Zheng H., Bose S., Frenk C. S., Gao L., Jenkins A., Liao S., Liu Y., Wang J., 2024, MNRAS, 528, 7300
Appendix A The effect of initial entropy on halo gas density profiles in non-radiative simulations
Let us consider the entropic function , defined for a non-relativistic gas with pressure and density by . In the absence of significant heating or cooling, gas evolves adiabatically and remains constant except at shocks, where it always increases. Thus in non-radiative simulations of the kind studied in this paper, S must everywhere be at least as large as the value, , defined by the initial density and temperature of the gas.
On the other hand, well-resolved non-radiative cosmological simulations in which is negligibly small produce haloes in which the baryon fraction is close to the cosmological value and the gas density profile is very similar to that of the dark matter, hence to that found in dark matter only simulations. Thus, halo accretion shocks have just the strength needed to produce the profile, , which corresponds to in hydrostatic equilibrium, where is the total mass density. Taylor & Navarro (2001) made the remarkable discovery that for haloes with an NFW total density profile, these conditions require to be very close to a power law.
In our own non-radiative simulations (NR, NR-H and the simulations of Table 4) we find that the gas and dark matter densities do track each other in high-mass haloes and at large radii, resulting in near power-law behaviour for , but that at small radii where is predicted by inward extrapolation of the large-radius behaviour. This motivates a simple analytic model where haloes are taken to have NFW mass profiles, the gas and dark matter densities are assumed parallel at large radii where this implies , and the gas is adiabatic with at smaller radii.
For a spherical system in hydrostatic equilibrium, the potential , the gas density and the gas pressure satisfy
| (2) |
Assuming , where is the total mass density profile, and is a constant, the pressure profile can be obtained by integration,
| (3) |
If we now take and its associated to have NFW form, we have
| (4) |
the enclosed mass within radius is
| (5) |
and the potential is
| (6) |
Here and are the scale radius and the characteristic density of the NFW profile, and is the nondimensionalized radius.
Thus, the gas density profile is
| (7) |
the pressure profile is
| (8) |
and the entropic function profile is
| (9) |
where
| (10) |
and
| (11) |
Over the radial range of interest here, , is represented to better than 10% by the simple power law, . Thus, can be taken to be a power law with this index.333This behaviour agrees with that found by Taylor & Navarro (2001) for the pseudo-phase-space density of isotropic NFW dark matter haloes (which is ) after allowing for the different radial ranges fitted in the two studies.
Using the halo mass definition adopted throughout this paper, eq. 9 can be converted into
| (12) |
where is the mean matter density within the halo virial radius , the critical density of the Universe at present is , and is the halo concentration.
The initial entropy is given by
| (13) |
where , in which is the Boltzmann constant, denotes with representing the initial gas temperature (i.e. for the NR, NR-H, Ln, Fn, and Hn runs, and for the Lf, Ff, and Hf runs), and is the mean molecular weight of a physical gas particle in units of the proton mass, . For neutral gas composed of 76% hydrogen and 24% helium, and .
Normalising the entropic function profile by , we thus obtain
| (14) |
where is defined by
| (15) |
Equation 14 is only valid at radii greater than a core radius defined by . At smaller radii we assume the gas to be adiabatic with , so that . Integrating eq. 2 in this case gives
| (16) |
Using eq. 6 then gives the gas density profile at ,
| (17) |
where is the nondimensionalized core radius.
Integrating the gas density profile (eq. 17 at and eq. 7 at ) over , and dividing by , we obtain the factor by which the halo baryonic fraction is reduced relative to the cosmic baryon fraction ,
| (18) |
where is given by , hence,
| (19) |
and to keep consistency, is approximated by
| (20) |
Setting in eq. 18, we can solve for the characteristic mass , at which haloes have a baryonic fraction which is half of the cosmic mean. Over the range we find a good numerical fit to the result to be
| (21) |
Since (for NR, NR-H runs), the dependence of baryonic fraction on halo mass in eq. 18, and the characteristic mass444We provide a code at https://github.com/haonan-zheng/model_fbar_halo for readers to estimate the baryonic fraction and the characteristic mass , particularly the mass scale to consider effects of the thermal pressure arising from the initial gas entropy with any halo concentration, redshift, and cosmology. of eq. 21 are easily compared with the simulations discussed in the main text. Note that increases with because the nondimensionalized core radius increases with halo concentration. Between and , increases from 0.658 to 1.507. In Table 4, we compare our model with the simulations in the main text, and find it to be reasonably accurate although always somewhat low; in the worst case (for NR/NR-H at ) the prediction is about 50% lower than the characteristic mass estimated from the simulation.
| Name of simulations | |||||
|---|---|---|---|---|---|
| – | |||||
| NR, NR-H | |||||
| Ln, Fn, Hn | – | ||||
| Lf, Ff, Hf |