Limits on Dark Matter Compact Objects implied by Supermagnified Stars in Lensing Clusters
Abstract
Supermagnified stars are gravitationally lensed individual stars that are located close to a caustic of a lensing galaxy cluster, and have their flux magnified by a large enough factor (typically 1000) to make them detectable with present telescopes. The maximum magnification is limited by microlensing caused by intracluster stars or other compact objects, which create a network of corrugated critical lines with an angular width proportional to the surface density of microlenses. We consider a set of 9 cases of supermagnified stars reported in the literature, and derive an upper limit on the surface density of compact objects, such as primordial black holes, that might be present as a fraction of the dark matter in addition to known intracluster stars. Any such additional compact objects would widen the corrugated critical line network and therefore the width of the distribution of supermagnified stars around the modeled critical lines of the lens. We find that any compact objects, including primordial black holes, with masses above (for which the microcaustics are smaller than the typical angular size of supermagnified stars) cannot account for more than 3% of the dark matter.
keywords:
cosmology – gravitational lensing – dark matter – primordial black holes1 Introduction
Several independent observations have demonstrated beyond reasonable doubt that the known baryonic matter accounts for only 15% of the matter in the Universe, and the remaining 85% is a form of collisionless matter, designated as dark matter since the early work of Zwicky (1933) on galaxy clusters. The first clear evidence for dark matter initially came from galaxy rotation curves and galaxy velocities within groups (Ostriker et al., 1974; Einasto et al., 1974; Rubin et al., 1978), but present evidence has confirmed the existence of cold dark matter (meaning collisionless matter with no appreciable initial velocity dispersion; see Peebles, 1982) from a wide variety of other independent observations: the Cosmic Microwave Background fluctuations, which can be explained only with this ratio of baryonic to dark matter (Planck Collaboration et al., 2020; Madhavacheril et al., 2023; Tristram et al., 2024); lensing and X-ray observations of clusters that agree with the same baryon fraction and with the predicted density profiles (e.g., Umetsu et al., 2018); the large-scale structure galaxy correlations (Alam et al., 2021); and the agreement with the baryon density inferred from primordial nucleosynthesis (Grohs & Fuller, 2022).
Dark matter may be in the form of compact objects, which would be detectable through gravitational lensing. The baryon density derived from primordial nucleosynthesis and CMB observations rules out compact objects made of baryonic matter, but primordial black holes (PBH) formed in the early universe from the collapse of the hot plasma in regions of large amplitude primordial perturbations can account for cold dark matter without requiring the addition of any particles to the Standard Model of particle physics (Hawking, 1971). Although a number of astrophysical observations have constrained the contribution of PBH to the dark matter of the Universe (see Carr et al., 2021, for a review), the asteroid-mass window remains completely open. Higher mass PBH are ruled out as constituents of all the dark matter by microlensing surveys in the Magellanic Clouds, although a small fraction of 10% of dark matter in compact objects is still allowed (Alcock et al., 1998, 2001; Tisserand et al., 2007; Wyrzykowski et al., 2011a, b; Griest et al., 2014; Smyth et al., 2020).
Microlensing observations can provide independent constraints on the fraction of dark matter in compact objects from a different type of observations: highly magnified luminous stars lensed by clusters of galaxies that lie very near a lensing caustic. The high magnification allows a luminous star at a cosmological distance to be observed via our most powerful telescopes (Miralda-Escudé, 1991). The presence of compact objects near the lensing critical line of the cluster replaces the smooth critical line with a corrugated network of micro-critical lines, and the higher the surface density of compact objects, the broader this network over which magnified images reaching the highest magnifications may be observed (Venumadhav et al., 2017; Oguri et al., 2018). The discovery of such highly magnified stars (Kelly et al., 2018) has opened the door to use these observations to constrain the presence of any compact objects in the dark matter of a lensing cluster (plus any dark matter along the line of sight contributing to the lensing deflection), which is over the contribution from intracluster stars that are known to be present.
In this paper we analyze the most interesting cases of highly magnified stars that have been reported in the literature to derive an upper limit to the fraction of dark matter in lensing clusters that may be in the form of dark, compact objects. Section 2 reviews the properties of the network of micro-critical lines that are relevant to derive this upper limit, and introduces an analytical approximation for the density of supermagnified images around this network. Our method to derive an upper limit on compact objects is described in Section 3, together with the list of supermagnified stars we use in this work. Our results are presented in Section 4, and we summarize our conclusion in Section 6.
2 The distribution of highly magnified images around the smooth critical line
We now discuss the expected distribution of highly magnified images in the observed image plane of a lens. If we imagine first a smooth lens, without any small-scale structure, highly magnified images are located in the vicinity of the critical lines (or lines where the determinant of the magnification matrix is zero), which are smooth curves. A real lensing cluster has some fraction of its mass in compact objects: at the very least, intracluster stars are present. The macro-model of the lens is defined to have the surface density resulting from smoothing the point masses over a scale that is much smaller than the total lens deflection but much larger than the separation among neighboring microlenses.
We follow Venumadhav et al. (2017), hereafter V17, to establish our nomenclature and notation. The macro-critical line (MaCL) is defined as the critical line of the lens macro-model. The true critical line takes into account the individual lensing stars in the intracluster light without smoothing, and is called the micro-critical line (MiCL). The MiCL is highly complex, with a corrugated band of angular width where it meanders around many of the point masses. This angular width is given by (see eq. 22 in V17)
| (1) |
where is the contribution to the lensing convergence from the smoothed point masses, and is the angular gradient modulus of the eigenvalue of the macro-model magnification matrix that vanishes at the MaCL (note that is written as in V17). In the region within a separation from the MaCL, the MiCLs are connected to each other and form an intricate, corrugated network that is affected everywhere by many point masses. Outside the corrugated network (), the MiCLs are usually disconnected and form closed curves around each point mass, with the shape of the infinite symbol in the approximation of a single point mass with fixed external shear (Chang & Refsdal, 1979).
We first review the analytical derivation for how the maximum magnification reached in MiCL crossings depends on . The maximum magnification that is reached when a source star crosses a MiCL depends on the local eigenvalue gradient , computed including the point masses with no smoothing (whereas is the eigenvalue gradient of the macro-lens model). We assume all microlenses have the same mass, corresponding to an Einstein radius . The peak magnification is (eq. 27 in V17), where is the angle formed by the MiCL and the principal axis of the eigenvalue that cancels on the MiCL. The average separation between neighboring point masses is . Within the corrugated band, the MiCL is a curve meandering around point masses at this typical separation, where the typical shear from point masses is and its gradient is . Therefore, the distribution of peak magnifications of MiCL crossings is roughly constant within the width , with the typical value scaling as . We assume that the distribution of the angle is random and independent of , so it does not affect the proportionality relations we are discussing.
However, when moving outside the network at a separation from the MaCL, MiCLs are closed curves around individual point masses of a characteristic size , where the characteristic shear is now and the eigenvalue gradient is typically . The reason is that the shear of a point mass drops with the angular separation as , and the shear from microlenses that needs to be added to the macro-model to reach a zero of the magnification eigenvalue increases as . The peak magnification that is reached is therefore . When expressed as a function of the source separation from the macroscopic caustic, , the peak magnification drops as outside the corrugated band of micro-caustics, and is flat inside (see eq. 27 in V17).
Nevertheless, what we actually want to infer here is not the dependence of peak magnifications on , but the distribution of highly magnified images around the MaCL that reach a magnification above some threshold value, . For this purpose, we compute first the fraction of the image plane area where the magnification is above , in the limit of high when this fraction is small, as a function of . The region around each MiCL that has magnification has a width proportional to , assuming the source star is small enough to be fully inside the corresponding width around the microcaustic in the source plane. Within this fraction is roughly constant because the distribution of is also roughly independent of . Outside the corrugated band, the typical value of on MiCLs grows as , and the length of MiCLs is proportional to their typical size around each point mass, or to . Therefore, the fraction of the area with , scales as .
Because we have computed this area fraction at fixed , the density of micro-images above from sources that are randomly distributed in the source plane must also scale in the same way: roughly constant within and falling as at . Based on these approximations, we adopt the following model for computing likelihood functions of the observed positions of highly magnified images:
| (2) |
We note that this expression for the function assumes that the source star is small enough not to have reached the maximum possible magnification, which is produced when the stellar disk lies on the micro-caustic. Once this maximum magnification is reached, the probability density drops much faster with than in equation (2), because most MiCL become too small to reach the required magnification.
3 Corrugated band widths
Our goal in this section is to measure the distribution of separations from the MaCL in a sample of supermagnified stars, to derive an upper limit on the surface density of microlenses. For this purpose, we select a list of 12 supermagnified star candidates that had been reported as this work was being done, listed in Table 1. The list starts with the initial discovery of Icarus (Kelly et al. (2018)), up to the recent report of Mothra (Diego et al. (2023a)).
We consider these events are most likely to be true supermagnified stars. Supermagnified stars will follow the distribution of equation (2) only when their detection requires a minimum magnification threshold to make them visible, and the source size is small enough to remain unresolved when magnified (otherwise the images will be considered as typical surface brightness irregularities that are seen in many lensed galaxies). Single star candidates may be confused with other objects, mainly compact globular clusters that remain unresolved, but this is unlikely for most of these candidates since clusters that are compact enough are rare (see Welch et al., 2022a). The main criteria to consider these events as good supermagnified star candidates are photometric data that are consistent with the spectra of some of the most luminous stars (generally supergiants or very massive main-sequence stars), and variability on timescales of days that is consistent with being caused by MiCL crossings of sources with radii typical of the most luminous known stars, with a lack of observed counterimages which are typically not seen because of insufficient magnification.
These candidates generally satisfy these criteria. There are doubts, however, on the nature of the two Spock objects and Godzilla (events labeled as 2, 3 and 6 in Table 1), which may be more consistent with flaring luminous blue variables (similar to Eta Carinae) or recurrent novae (Rodney et al., 2018; Diego et al., 2022), especially in view of their high brightness. In addition, for these cases it is difficult to determine precisely where the MaCL lies (see in particular the discussion in Diego et al., 2022), and therefore the separation from the observed variable images to the MaCL. The position of the MaCL can often be determined rather precisely when pairs of images of surface brightness irregularities can be identified, and the MaCL must lie in the middle of such pairs when the pairs are much closer together compared to the size of the MaCL. This generally gives a high confidence in the modelled separations listed in column 9 of Table 1 for the remaining 9 cases, all of which have consistent photometry and variability to be microlensing events of single stars or compact systems of few stars (binaries or multiple hierarchical binaries).
For each of the events, we compute the convergence on the MaCL , the eigenvalue inverse gradient , and the angular separation from the image to the MaCL , using publicly available galaxy cluster lens models, such as the Hubble Frontier Fields (HFF) (Lotz et al. (2017)), CLASH (Postman et al. (2012)) or RELICS (Coe et al. (2019)) programs. For each model we use maps of the magnification matrix parameters, with the ratio of angular diameter distances rescaled to the source redshift to infer and . We evaluate the eigenvalue gradient at the MaCL, , at the point of the model MaCL which is connected to the star image by a segment that is parallel to the principal axis of the vanishing eigenvalue (i.e., the direction of image elongation). The derivatives of the convergence and shear along this segment are evaluated by subtraction of the values at points separated by times the pixel size in each lens model sky map. The presented values of and are obtained by averaging over the models listed in Table 1. Statistical dispersions are generally small ( for and for ), with exception of cases 1 and 5, where they reach values of and for and , respectively.
We list also the convergence contributed by stars that is implied by the intracluster light brightness near the image, , that is reported in the listed references for 6 of the 9 events. In most cases, values of the surface mass density in microlenses () is reported after assuming a Salpeter or Chabrier initial mass function, and we then compute . This measurement of is not reported yet for the other 3 cases.
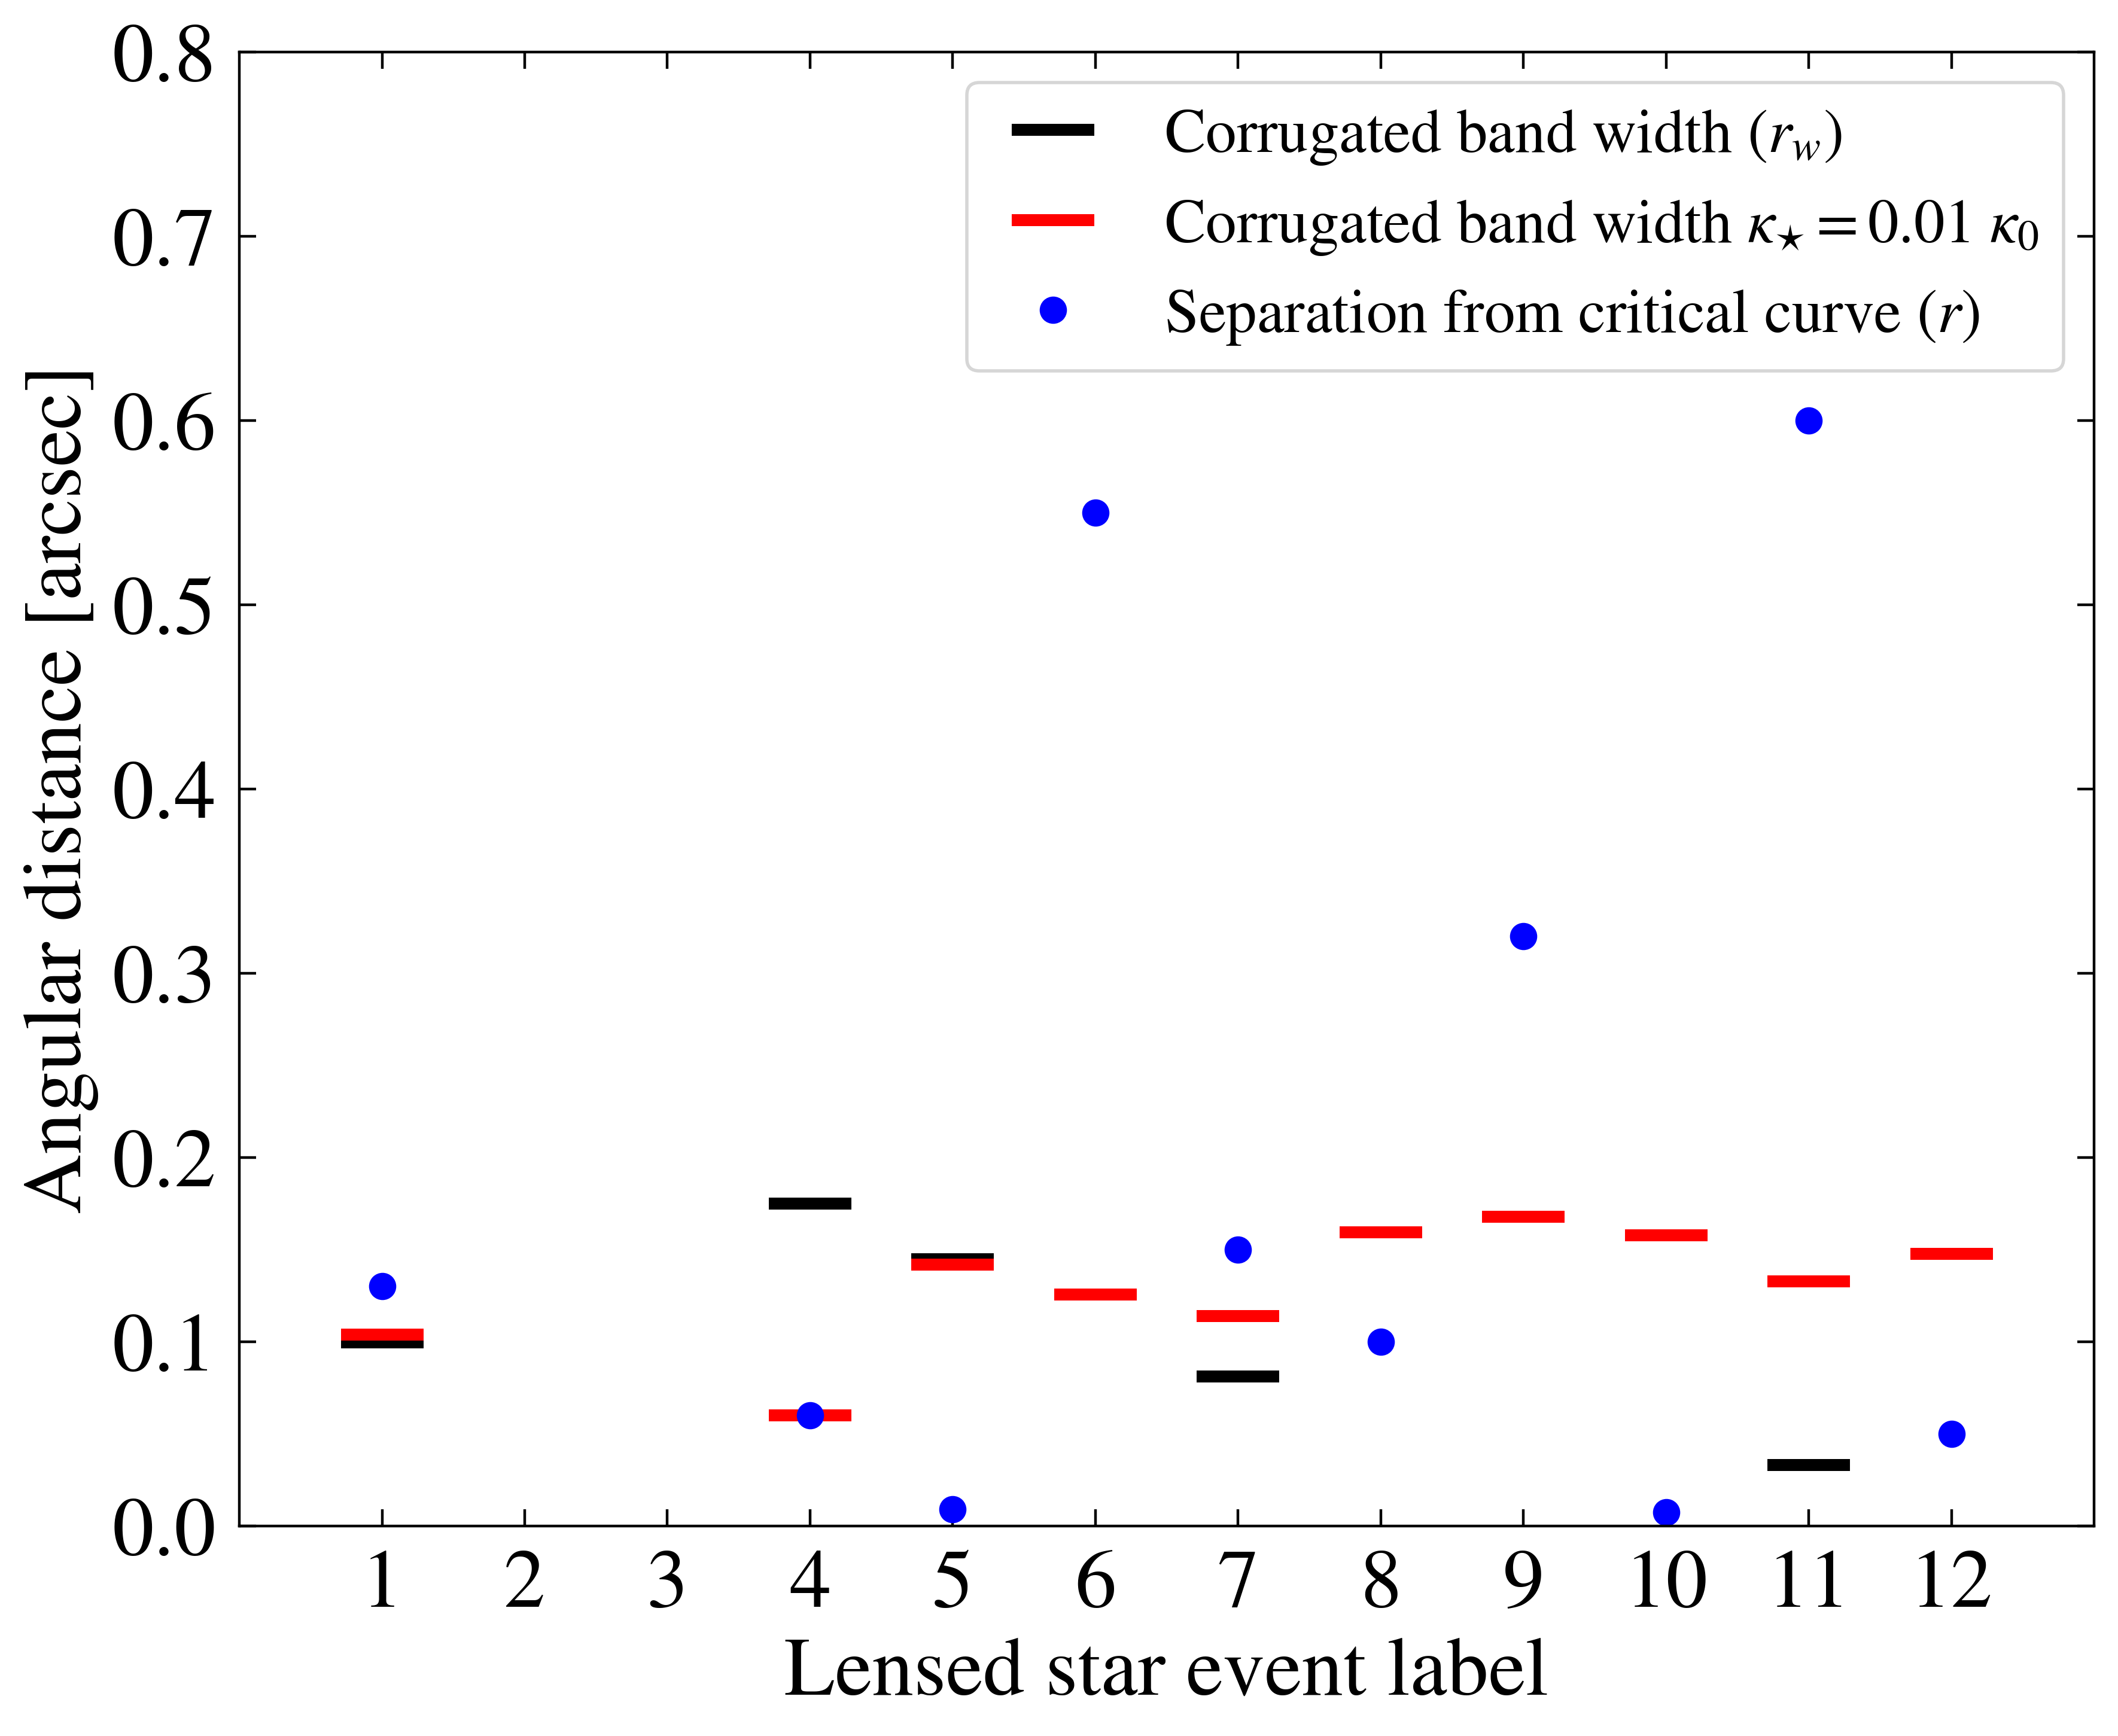
The predicted corrugated band half widths, , are then computed using equation (1), and are shown as black horizontal bars in Figure 1, for all the 9 events we use. For event number 6 we did not have the magnification matrix of the lens model available and the red bar indicates the mean of the other lenses.
We also show as red horizontal bars the same bandwith when we assume that compact objects account for 1% of the total mass surface density of the lensing model (i.e., ). The observed angular separations between the star images and each model MaCL are shown as blue dots.
We see that generally, the images are always observed at the expected separations from the MaCL, compared to . There are two cases where the image is substantially further, events 6 and 11. As discussed earlier, we do not consider event 6 in view of the modeling uncertainties; in fact the large separation from the MaCL for this event is quite unreliable and may actually be much smaller, as discussed by Diego et al. (2022). However, we think that event 11, and also event 9 with a more moderate separation outside the corrugated band, are real cases of microlensed stars that can occur further from the MaCL according to equation (2), as we further discuss below.
4 Results
| Event label | Lens cluster | Star name | AB mag | ||||||
|---|---|---|---|---|---|---|---|---|---|
| [arcsec] | [arcsec] | [mag] | |||||||
| 1 a | MACS J1149 | Icarus (Kelly et al., 2018) | 0.54 | 1.49 | 0.832 | 12.46 | 0.0080 | 0.13 | 25-26 (F125W) |
| 2 b | MACS J0416 | Spock-NW (Rodney et al., 2018) | 0.397 | 1.0054 | 0.742 | 10.29 | 0.0028 | … | 25-26.5 (F814W)) |
| 3 b | MACS J0416 | Spock-SE (Rodney et al., 2018) | 0.397 | 1.0054 | 0.629 | 10.29 | 0.0028 | … | 23-26.5 (F160W) |
| 4 c | MACS J0416 | Warhol (Kaurov et al., 2019) | 0.397 | 0.94 | 0.686 | 8.74 | 0.02 | 0.06 | 26.25 (F125W) |
| 5 d | WHL0137–08 | Earendel (Welch et al., 2022a) | 0.566 | 6.2 | 0.590 | 24.01 | 0.0060 | 0.009 | 27.2 (F150W) |
| 6 e | PSZ1 G311.65 | Godzilla (Diego et al., 2022) | 0.443 | 2.37 | … | … | … | 0.55 | 22 (F814W) |
| 7 f | Abell 2744 | LS7 (Chen et al., 2022) | 0.308 | 2.65 | 0.726 | 15.68 | 0.0052 | 0.15 | 27.05 (F150W) |
| 8 g | MACS J0647 | star-1 (Meena et al., 2023b) | 0.591 | 4.8 | 0.544 | 29.28 | … | 0.1 | 27.343 (F227W) |
| 9 g | MACS J0647 | star-2 (Meena et al., 2023b) | 0.591 | 4.8 | 0.549 | 30.59 | … | 0.32 | 28.330 (F227W) |
| 10 h | El Gordo | Quyllur (Diego et al., 2023b) | 0.870 | 2.1878 | 0.662 | 23.84 | … | 7.5 | 25.5 (F356W) |
| 11 i | Abell 370 | LS11 (Meena et al., 2023a) | 0.375 | 1.2567 | 0.703 | 18.89 | 0.0017 | 0.6 | 29.51 (F200LP) |
| 12 j | MACS J0416 | Mothra (Diego et al., 2023a) | 0.397 | 2.091 | 0.936 | 15.78 | … | 0.05 | 27.8 (F200W) |
- a
- b
-
c
Caminha (v4) (Caminha et al. (2017a)), GLAFIC (v4) (Oguri (2010), Kawamata et al. (2016), Kawamata et al. (2018)), Keeton (v4) (McCully et al. (2014), Ammons et al. (2014), Keeton (2010)), Sharon (v4 Cor.) (Johnson et al. (2014), Jullo et al. (2007)), Zitrin-ltm-gauss (v3) and Zitrin-nfw (v3) (Zitrin et al. (2009), Zitrin et al. (2013)).
- d
-
e
No public lens models found.
- f
- g
-
h
Diego (v1) (Diego et al. (2023b)).
- i
- j
We now proceed to a maximum likelihood estimate of the optimal value of to explain the distribution of separations in Figure 1, and an upper limit to the fraction of dark matter that may be composed of compact objects. Initially, we assume for simplicity that any compact objects accounting for part of the dark matter have a similar mass distribution as the intracluster stars, and in the next section we discuss the range of masses that our limit actually applies to.
Using the probability density function of equation (2), we define the likelihood function
| (3) |
where is the probability density of observing a stellar microlensing event at a distance from the MaCL of event , given a microlensing band of width . We are assuming that the total contribution from point masses to microlensing is the sum of the known intracluster light () and a hypothetical contribution from dark matter compact objects, such as primordial black holes (). We then find the optimal value of that maximizes this likelihood function.
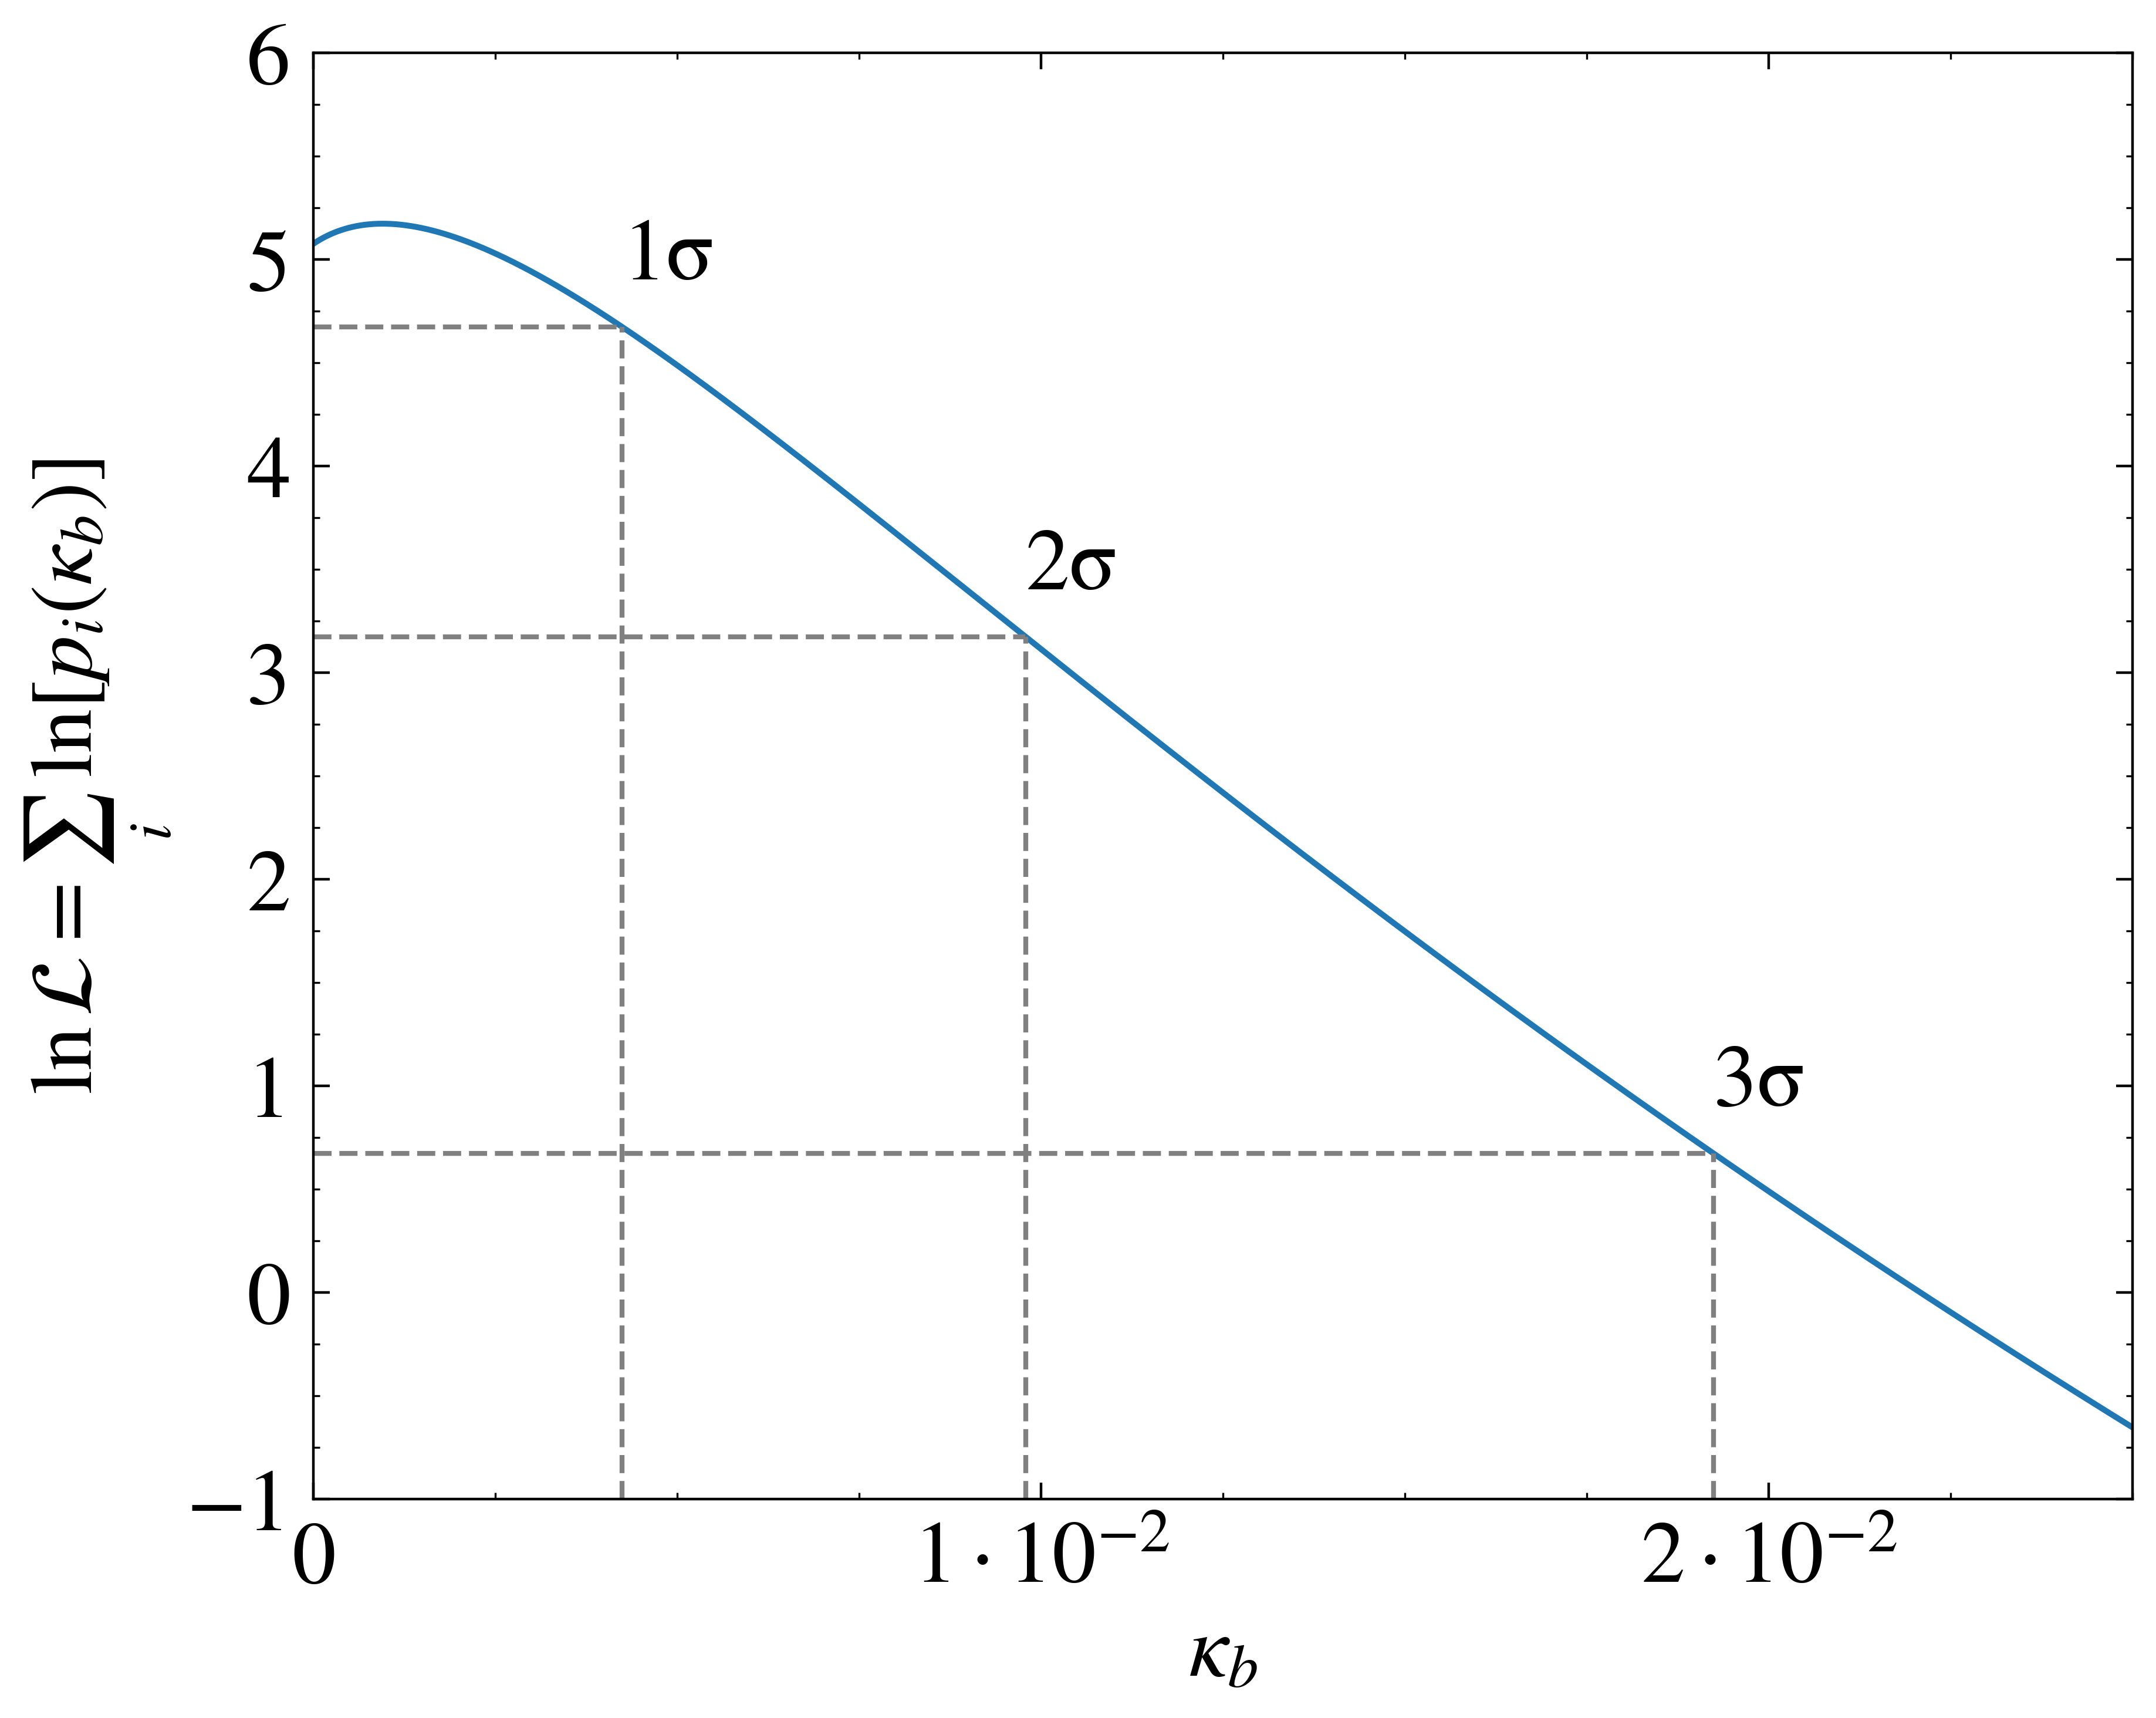
The result for the likelihood function is shown in Figure 2. The optimal value of the dark matter surface density is , and is consistent with zero. Therefore, the observed distribution of supermagnified star images is consistent with no compact objects in the dark matter, with the known stellar population in the intracluster light being ideal for explaining the observations. Figure 2 shows also the upper limits that can be placed on any additional compact objects, if we treat the function as a function. The upper limit, at a confidence level of 0.3%, is . We warn that this upper limit includes only the statistical uncertainty associated with the 9 events we used, but we have not attempted to incorporate other uncertainties due to the modeling of the lenses or the mass function of the stars in the intracluster light. These values for the upper limits to the fraction of dark matter in compact objects should also be slightly increased when we take into account that 10% of the total mass contributing to lensing is in the hot, X-ray emitting gas (note that the gas usually has a density profile that is less centrally concentrated than the dark matter in the strong lensing region).
As discussed at the beginning of Section 3, we have excluded from this analysis event 6, which similarly to event 11 has a magnified image further from the model MaCL by a factor than the predicted width for , because of the model uncertainty in the true separation from the MaCL. Had we included this event, the upper limit on increases only to .
As a consequence, we can establish an upper limit to the fraction of dark matter that may be in compact objects. The average local convergence in the 9 events we have used is , so the upper limit on the dark matter fraction in compact objects is , which is only slightly increased to when taking into account the contribution of hot gas to .
5 Dependence on the microlens mass distribution
The upper limit derived in this paper on the contribution of compact objects to the dark matter actually extends over a very broad mass range. A remarkable result of the microlensing effect of compact masses is that the width of the corrugated network of MiCLs is simply , and is independent of the mass distribution of the microlenses. The mass of the microlenses affects only the maximum magnification and frequency of the MiCL crossing events.
Let us first consider the case of compact objects in the dark matter that are much more massive than stars, with Einstein radius and convergence and . These compact objects should produce their own network of MiCLs, and the intracluster stars should produce a second level of corrugation on a smaller scale, corresponding to their smaller Einstein radius. Without the intracluster stars, the peak magnification of MiCL crossings within the network is typically (equations 20 and 27 of Venumadhav et al., 2017)
| (4) |
where is the radius of the source star. We note that this peak magnification does not actually depend on the gradient , but only on and . Below a critical convergence , there is no corrugated network. When the intracluster stars are added, a second level of corrugation appears on the MiCLs caused by the more massive dark matter compact objects, with an external eigenvalue gradient (equation 26 in Venumadhav et al., 2017), if is greater than a new critical convergence, . The condition for the second level of corrugation to appear is the same as requiring that . In other words, it is the same condition as requiring that stars dominate the impact on the peak magnification, which is given by
| (5) |
If , then the second level of corrugation is not formed, and the peak magnification is limited by the presence of the the dark matter compact objects instead of the stars, according to equation (4).
In any case, we note that any restrictions that can be inferred from the maximum magnification that can be reached in MiCL crossings to allow the detection of a star, once a maximum intrinsic luminosity of the source star is assumed, are in addition to the restriction that the supermagnified images should be uniformly distributed around the MaCL within the width determined by the total surface density in compact objects. The first limits on were obtained by Oguri et al. (2018), but they were based on requiring that the maximum magnification of MiCL crossings was sufficient to explain the observed flux given a maximum luminosity assumed for the source star. This limit may be subject to uncertainties arising from the possible presence of a high-magnification tail due, for example, to rare cusps on the MiCLs, and is completely independent from the limit on we study here using the distribution of magnified images around the MaCL. In our case, the important fact is that images reaching the peak magnification of equation (5) or (4), whichever is lower, should be uniformly distributed within the width determined by the total surface density in compact objects of masses comparable or higher than stars.
Hence, our limit implies that no more than 3% of the dark matter can be in any compact objects above stellar masses, up to a maximum mass at which . For the upper limit , and the median value of the eigenvalue gradient for our cluster lenses , this corresponds to , or masses of to . Above this mass, the dark matter compact objects with would produce isolated perturbations to the MaCL that could be individually identified around each object, which would stand out as a measurable perturbation caused by a dark object that is not associated with any luminous galaxy. Therefore, they would also be detectable in any case through their noticeable effect on cluster lensing models, above a minimum abundance that would need to be studied in more detail but which is unlikely to be close to the threshold for corrugation.
Our limit actually applies also to extended lenses that may be subcritical to lensing on their own, but become supercritical close to the cluster MaCL, such as dark matter subhalos. We note that cluster galaxies may well exceed a contribution of 2% to the mass surface density, and their effects are in fact often visible on the shape of critical lines when they pass close to their vicinity, but this is taken into account in the lensing models with the identified luminous cluster galaxies. Similarly, if dark matter subhalos that are sufficiently dense exceed this upper limit of 2% to their surface density contribution, they would have an important effect widening the region of maximally magnified images around the MaCL(see Dai et al., 2018), although some low-mass subhalos might remain subcritical to lensing even closer to the MaCL, and might then exceed this contribution without being easily detectable.
Next, we discuss the case of dark matter compact objects that are much less massive than stars. Exactly as in the previous case, the maximum magnification that will be reached in MiCL crossings will now be reduced to the value given in equation (4), where now , provided that . Otherwise, the peak magnifications will be the same as those caused by the intracluster stars alone. The total width of the corrugated network depends only on the total surface density of compact objects contributing to the two levels of corrugation.
However, there is in this case a different limitation to the detection of the microlensing effect: for any fixed , in the limit of very small masses of dark matter compact objects, the case of smooth dark matter must obviously be recovered. If the crossings of MiCLs can be detected down to a photometric accuracy of a fraction of the total flux, then the peak magnification of equation (4) must exceed , where the mean magnification at angular separation from the MaCL is (equation 10 in Venumadhav et al., 2017), and is the angle between the MaCL and the principal axis of the vanishing eigenvalue. Applying this to the typical separation where most highly magnified images should be seen, , we obtain the condition
| (6) |
For the case , and and , we find that , and for a typical stellar size and source angular diameter distance , we find , implying that masses down to are still ruled out to contribute a surface density greater than because any highly magnified, variable images would be observed over a width larger than observed around the MaCL.
Note that for the microlensing mass that produces a typical magnification peak equal to the average magnification (i.e., when equation (6) is an equality with ), this peak magnification is
| (7) |
as expected at the separation from the MaCL.
6 Conclusions
The result presented in this paper implies that the observation of only 9 supermagnified stars in lensing clusters of galaxies places an upper limit of 3% on the fraction of dark matter in compact objects which is already better than upper limits obtained so far from several microlensing surveys that have monitored millions of stars in the Magellanic Clouds (Alcock et al., 2001; Tisserand et al., 2007; Wyrzykowski et al., 2011b). Models of primordial black holes making up the dark matter are now ruled out for masses for fractions higher than 3% at the 99% confidence level. Interestingly, this limit is sensitive to the dark matter that is present in the most massive clusters of galaxies in the Universe, and also to the intergalactic dark matter that must be present along the line of sight to the source that traverses the lensing cluster and contributes to the total lensing convergence.
As the observations of variability in lensing clusters improve in the future with further observations of JWST and other telescopes, we can look forward to an improvement in these limits, and also to new constraints on the mass function of the microlenses caused by intracluster stars, or perhaps other unknown objects. Other models such as the QCD axion, which predicts the presence of axion minihalos that can also have lensing effects despite their extended mass distribution (Dai & Miralda-Escudé, 2020), will likely be constrained as well by monitoring campaigns of the supermagnified stars discovered by Kelly et al. (2018)
7 Acknowledgments
This work has used gravitational lensing models produced by PIs Bradač, Natarajan and Kneib (CATS), Merten and Zitrin, Sharon, Williams, Keeton, Bernstein and Diego, and the GLAFIC group. This lens modeling was partially funded by the HST Frontier Fields program conducted by STScI. STScI is operated by the Association of Universities for Research in Astronomy, Inc. under NASA contract NAS 5-26555. The lens models were obtained from the Mikulski Archive for Space Telescopes (MAST). This work is also based on observations taken by the RELICS Treasury Program (GO 14096) with the NASA/ESA HST, which is operated by the Association of Universities for Research in Astronomy, Inc., under NASA contract NAS5-26555. This work was supported in part by Spanish grants PID2019-108122GB-C32 and PID2022-137268NB-C52.
8 Data Availability
The data and code used for the work presented in this article are available at https://doi.org/10.6084/m9.figshare.25438648.v1.
References
- Alam et al. (2021) Alam S., et al., 2021, Phys. Rev. D, 103, 083533
- Alcock et al. (1998) Alcock C., et al., 1998, ApJ, 499, L9
- Alcock et al. (2001) Alcock C., et al., 2001, ApJ, 550, L169
- Ammons et al. (2014) Ammons S. M., Wong K. C., Zabludoff A. I., Keeton C. R., 2014, ApJ, 781, 2
- Balestra et al. (2016) Balestra I., et al., 2016, ApJS, 224, 33
- Bradač et al. (2005) Bradač M., Schneider P., Lombardi M., Erben T., 2005, A&A, 437, 39
- Bradač et al. (2009) Bradač M., et al., 2009, ApJ, 706, 1201
- Caminha et al. (2017a) Caminha G. B., et al., 2017a, A&A, 600, A90
- Caminha et al. (2017b) Caminha G. B., et al., 2017b, A&A, 600, A90
- Carr et al. (2021) Carr B., Kohri K., Sendouda Y., Yokoyama J., 2021, Reports on Progress in Physics, 84, 116902
- Castellano et al. (2016) Castellano M., et al., 2016, A&A, 590, A31
- Cerny et al. (2018) Cerny C., et al., 2018, ApJ, 859, 159
- Chan et al. (2017) Chan B. M. Y., Broadhurst T., Lim J., Diego J. M., Zitrin A., Coe D., Ford H. C., 2017, ApJ, 835, 44
- Chang & Refsdal (1979) Chang K., Refsdal S., 1979, Nature, 282, 561
- Chen et al. (2019) Chen W., et al., 2019, ApJ, 881, 8
- Chen et al. (2022) Chen W., et al., 2022, ApJ, 940, L54
- Christensen et al. (2012) Christensen L., et al., 2012, MNRAS, 427, 1953
- Coe et al. (2015) Coe D., Bradley L., Zitrin A., 2015, ApJ, 800, 84
- Coe et al. (2019) Coe D., et al., 2019, ApJ, 884, 85
- Cypriano et al. (2004) Cypriano E. S., Sodré Laerte J., Kneib J.-P., Campusano L. E., 2004, ApJ, 613, 95
- Dai & Miralda-Escudé (2020) Dai L., Miralda-Escudé J., 2020, AJ, 159, 49
- Dai et al. (2018) Dai L., Venumadhav T., Kaurov A. A., Miralda-Escudé J., 2018, ApJ, 867, 24
- Diego et al. (2015) Diego J. M., Broadhurst T., Molnar S. M., Lam D., Lim J., 2015, MNRAS, 447, 3130
- Diego et al. (2022) Diego J. M., Pascale M., Kavanagh B. J., Kelly P., Dai L., Frye B., Broadhurst T., 2022, A&A, 665, A134
- Diego et al. (2023a) Diego J. M., et al., 2023a, arXiv e-prints, p. arXiv:2307.10363
- Diego et al. (2023b) Diego J. M., et al., 2023b, A&A, 672, A3
- Ebeling et al. (2007) Ebeling H., Barrett E., Donovan D., Ma C. J., Edge A. C., van Speybroeck L., 2007, ApJ, 661, L33
- Ebeling et al. (2014) Ebeling H., Ma C.-J., Barrett E., 2014, ApJS, 211, 21
- Einasto et al. (1974) Einasto J., Kaasik A., Saar E., 1974, Nature, 250, 309
- Griest et al. (2014) Griest K., Cieplak A. M., Lehner M. J., 2014, ApJ, 786, 158
- Grillo et al. (2015) Grillo C., et al., 2015, ApJ, 800, 38
- Grohs & Fuller (2022) Grohs E., Fuller G. M., 2022, in , Handbook of Nuclear Physics. p. 127, doi:10.1007/978-981-15-8818-1_127-1
- Hawking (1971) Hawking S., 1971, MNRAS, 152, 75
- Hoag et al. (2016) Hoag A., et al., 2016, ApJ, 831, 182
- Jauzac et al. (2014) Jauzac M., et al., 2014, MNRAS, 443, 1549
- Johnson et al. (2014) Johnson T. L., Sharon K., Bayliss M. B., Gladders M. D., Coe D., Ebeling H., 2014, ApJ, 797, 48
- Jullo et al. (2007) Jullo E., Kneib J. P., Limousin M., Elíasdóttir Á., Marshall P. J., Verdugo T., 2007, New Journal of Physics, 9, 447
- Kaurov et al. (2019) Kaurov A. A., Dai L., Venumadhav T., Miralda-Escudé J., Frye B., 2019, ApJ, 880, 58
- Kawamata et al. (2016) Kawamata R., Oguri M., Ishigaki M., Shimasaku K., Ouchi M., 2016, ApJ, 819, 114
- Kawamata et al. (2018) Kawamata R., Ishigaki M., Shimasaku K., Oguri M., Ouchi M., Tanigawa S., 2018, ApJ, 855, 4
- Keeton (2010) Keeton C. R., 2010, General Relativity and Gravitation, 42, 2151
- Kelly et al. (2018) Kelly P. L., et al., 2018, Nature Astronomy, 2, 334
- Lagattuta et al. (2017) Lagattuta D. J., et al., 2017, MNRAS, 469, 3946
- Liesenborgs et al. (2006) Liesenborgs J., De Rijcke S., Dejonghe H., 2006, MNRAS, 367, 1209
- Lotz et al. (2017) Lotz J. M., et al., 2017, ApJ, 837, 97
- Madhavacheril et al. (2023) Madhavacheril M. S., et al., 2023, arXiv e-prints, p. arXiv:2304.05203
- Mahler et al. (2018a) Mahler G., et al., 2018a, MNRAS, 473, 663
- Mahler et al. (2018b) Mahler G., et al., 2018b, MNRAS, 473, 663
- Mann & Ebeling (2012) Mann A. W., Ebeling H., 2012, MNRAS, 420, 2120
- McCully et al. (2014) McCully C., Keeton C. R., Wong K. C., Zabludoff A. I., 2014, MNRAS, 443, 3631
- Meena et al. (2023a) Meena A. K., et al., 2023a, MNRAS, 521, 5224
- Meena et al. (2023b) Meena A. K., et al., 2023b, ApJ, 944, L6
- Merlin et al. (2015) Merlin E., et al., 2015, A&A, 582, A15
- Merlin et al. (2016) Merlin E., et al., 2016, A&A, 590, A30
- Merten et al. (2011) Merten J., et al., 2011, MNRAS, 417, 333
- Miralda-Escudé (1991) Miralda-Escudé J., 1991, ApJ, 379, 94
- Oguri (2010) Oguri M., 2010, PASJ, 62, 1017
- Oguri et al. (2018) Oguri M., Diego J. M., Kaiser N., Kelly P. L., Broadhurst T., 2018, Phys. Rev. D, 97, 023518
- Okabe & Umetsu (2008) Okabe N., Umetsu K., 2008, PASJ, 60, 345
- Okabe et al. (2010a) Okabe N., Takada M., Umetsu K., Futamase T., Smith G. P., 2010a, PASJ, 62, 811
- Okabe et al. (2010b) Okabe N., Okura Y., Futamase T., 2010b, ApJ, 713, 291
- Ostriker et al. (1974) Ostriker J. P., Peebles P. J. E., Yahil A., 1974, ApJ, 193, L1
- Peebles (1982) Peebles P. J. E., 1982, ApJ, 263, L1
- Planck Collaboration et al. (2020) Planck Collaboration et al., 2020, A&A, 641, A6
- Postman et al. (2012) Postman M., et al., 2012, ApJS, 199, 25
- Richard et al. (2010) Richard J., Kneib J. P., Limousin M., Edge A., Jullo E., 2010, MNRAS, 402, L44
- Richard et al. (2014) Richard J., et al., 2014, MNRAS, 444, 268
- Rodney et al. (2018) Rodney S. A., et al., 2018, Nature Astronomy, 2, 324
- Rubin et al. (1978) Rubin V. C., Ford W. K. J., Thonnard N., 1978, ApJ, 225, L107
- Salmon et al. (2020) Salmon B., et al., 2020, ApJ, 889, 189
- Sebesta et al. (2016) Sebesta K., Williams L. L. R., Mohammed I., Saha P., Liesenborgs J., 2016, MNRAS, 461, 2126
- Sebesta et al. (2019) Sebesta K., Williams L. L. R., Liesenborgs J., Medezinski E., Okabe N., 2019, MNRAS, 488, 3251
- Sendra et al. (2014) Sendra I., Diego J. M., Broadhurst T., Lazkoz R., 2014, MNRAS, 437, 2642
- Smith et al. (2009) Smith G. P., et al., 2009, ApJ, 707, L163
- Smyth et al. (2020) Smyth N., Profumo S., English S., Jeltema T., McKinnon K., Guhathakurta P., 2020, Phys. Rev. D, 101, 063005
- Tisserand et al. (2007) Tisserand P., et al., 2007, A&A, 469, 387
- Treu et al. (2016) Treu T., et al., 2016, ApJ, 817, 60
- Tristram et al. (2024) Tristram M., et al., 2024, A&A, 682, A37
- Umetsu et al. (2011) Umetsu K., Broadhurst T., Zitrin A., Medezinski E., Hsu L.-Y., 2011, ApJ, 729, 127
- Umetsu et al. (2018) Umetsu K., et al., 2018, ApJ, 860, 104
- Venumadhav et al. (2017) Venumadhav T., Dai L., Miralda-Escudé J., 2017, ApJ, 850, 49
- Welch et al. (2022a) Welch B., et al., 2022a, Nature, 603, 815
- Welch et al. (2022b) Welch B., et al., 2022b, ApJ, 940, L1
- Wyrzykowski et al. (2011a) Wyrzykowski Ł., et al., 2011a, MNRAS, 413, 493
- Wyrzykowski et al. (2011b) Wyrzykowski L., et al., 2011b, MNRAS, 416, 2949
- Zheng et al. (2012) Zheng W., et al., 2012, Nature, 489, 406
- Zitrin & Broadhurst (2009) Zitrin A., Broadhurst T., 2009, ApJ, 703, L132
- Zitrin et al. (2009) Zitrin A., et al., 2009, MNRAS, 396, 1985
- Zitrin et al. (2013) Zitrin A., et al., 2013, ApJ, 762, L30
- Zitrin et al. (2015) Zitrin A., et al., 2015, ApJ, 801, 44
- Zwicky (1933) Zwicky F., 1933, Helvetica Physica Acta, 6, 110