Radial Acceleration Relation of -rich Low Surface Brightness Galaxies
Abstract
We investigate the radial acceleration relation (RAR) in low surface brightness galaxies selected from the Arecibo Legacy Fast ALFA survey. We find that the dynamical acceleration and baryonic gravitational acceleration of the -rich low surface brightness galaxies still follow the universal RAR of typical late-type galaxies. The universal RAR signifies a consistent correlation between the distribution of baryonic matter and dark matter across galaxies with diverse morphologies and properties. Our findings suggest that the matter distributions in low surface brightness galaxies may indeed resemble that of general late-type galaxies. This implies that low surface brightness galaxies may not originate from dark matter halos with lower densities; instead, they may originate from the dark matter halos with high spins or form through feedback processes.
keywords:
galaxies: kinematics and dynamics – galaxies: formation – galaxies: evolution1 Introduction
Low surface brightness galaxies (LSBGs) constitute a special population of galaxies with central surface brightness at least one magnitude fainter than that of the sky background (i.e., -band surface brightness ; Impey & Bothun, 1997; Bothun et al., 1997). LSBGs have been observed to exhibit higher HI fractions (Du et al., 2015; He et al., 2020), lower star formation rates (Wyder et al., 2009; Rong et al., 2020b), and low metallicities (Kuzio de Naray et al., 2004). Also, they tend to appear in low-density environments (Pérez-Montaño & Cervantes Sodi, 2019; Mo et al., 1994).
The distribution of dark matter and baryonic matter in LSBGs exhibits a high degree of diversity. Regarding the mass ratio of baryonic matter to dark matter, many studies have shown that the dynamics of LSBGs are dominated by dark matter (e.g. de Blok & McGaugh, 1997; Mowla et al., 2017), while a particular LSBG population, ultra-diffuse galaxies (UDGs), may be dark matter deficient (e.g. van Dokkum et al., 2018; Mancera Piña et al., 2019). Similarly, investigations into the baryonic Tully-Fisher relation (BTFR, see McGaugh et al., 2000 and other sources) of LSBGs seem to yield conflict outcomes. For instance, Lelli et al. (2016b) find that the BTFR of galaxies do not correlate with the surface brightness of the galaxies; whereas Hu et al. (2023) find UDGs that deviate significantly from the BTFR of typical galaxies. The stellar mass-halo mass relation () also presents a similar situation. While Prole et al. (2019) suggest that LSBGs form a continuous extension of typical dwarfs in the diagram, others find that UDGs deviate significantly from the typical relation (e.g., van Dokkum et al., 2018). This diversity in matter distribution among LSBGs may provide valuable insights into their varied formation and evolution pathways. Therefore, understanding these differences is crucial for refining our current models of galaxy formation and evolution.
Studies suggest that the low-mass LSBGs may be failed galaxies (van Dokkum et al., 2015a; van Dokkum et al., 2015b), or dwarf galaxies hosted in halos belonging to the high-end tail of the spin-distribution (Rong et al., 2017; Amorisco & Loeb, 2016; Kim & Lee, 2013). There are also studies suggesting that they were formed in low-density dark matter halos (Dekel & Silk, 1986; McGaugh, 1992; Mo et al., 1994). In addition, they may originate from early mergers (Wright et al., 2021) or stellar feedback processes (Chan et al., 2018) or tides (Rong et al., 2020a; Carleton et al., 2019) as well. As for high-mass LSBGs, their formation might due to mergers (Saburova et al., 2018; Zhu et al., 2023), two-stage process with external gas accretions (Saburova et al., 2021), or dynamical evolution originated from the bars (Noguchi, 2001). However, current studies on the mass distributions in LSBGs have not achieved consensus. A complete scenario has not been drawn to restrict current formation models of LSBGs and understand the formation and evolution of LSBGs.
Recently, a series of studies (McGaugh et al., 2016; Lelli et al., 2017; Li et al., 2018; Richards et al., 2018; Rong et al., 2018; Chae et al., 2020) have discovered a radial acceleration relation (RAR), i.e., the acceleration produced by the baryonic mass and the acceleration produced by the dynamical mass at any radius in many types of galaxies are tightly correlated, which indicates a universally established correlation between the mass distributions of baryonic matter and dark matter in galaxies. Despite minor variations in specific details, standard CDM models employing abundance matching procedures (e.g. Behroozi et al., 2013; Kravtsov et al., 2018), along with proper scaling relations, generally reproduce the universal RAR (Ludlow et al., 2017; Navarro et al., 2017; Keller & Wadsley, 2017; Wheeler et al., 2019; Li et al., 2022). Consequently, investigating the RAR in LSBGs may shed light on whether LSBGs adhere to the scaling relationships of typical galaxies. Besides, testing the RAR of LSBGs may also reveal information about their stellar feedback process (Grudić et al., 2020) and the relaxation process of their dark matter halos (Paranjape & Sheth, 2021). By comparing the RAR of LSBGs to that of typical late-type galaxies, we can ascertain whether LSBGs exhibit similar distribution patterns of matter as general late-type galaxies, thus providing constraints on the formation mechanisms of LSBGs.
2 Sample Selection
The Arecibo Legacy Fast ALFA survey (ALFALFA) is a wide-area blind survey aimed at searching for -bearing objects in the extragalactic neighbourhood. Haynes et al. (2011) matched the sources in the ALFALFA catalogue with the optical counterparts in the Sloan Digital Sky Survey (SDSS) Data Release 7 (DR7) and obtained the ALFALFA-SDSS cross-matched catalogue. From this catalogue, Du et al. (2015) and He et al. (2020) have selected a sample of LSBGs, which is treated as our parent sample.
From this parent sample, we first remove LSBGs with -band apparent axis ratios , corresponding to the threshold of inclination angles of (see equation (16)), because the spherical ones may introduce large uncertainties in the measurements of the rotation velocities. We then exclude LSBGs with low spectral signal-to-noise ratios , and visually remove LSBGs with suspicious HI spectra.
Due to the spatial resolution of ALFALFA being (Durbala et al., 2020), if a galaxy has neighbouring galaxies, its spectrum may be contaminated by the companions. To eliminate this possibility, we remove samples with neighbouring galaxies within the projected radii of (i.e., approximately the beam size of Arecibo) and radial velocity differences of . The redshift of LSBGs is assumed to be the central velocity of its spectrum, while the redshift of the neighbouring galaxies comes from the SpecObj and Photoz databases of SDSS. Finally, 207 LSBGs are left in our sample.
We also calculate the kurtosis coefficients, , of the HI spectra (Papastergis et al., 2016; El-Badry et al., 2018) for our sample galaxies, as
| (1) |
where and are calculated as,
| (2) | ||||
| (3) |
In equations (2) and (3), and represent the frequency and the flux density, respectively, and is defined as,
| (4) |
Here, and correspond to the minimal and maximum frequencies between which (see Section 3 for the definition of ) is measured, respectively. The coefficient quantifies the “peakiness” of a spectrum and thus can indicate whether a spectrum is single-peaked or double-horned. The single-peaked galaxies may have kinematics strongly influenced by velocity dispersion (El-Badry et al., 2018), or HI disks that are not extended enough (Papastergis et al., 2016). As a consequence, their HI-widths might not represent their rotation velocities (McGaugh, 2012; Verheijen, 1997). Therefore, we perform a cut at the HI spectrum, , in order to remove the single-peaked galaxies.
The final sample contains 127 high-quality LSBGs with double-horned HI lines, ensuring the most reliable results. For comparison, 207 high surface brightness galaxies (HSBGs, ) with double-horned HI lines are also selected from our parent sample as the counterparts.
3 Method
We test the RAR by calculating the acceleration produced by baryonic matter and the dynamical acceleration in galaxies. is calculated as,
| (5) | ||||
| (6) |
where is the gravitational potential, is the gravitational constant, is the density of baryonic matter, and is the radius. The baryonic matter in galaxies is mainly composed of stars and gas. Our LSBGs mostly exhibit disk-dominated optical characteristics with a Sérsic index of (Du et al., 2015; He et al., 2020). Gas is usually assumed to follow an exponential disk. Therefore, we model the stars and the gas separately according to the standard thin-disk distribution.
The surface density profile of the stellar disk can be written as,
| (7) |
where is related to the effective radius in the -band by a factor , i.e., . The stellar mass can be obtained with the galaxy luminosity in the W1-band (denoted as ), from the Wide-field Infrared Survey Explorer, using the method proposed by McGaugh & Schombert (2015),
| (8) |
Analogously, the surface density profile of the gas can be expressed as,
| (9) |
where is the gas mass. Since the mass of molecular gas in a galaxy is low compared with the masses of HI and helium, we then neglect it (McGaugh, 2012) and estimate by adding up the mass of HI and helium,
| (10) |
where is the HI mass. The value of can be derived from the HI radius and , where is defined as the radius at which the HI density is (Broeils & Rhee, 1997). has been found to exhibit a tight correlation with (Wang et al., 2016), as
| (11) |
This correlation has been found to hold consistently across various galaxy types, including UDGs and other LSBGs (Wang et al., 2016; Leisman et al., 2017; Gault et al., 2021).
Finally, equation (6) can be written as (Freeman, 1970),
| (12) | ||||
| (13) |
where , are the modified Bessel functions of the first and second kind, respectively.
For the dynamical acceleration , we employ the following equation,
| (14) |
where represents the rotation velocity of a galaxy. The rotation velocity is usually estimated using the peak widths of the HI spectra () in the previous studies (e.g. Guo et al., 2020; Hu et al., 2023), as
| (15) |
where is the inclination angle. employed in equation (15) has been corrected for instrumental broadening and redshift (Guo et al., 2020; Kent et al., 2008). In equation (15), we assume an alignment between the inclination angles of the stellar disk and HI disk, and then use the inclination angle of the stellar disk to estimate the inclination angle of the HI disk (e.g. Guo et al., 2020; Hu et al., 2023; Du et al., 2019; Begum et al., 2008),
| (16) |
where denotes the intrinsic axis ratio seen edge-on. We take , which is commonly used in the previous studies (e.g. Du et al., 2019; Guo et al., 2020; Giovanelli et al., 1997; Tully et al., 2009). For those edge-on galaxies with -band , we set . Considering that the stellar disk and gas disk in galaxies may not be perfectly co-planar and often exhibit a small inclination difference of (e.g. Gault et al., 2021), we assume that the misalignment angle between the gas disk and the stellar disk, , follows a Gaussian distribution centred at with a standard deviation of . We treat as the error associated with in our study.
4 Results
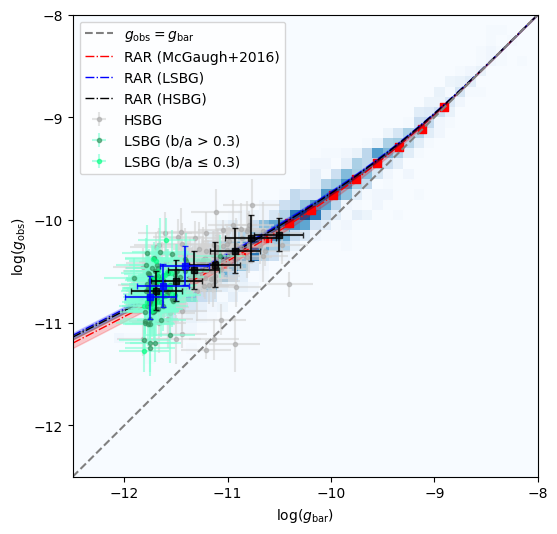
For each LSBG, we thus obtain its and at the HI radius. as a function of for all of the sample LSBGs is shown in Fig. 1 (the upper panel), as depicted by the green points. We subsequently divide into different bins, and calculate the median of LSBGs in each bin. We find that the median values (depicted by the blue points) roughly follow the RAR of typical late-type galaxies given by McGaugh et al. (2016). We also directly employ the RAR equation,
| (17) |
to fit 111using the orthogonal distance regression algorithm (scipy.odr) the - relation of our LSBG sample, and obtain the value of the free parameter . Our best-fitting result gives . The RAR of our sample LSBGs coincides with the RAR of typical spiral galaxies and dwarf galaxies (Lelli et al., 2017; McGaugh et al., 2016) in the range of , with an average difference of being merely . This result indicates that, despite a large dispersion in the - diagram, LSBGs exhibit mass distributions similar to those of typical late-type galaxies and dwarf galaxies in statistics.
For comparison, we also present the results of our control sample, i.e., HSBGs, in Fig. 1 (depicted by the grey points). We observe that, similar to the findings for typical late-type galaxies investigated by McGaugh et al. (2016), our HSBGs undeniably adhere to the universal RAR with a of . This adherence also suggests the robustness of our estimation of and .
5 Summary and Discussion
Taking advantage of the ALFALFA HI survey data, we have selected the HI-rich LSBGs and estimated their gravitational accelerations and at the I radii. We find that, in statistics, LSBGs also conform to the universal RAR found in typical late-type galaxies as well as typical dwarf galaxies. Our results indicate that the distributions of dark matter and baryonic matter may still correlate with each other in LSBGs and that the mass distributions of the majority of LSBGs may be similar to those of ordinary late-type galaxies and dwarf galaxies. More specifically, our results suggest that the majority of LSBGs may have dark matter halos with masses and density profiles similar to typical late-type massive galaxies and dwarf galaxies.
Our investigation into the distribution of matter in LSBGs yields valuable insights into their formation mechanisms, offering a means to test and refine existing models of LSBG formation. Previous studies (e.g. McGaugh, 1992; Dekel & Silk, 1986) postulated that the low surface brightness of disk galaxies may stem from their formation within dark matter halos characterized by lower densities; however, this hypothesis would anticipate substantial deviations from the RAR for typical late-type galaxies. As such, our results suggest that this model may not fully encapsulate the formation and evolutionary processes of LSBGs.
Alternative theories suggest that LSBGs may originate from high-spin dark matter halos (Kim & Lee, 2013; Mo et al., 1998, e.g.), or may be influenced by feedback processes (Ludlow et al., 2017). While high spins of halos or feedback mechanisms may indeed lead to more extensive stellar distributions in galaxies, the correlated distributions of dark matter and baryonic matter profiles should not significantly deviate from the RAR observed in typical late-type galaxies. Therefore, our findings lend support to these two models of LSBG formation.
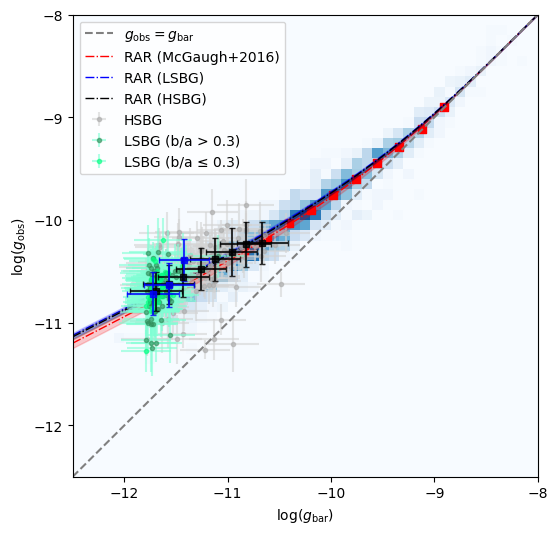
In this study, we have modelled the stellar and gaseous components of the LSBGs by two standard thin disks. We also consider a model in which both the gas and stars are uniformly distributed in spheres, respectively, and the results are shown in the lower panel of Fig. 1. We find that the RAR of both LSBGs and HSBGs do not change significantly with the different modelling. The same fitting method yields and . Therefore, we conclude that the modelling method of baryonic matter distribution only has a minor effect on our results.
Acknowledgements
Y.R. acknowledges supports from the NSFC grant 12273037, and the CAS Pioneer Hundred Talents Program (Category B), as well as the USTC Research Funds of the Double First-Class Initiative (No. YD2030002013). H.H. is supported by the Fundamental Research Funds for the Central Universities, the CAS Project for Young Scientists in Basic Research Grant No. YSBR-062, the National SKA Program of China No. 2022SKA0110201, and the NSFC grant No. 12033008.
Data Availability
Data are available if requested.
References
- Amorisco & Loeb (2016) Amorisco N. C., Loeb A., 2016, MNRAS, 459, L51
- Begum et al. (2008) Begum A., Chengalur J. N., Karachentsev I. D., Sharina M. E., 2008, MNRAS, 386, 138
- Behroozi et al. (2013) Behroozi P. S., Wechsler R. H., Conroy C., 2013, ApJ, 770, 57
- Bothun et al. (1997) Bothun G., Impey C., McGaugh S., 1997, PASP, 109, 745
- Broeils & Rhee (1997) Broeils A. H., Rhee M. H., 1997, A&A, 324, 877
- Carleton et al. (2019) Carleton T., Errani R., Cooper M., Kaplinghat M., Peñarrubia J., Guo Y., 2019, MNRAS, 485, 382
- Chae et al. (2020) Chae K.-H., Bernardi M., Domínguez Sánchez H., Sheth R. K., 2020, ApJ, 903, L31
- Chan et al. (2018) Chan T. K., Kereš D., Wetzel A., Hopkins P. F., Faucher-Giguère C. A., El-Badry K., Garrison-Kimmel S., Boylan-Kolchin M., 2018, MNRAS, 478, 906
- Dekel & Silk (1986) Dekel A., Silk J., 1986, ApJ, 303, 39
- Du et al. (2015) Du W., Wu H., Lam M. I., Zhu Y., Lei F., Zhou Z., 2015, AJ, 149, 199
- Du et al. (2019) Du W., Cheng C., Wu H., Zhu M., Wang Y., 2019, MNRAS, 483, 1754
- Durbala et al. (2020) Durbala A., Finn R. A., Crone Odekon M., Haynes M. P., Koopmann R. A., O’Donoghue A. A., 2020, AJ, 160, 271
- El-Badry et al. (2018) El-Badry K., et al., 2018, MNRAS, 477, 1536
- Freeman (1970) Freeman K. C., 1970, ApJ, 160, 811
- Gault et al. (2021) Gault L., et al., 2021, ApJ, 909, 19
- Giovanelli et al. (1997) Giovanelli R., Haynes M. P., Herter T., Vogt N. P., Wegner G., Salzer J. J., da Costa L. N., Freudling W., 1997, AJ, 113, 22
- Grudić et al. (2020) Grudić M. Y., Boylan-Kolchin M., Faucher-Giguère C.-A., Hopkins P. F., 2020, MNRAS, 496, L127
- Guo et al. (2020) Guo Q., et al., 2020, Nature Astronomy, 4, 246
- Haynes et al. (2011) Haynes M. P., et al., 2011, AJ, 142, 170
- He et al. (2020) He M., Wu H., Du W., Liu H.-y., Lei F.-j., Zhao P.-s., Zhang B.-q., 2020, ApJS, 248, 33
- Hu et al. (2023) Hu H.-J., Guo Q., Zheng Z., Yang H., Tsai C.-W., Zhang H.-X., Zhang Z.-Y., 2023, ApJ, 947, L9
- Impey & Bothun (1997) Impey C., Bothun G., 1997, ARA&A, 35, 267
- Keller & Wadsley (2017) Keller B. W., Wadsley J. W., 2017, ApJ, 835, L17
- Kent et al. (2008) Kent B. R., et al., 2008, AJ, 136, 713
- Kim & Lee (2013) Kim J.-h., Lee J., 2013, MNRAS, 432, 1701
- Kravtsov et al. (2018) Kravtsov A. V., Vikhlinin A. A., Meshcheryakov A. V., 2018, Astronomy Letters, 44, 8
- Kuzio de Naray et al. (2004) Kuzio de Naray R., McGaugh S. S., de Blok W. J. G., 2004, MNRAS, 355, 887
- Leisman et al. (2017) Leisman L., et al., 2017, ApJ, 842, 133
- Lelli et al. (2016a) Lelli F., McGaugh S. S., Schombert J. M., 2016a, AJ, 152, 157
- Lelli et al. (2016b) Lelli F., McGaugh S. S., Schombert J. M., 2016b, ApJ, 816, L14
- Lelli et al. (2017) Lelli F., McGaugh S. S., Schombert J. M., Pawlowski M. S., 2017, ApJ, 836, 152
- Li et al. (2018) Li P., Lelli F., McGaugh S., Schombert J., 2018, A&A, 615, A3
- Li et al. (2022) Li P., McGaugh S. S., Lelli F., Tian Y., Schombert J. M., Ko C.-M., 2022, ApJ, 927, 198
- Ludlow et al. (2017) Ludlow A. D., et al., 2017, Phys. Rev. Lett., 118, 161103
- Mancera Piña et al. (2019) Mancera Piña P. E., et al., 2019, ApJ, 883, L33
- McGaugh (1992) McGaugh S. S., 1992, PhD thesis, University of Michigan
- McGaugh (2012) McGaugh S. S., 2012, AJ, 143, 40
- McGaugh & Schombert (2015) McGaugh S. S., Schombert J. M., 2015, ApJ, 802, 18
- McGaugh et al. (2000) McGaugh S. S., Schombert J. M., Bothun G. D., de Blok W. J. G., 2000, ApJ, 533, L99
- McGaugh et al. (2016) McGaugh S. S., Lelli F., Schombert J. M., 2016, Phys. Rev. Lett., 117, 201101
- Mo et al. (1994) Mo H. J., McGaugh S. S., Bothun G. D., 1994, MNRAS, 267, 129
- Mo et al. (1998) Mo H. J., Mao S., White S. D. M., 1998, MNRAS, 295, 319
- Mowla et al. (2017) Mowla L., van Dokkum P., Merritt A., Abraham R., Yagi M., Koda J., 2017, ApJ, 851, 27
- Navarro et al. (2017) Navarro J. F., Benítez-Llambay A., Fattahi A., Frenk C. S., Ludlow A. D., Oman K. A., Schaller M., Theuns T., 2017, MNRAS, 471, 1841
- Noguchi (2001) Noguchi M., 2001, MNRAS, 328, 353
- Papastergis et al. (2016) Papastergis E., Adams E. A. K., van der Hulst J. M., 2016, A&A, 593, A39
- Paranjape & Sheth (2021) Paranjape A., Sheth R. K., 2021, MNRAS, 507, 632
- Pérez-Montaño & Cervantes Sodi (2019) Pérez-Montaño L. E., Cervantes Sodi B., 2019, MNRAS, 490, 3772
- Prole et al. (2019) Prole D. J., et al., 2019, MNRAS, 484, 4865
- Richards et al. (2018) Richards E. E., et al., 2018, MNRAS, 476, 5127
- Rong et al. (2017) Rong Y., Guo Q., Gao L., Liao S., Xie L., Puzia T. H., Sun S., Pan J., 2017, MNRAS, 470, 4231
- Rong et al. (2018) Rong Y., Li H., Wang J., et al. 2018, MNRAS, 477, 230
- Rong et al. (2020a) Rong Y., Dong X.-Y., Puzia T. H., et al. 2020a, ApJ, 899, 78
- Rong et al. (2020b) Rong Y., Zhu K., Johnston E. J., Zhang H.-X., Cao T., Puzia T. H., Galaz G., 2020b, ApJ, 899, L12
- Saburova et al. (2018) Saburova A. S., Chilingarian I. V., Katkov I. Y., Egorov O. V., Kasparova A. V., Khoperskov S. A., Uklein R. I., Vozyakova O. V., 2018, MNRAS, 481, 3534
- Saburova et al. (2021) Saburova A. S., Chilingarian I. V., Kasparova A. V., Sil’chenko O. K., Grishin K. A., Katkov I. Y., Uklein R. I., 2021, MNRAS, 503, 830
- Tully et al. (2009) Tully R. B., Rizzi L., Shaya E. J., Courtois H. M., Makarov D. I., Jacobs B. A., 2009, AJ, 138, 323
- Verheijen (1997) Verheijen M. A. W., 1997, PhD thesis, Univ. Groningen
- Wang et al. (2016) Wang J., Koribalski B. S., Serra P., van der Hulst T., Roychowdhury S., Kamphuis P., Chengalur J. N., 2016, MNRAS, 460, 2143
- Wheeler et al. (2019) Wheeler C., Hopkins P. F., Doré O., 2019, ApJ, 882, 46
- Wright et al. (2021) Wright A. C., Tremmel M., Brooks A. M., Munshi F., Nagai D., Sharma R. S., Quinn T. R., 2021, MNRAS, 502, 5370
- Wyder et al. (2009) Wyder T. K., et al., 2009, ApJ, 696, 1834
- Zhu et al. (2023) Zhu Q., Pérez-Montaño L. E., Rodriguez-Gomez V., Cervantes Sodi B., Zjupa J., Marinacci F., Vogelsberger M., Hernquist L., 2023, MNRAS, 523, 3991
- de Blok & McGaugh (1997) de Blok W. J. G., McGaugh S. S., 1997, MNRAS, 290, 533
- van Dokkum et al. (2015a) van Dokkum P. G., Abraham R., Merritt A., Zhang J., Geha M., Conroy C., 2015a, ApJ, 798, L45
- van Dokkum et al. (2015b) van Dokkum P. G., et al., 2015b, ApJ, 804, L26
- van Dokkum et al. (2018) van Dokkum P., et al., 2018, Nature, 555, 629