Rigorous ESR spectroscopy of impurity ion with oxygen vacancy in ferroelectric crystal at 20 mK
Abstract
Impurity ion electron spin resonance (ESR) spectroscopy using multiple dielectric modes in a dielectric resonator has been performed with a tuneable DC magnetic field of up to . The ion is substituted by ion forming octahedral complex with an iron-oxygen-vacancy . In such a metal-ligand complex, a giant g-factor of was observed in the ferroelectric phase at . The the change of ion center-symmetry in the complex as a soft-mode characteristics of ferroelectric phase transition and the influences of iron-oxygen-vacancy , interactively sensitive to asymmetry in the octahedral rotational parameter in .
.1 Introduction:
ESR spectroscopy, which implements dielectric crystal resonators operating with multiple modes has been proven as an effective method for study on impurity paramagnetic ions’ unpaired electron spin statesFarr et al. (2013); Benmessai et al. (2013); Buluta, Ashhab, and Nori (2011). This process assimilate a quantum-hybrid system by coupling unpaired electron spins with photonic modes of the dielectric crystal resonatorKurizkia,1 et al. (2015); Dumke et al. (2016); Bensky et al. (2011); Klinduhov and Boukheddaden (2016). The multi-mode ESR spectrum works as a direct probe providing information of electronic states of paramagnetic impurity ions. In this work, the ion has been detected in the site of the ion of the dielectric single crystal at . The properties of -metal-ligand complex in crystals are closely related to the central ion and the ligand ion revealing interesting physical characteristics. The variation of position along the central ion of complex have received an increasing amount of attention. The effect of ferroelectric (FE) phase transition on ESR due to such kind of central ion displacement reveals important characteristics of unpaired electron quantum states. At the temperature , the crystal is of rhombic symmetry in the ferroelectric (FE) phase deforming from cubic octahedral structure. This structural anisotropy plays a vital role in the mechanism of ESR. Optical spectroscopy and X-ray diffraction (XRD) results are available providing localization information of the ion in this type of crystalAbramov et al. (1995); Klaytae, Panthong, and Thountom (2013). In this experimental study of ESR, we justify the multi-valance ion’s measured spin-Hamiltonian parameters along with site symmetry considering delocalization and structural anisotropy.
Field confinement in is very high due to it extremely high permittivity at low temperatures, this allows only the loss mechanisms of the crystal itself to determine the resonator Q-factorKrupka et al. (1999); Le Floch et al. (2006); Gomilsek ; Krupka and Mazierska (2000). Required high Q-factors can be maintained due to no significant metal cavity or radiation losses, necessary to detect paramagnetic impurity ions of concentration level parts per million (ppm) to parts per billion (ppb) at . Low concentration of ions requires high sensitivity providing accurate information about the nature of the paramagnetic species, and its immediate surroundings which affect on the anisotropy, fine and hyperfine splitting.
Single crystal octahedral metal-ligand complex has a high crystal field (CF), with triplet()-doublet() orbital splitting of transition metals of about Zheng and Wu (2005); Brik and Avram (2009). crystallizes in a perovskite structure, space group Pm3m with a lattice constant of Å in cubic symmetry, and the distance is ÅBrik and Avram (2009). Rowley et al suggested that the FE phase transition temperature of was higher than confirming its phase transition from paraelectric (PE) to FERowley et al. (2014). In FE phase transitions, the average off-center displacement of the paramagnetic metal ion is about Å compared to lattice constant of the order ÅPolinger, Garcia-Fernandez, and Bersuker (2015). To cause a energy change on average a Å off-center displacementYablokov and Ivanova (1999) would be required. In this crystal field symmetry with little distortion of octahedral structure as tetragonal symmetry or ultimately rhombohedral symmetry; the spin-Hamiltonian parameters of paramagnetic ions were measured with respect to the basis of a crystal field model at low magnetic field (), and at high magnetic field by implementing P-band to X-band multiple mode frequencies.
.2 Electron Spin Resonance (ESR) spectroscopy:
For paramagnetic metal ions’ unpaired electrons in the condensed phase, the CF splitting and the spin-orbit coupling (SOC) are responsible for electronic interactions showing effective spin. In case of strong CF of , the combined effect of these two interactions may remove the orbital degeneracy of the energy levels of most metal ions completely, leaving a non-degenerate ground state with quenched orbital momentum. In the symmetry less than cubic, fine structure term will generally be present.
The and electron configuration of ion and ion orbital splitting in octahedral crystal field have the ground state as an orbital triplet . Low-spin in high crystal field follows the treatment as given by McGravey McGarvey (1998, 1975). Hence, the ion in this symmetry of high CF has effective spin forming a spin singlet state of orbitals. Under these conditions, only a small temperature independent susceptibility is observed for the ground stateAbragam and Bleaney (1970). In the case of ion low-spin state, the weak field sextet state is altered to spin state of effective spin attaining a lower energy in the lower symmetry of crystal. Within the triplet orbital ground state of fictitious orbital , we have only one electron spin-orbit coupling . For , fine structure term becomes zero. Hence, the spin-Hamiltonian for effective spin in applied external magnetic field along z-axis may be described asAbragam and Bleaney (1970)
| (1) |
where is the electron spin parallel g-factor, is the energy term of rhombic distortion and is the nuclear spin, is the hyperfine constant.
In case of low magnetic field , the spectroscopy is challenging in the state of zeeman transition energy less than hyperfine coupling energy. The spins and are strongly coupled, and, therefore, the spin system can not be described in the basis with electron magnetic moment quantum number and nuclear magnetic moment quantum number . The basis has to be used, where is the total quantum number and the magnetic moment quantum number of total spin with g-factor as in such a stateAbragam and Bleaney (1970). Hence, the description of the wave functions of the system for ion in in this basis areGuiberteau and Grucker (1996); Gillies, Sutcliffe, and Symms (1994)-
| (2) | |||||
where the angle , also and is the gyromagnetic ratio of electron and proton respectively.
For spectroscopy, the cylindrical crystal specimen of diameter and height was used. The modes utilised were in general low order with azimuthal variation to determined by computer simulation software based on the Method of Lines (MoL)Le Floch et al. (2006). The crystal was inserted centrally in an oxygen-free cylindrical copper cavity, and the modes were excited as a dielectric resonator with a Vector Network Analyzer sensing the modes in transmission by measuring . By matching measured and simulated mode frequencies, the relative permittivity of the crystal was estimated to be at room temperature K.
The crystal loaded cavity was cooled in a dilution refrigerator to less than . At this temperature, all the excited mode frequencies were confined within the range of frequency due to the increase of relative permittivity to the order of . High sensitivity of spectroscopy is required for such a very low concentration of impurity ions in this nearly pure crystal. Different process are devoted in measuring sensitivity of different type of resonator of wide range of frequency with varieties of probing systemAnnino et al. (1999); Longo (1991); Colligiani (1998); Anders, Angerhofer, and Boero (2012); Yap et al. (2015); Hosain et al. (2017a). Benmessai et al.Benmessai et al. (2013) described a concentration level measurement process of impurity ion exciting modes at millikelvin temperatures in sapphire. Anders et alAnders, Angerhofer, and Boero (2012) described a single-chip electron spin resonance detector operating at .
Practically, microwave-power and other terms are kept constant, the required minimum number of impurity ion follows the proportionalityP. Poole Jr. and Franch (1999) for detection of ESR transition spectrum, and is estimated generally as:
| (3) |
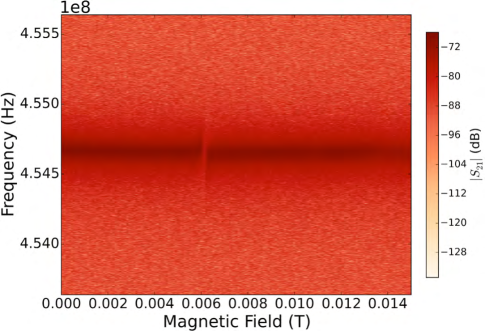
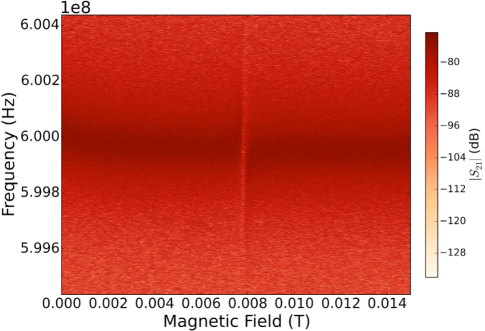
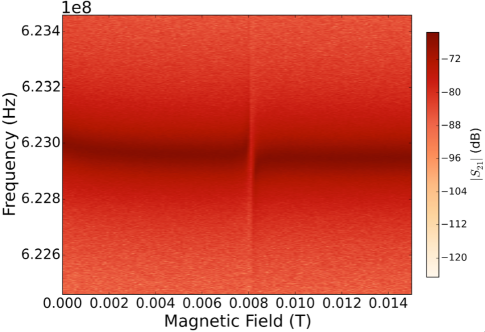
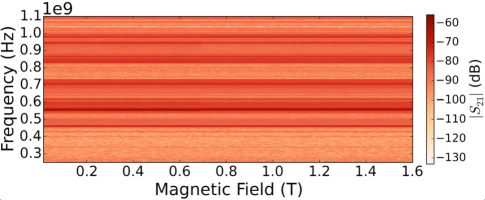
Where is the mode volume, is the sample temperature, S is the electron effective spin, is the electron g-factor, is the Bohr electron magneton, is the magnetic permeability of free space, is the resonance frequency, is the filling factor, is the noise power, is the microwave input power, and is the width of aggregated spin frequency at resonance which is depended on the shape-function normalized as for a wide range of Larmor precession of magnetic dipolesAbragam and Bleaney (1970). Significant output (transmission) occurs only at resonance in a very narrow frequency width in the region at ESRHosain et al. (2017a, b). This frequency width is about in the ferroelectric anisotropy of the crystal crystal (see Figs.1, 2 and 3), and -factor of the selected modes were about at temperature. This frequency width is quite large due to ferroelectric anisotropy effect. For ion with effective spin in this specimen, calculation using , the concentration level of ion about 1 ppm is required at in a state .
Ten modes with a frequency range of to , and thus monitor the transition spectrum by considering mode magnetic field vector at an angle of to the direction of the applied magnetic field . Such a mode field vector interaction in ESR is represented by the quantum-mechanical operatorGuiberteau and Grucker (1996); Gillies, Sutcliffe, and Symms (1994) composed with ladder operator .
The applied magnetic field between to was varied through the use of computer control, with a step width of . Each mode is scanned for a period of five seconds at each step of magnetic field. This slow sweep of magnetic field was applied under control of an in-house program to avoid heating above , with the microwave input power of . To avoid the addition of thermal noise from room temperature, a microwave attenuator was used at stage and another one at stage of the . Also, a attenuator was added at stage of the . These cold stage attenuation plus the use of a low noise temperature cryogenic amplifier after the resonator ensures good enough signal to noise ratio . From this measured multi-mode spectrum characteristics, we were able to identify the types of paramagnetic impurities present in the crystal including spin-Hamiltonian parameters.
.3 Results and Discussion
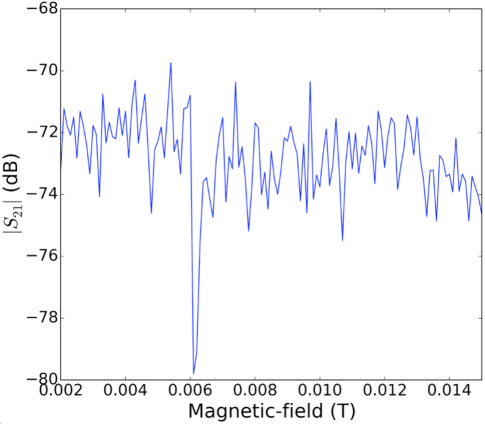
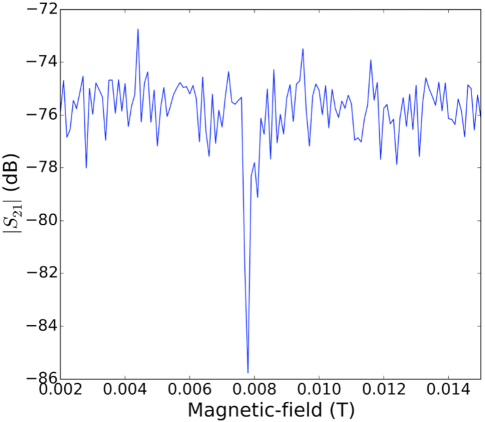
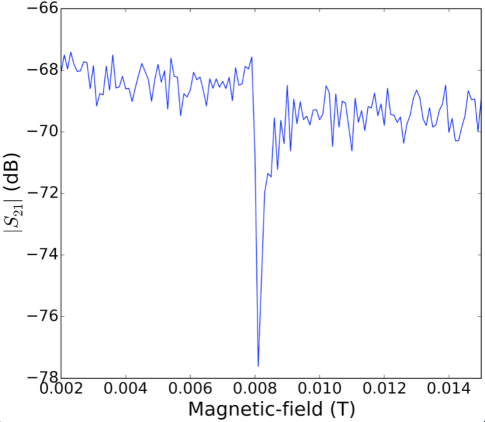
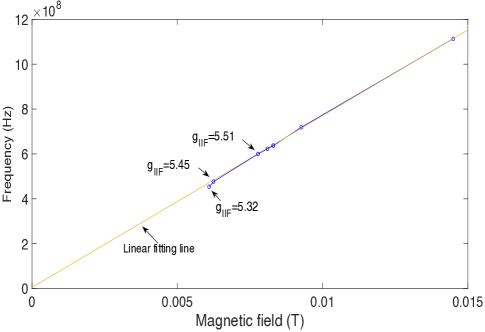
The ESR transitions are shown as color density plots in (Fig.1, 2 and 3). All of these transitions are presented in transmission () showing the intensity of transition and line shape in (Fig.4, 5 and 6). The calculated effective g-factor (see Fig.7) indicates a large magnetic moment of electron. The c-axis (z-axis) of the domain was parallel to the crystal direction. For the ion in the site of ion, an iron-oxygen-vacancy is consideredvon Waldkirch, Muller, and Berlinger (1972); Dashdorj, Zvanut, and Stanley (2010). An angular anisotropy of the makes spectrum very sensitive to local rotations of the oxygen octahedron. Mller and BerlingerMuller and Berlinger (1972) reported that a critical asymmetry in local fluctuations of the rotational parameter in for temperature (FE transition temperature), and is observed directly by the asymmetry of the paramagnetic resonance lines of pair centers. It is postulated that such an asymmetry is a general property of second order phase transitions. The results suggest that the ions in the defect centers are displaced away from the oxygen vacancy by about ÅZheng and Wu (2001).
Now ignoring the iron-oxygen-vacancy, only considering the FE phase transition geometric deformation of the cubic crystal structure of to tetragonal structure and ultimately to rhombohedron, the crystal anisotropy in the FE phase also creates nondegeneracy in orbital triplet. All the five electrons of ion at the site are in orbitals, and the configuration of one electron approximation is ascribed to a single hole in a filled -shell of orbital triplet. The basis states in the triplet splitting (Fig.8) by tetragonal elongation for low-spin state ion arePilbrow (1990):
| (4) |
where
| (5) | |||||
Where spin up or down is indicated by the or signs. The energy difference between and are assumed as . One electron spin-orbit coupling parameter has been used in the ratio .
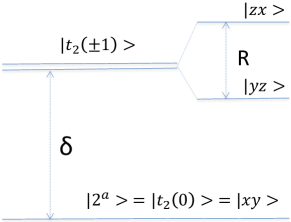
No initial splitting is apparent with fitting line in the characteristics graph () due to electronic quadrupole fine structure term with effective spin . Also, the eigenstate leads to principal -factors with orbital reduction factor asPilbrow (1990):
| (6) | |||||
The parameters and can be given simply with anisotropy angle with z-axis asAbragam and Bleaney (1970) and (the value differs in sign in this treatment).
With the variation of the angle from to the parallel -factor becomes equal to free electron value. The values of implies to a ground state with (equation- and ). The parameter is defined with Fermi-contact term as where is 1 for completely ionic bond, and if the overlap integral is vanishingly small then is for completely covalent bond(Kivelson and Neiman, 1961). It gives us information about impurity ion’s covalency in the site. Within this condition of bonding, there is no possible fitting value of according to equation-5 and 6 matching with the measured parallel g-factor . In fact this treatment is feasible for the estimation of tetragonal distortion of the octahedron, and not for in presence of iron-oxygen-vacancy in the octahedron where ion is displaced away from the oxygen vacancy by about ÅZheng and Wu (2001). As a supporting results of this matter, in our ESR spectroscopy measurement of low-spin trivalent ion the in crystal octahedron at , the considered value of is the fitted with the value according to the measured g-factor in the tetragonal anisotropyAbragam and Bleaney (1970); Wei, Wua, and Dongb (2005). The reason is that, in case of in , the trivalent ion is substituted by this trivalent ion without any possibility of iron-oxygen-vacancy in the octahedron. Also, an axial electron paramagnetic resonance (EPR) spectrum in iron doped (cubic) strontium titanate has been observed at and cm wavelength with effective g-values and respectivelyKirkpatrick, Muller, and Rubins (1964) in measurements with the constant magnetic field parallel to [001] of the crystal (these g-factor were perpendicular when the magnetic field is parallel to [100] of the crystal). The spectrum is attributed to ion in a strongly tetragonal electronic crystalline field produced by local charge compensation at a nearest neighbour oxygen site due to iron-oxygen-vacancy in the octahedron.
High field ESR spectroscopy does not show any ESR transition line (Fig.9). One reason is due to the extremely high permittivity of at low temperatures, so the specimen becomes over-moded at high frequency. For example, the selected modes from to at room temperature were lowered to the frequency range of to at as the relative permittivity increased from about to a value of the order of . Secondly, the Q-factor of the modes were only of the order of which is not good-enough to detect other impurity ions of very dilute concentration. Also, at this low Q-factor, it is not possible to observe ESR transition line of isotopes which have abundance of the ion concentration. So, only the iron element of atomic mass is the source of ion of nuclear spin . As a result low-field ESR transitions are confined eventually to as a spin half transitions with selection rule .
Although the asymmetry of iron-oxygen-vacancy is attributed to the dispersion of ESR lineMuller and Berlinger (1972); von Waldkirch, Muller, and Berlinger (1972), the observed results shows distinct (without overlapping) ESR line with little variation with the decrease of frequencies (Fig.4,5 and 6). The trend of asymmetry is significant down to P-band frequency (Fig.7).These transition lines would show mirror reflection to the right in rotational measurement. Mller et al analysed the spectrum in the tetragonal at a temperature showing mirror reflection of the ESR line in rotational measurementMuller and Berlinger (1972). In fact, the change of ion center-symmetry in the complex as a soft-mode characteristics of ferroelectric phase transition and the influences of iron-oxygen-vacancy , interactively sensitive to the asymmetry in the octahedral rotational parameter in and thus shows this mirror reflection of ESR line.
Also in addition to the tetragonal elongation, in the millikelvin temperature experiment of crystal, some lower order crystal symmetry like rhombic distortion is apparent. So, the term need to be considered. In such a rhombic distortion in the asymmetry of iron-oxygen-vacancy , it is observed that the ESR line in the Fig.6,5 and 4 comparatively a little broader in cascade as the decrease of transition frequency. Mller et al’s analysis with experiment supports this observation. This effect implies to a decrease of effective g-factor from 5.51 to 5.32 (Fig.7).
Acknowledgements.
This work was funded by Australian Research Council (ARC), Grant no. CE170100009. Thanks to Dr. Jeremy Bourhill for assistance with data acquisition and Mr. Steve Osborne for technical support..4 References:
References
- Farr et al. (2013) W. G. Farr, D. L. Creedon, M. Goryachev, K. Benmessai, and M. E. Tobar, Phys. Rev. B 88, 224426 (2013).
- Benmessai et al. (2013) K. Benmessai, W. G. Farr, D. L. Creedon, Y. Reshitnyk, J.-M. Le Floch, T. Duty, and M. E. Tobar, Phys. Rev. B 87, 094412 (2013).
- Buluta, Ashhab, and Nori (2011) I. Buluta, S. Ashhab, and F. Nori, Rep. Prog. Phys. 74, 104401 (2011).
- Kurizkia,1 et al. (2015) G. Kurizkia,1, P. Bertetb, Y. Kubob, K. Mølmerc, D. Petrosyand,e, P. Rablf, and J. Schmiedmayerf, PNAS 112, 3866 (2015).
- Dumke et al. (2016) R. Dumke, Z. Lu, J. Close, N. Robins, A. Weis, M. Mukherjee, G. Birkl, C. Hufnagel, L. Amico, M. G. Boshier, K. Dieckmann, W. Li, and T. C. Killian, Journal of Optics 18, 093001 (2016).
- Bensky et al. (2011) G. Bensky, R. Amsüss, J. Majer, D. Petrosyan, J. Schmiedmayer, and G. Kurizki, Quantum Information Processing 10, 1037 (2011).
- Klinduhov and Boukheddaden (2016) N. Klinduhov and K. Boukheddaden, J. Phys. Chem. Lett. 7, 722 (2016).
- Abramov et al. (1995) Y. A. Abramov, V. E. Z. V. G. Tsirelson, S. A. Ivanov, and I. D. Brown, Acta Crystal B51, 942 (1995).
- Klaytae, Panthong, and Thountom (2013) T. Klaytae, P. Panthong, and S. Thountom, Scientific Research and Essays 8, 32 (2013).
- Krupka et al. (1999) J. Krupka, K. Derzakowsk, M. E. Tobar, J. Hartnett, and R. G. Geyer, Meas. Sci. Technol. 10, 387 (1999).
- Le Floch et al. (2006) J.-M. Le Floch, J. D. Anstie, M. E. Tobar, J. G. Harnett, P.-Y. Bourgeois, and D. Cros, Physics Letters A 359, 1 (2006).
- (12) M. Gomilsek, Seminer: University of Ljubljana, Slovenia,Year:2012. .
- Krupka and Mazierska (2000) J. Krupka and J. Mazierska, IEEE Transactions On Microwave Theory And Techniques 48, 1 (2000).
- Zheng and Wu (2005) W.-C. Zheng and X.-X. Wu, Journal of Physics and Chemistry of Solids 66, 1701 (2005).
- Brik and Avram (2009) M. G. Brik and N. M. Avram, J. Phys.: Condens. Matter 21, 155502(9pp.) (2009).
- Rowley et al. (2014) S. E. Rowley, L. J. Spalek, R. P. Smith, M. P. M. Dean, M. Itoh, J. F. Scott, G. G. Lonzarich, and S. S. Saxena, Nature Physics 10, 367 (2014).
- Polinger, Garcia-Fernandez, and Bersuker (2015) V. Polinger, P. Garcia-Fernandez, and I. B. Bersuker, Physica B 457, 296 (2015).
- Yablokov and Ivanova (1999) Y. V. Yablokov and T. A. Ivanova, Coordination Chemistry Reviews 190-192, 1255 (1999).
- McGarvey (1998) B. R. McGarvey, QUIMICA NOVA 21, 206 (1998).
- McGarvey (1975) B. R. McGarvey, CAN. J. CHEM. 53, 2498 (1975).
- Abragam and Bleaney (1970) A. Abragam and B. Bleaney, Electron Paramagnetic Resonance of Transition Ions (Oxford University Press, 1970) Chap. Ions of the 3d group, pp. 365–490.
- Guiberteau and Grucker (1996) T. Guiberteau and D. Grucker, JOURNAL OF MAGNETIC RESONANCE B110, 47 (1996).
- Gillies, Sutcliffe, and Symms (1994) D. G. Gillies, L. H. Sutcliffe, and M. R. Symms, J. Chem. Soc. 90, 2671 (1994).
- Annino et al. (1999) G. Annino, M. Cassettari, I. Longo, and M. Martinelli, Appl.Magn.Reson. 16, 45 (1999).
- Longo (1991) I. Longo, Meas.Sci.Technol. 2, 1169 (1991).
- Colligiani (1998) A. Colligiani, Appl. Magn. Reson. 15, 39 (1998).
- Anders, Angerhofer, and Boero (2012) J. Anders, A. Angerhofer, and G. Boero, Journal of Magnetic Resonance 217, 19 (2012).
- Yap et al. (2015) Y. S. Yap, Y. Tabuchi, M. Negoro, and A. Kagawa, Review of Scientific Instruments 86, 0631101 (2015).
- Hosain et al. (2017a) M. Hosain, J.-M. L. Floch, J. Krupka, and M. Tobar, Journal of Magnetic Resonance 281, 209 (2017a).
- P. Poole Jr. and Franch (1999) C. P. Poole Jr. and H. A. Franch, Handbook of Electron Spin Resonance, Vol. 2 (Springer-Verlag, New York, 1999) Chap. Sensitivity, pp. 3–12.
- Hosain et al. (2017b) M. A. Hosain, J.-M. L. Floch, J. Krupka, and M. E. Tobar, J. Phys.: Condens. Matter 30, 015802(8pp) (2017b).
- von Waldkirch, Muller, and Berlinger (1972) T. von Waldkirch, K. A. Muller, and W. Berlinger, Physical Review B 5, 4324 (1972).
- Dashdorj, Zvanut, and Stanley (2010) J. Dashdorj, M. E. Zvanut, and L. J. Stanley, Journal of aplied Physics 107, 083513 (2010).
- Muller and Berlinger (1972) K. A. Muller and W. Berlinger, Physical Review Letter 29, 715 (1972).
- Zheng and Wu (2001) W. C. Zheng and S. Y. Wu, Appl. Magn. Reson. 20, 539 (2001).
- Pilbrow (1990) J. R. Pilbrow, Transition Ion Electron Paramagnetic Resonance (Oxford University Press, Walton Street, Oxford OX2, UK, 1990) Chap. 1, pp. 3–61.
- Kivelson and Neiman (1961) D. Kivelson and R. Neiman, The Joulnal of Chemical Physics 35, 149 (1961).
- Wei, Wua, and Dongb (2005) W.-H. Wei, S.-Y. Wua, and H.-N. Dongb, Z. Naturforsch 60a, 541 (March 2005).
- Kirkpatrick, Muller, and Rubins (1964) E. S. Kirkpatrick, K. A. Muller, and R. S. Rubins, Physical Review 135, 86 (1964).