11email: {thiago.alves,reginaldo.fernandes,ajalmar}@ifce.edu.br
Logic-based Explanations for Linear Support Vector Classifiers with Reject Option
Abstract
Support Vector Classifier (SVC) is a well-known Machine Learning (ML) model for linear classification problems. It can be used in conjunction with a reject option strategy to reject instances that are hard to correctly classify and delegate them to a specialist. This further increases the confidence of the model. Given this, obtaining an explanation of the cause of rejection is important to not blindly trust the obtained results. While most of the related work has developed means to give such explanations for machine learning models, to the best of our knowledge none have done so for when reject option is present. We propose a logic-based approach with formal guarantees on the correctness and minimality of explanations for linear SVCs with reject option. We evaluate our approach by comparing it to Anchors, which is a heuristic algorithm for generating explanations. Obtained results show that our proposed method gives shorter explanations with reduced time cost.
Keywords:
Logic-based explainable AI Support vector machines Classification with reject option.1 Introduction
††footnotetext: This preprint has not undergone peer review or any post-submission improvements or corrections. The Version of Record of this contribution is published in Intelligent Systems, LNCS, vol 14195, and is available online at https://doi.org/10.1007/978-3-031-45368-7 10.It is undeniable that Artificial Intelligence is increasingly being inserted into the daily lives of people [17], influencing the most complex decision taking tasks [25]. Consequently, the most varied classification models in machine learning may come across instances that are difficult to correctly classify, be it due to lack of good data, to feature bias (color, size, gender) [8] or to noise present on the given patterns [25].
The SVC is one of the most well-known ML models. The linear Support Vector Machine (SVM), specifically, has been used in a variety of classification problems [3, 23, 26]. However, the model can also fall into the same previously said pitfalls, failing to give a correct classification. As such, the reject option strategy depicted in [4] can be used to remedy such cases. Classification with reject option (RO) is a paradigm that aims to improve reliability in decision support systems by rejecting the classification results of more complex cases and avoiding a higher error rate. These cases are separated to be dealt with in another specialized way, be it through other models or with the assistance of a human specialist [20]. Since classification with reject option comprises a set of techniques, in this work we consider the strategy where the classifier is trained as usual and the rejected cases are determined after the training phase. Usually, this process requires finding a trade-off between the costs of misclassifications and rejections.
The linear SVC can already be globally interpreted to a certain extent based on the decision function, where the most important features are often associated with the highest weights [7]. Such analysis, however, is not capable of giving decisive answers on more specific cases [14]. An example of this is depicted and more thoroughly explored in Section 3. This gives a margin for questionable explanations, especially for when reject option is present due to the added level of complexity. Therefore the need for a more thorough, instance-based explanation method.
Then, in this work, we consider instance-based explanations. Specifically, the objective of instance-based explanations is to provide interpretable insights by highlighting relevant features that influenced the output of an ML model on a given instance. By linking the output to specific instances and their features, users can gain a better understanding of the reasons behind the predictions of ML models.
The popularization of concepts of Explainable Artificial Intelligence (XAI) increased efforts to explain most complex models [12]. These have mostly been done through heuristic methods, the more prevalent approach, such as LIME [22], SHAP [18], and Anchors [21]. These tend to be model-agnostic and not able to guarantee a trustworthy explanation with regard to the characteristics of the model or the correctness of the answers [11]. Then, their explanations can be often proven wrong through counterexamples that expose their contradictions [11, 12], leading to even more doubts regarding how much the ML model can be trusted.
Thus, the importance of trustworthy ML models increases the need for logic-based approaches to explain the decisions made by these models [10, 12]. The computation of explanations in these approaches rigorously explores the entire feature space. Due to this, such explanations are provably correct and hold for any point in the space, which therefore makes them trustworthy [8]. Moreover, logic-based approaches can guarantee minimality of explanations. Minimality is important since succinct explanations seem easier to be interpreted by humans. Recent years have seen a surge in research dedicated to investigating logic-based XAI for ML models, such as neural networks, naive Bayes, random forests, decision trees, and boosted trees [1, 9, 10, 13, 16, 19].
Due to the importance of reject option and logic-based explainability for trustworthy ML models, this work proposes a logic-based approach to explain linear SVCs with reject option. Given that rejected instances may be further analyzed by specialists, explanations regarding the causes of rejections can reduce the workload of these professionals. Our proposal builds on work from the literature of logic-based explainability for traditional ML models, i.e. without reject option [10, 11]. We compute explanations for linear SVCs with reject option by solving a set of logical constraints, specifically, boolean combinations of linear constraints. Despite the fact that we consider a linear SVC with reject option in this work, our approach can be easily adapted for other ML models with reject option, such as neural networks.
We conducted experiments to compare our approach against Anchors, a heuristic method that generates explanations by locally exploring the feature subspace close to a given instance [21], through six different datasets. The results show that our approach is capable to generate succinct explanations up to 286 times faster than Anchors, in scenarios with and without the presence of reject option.
2 Background
2.1 Machine Learning and Binary Classification Problems
In machine learning, binary classification problems are defined over a set of features and a set of two classes . In this paper, we consider that each feature takes its values from the domain of real numbers. Moreover, each feature has an upper bound and a lower bound such that . Then, each feature has domain . Besides, the notation represents a specific point or instance such that each is in the domain of .
A binary classifier is a function that maps elements in the feature space into the set of classes . For example, can map instance to class . Usually, the classifier is obtained by a training process given as input a training set , where is an input vector or pattern and is the respective class label. Then, for each input vector , its input values , , …, are in the domain of corresponding features , …, . A well-known classifier and its training process are presented in Subsection 2.2.
2.2 Support Vector Machine
The SVM [5] is a supervised machine learning model often used for classification problems. It uses the concept of an optimal separating hyperplane depicted in [2, 5] to separate the data. On a space, such a hyperplane is defined by a set of points that satisfies
| (1) |
where is the optimal weight vector, is a feature vector with features and an intercept (bias) .
A given training set is said to be linearly separable if there is and that guarantees the separation between positive and negative class patterns without error. In other words, the following inequalities
| (2) |
must be satisfied to obtain the optimal hyperplane .
A Hard Margin SVM (SVM-HM) [24] can be used when the data is linearly separable and misclassifications are not allowed, maximizing the margin between two hyperplanes, and , parallel to . There can be no training patterns between and . Once maximizing the margin is similar to minimizing , the optimization problem for obtaining the optimal parameters for the SVM can be described as follows:
| (3) | ||||
| s.t. |
Thus, the decision function used for classifying input instances is defined in the following:
| (4) |
while the predicted label of an input is given by
| (5) |
However, in real-world problems, the training patterns from the two classes can not be linearly separated by a hyperplane due to data overlapping. In order to overcome this situation, one must use Soft-Margin SVMs (SVM-SM) in which misclassifications are allowed to happen. To do so, slack variables can be used to relax the constraints of the SVM-HM [5, 24]. Given this, the optimization problem for Soft-Margin SVMs is described as
| (6) | |||||
| s.t. | |||||
where is a trade-off between and . Thus, for a high enough value of , minimizing the sum of errors while maximizing the separation margin leads toward the optimal hyperplane. This can be the same as the one found through SVM-HM if the data is linearly separable. Moreover, the decision function and predicted label for SVM-HM and SVM-SM are the same.
2.3 Reject Option Classification
Reject option for classification problems, as depicted in [4], is a set of techniques that aim to improve reliability in decision support systems. In the case of a binary problem, it consists in withholding and rejecting a classification result that is ambiguous enough, i.e. when the instance is too close to the decision boundary of the classifier. For the linear SVC, it is when the instance is too close to the separating hyperplane. Then, these rejected instances are analyzed through another classification method or even by a human specialist [20].
In applications where a high degree of reliability is needed and misclassifications can be too costly, rejecting to classify a pattern can be more beneficial than the risk of a higher error rate due to wrong classifications [6]. According to [4], the optimal classifiers that best handle such a relation can be achieved by the minimization of the empirical risk
| (7) |
where is the ratio of the number of rejected training patterns to the number of patterns in the entire training dataset; is the ratio of the number of misclassified patterns to the number of all the training patterns without including those ones rejected; and is a weight denoting the cost of rejection. A lower gives room for a decreasing error rate at the cost of a higher quantity of rejected instances, with the opposite happening for a higher .
A method is presented in [20] for single, standard binary classifiers that do not provide probabilistic outputs. For SVCs, the proposed rejection techniques are based on the distance of patterns to the optimal separating hyperplane. If the distance value is lower than a predefined threshold, then the pattern is rejected. As such, a rejection region is determined after the training step of the classifier, with a threshold containing appropriate values being applied to the output of the classifier. Therefore, applying this strategy to a standard binary SVC leads to the following prediction cases:
| (8) |
where and are the thresholds for the positive class and negative class, respectively, and 0 is the rejection class. Furthermore, these thresholds are chosen to generate the optimal reject region, which corresponds to the region that minimizes the empirical risk by producing both the ratio of misclassified patterns and the ratio of rejected patterns .
2.4 Heuristic-Based XAI
Some ML models are able to be interpreted by nature, such as decision trees [22]. Others, such as neural networks and boosted trees, have harder-to-explain outputs, leading to the use of specific methods to get some degree of explanation [11]. One of the most predominant ways to achieve this is through the use of heuristic methods for generating instance-dependent explanations, which can be defined as a local approach. These analyze and explore the sub-space close to the given instance [8, 11].
Some of the most well-known heuristic methods are LIME, SHAP, and Anchors. These approaches are model-agnostic, generating local explanations while not taking into account the instance space as a whole [18, 21, 22]. This, in turn, allows the explanations to fail when applied, since they can be consistent with instances predicted in different classes. Moreover, they can include irrelevant elements which could be otherwise removed while still maintaining the correctness of the answer [12]. Explanations with irrelevant elements may be harder to understand.
Anchors have been shown as a superior version to LIME, having a better accuracy with the resultant explanations [21]. This rule-based method is designed to highlight which parts (features) of a given instance are sufficient for a classifier to make a certain prediction while being intuitive and easy to understand. However, it still gives room for wrong explanations due to the local characteristic, which can lead to cases where, for the same set of rules given by the explanation, different classes are predicted [11]. Therefore, both explanation validity and size can be set as of questionable utility if they can not be fully relied upon.
2.5 First-Order Logic
In order to give explanations with guarantees of correctness, we use first-order logic (FOL) [15]. We use quantifier-free first-order formulas over the theory of linear real arithmetic. Then, first-order variables are allowed to take values from the real numbers. Therefore, we consider formulas as defined below:
| (9) |
| (10) |
such that and are quantifier-free first-order formulas over the theory of linear real arithmetic. Moreover, represents the atomic formulas such that , each and are concrete real numbers, and each is a first-order variable. For example, is a formula by this definition. Observe that we allow standard abbreviations as for .
Since we are assuming the semantics of formulas over the domain of real numbers, an assignment for a formula is a mapping from the first-order variables of to elements in the domain of real numbers. For instance, is an assignment for . An assignment satisfies a formula if is true under this assignment. For example, satisfies the formula in the above example, whereas does not satisfy it.
A formula is satisfiable if there exists a satisfying assignment for . Then, the formula in the above example is satisfiable since satisfies it. As another example, the formula is unsatisfiable since no assignment satisfies it. The notion of satisfiability can be extended to sets of formulas . A set of first-order formulas is satisfiable if there exists an assignment of values to the variables that makes all the formulas in true simultaneously. For example, is satisfiable given that jointly satisfies each one of the formulas in the set. It is well known that, for all sets of formulas and all formulas and ,
| (11) | ||||
Given a set of formulas and a formula , the notation is used to denote logical consequence, i.e., each assignment that satisfies all formulas in also satisfies . As an illustrative example, let be and be . Then, since each satisfying assignment for all formulas in is also a satisfying assignment for . Moreover, it is widely known that, for all sets of formulas and all formulas ,
| (12) |
For instance, has no satisfying assignment since an assignment that satisfies also satisfies and, therefore, does not satisfy .
Finally, we say that two first-order formulas and are equivalent if, for each assignment , both and are true under or both are false under . We use the notation to represent that and are equivalent. For example, is equivalent to . Besides, these formulas are equivalent to .
3 Linear SVCs may not be Instance-based Interpretable
Efforts have been made to bring explanations to linear SVCs prediction outputs. These have often been done through the analysis of the weights that compose the decision function, where the most important features are associated with the highest weights [7]. However, this may not be enough to enable correct interpretations. Although feature weights can give a rough indication of the overall relevance of features, they do not offer insight into the local decision-making process for a specific set of instances [14].
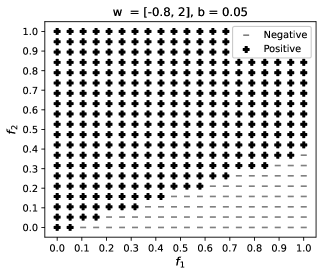
Assume a binary classification problem where , and a linear SVC where and . The features can take values in range . A visual representation is depicted in Figure 1. Analyzing solely through the values of the weights, it could be assumed that the feature is determinant and is not, since . This would mean that, for any instance, feature is more important than feature . However, for the instance predicted as class , feature is not necessary for the prediction, since for any value of the class will not change. Therefore, feature is sufficient for the prediction of this instance. Moreover, feature is not sufficient for the prediction of this instance, since for and the prediction would change to . Therefore, for instance , feature would be determinant and would not.
While it is trivial to observe if feature and can be determinant, due to the simplicity of the given decision function, it becomes harder to do so as the number of features increases. Furthermore, the presence of reject option adds another layer of complexity to the problem, turning the interpretation task very non-trivial. Hence, explanations given by weights evaluation may give room for incorrect interpretations. This raises the need for an approach to compute explanations with guarantees of correctness for linear SVCs with reject option.
4 Explanations For Linear SVMs with Reject Option
As depicted before, most methods that generate explanations for ML models are heuristic, which can bring issues about how correct and trustworthy the generated answers are. Added that they tend not to take into account whether reject option is present, these problems are further aggravated. As such, an approach that guarantees the correctness of explanations for ML models with reject option is due.
In this work, we are considering instance-based explanations, i.e. given a trained linear SVC with reject option and an instance classified as class , an explanation is a subset of the instance sufficient for the prediction . Therefore, by fixing the values of the features in , the prediction is guaranteed to be , regardless of the values of the other features.
Our approach is achieved through the encoding of the linear SVC with reject option as a first-order formula, following the ideas of [10] for neural networks. Here we need to take into account the reject option and its encoding as a first-order formula. For example, given a trained linear SVC with reject option defined by , , and as in Equations 4 and 8, and an instance classified as class , i.e. in the rejection class, we define the first-order formula :
| (13) |
Therefore, given an instance such that its features are defined by , an explanation is a subset such that . In other words, prediction is guaranteed to be in the rejection class. Instances predicted in other classes are treated in a similar way. For example, if instance is classified as class , is defined as . It is worth noting that, in these formulas, each is a first-order variable, and , , and each are concrete real numbers.
Since succinct explanations seem easier to understand, one would like to be minimal, that is, for all subset , . Therefore, if is minimal, then each of its subsets does not guarantee the same prediction. Informally, a minimal explanation provides an irreducible explanation that is sufficient for guaranteeing the prediction.
Earlier work [10] outlined Algorithm 1 for computing minimal explanations for neural networks. By leveraging the insights from this earlier work, we can effectively employ Algorithm 1 to find a minimal explanation for linear SVCs with reject option given , and . The minimal explanation of is calculated by setting to and then removing feature by feature from . For example, given a feature in , if , then the value of feature is not necessary to ensure the prediction, and then it is removed from . Otherwise, if , then is kept in since it is necessary for the prediction. This process is performed for all features as described in Algorithm 1. Then, at the end of Algorithm 1, for the values of features in , the prediction is the same and invariant with respect to the values of the remaining features.
By the result in 12, verifying entailments of the form can be done by testing whether the set of first-order formulas is unsatisfiable. If is equivalent to a disjunction as in 13, then we must check whether is unsatisfiable and is unsatisfiable, by the result in 11.
Moreover, since is a set of linear constraints and and are linear constraints, the unsatisfiability checkings can be achieved by two queries answered by a linear programming (LP) solver. Therefore, if, for example, the set of linear constraints has a solution, then . From a computational complexity view-point, the linear programming problem is solvable in polynomial time. Then, our approach for computing minimal explanations for linear SVCs with reject option can also be solved in polynomial time. This is achieved by a linear number of calls to an LP solver, which further contributes to the efficiency and feasibility of our approach.
5 Experiments
In this paper, a total of 6 datasets are used. The Vertebral Column and the Sonar datasets are available on the UCI machine learning repository.111https://archive.ics.uci.edu/ml/datasets.php The Pima Indians Diabetes dataset is available on Kaggle.222https://www.kaggle.com/datasets/uciml/pima-indians-diabetes-database The Iris, the Breast Cancer Wisconsin, and the Wine datasets are available through the scikit-learn package.333https://github.com/scikit-learn/scikit-learn/tree/main/sklearn/datasets/data All attributes were scaled to the range .
The Iris and the Wine dataset have three classes and have been adapted to be binary classification problems, changed to setosa-versus-all and class_0-versus-all, respectively. The other datasets have two classes. The classes were changed to follow values in . A summary of the datasets is presented in Table 1.
| Dataset | Acronym | Negative Patterns | Positive Patterns | |
|---|---|---|---|---|
| Iris | IRIS | 4 | 50 | 100 |
| Vertebral Column | VRTC | 6 | 100 | 210 |
| Pima | PIMA | 8 | 500 | 268 |
| Wine | WINE | 13 | 59 | 119 |
| Breast Cancer Wisconsin | BRCW | 30 | 212 | 357 |
| Sonar | SONR | 60 | 111 | 97 |
The classifiers. For each dataset, a linear SVC was trained based on 70% of the original data, with a regularization parameter and stratified sampling. For finding the rejection region, a value of was used together with the decision function outputs based on training data. The selected rejection thresholds were obtained by minimizing the empirical risk, as described in Subsection 2.3. All patterns were used for generating explanations, including both the ones used for training and testing. This is due to the focus on explaining rather than model evaluation.
For defining the values of and , we determine a range of thresholds containing the respective possible candidates. The maximum absolute value for and in , respectively, is the highest and lowest output value of the decision function, i.e. the and the , based on the training patterns. Thus, the attainable thresholds are achieved through
| (14) |
Hence, the selected values of and are the pair that minimizes the empirical risk . In addition, using , we obtained the best reject region defined by and , the test accuracy of the classifier with RO, and the rejection ratio based on test data. The test accuracy of a classifier with RO is the standard test accuracy applied only to non-rejected instances. Afterward, we determine the number of patterns per class from both training and test data, i.e. the entire datasets. Table 2 details these results and also the test accuracy of the classifier without reject option.
| Dataset | Accuracy w/o RO | Accuracy w/ RO | Rejection | Negative | Rejected | Positive | ||
|---|---|---|---|---|---|---|---|---|
| IRIS | -0.0157 | 0.0352 | 100.0% | 100.00% | 00.00% | 50 | 0 | 100 |
| VRTC | -0.3334 | 0.8396 | 76.34% | 89.65% | 47.92% | 22 | 139 | 149 |
| PIMA | -1.1585 | 0.8312 | 76.62% | 92.20% | 59.59% | 232 | 474 | 62 |
| WINE | -0.0259 | 0.0243 | 96.29% | 96.29% | 00.56% | 56 | 1 | 121 |
| BRCW | -0.4914 | 0.2370 | 97.66% | 98.76% | 04.02% | 190 | 25 | 354 |
| SONR | -0.3290 | 0.2039 | 74.60% | 79.59% | 20.00% | 76 | 43 | 89 |
Observe that the reject region for the IRIS dataset did not return any rejected patterns in the dataset. This is likely due to the problem being linearly separable. Therefore, since our experiments rely on explaining the instances present in the dataset, this case of the IRIS dataset is treated as if reject option is not present.
The reject region obtained for the WINE dataset did not reject any of the test patterns, therefore having no change in accuracy, likely due to the fact that the value chosen for penalizes rejections too harshly. For the other datasets, the presence of reject option lead to a higher accuracy in all cases. This is expected since the rejected patterns are not taken into account for evaluation. In addition, there was a substantial increase for both the VRTC and the PIMA dataset at the cost of rejecting roughly 48% and 60% of all the test patterns, respectively. Different values for can be used to achieve desirable results, depending on how much a rejection must be penalized in each dataset.
Anchors. We compared our approach against the heuristic method Anchors for computing explanations. Anchors was designed to work with traditional multiclass classification problems, i.e. classifiers without reject option. Then, since we are explaining predictions of a linear SVC with reject option, we used the Anchors explanation algorithm to treat the classifier with reject option as if it were a traditional classifier with classes in .
Our approach. The prototype implementation of our approach444https://github.com/franciscomateus0119/Logic-based-Explanations-for-Linear-Support-Vector-Classifiers-with-Reject-Option is written in Python and follows Algorithm 1. As an LP solver to check unsatisfiability of sets of first-order sentences, we used Coin-or Branch-and-Cut (CBC)555https://github.com/coin-or/Cbc. Moreover, the solver is accessed via the Python API PuLP666https://github.com/coin-or/pulp.
5.1 Results
A per-instance explanation is done for each dataset. Both mean elapsed time (in seconds) and the mean of the number of features in explanations are used as the basis for comparison. The results based on the former and the latter are presented in Table 3 and Table 4, respectively. Following the IRIS dataset description in Table 2, there are no results for the rejected class.
| Dataset | Negative | Rejected | Positive | |||
| Anchors | Ours | Anchors | Ours | Anchors | Ours | |
| IRIS | 0.13 0.045 | 0.04 0.004 | - | - | 0.05 0.024 | 0.04 0.005 |
| VRTC | 0.27 0.049 | 0.07 0.004 | 0.33 0.147 | 0.12 0.018 | 0.28 0.156 | 0.07 0.002 |
| PIMA | 0.85 0.162 | 0.10 0.001 | 0.27 0.302 | 0.16 0.021 | 0.61 0.108 | 0.10 0.002 |
| WINE | 3.01 0.335 | 0.17 0.002 | 1.60 0.000 | 0.21 0.000 | 0.38 0.532 | 0.17 0.002 |
| BRCW | 26.58 4.268 | 0.42 0.015 | 20.66 3.506 | 0.55 0.072 | 5.84 9.686 | 0.41 0.013 |
| SONR | 233.26 70.550 | 0.86 0.011 | 257.51 16.267 | 1.27 0.258 | 246.14 51.82 | 0.86 0.019 |
| Dataset | Negative | Rejected | Positive | |||
| Anchors | Ours | Anchors | Ours | Anchors | Ours | |
| IRIS | 3.52 0.854 | 3.00 0.000 | - | - | 1.89 0.733 | 2.2 0.400 |
| VRTC | 4.95 1.580 | 5.18 0.574 | 4.56 1.941 | 4.99 0.515 | 4.24 2.077 | 4.20 1.118 |
| PIMA | 7.50 1.534 | 5.13 0.944 | 3.02 2.249 | 4.71 0.897 | 6.37 2.541 | 4.85 1.119 |
| WINE | 12.98 0.132 | 7.44 1.252 | 13.00 0.000 | 12.00 0.000 | 2.80 2.803 | 7.04 1.605 |
| BRCW | 29.17 4.372 | 22.29 3.739 | 29.64 1.763 | 27.08 1.016 | 7.70 11.024 | 23.08 2.208 |
| SONR | 51.10 20.075 | 50.39 4.283 | 57.95 9.233 | 56.16 1.413 | 54.86 14.625 | 51.78 1.413 |
Our approach has shown to be up to, surprisingly, roughly times faster than Anchors. This happened for the SONR dataset, where the mean elapsed time of our method is seconds against seconds for Anchors. These results show how much harder it can be for Anchors to give an explanation as the number of features increases. Furthermore, it is worth noting that our approach needs much less time to explain positive, negative, and rejected classes overall.
While our approach obtained more extensive explanations in certain cases, it also demonstrated the ability to be more succinct, generating explanations that were up to smaller in other cases. In addition, our method is able to maintain the correctness of explanations. This highlights an expressive advantage of our approach over the heuristic nature of Anchors. While Anchors may provide explanations with fewer features in some cases, this is achieved due to the lack of formal guarantees on correctness.
It is important to note that cases similar to what we discussed in Section 3 occurred for the IRIS dataset. Through weights and , obtained from the trained SVC, it could be assumed that feature might possibly be not determinant for the classification. Explanation results for both negative and positive classes are presented in Table 5, depicting the number of times each feature was present in explanations with our approach.
| Class | Patterns | ||||
|---|---|---|---|---|---|
| Positive | 0 | 28 | 100 | 92 | 100 |
| Negative | 1 | 49 | 50 | 50 | 50 |
For example, for the instance in class , feature was in the explanation, while feature was not present. Then, for any value that assumes, the predicted class will not change. Furthermore, similar cases happened where was in the explanation while was not, even though .
Similar occurrences are present in other datasets, reinforcing that the points discussed in Section 3 are not uncommon. As one more illustrate example, consider the linear SVC with reject option trained on the VRTC dataset such that , , and . For the instance in the reject class, feature was not in the explanation, while is present in the explanation, despite the fact that . This is substantial for our approach since it demonstrates its capability of finding such cases.
6 Conclusions
In this paper, we propose a logic-based approach to generate minimal explanations for a classifier with reject option while guaranteeing correctness. A trained linear SVC with reject option is used as a target model for explainability. Our approach is rooted in earlier work on computing minimal explanations for standard machine learning models without reject option. Therefore, we encode the task of computing explanations for linear SVCs with reject option as a logical entailment problem. Moreover, we use an LP solver for checking the entailment, since all first-order sentences are linear constraints with real variables and at most one disjunction occurs.
Our method is compared against Anchors, one of the most well-known heuristic methods, through six different datasets. We found that not only the proposed method takes considerably less time than Anchors, but also reduces the size of explanations for many instances. Our approach achieved astonishing results in terms of efficiency, surpassing Anchors by an impressive factor of up to approximately 286 times.
Our approach can be further improved in future work. For example, it can be easily adapted to other classifiers with reject option, such as neural networks and random forests. In addition, it can be adjusted for a non-linear SVM. Another improvement is the generalization of explanations by allowing a range of values for each feature, rather than solely considering equality. This improvement may enable a more comprehensive understanding of the model.
6.0.1 Acknowledgments.
The authors thank FUNCAP and CNPq for partially supporting our research work.
References
- [1] Audemard, G., Bellart, S., Bounia, L., Koriche, F., Lagniez, J.M., Marquis, P.: On preferred abductive explanations for decision trees and random forests. In: Thirty-First International Joint Conference on Artificial Intelligence IJCAI-22. pp. 643–650 (2022)
- [2] Boser, B.E., Guyon, I.M., Vapnik, V.N.: A training algorithm for optimal margin classifiers. In: Proceedings of the fifth annual workshop on Computational learning theory. pp. 144–152 (1992)
- [3] Chlaoua, R., Meraoumia, A., Aiadi, K.E., Korichi, M.: Deep learning for finger-knuckle-print identification system based on PCANet and SVM classifier. Evolving Systems 10(2), 261–272 (2019)
- [4] Chow, C.: On optimum recognition error and reject tradeoff. IEEE Transactions on Information Theory 16(1), 41–46 (1970)
- [5] Cortes, C., Vapnik, V.: Support-vector networks. Machine learning 20, 273–297 (1995)
- [6] De Oliveira, A.C., Gomes, J.P.P., Neto, A.R.R., de Souza, A.H.: Efficient minimal learning machines with reject option. In: 2016 5th Brazilian Conference on Intelligent Systems (BRACIS). pp. 397–402. IEEE (2016)
- [7] Guyon, I., Weston, J., Barnhill, S., Vapnik, V.: Gene selection for cancer classification using support vector machines. Machine learning 46, 389–422 (2002)
- [8] Ignatiev, A.: Towards trustable explainable ai. In: IJCAI. pp. 5154–5158 (2020)
- [9] Ignatiev, A., Izza, Y., Stuckey, P.J., Marques-Silva, J.: Using maxsat for efficient explanations of tree ensembles. In: Proceedings of the AAAI Conference on Artificial Intelligence. vol. 36, pp. 3776–3785 (2022)
- [10] Ignatiev, A., Narodytska, N., Marques-Silva, J.: Abduction-based explanations for machine learning models. In: Proceedings of the AAAI Conference on Artificial Intelligence. vol. 33, pp. 1511–1519 (2019)
- [11] Ignatiev, A., Narodytska, N., Marques-Silva, J.: On validating, repairing and refining heuristic ML explanations. CoRR abs/1907.02509 (2019)
- [12] Ignatiev, A., Narodytska, N., Marques-Silva, J.: On formal reasoning about explanations. In: RCRA (2020)
- [13] Izza, Y., Ignatiev, A., Marques-Silva, J.: On explaining decision trees. arXiv preprint arXiv:2010.11034 (2020)
- [14] Krause, J., Dasgupta, A., Swartz, J., Aphinyanaphongs, Y., Bertini, E.: A workflow for visual diagnostics of binary classifiers using instance-level explanations (2017)
- [15] Kroening, D., Strichman, O.: Decision procedures. Springer (2016)
- [16] La Malfa, E., Michelmore, R., Zbrzezny, A.M., Paoletti, N., Kwiatkowska, M.: On guaranteed optimal robust explanations for NLP models. In: Proceedings of the Thirtieth International Joint Conference on Artificial Intelligence, IJCAI-21. pp. 2658–2665 (2021)
- [17] LeCun, Y., Bengio, Y., Hinton, G.: Deep learning. nature 521(7553), 436–444 (2015)
- [18] Lundberg, S.M., Lee, S.I.: A unified approach to interpreting model predictions. Advances in neural information processing systems 30 (2017)
- [19] Marques-Silva, J., Gerspacher, T., Cooper, M., Ignatiev, A., Narodytska, N.: Explaining naive bayes and other linear classifiers with polynomial time and delay. Advances in Neural Information Processing Systems 33, 20590–20600 (2020)
- [20] Mesquita, D.P., Rocha, L.S., Gomes, J.P.P., Rocha Neto, A.R.: Classification with reject option for software defect prediction. Applied Soft Computing 49, 1085–1093 (2016)
- [21] Ribeiro, M., Singh, S., Guestrin, C.: Anchors: High-precision model-agnostic explanations. Proceedings of the AAAI Conference on Artificial Intelligence 32 (04 2018)
- [22] Ribeiro, M.T., Singh, S., Guestrin, C.: "why should I trust you?" explaining the predictions of any classifier. In: Proceedings of the 22nd ACM SIGKDD international conference on knowledge discovery and data mining. pp. 1135–1144 (2016)
- [23] Richhariya, B., Tanveer, M., Rashid, A.H., Initiative, A.D.N., et al.: Diagnosis of alzheimer’s disease using universum support vector machine based recursive feature elimination (USVM-RFE). Biomedical Signal Processing and Control 59, 101903 (2020)
- [24] Vapnik, V.: Statistical learning theory. Wiley (1998)
- [25] Weld, D.S., Bansal, G.: Intelligible artificial intelligence. CoRR abs/1803.04263 (2018)
- [26] Yang, W., Si, Y., Wang, D., Guo, B.: Automatic recognition of arrhythmia based on principal component analysis network and linear support vector machine. Computers in biology and medicine 101, 22–32 (2018)