Fully automated workflow for the design of patient-specific orthopaedic implants: application to total knee arthroplasty
Abstract
Osteoarthritis affects about 528 million people worldwide, causing pain, swelling and stiffness in the joints. Arthroplasty is commonly performed to treat joint osteoarthritis, reducing pain and improving mobility. While arthroplasty has known several technical improvements, a significant share of patients are still unsatisfied with their surgery. Personalised arthroplasty improves surgical outcomes however current solutions require delays, making it difficult to integrate in clinical routine. We propose a fully automated workflow to design patient-specific implants. The proposed approach is presented for total knee arthroplasty, the most widely performed arthroplasty in the world nowadays.
The proposed pipeline first uses artificial neural networks to segment the proximal and distal extremities of the femur and tibia bones. Then the full bones are reconstructed using augmented statistical shape models, combining shape and landmarks information. Finally, a total of 77 morphological parameters are computed to design patient-specific implants. The developed workflow has been trained using 91 CT scans of lower limb. Its performance has been evaluated on 41 CT scans manually segmented, in terms of accuracy and execution time.
The workflow accuracy was for the segmentation, 1 for the full bones reconstruction, and for the anatomical landmarks determination. The custom implants fitted the patients’ anatomy with accuracy. The whole process from segmentation to implants’ design lasted about 5 minutes.
The proposed workflow allows for a fast and reliable personalisation of knee implants, directly from the patient CT image without requiring any manual intervention. It allows the establishment of a patient-specific pre-operative planning for TKA in a very short time making it easily available for all patients. Combined with efficient implant manufacturing techniques, this solution could help answer the growing number of arthroplasties while reducing complications and improving the patients’ satisfaction.
1 Introduction
Osteoarthritis (OA) affects about 528 million people worldwide, causing pain, swelling and stiffness in the joints [1]. Total joint arthroplasty is commonly performed to treat OA, when the joint is too severely affected and palliative approaches can no longer alleviate pain or improve mobility. Joint replacement surgery has evolved significantly since its conception. It gained acceptance with ever-improving implant survivorship and now aims to provide a ‘forgotten joint’ to most patients. To do so, personalising joint replacement is the key solution to restore native joint kinematics, function, and perception [2]. Continuous research efforts are conducted in that sense, mostly for hip and knee replacements. Indeed, they are by far the most performed arthroplasties nowadays, followed by shoulder, elbow, foot/ankle and hand/wrist replacements [3, 4]. Although they provide excellent clinical results, a major problem in total knee arthroplasty (TKA) compared to total hip arthroplasty, remains the high number of patients who are still not satisfied with the results of the surgery [5].
The number of TKA procedures has been rising steadily since the 1990s in Europe and the USA, and this increase is forecast to continue for the next decades [6, 7]. For instance, in France, the number of primary TKA reached 102 655 in 2019, (+62% increase compared to 2009), and is expected to increase to more than 150 000 TKA in 2050 [6]. Likewise, 480 958 primary TKAs were performed in the USA in 2019 (+45% compared to 2009) and recent literature predicts more than 1 800 000 TKAs in 2050 [7]. With a revision rate varying between 2% and 12% [8, 3, 9, 10], the number of revision TKA is also expected to grow until 2050 and so even more rapidly than primary TKA [11]. Two main factors can partially explain this growth: the ageing population and the expansion of TKA indication to younger and less severe symptoms patients [6]. While in 1997 patients younger than 65 years old represented 25% of TKA, they now represent 40% [12]. These patients have longer life expectancy, and so have higher risks to require a revision. Moreover, TKA for low grade OA represents higher costs than TKA for severe OA [13]. Therefore, TKA will inevitably represent a huge burden for the future health care system [11]. To answer this increasing demand and reduce the need for revision, surgeries have to be made faster while being more reliable, and implants durability have to be improved.
In the early years of TKA, the main challenge was to improve the implant stability. Consequently, the mechanical alignment (MA) technique was introduced to simplify and standardise the operations [14]. MA aims for a neutral mechanical axis to maximise the longevity of the TKA prosthesis by balancing load distribution between the medial and lateral compartments, and reducing polyethylene wear, excessive load on bone, and loosening [15]. Furthermore, the development of assistive technological tools, such as navigation, robotics and patient-specific instrumentation (PSI), have helped improve the accuracy of implantation and resection cuts to achieve accurate MA [14].
These developments participated to improve surgical outcomes as well as the satisfaction rate among TKA patients. Between 85% and 95% of them were satisfied with their surgery over the last decade, when the satisfaction rate varied between 75% and 89% in the 2000s [14, 16]. Between 5% and 15% of TKA patients are then still unsatisfied with their surgery outcomes, mainly because of their increased expectations regarding symptoms, physical function, quality of life, coping strategies, and longevity of implant [17]. Several causes can be identified as source of dissatisfaction: overhang of the femoral component causing pain (almost 27% of all clinically important pain [18]); abnormal biomechanics, related to the cruciate ligaments removal as well as to the lack of consideration of the patient anatomy, limiting the mobility and stability of the knee [19]; or implants early mechanical fail, due for most to positioning, alignment or fixation defects [20].
Consequently, TKA’s main focus is now shifting from enhancing implant survivorship toward improving patient function, kinematics and satisfaction. Currently, alternative alignment methods for TKA are gaining interest, to better respect the wide range of normal anatomy of the knee and restore individual anatomy with a personalised joint replacement. Different techniques have been described to obtain more anatomical and kinematic alignment than the conventional MA. For instance, recent studies considered pre-arthritic individual knee alignment and proposed different versions of kinematic alignment (KA) [21]. These different KA techniques all aim at resurfacing the femorotibial joint, to match the implant geometry with the bony anatomy in order to restore the native pre-arthritic limb alignment and adjust the ligament balance [15, 22].
With TKA patients being more active today than ever, performing TKA that mimic the natural knee is essential to the patients’ long-term satisfaction and survival [23]. To do so, kinematic alignment techniques can be used along with personalised implants. Implant customisation aims to correct the patient’s knee deformities while staying as close as possible to his anatomy [24]. Custom implants offer three features that are rarely attainable when using off-the-shelf (OTS) implants: (1) Optimisation of the implant-bone fit, to avoid overhang or under-coverage; (2) Decoupling of the patellofemoral and tibiofemoral compartment, to optimise patellofemoral and tibiofemoral kinematics independently; and (3) Restoration of native condylar curvature, to improve ligament balancing, mid-flexion stability and kinematics [25, 26]. Although there is still no consensus on the advantages of custom implants compared to OTS implants in terms of satisfaction and pain scores [27, 28, 29], custom TKA demonstrated significant benefits regarding over- and under- sizing, local tendon impingement, improved kinematics, lower complication rate, and facilitation of restoration of constitutional coronal alignment [27]. However, replicating the patient anatomy is not sufficient to ensure the implant stability and patient satisfaction, as the cruciate ligaments are removed during the surgery and can no longer stabilise the joint. Combining custom TKA with ‘personalised alignment’ is expected to improve patient-reported outcome measures compared to OTS TKA [30] and represents one of the current biggest challenges to perform personalised TKA [27].
Custom TKA implants have the potential to greatly improve knee kinematics and patient knee functions compared to OTS TKA implants. However, further investigation is needed to make the custom TKA implant readily accessible for patients [23]. Some commercialised solutions are already available to obtain custom implants, such as Origin® custom TKA (Symbios, Yverdon-les-Bains, Switzerland) or iTotalTMCR G2 (ConforMIS Inc., Bedford, MA, US). Both solutions provide a personalised implant along with patient-specific instrumentation (PSI) designed based on a computed tomography (CT) scan of the patient’s lower limb. The implants and PSI are delivered in a ready-to-use box, thus reducing the stock of implants and instrumentation needed in situ. However, the implant customisation is based on manual and semi-automated methods, making the design and manufacturing process last for up to 8 weeks [26, 31, 30]. Such processes need to be automated to allow a simple and fast establishment of the pre-operative planning for an easy integration in clinical routine and make personalised TKA available for patients needing surgery within less than two months.
Therefore, to the best of our best knowledge, we propose the first fully automated workflow to design patient-specific TKA implants from CT images.
2 Materials and methods
2.1 Global workflow
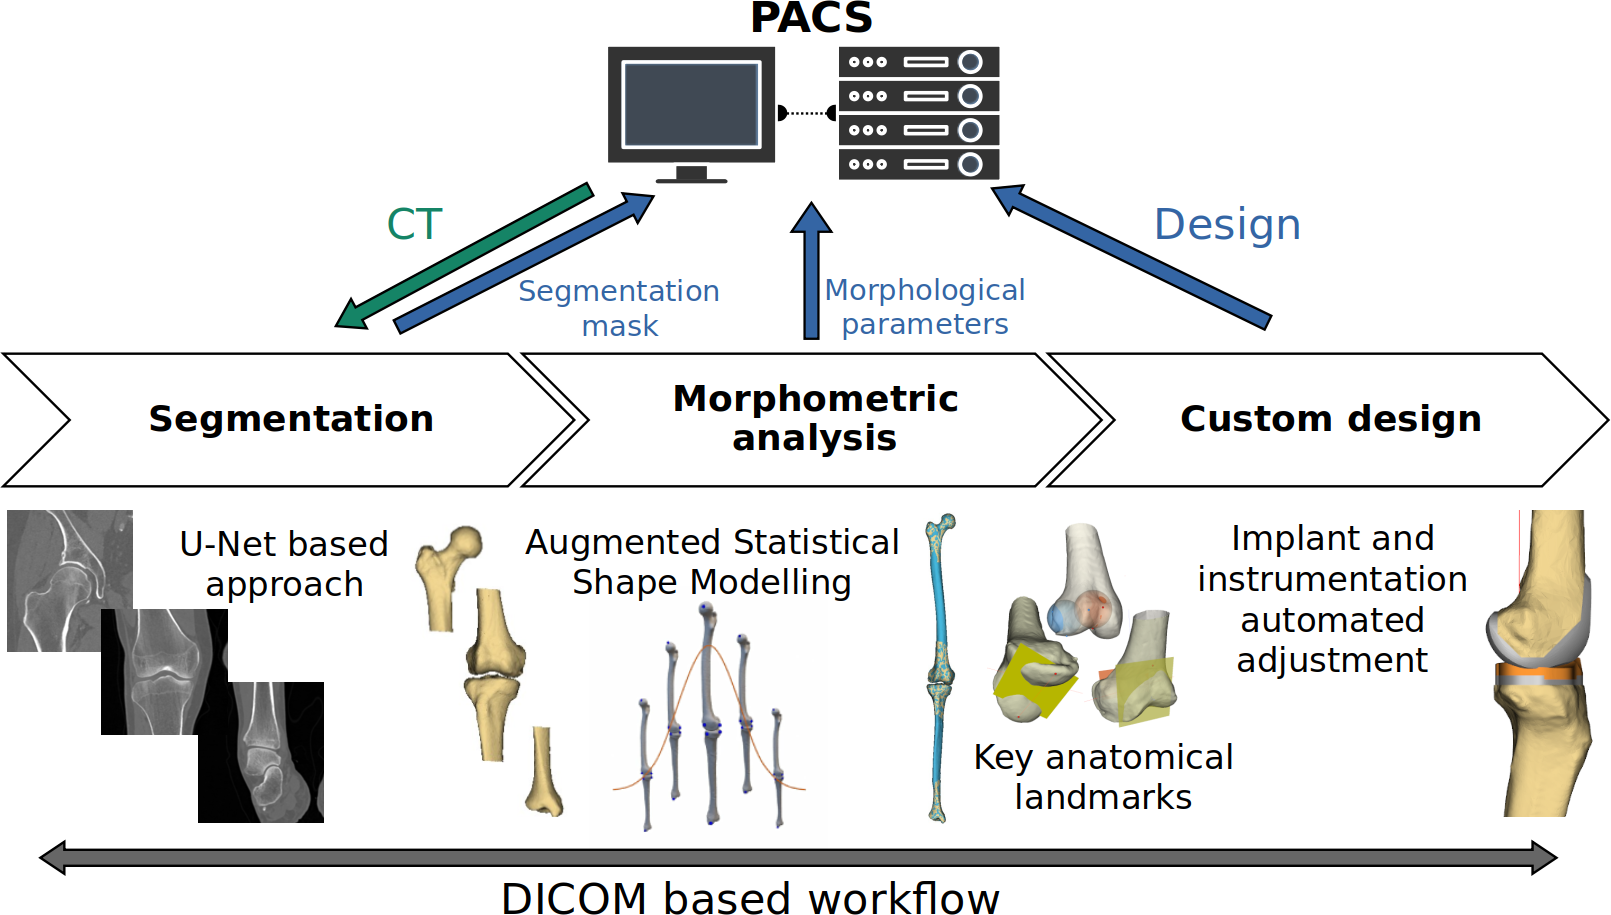
We developped a pre-operative planning software that can be connected to a PACS (Picture Archiving and Communication System) for direct access to the patients’ data. The different steps of the planning can be performed automatically within the software: segmentation of the hip, knee and ankle joints, determination of key anatomical landmarks and design of patient specific implants. The whole workflow is easily traceable as the result of each step is saved directly within the PACS under the patient ID and complies with DICOM format. An overview of the global workflow is proposed in Figure 1.
2.2 Dataset
Approval for this study was obtained from the Medical Ethics Committee of the University Hospital of Brest that coordinated the project under the Kneemod trial (N°29BRC18.0235), and is registered in Clinical Trial (NCT04179812). Participants gave informed written consent. 132 anonymised CT scans of lower limbs (right and/or left) from 75 patients were collected. These scans were acquired from 3 different machines (Toshiba® Aquilon One, Siemens® Somatom Edge Plus, Siemens® Somatom Definition Edge) at the Brest University Hospital during the years 2020-2021.
The volumes were manually segmented and then cropped to create three separate datasets for each joint: hip, knee and ankle. The data was split into training (91 scans from 50 patients) and test sets (41 scans from 25 patients).
2.3 CT image segmentation
A dedicated segmentation algorithm, integrating deep learning and image post processing principles, was developed to automatically extract the patient’s bones from CT images.
In order to achieve accurate and fast segmentation suitable for clinical usage in TKA planning, we developed three convolutional neural networks (CNNs) exclusively based on 2D data. Each model is dedicated to a specific joint (ankle, knee or hip), and takes a series of transverse cross-sections centred on the bone as input. All models were constructed following the principles of the 2D U-Net [32]. The global architecture, parameters and data formatting were similar to those described in [33].
After being predicted by our U-Net models, the segmentation masks were refined through a sequence of nonlinear operations related to their shape (morphological filtering). Additionally, a watershed algorithm [34] was applied to ensure bone separation in cases where delineation between the femur and tibia was ambiguous.
Finally, the 2D segmentation mask stacks were post-processed to construct 3D meshes of the bones, using the marching cubes and smoothing algorithms [35].
The accuracy of the automated segmentation was evaluated by comparison to reference segmentation (performed manually) using different metrics: the Dice Coefficient (DC) on the segmentation masks, the root mean square error (RMSE) and the Hausdorff Distance (HD) on the reconstructed 3D meshes. Also, the segmentation processing time was recorded.
2.4 Morphometric analysis
2.4.1 Augmented SSM building and fitting
The full shape of the patient’s femur and tibia were reconstructed by fitting statistical shape models (SSMs) to the automatically segmented distal and proximal extremities of the bones.
Two SSMs have been built, one for each bone. All left femurs and tibias were initially flipped around their longitudinal axis to obtain only right bones datasets. Both right femur and right tibia SSMs have been built following the workflow previously described in [36]. First, a virtual reference shape is computed to establish unbiased correspondence between the training data and then, a principal component analysis is performed on the training data in correspondence. The femur and tibia SSMs have been built from training dataset shapes. The SSMs were augmented by integrating information on anatomical landmarks to the model (see next section for more details).
To reconstruct the whole femur and tibia bones from their proximal and distal extremities, we developed a custom algorithm to fit the SSM to partial data. Firstly, the SSM mean shape is scaled by adjusting the SSM first principal component to match the partial data bounding box’s lengths. Secondly, the partial data (or bone extremities) is rigidly registered to the scaled SSM mean shape. Thirdly, the SSM is deformed by optimising the coefficients along its principal components using a L-BFGS optimization [37]. Finally, a very coarse B-Spline surface is applied on the deformed SSM, to fit the bone surface as much as possible without reproducing osteophytes.
2.4.2 Extraction of knee morphometric data
To further design the custom implant, several anatomical landmarks were automatically identified.
The anatomical landmarks of the deformed SSM (inherited from the landmarks identified on the SSM mean shape) were used as initialisation for the landmarks detection. The landmarks were then adjusted to the segmented mesh to improve the detection accuracy. This adjustment was weighted regarding the risk of having osteophytes in the concerned zone.
A total of 77 morphological parameters were determined (48 femoral and 29 tibial). 23 primary anatomical landmarks were directly detected with the fitted SSMs (16 femoral and 7 tibial landmarks), and 54 secondary parameters (anatomical landmarks, axes, planes, pointset, lengths or angles) were computed from these primary landmarks. An example of secondary parameters computation is given in Figure 2 for the distal resection plane.

2.4.3 Validation
The quality of both tibia and femur models were evaluated by computing three metrics: compactness (ability to represent the variability of the training dataset), generality (ability to fit the testing dataset) and specificity (ability to generate shapes similar to the training dataset), as described by Davies et al. [38].
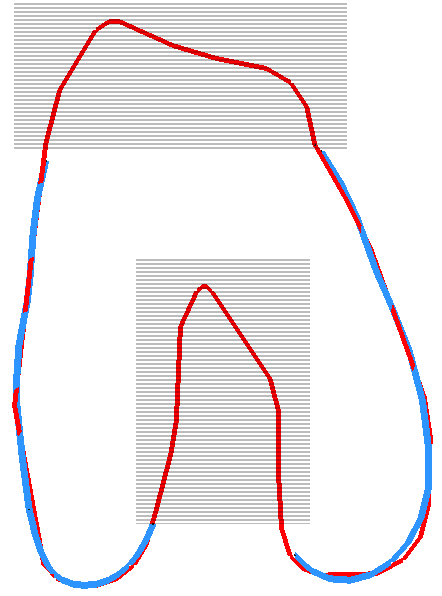
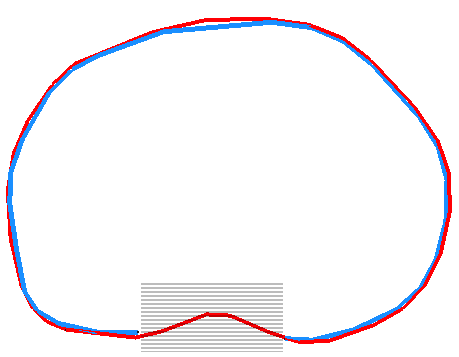
The full bone reconstruction accuracy has been tested by fitting the SSMs to the proximal and distal extremities of the 41 tibias and femurs of the testing dataset. The fitting duration has been registered and its accuracy has been evaluated by comparing the fitted models to the full bones manually segmented in terms of RMSE and HD.
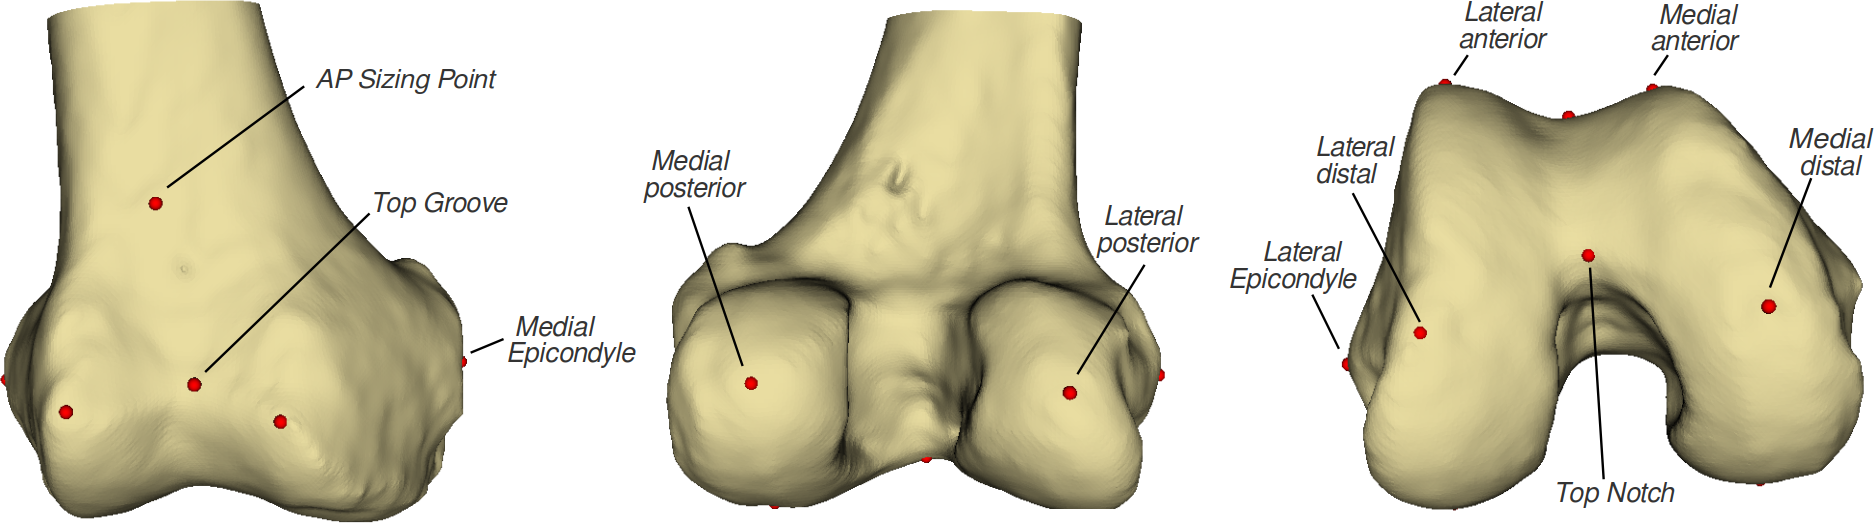
The landmarks computation was validated based on the analysis of 11 femoral landmarks detailed in Figure 3. The computed landmarks were compared to ground truth landmarks acquired from manual picking on the 41 shapes of the testing dataset. The 11 femoral landmarks were determined twice by one surgeon on 3 modalities : CT images, virtual 3D model, and 3D printed model. The impact of the modality used on the landmarks determination accuracy, as well as the intra observer precision have been studied in a previous publication [39]. It was found that the existing variability on the acquired landmarks did not impact the axis and planes derived from them, and that no modality was more reliable than another. Therefore, the ground truth for each landmark was defined as the barycenter of the corresponding landmarks picked manually on each modality. The computed landmarks accuracy was evaluated in terms of distance (in millimetres) to the ground truth landmarks.
2.5 Implant design
The entire design process is performed automatically using a sequence of custom operations in the open source software Open CASCADE Technology (Open Cascade, part of Capgemini, Issy-Les-Moulineaux, France). The implants are designed based on the patient’s anatomical landmarks previously determined and follow the medial pivot concept. Such design has been elected to restore the natural mobility of the knee when cruciate ligaments have been removed, with the knee rotating around the medial condyle and allowing antero-posterior translation of the lateral condyle [40].
2.5.1 Femoral implant
The design of the femoral implant starts with the posterior part and in first place the medial pivot sphere (Figure 4a). For each condyle, the radius of the medial-pivot sphere is computed from the antero-posterior size [41]. Both the medial and lateral post-condylar surfaces are initially shaped based on this sphere, after which they are refined to tightly align with the contours of the resected bone. The posterior most proximal part is then cut along another circle arc to obtain the roll back shape that will allow deep flexion. Secondly, the anterior surface is designed to closely adhere to the patient’s premorbid anatomy, aiming to facilitate patellar tracking. The specific characteristics of each patient’s lateral and medial facet height and sulcus angle are individually taken into consideration to prevent the risk of patellar instability [42, 43].
2.5.2 Tibial implant
The shape of the tibial baseplate is crafted to conform to the contours of the resected bone, ensuring optimal contact with cortical bone for enhanced implant stability and durability (Figure 4). The location of the keel is determined by taking into account the morphology of the diaphysis and the tibial plateau. The length of the stem, as well as the dimensions of the two vanes, are also functions of the patient’s specific characteristics.
a) 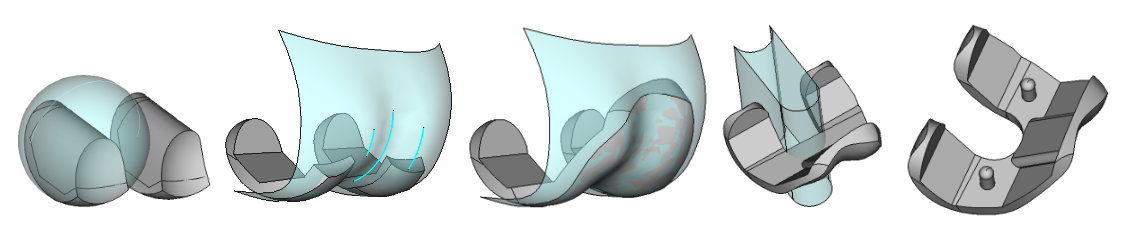
b) 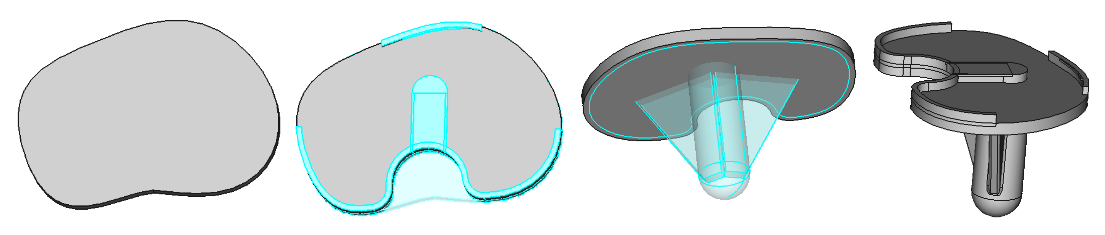
2.5.3 Tibial insert
The polyethylene tibial insert is designed regarding the femoral and tibial implants. The basic shape of the insert is built from the embase shape of the tibial component. The footprint of the medial pivot sphere is excavated into the basic shape. The lateral part is designed almost flat, to allow free antero-posterior translation of the femoral component as suggested by the medial-pivot concept. Finally the most anterior part is cut to avoid conflict with the patella in deep flexion.
2.5.4 Design evaluation
To evaluate the quality of the designed custom implants, we computed the accuracy of the bone-implant fitting by measuring over and under-hang, namely, the distance between the contours of the bone and the implant. Several zones were ignored: (1) the posterior part of the tibial implant, as the implant shape voluntarily does not follow the resection one; (2) the femoral intercondylar notch, as it is not relevant in the residual pain outcome of the surgery; and (3) the femoral anterior proximal part, as the implant does not try to reproduce anatomy in this zone and, in some cases, the outcrop of the anterior resection plane generated a two bumps profile (see Figure 5).
3 Results
3.1 Segmentation of partial CT image
One case has been excluded from the testing dataset because of too much flexion in the lower limb leading to segmentation failure. The following results are reported for the remaining 40 cases.
The ankle, knee and hip CT image were automatically segmented with a mean DC of , mean RMSE of and mean HD of . The segmentation accuracy for each bone is detailed in Table 1. The computation time to fully segment all three joints of a patient’s leg was seconds. on CPU (Intel® Coretm i7-7820HQ, 2.90GHz), depending on volume depth.
| Bone | Extremity | DC | RMSE | HD |
|---|---|---|---|---|
| Femur | Hip | |||
| Femur | Knee | |||
| Tibia | Knee | |||
| Tibia | Ankle |
3.2 Morphometric analysis
3.2.1 SSM quality
The evaluation metrics of the femur and tibia SSMs are detailed in Table 2, with respect to the number of principal components (modes) kept by the model.
The developed SSMs were able to reconstruct the full femur and tibia shapes with an RMSE of and HD of . The tibial SSM fitted the tibia proximal and distal extremities with an RMSE and HD of . The femoral SSM fitted the femur proximal and distal extremities with an RMSE of and HD of . The reconstruction of the femur and tibia lasted seconds.
| Bone | Number of modes | Compactness | Generality | Specificity |
|---|---|---|---|---|
| Tibia | 1 | 88.7% | ||
| Tibia | 3 | 95.9% | ||
| Tibia | 11 | 99.0% | ||
| Femur | 1 | 84.4% | ||
| Femur | 5 | 95.8% | ||
| Femur | 15 | 99.1% |
3.2.2 Anatomical landmarks determination
The 11 femoral anatomical landmarks have been determined with an accuracy of . The accuracy per landmark is detailed in Table 3.
| Landmark label | mean std | [min - max] |
|---|---|---|
| AP Sizing Point | ||
| Lateral Anterior | ||
| Lateral Distal | ||
| Lateral Epicondyle | ||
| Lateral Posterior | ||
| Medial Anterior | ||
| Medial Distal | ||
| Medial Epicondyle | ||
| Medial Posterior | ||
| Top Groove | ||
| Top Notch |
3.3 Implant design
Of the 40 testing cases, the custom implant design succeeded in 34 cases (85%) and failed in 6 cases (2 femoral and 1 tibial implants could not be generated, 3 femoral implants and 1 PE insert were invalid). The computation of the custom design for both femoral and tibial implants lasted seconds. The implants fitted the bones with an RMSE of (over and under hang). More details on the implant-to-bone fit can be found in Table 4.
| Bone | RMSE | HD |
|---|---|---|
| Femur | ||
| Tibia |
4 Discussion
The proposed method automatically designs patient-specific TKA implants in about 5 minutes, mimicking the joint anatomy and respecting the limb kinematics, to ensure the proper motion and stability of the knee.
Segmentation accuracy.
The mean segmentation accuracy was . We observed high HD on the ankle often resulting from inaccurate detection of the medial malleolus extremity. However, the absence of this portion of the tibial bone does not significantly affect the subsequent planning process. Indeed, the ankle’s primary role is to help determine the mechanical axis of the tibia, which runs from the center of the tibia’s knee to the distal tibial plafond articular surface. This axis orientation remains relatively consistent even if the statistical shape model fits a slightly shorter length for the ankle portion.
Likewise, we observed high HD for segmentation accuracy in the hip region when the great trochanter’s extremity was inaccurately detected. However, these inaccuracies does not significantly impact the positioning of the mechanical axis of the femur after fitting the SSM. (The femoral mechanical axis runs from the center of the femoral head to the knee center located on the distal portion of the femur.)
The segmentation accuracy of our method is in line with similar studies in the literature. For instance, other U-Net-derived methods, for knee segmentation on magnetic resonance images (MRI) or on CT images, reach a mean DC around 98% [44, 45, 46] with either bigger or smaller training and testing dataset.
Lately, a lot of research has been conducted to develop the best architecture of deep-learning models to obtain segmentations as accurate as possible [47]. Most of these algorithms yield excellent results, with small differences in Dice scores. However, for the major part, these models have been trained and tested on selected images, from non-pathological patients, with reasonably good image resolution and without interfering elements such as metal implants. Those selected images ensure an improved segmentation of the patient anatomy, although they are not representative of the clinical reality. Indeed, patients undergoing TKA usually suffer from high grade knee osteoarthritis, making the joint segmentation harder because of the highly damaged cartilage and presence of osteophytes. Current challenges for automated segmentation now include performing accurate segmentations whatever the patient’s morbidity, the presence of foreign bodies and image resolution.
Morphometric analysis.
The proposed method automatically determines anatomical landmarks with a mean accuracy of . Such errors are similar to the intra and inter operator variability existing when manually picking the landmarks [39], indicating that the proposed workflow is as accurate as manual acquisitions. The highest errors were obtained for the lateral distal point. This landmark was found to be the hardest to identify as it is situated in a flat area. In the proposed workflow, the lateral distal point is used to determine the distal resection plane only. However, the flat area around the lateral distal point is parallel to the distal resection plane. Therefore, errors in this point detection have negligible impact on the plane orientation and the resulting implant design.
The obtained results are in line with previous studies using similar or different approaches. Fischer et al. [48] proposed to automatically determine femoral landmarks, axes, planes and bone coordinate systems by morphing a femur template to a subject’s femur. They evaluated their method on 22 femoral landmarks based on manual acquisitions performed 4 times by 5 experts. They obtained excellent intra and inter observer reliability (min ICC=0.933), with manual median errors ranging from to depending on the considered landmark. Their automated method determined femoral landmarks with median errors ranging from to . In the same way, Kuiper et al. [49] fitted a mean bone model to 20 non pathological subjects to determine 32 femoral and tibial landmarks. They reached a mean accuracy of similar to their intra observer error (). Similarly, Chen et al. [50] fitted a SSM to 141 non pathological male femora to determine the position of 6 anatomical landmarks. Their automatic method had an average error of similar to their intra and inter observer errors ( and respectively). They obtained better accuracy than our method, however they tested their method on their training dataset, which eases the fitting of the SSM and thus the landmarks’ determination. Deep-learning approaches have also been used to automatically determine bony landmarks. Yang et al. proposed a convolutional neural network to determine 7 landmarks of the distal femur and obtained mean errors around [51]. More recently, Wang et al. developed a network based on PointNet++ and obtained errors below , except in severe knee joint wear patients where the feature points become challenging to extract [52].
Whatever the method used to detect the bony landmarks, the method’s validation and the definition of ground truth landmarks can raise certain concerns. Indeed, automatic methods are compared to manual measurements for validation. However, there exists intra and inter operator variability in determining anatomical landmarks, and with such variability, the ground truth landmarks can only be approximated. In the literature as in our study, reference landmarks are commonly defined as the median or mean of manual acquisitions to approximate the ground truths. As no information is available on the actual ground truth, the choice of these reference points can impact the method’s validation results. Nevertheless, as the errors introduced by the intra and inter operator variabilities are similar to random noise, averaging the manual acquisitions reduces the fluctuations around the ground truth landmarks, allowing a more accurate approximation.
Implants custom design.
Compared to off-the-shelf implants, personalised TKA implants improve the components fit, the kinematic function and consequently patient satisfaction, reduce medical complications and thus lower the procedure associated costs [24, 53].
We chose to design our implant following the medial pivot concept which models the femoral condyles with two spheres, thus approximating the sagittal curvature with only one radius for each condyle. The implants design plays an essential role in joint kinematics, and consequently in restoring stable and natural knee movements. For instance, the femoral condyles curvature is a key factor as it impacts the tibiofemoral internal-external rotation and anterior-posterior translation [54]. In this regard the J-curve design has been introduced to efficiently reproduce the femoral condyles sagittal curvature, with different radii of curvature. While the J-curve approach is by essence more anatomical than the medial pivot one, the latter has shown a greater ability to reproduce the natural knee biomechanics [55]. Even though the medial pivot design is still rarely used in practice [56] it is gaining more and more interest, with an increasing number of research articles being published. Recent reviews show that medial pivot TKA is a reliable long-term treatment option for individuals with end-stage osteoarthritis, offering exceptional survivorship, low complication rates, and notable enhancements in clinical and functional outcomes [57, 58].
Designing personalised implants based on the patient’s anatomy also raises multiple questions on the anatomy to be restored. When the objective is to recreate the patient’s healthy joint, the implants can be designed based on the pre-morbid anatomy. However, still today, it is difficult to know where to place the threshold between pre-morbid and pathological anatomy and to what extent deformities should be reproduced or corrected remains unclear. For instance, most of the commercialised implants currently available recreate healthy femoral condyles but have flattened trochlea with high sulcus angle which characterises trochlear dysplasia [59]. Moreover, there is no clear consensus on the advantage of reproducing the pre-morbid knee alignment using the kinematic alignment and its different versions (inverse, restricted, modified) in terms of clinical scores [22, 15]. Now that the current technologies make it easier to design patient-specific implants, prospective clinical studies are needed to assess the short and long term outcomes of personalised TKA. Such research could help in determining the best prosthetic joint anatomy to offer a stable and functional knee, and to what extent should the deformity be corrected.
Global workflow.
To our knowledge, only one article in the literature also proposed an automatic workflow to generate personalised implants for TKA from CT images [60]. In their paper, Burge et al. proposed a similar pipeline to ours, using machine learning to segment both the femur and the tibia, and statistical shape modelling to reconstruct the bones 3D models. They obtained custom implants models in less than 10 minutes, by restraining the SSM fitting to very smooth deformations and without determining any anatomical landmark. However, the custom implants they proposed may not be viable in the clinics. Indeed, their implants are directly carved out of the bones 3D models, the implant outer layer corresponding to the surface of the trimmed bone. Such implants replicate the anatomy of the bones – whatever the deformities present – but do not consider any kinematics aspect of the joint, such as the lower limb alignment, the knee flexion axis or the condyles congruence. The personalised implants we propose, are designed regarding more than 70 parameters describing the lower limb anatomy and kinematics, and hence, are better suited for a clinical usage.
Limitations.
It is important to note that the dataset used in our study contains limited instances of severe osteoarthritis, which may not be representative of the patients undergoing total knee arthroplasty. Therefore, the training dataset should be increased to include CT images of such patients to better establish the workflow applicability in the context of surgical planning.
A total of 77 morphological parameters are automatically determined on the patient’s femur and tibia. The accuracy of this morphological analysis was conducted on 11 femoral landmarks only. Although the accuracy of the primary parameters is only necessary (secondary parameters are derived from the primary ones), further work is needed to validate the accuracy of the tibial landmarks too. Nevertheless, as the same methods are used to identify femoral and tibial landmarks, the accuracy for both should be similar.
The proposed workflow does not include the production of the custom designed implants. Such step could be performed in a time-effective manner using 3D printing techniques [61]. However, whatever the techniques used, manufacturing the implants usually involves a third-party supplier, which may add delays between the pre-operative planning and the surgery. Nevertheless, the manual design step is the most time-consuming step that could be addressed with the proposed workflow.
Such personalised prostheses require a higher accuracy than off-the-shelf prostheses when positioning the implants. Indeed, the implants are designed together with the pre-operative planning, ensuring the perfect fit of the implants to the operated bones. During preliminary experiments on cadavers, we observed that inaccuracies on the cutting planes’ angles would affect the quality of implant-to-bone fitting. Patient-specific cutting guides as well as computer assisted solutions (robotic arm or navigated instruments) could help improve the surgical accuracy and ensure the right positioning of the personalised implants.
Eventually, a mechanical evaluation is missing to ensure the stability and survivorship of the personalised implants and to validate the design of the polyethylene tibial insert. Work is currently ongoing to evaluate the implants resistance to fatigue and meet the regulatory standards for future commercialisation.
Perspectives.
Experiments on cadavers have been performed as a first step to evaluate the complete workflow from designing the implants to performing the implantation. Future clinical studies are planned to assess the clinical benefit of the patient-specific implants designed automatically.
The workflow can be easily adapted to other joint arthroplasties, after identifying the relevant anatomical landmarks to determine the mechanical and anatomical axes of the concerned joint.
5 Conclusion
We propose a complete and automated workflow to design custom TKA implants in a time effective manner. A dedicated U-net algorithm and SSMs were developed to automatically segment the patient’s hip, knee and ankle and reconstruct the femur and tibia anatomy. A custom pipeline was implemented to determine more than 70 anatomical parameters and further design the patient-specific implants. Such an approach is a key factor to increase the accessibility to personalised TKA, and more generally to personalised orthopaedic surgery to improve the surgical outcomes for all patients.
6 Funding
This work benefited funding from the French government via the national research agency as part of the Investments for the Future Programs, under the reference ANR-17-RHUS-0005 (FollowKnee Project). No commercial funding was received for this study.
7 Acknowledgements
The authors thank the PLaTIMed platform (https://platimed.fr/) for accessing to the anatomical lab and helping in organising experiments.
References
- [1] World Health Organisation. Osteoarthritis, 7 2023.
- [2] Pascal-André Vendittoli, Charles Riviere, Michael T Hirschmann, and Stefano Bini. Why personalized surgery is the future of hip and knee arthroplasty: a statement from the personalized arthroplasty society. EFORT Open Reviews, 8:874–882, 2023.
- [3] Hisako Katano, Nobutake Ozeki, Yuji Kohno, Yusuke Nakagawa, Hideyuki Koga, Toshifumi Watanabe, Tetsuya Jinno, and Ichiro Sekiya. Trends in arthroplasty in japan by a complete survey, 2014–2017. Journal of Orthopaedic Science, 26:812–822, 9 2021.
- [4] New Zealand Orthopaedic Association. The new zealand joint registry twenty two year report (january 1999-december 2020), 2021.
- [5] Christian Benignus, Peter Buschner, Malin Kristin Meier, Frauke Wilken, Johannes Rieger, and Johannes Beckmann. Patient specific instruments and patient individual implants—a narrative review. Journal of Personalized Medicine 2023, Vol. 13, Page 426, 13:426, 2023.
- [6] Mathieu Le Stum, Thomas Gicquel, Guillaume Dardenne, Myriam Le Goff-Pronost, Eric Stindel, and Arnaud Clavé. Total knee arthroplasty in france: Male-driven rise in procedures in 2009–2019 and projections for 2050. Orthopaedics and Traumatology: Surgery and Research, 2022.
- [7] Ittai Shichman, Mackenzie Roof, Neil Askew, Leo Nherera, Joshua C Rozell, Thorsten M Seyler, and Ran Schwarzkopf. Projections and epidemiology of primary hip and knee arthroplasty in medicare patients to 2040-2060. JBJS Open Access, 8:e22.00112, 2023.
- [8] Roger Erivan, Anna Tardieu, Guillaume Villatte, Matthieu Ollivier, Christophe Jacquet, Stéphane Descamps, and Stéphane Boisgard. Knee surgery trends and projections in france from 2008 to 2070. Orthopaedics and Traumatology: Surgery and Research, 106:893–902, 9 2020.
- [9] The Swedish Arthroplasty Register. Annual Report 2021. Ola Rolfson, 2021.
- [10] American Academy of Orthopaedic Surgeons. American joint replacement registry: the 9th annual report on hip and knee arthroplasty, 2022.
- [11] Alexander Klug, Yves Gramlich, Maximilian Rudert, Philipp Drees, Reinhard Hoffmann, Manuel Weißenberger, and Karl Philipp Kutzner. The projected volume of primary and revision total knee arthroplasty will place an immense burden on future health care systems over the next 30 years. Knee Surgery, Sports Traumatology, Arthroscopy, 29:3287–3298, 10 2021.
- [12] C Pabinger, H Lothaller, and A Geissler. Utilization rates of knee-arthroplasty in oecd countries. Osteoarthritis and Cartilage, 23:1664–1673, 2015.
- [13] Elena Losina, A. David Paltiel, Alexander M. Weinstein, Edward Yelin, David J. Hunter, Stephanie P. Chen, Kristina Klara, Lisa G. Suter, Daniel H. Solomon, Sara A. Burbine, Rochelle P. Walensky, and Jeffrey N. Katz. Lifetime medical costs of knee osteoarthritis management in the united states: Impact of extending indications for total knee arthroplasty. Arthritis Care and Research, 67:203–215, 2015.
- [14] Charles Rivière and Pascal andré Vendittoli, editors. Personalized Hip and Knee Joint Replacement. Springer, Cham, 2020.
- [15] Yukihide Minoda. Alignment techniques in total knee arthroplasty. Journal of Joint Surgery and Research, 1:108–116, 12 2023.
- [16] Michael J. DeFrance and Giles R. Scuderi. Are 20arthroplasty? a systematic review of the literature. Journal of Arthroplasty, 38:594–599, 3 2023.
- [17] Cornelia Lützner, Franziska Beyer, Ludwig David, and Jörg Lützner. Fulfilment of patients’ mandatory expectations are crucial for satisfaction: a study amongst 352 patients after total knee arthroplasty (tka). Knee Surgery, Sports Traumatology, Arthroscopy, pages 1–10, 2 2023.
- [18] Ormonde M. Mahoney and Tracy Kinsey. Overhang of the femoral component in total knee arthroplasty: Risk factors and clinical consequences. Journal of Bone and Joint Surgery, 92:1115–1121, 5 2010.
- [19] Robert Schmidt, Richard D Komistek, ; J David Blaha, Brad L Penenberg, and William J Maloney. Fluoroscopic analyses of cruciate-retaining and medial pivot knee implants. CLINICAL ORTHOPAEDICS AND RELATED RESEARCH Number, 410:21, 2003.
- [20] Peter F. Sharkey, Paul M. Lichstein, Chao Shen, Anthony T. Tokarski, and Javad Parvizi. Why are total knee arthroplasties failing today—has anything changed after 10 years? The Journal of Arthroplasty, 29:1774–1778, 9 2014.
- [21] Sohail Nisar, Jeya Palan, Charles Rivière, Mark Emerton, and Hemant Pandit. Kinematic alignment in total knee arthroplasty. EFORT Open Reviews, 5:380–390, 7 2020.
- [22] Sébastien Lustig, Elliot Sappey-Marinier, Camdon Fary, Elvire Servien, Sébastien Parratte, and Cécile Batailler. Personalized alignment in total knee arthroplasty: Current concepts. SICOT-J, 7, 2021.
- [23] Xinyu Li, Changjiang Wang, Yuan Guo, and Weiyi Chen. An approach to developing customized total knee replacement implants. Journal of Healthcare Engineering, 2017, 2017.
- [24] Jin Ah Lee, Yong Gon Koh, and Kyoung Tak Kang. Biomechanical and clinical effect of patient-specific or customized knee implants: A review. Journal of Clinical Medicine, 9:1559, 5 2020.
- [25] Mo Saffarini, Michael T. Hirschmann, and Michel Bonnin. Personalisation and customisation in total knee arthroplasty: the paradox of custom knee implants, 4 2023.
- [26] Elliot Sappey-Marinier, Carsten Tibesku, Tarik Ait Si Selmi, and Michel Bonnin. Custom total knee arthroplasty, pages 255–264. Springer, Cham, 2020.
- [27] Jan Victor and Hannes Vermue. Custom tka: what to expect and where do we stand today?, 12 2021.
- [28] Séverin Wendelspiess, Raphael Kaelin, Nicole Vogel, Thomas Rychen, and Markus P. Arnold. No difference in patient-reported satisfaction after 12 months between customised individually made and off-the-shelf total knee arthroplasty. Knee Surgery, Sports Traumatology, Arthroscopy, 30:2948–2957, 9 2022.
- [29] Eran Beit Ner, Saad Dosani, Leela C Biant, and Gwenllian Fflur Tawy. Custom implants in tka provide no substantial benefit in terms of outcome scores, reoperation risk, or mean alignment: A systematic review. Clinical Orthopaedics and Related Research, 479:1237–1249, 2021.
- [30] Lampros Gousopoulos, Andreas Dobbelaere, Salvatore Ratano, Louka Bondoux, Jacobus H. Müller, Sonia Dubreuil, Mo Saffarini, Carsten O Tibesku, Tarik Aït-Si-Selmi, and Michel P Bonnin. Custom total knee arthroplasty combined with personalised alignment grants 94 Knee Surgery, Sports Traumatology, Arthroscopy, 31:1276–1283, 2023.
- [31] Michel P. Bonnin, Lucas Beckers, Augustin Leon, Jules Chauveau, Jacobus H. Müller, Carsten O. Tibesku, and Tarik Aït-Si-Selmi. Custom total knee arthroplasty facilitates restoration of constitutional coronal alignment. Knee Surgery, Sports Traumatology, Arthroscopy, 30:464–475, 2 2022.
- [32] Olaf Ronneberger, Philipp Fischer, and Thomas Brox. U-net: Convolutional networks for biomedical image segmentation. Lecture Notes in Computer Science (including subseries Lecture Notes in Artificial Intelligence and Lecture Notes in Bioinformatics), 9351:234–241, 2015.
- [33] Ludivine Maintier, Arnaud Clavé, Ehouarn Maguet, Eric Stindel, Valérie Burdin, and Guillaume Dardenne. nnu-net for the automatic knee segmentation from ct images : A comparative study with a conventional u-net model. In Ferdinando Rodriguez Y Baena and Fabio Tatti, editors, EPiC Series in Health Sciences. EasyChair, 2023.
- [34] Serge Beucher and Fernand Meyer. The morphological approach to segmentation: the watershed transformation, pages 433–481. CRC Press, 2018.
- [35] William E. Lorensen and Harvey E. Cline. Marching cubes: A high resolution 3d surface construction algorithm. Seminal graphics: pioneering efforts that shaped the field, pages 347–353, 7 1998.
- [36] Aziliz Guezou‐Philippe, Guillaume Dardenne, Hoel Letissier, Agathe Yvinou, and Valérie Burdin. Anterior pelvic plane estimation for total hip arthroplasty using a joint ultrasound and statistical shape model based approach. Medical & Biological Engineering & Computing, 61:195–204, 2022.
- [37] Dong C Liu and Jorge Nocedal. On the limited memory bfgs method for large scale optimization. Mathematical Programming, 45:503–528, 1989.
- [38] Rhodri Davies, Carole Twining, and Chris Taylor. Statistical Models of Shape: Optimisation and Evaluation. Springer Science & Business Media, 2008. Several methods to analyze the SSM quality.
- [39] Arnaud Clavé, Guillaume Dardenne, Ludivine Maintier, Eric Stindel, and Valérie Burdin. Intra-observer variations of femoral bony landmarks using three different methods for the design of custom knee implant. In Ferdinando Rodriguez Y Baena and Fabio Tatti, editors, EPiC Series in Health Sciences. Easychair, 2023.
- [40] Luigi Sabatini, Salvatore Risitano, Gennaro Parisi, Ferdinando Tosto, Pier Francesco Indelli, Francesco Atzori, and Alessandro Massè. Medial pivot in total knee arthroplasty: Literature review and our first experience, 1 2018.
- [41] M. R. Mahfouz, B. C. Merkl, E. E. Abdel Fatah, R. Booth, and J. N. Argenson. Automatic methods for characterization of sexual dimorphism of adult femora: Distal femur. Computer Methods in Biomechanics and Biomedical Engineering, 10:447–456, 2007.
- [42] H Dejour, G Walch, L Nove-Josserand, and Ch Guier. Knee surgery sports traumatology i arthroscopy patellar problems factors of patellar instability: an anatomic radiographic study. Knee Surg, Sports Traumatol, 2:19–26, 1994.
- [43] Jiebo Chen, Zipeng Ye, · Chenliang Wu, Xueying Zhang, Jinzhong Zhao, Guoming Xie, and Chenliang Wu. Sulcus depth, congruence angle, wiberg index, tt-tg distance, and cdi are strong predictors of recurrent patellar dislocation. Knee Surgery, Sports Traumatology, Arthroscopy, 31:2906–2916, 2023.
- [44] Ridhma, Manvjeet Kaur, Sanjeev Sofat, and Devendra K. Chouhan. Review of automated segmentation approaches for knee images, 2 2021.
- [45] Matteo Rossi, Luca Marsilio, Luca Mainardi, Alfonso Manzotti, and Pietro Cerveri. Cel-unet: Distance weighted maps and multi-scale pyramidal edge extraction for accurate osteoarthritic bone segmentation in ct scans. Frontiers in Signal Processing, 2:857313, 4 2022.
- [46] Ruurd J.A. Kuiper, Ralph J.B. Sakkers, Marijn van Stralen, Vahid Arbabi, Max A. Viergever, Harrie Weinans, and Peter R. Seevinck. Efficient cascaded v-net optimization for lower extremity ct segmentation validated using bone morphology assessment. Journal of Orthopaedic Research®, 40:2894–2907, 12 2022.
- [47] Risheng Wang, Tao Lei, Ruixia Cui, Bingtao Zhang, Hongying Meng, and Asoke K. Nandi. Medical image segmentation using deep learning: A survey. IET Image Processing, 16:1243–1267, 4 2022.
- [48] Maximilian C M Fischer, Sonja A G A Grothues, Juliana Habor, Matías De La Fuente, and Klaus Radermacher. A robust method for automatic identification of femoral landmarks, axes, planes and bone coordinate systems using surface models. Scientific Reports, 10, 2020.
- [49] Ruurd J.A. Kuiper, Peter R. Seevinck, Max A. Viergever, Harrie Weinans, and Ralph J.B. Sakkers. Automatic assessment of lower-limb alignment from computed tomography. Journal of Bone and Joint Surgery, 105:700–712, 5 2023.
- [50] Zhen Chen, Yagang Wang, Xinghua Li, Kunzheng Wang, Zhe Li, and Pei Yang. An automatic measurement system of distal femur morphological parameters using 3d slicer software. Bone, 156:116300, 3 2022.
- [51] Dong Yang, Shaoting Zhang, Zhennan Yan, Chaowei Tan, Kang Li, and Dimitris Metaxas. Automated anatomical landmark detection ondistal femur surface using convolutional neural network. Proceedings - International Symposium on Biomedical Imaging, 2015-July:17–21, 7 2015.
- [52] Weiya Wang, Haifeng Zhou, Yuxin Yan, Xiao Cheng, Peng Yang, Liangzhi Gan, and Shaolong Kuang. An automatic extraction method on medical feature points based on pointnet++ for robot-assisted knee arthroplasty. International Journal of Medical Robotics and Computer Assisted Surgery, 19:e2464, 2023.
- [53] Johannes Beckmann, Malin Kristin Meier, Christian Benignus, Andreas Hecker, and Emmanuel Thienpont. Contemporary knee arthroplasty: one fits all or time for diversity? Archives of Orthopaedic and Trauma Surgery, 141:2185–2194, 12 2021.
- [54] Malte Asseln, Sonja A.G.A. Grothues, and Klaus Radermacher. Relationship between the form and function of implant design in total knee replacement. Journal of Biomechanics, 119:110296, 2021.
- [55] R. Y.Nigel Kour, Shanyuanye Guan, Michelle M. Dowsey, Peter F. Choong, and Marcus G. Pandy. Kinematic function of knee implant designs across a range of daily activities. Journal of Orthopaedic Research®, 41:1217–1227, 6 2023.
- [56] Ulrike Wittig, Maximilian Moshammer, Ines Vielgut, Georg Hauer, Patrick Reinbacher, Andreas Leithner, and Patrick Sadoghi. Higher use of fixed-bearing over mobile-bearing and posterior-stabilized over medial pivot designs in total knee arthroplasty (tka): a systematic comparative analysis using worldwide arthroplasty registers from england and wales, australia, norway, new zealand, germany and switzerland. Archives of Orthopaedic and Trauma Surgery, 143:1021–1029, 2 2023.
- [57] Mattia Alessio-Mazzola, Antonio Clemente, Antonio Russo, Peter Mertens, Giorgio Burastero, Matteo Formica, and Lamberto Felli. Clinical radiographic outcomes and survivorship of medial pivot design total knee arthroplasty: a systematic review of the literature, 11 2022.
- [58] Giorgio Cacciola, Fortunato Giustra, Francesco Bosco, Luigi Sabatini, Salvatore Risitano, Federico De Meo, Lorenzo Braconi, Pietro Cavaliere, Alessandro Massè, and Giuseppe Solarino. Long-term follow-up of medial pivot total knee arthroplasty: A systematic review of the current evidence. Prosthesis, 5:622–634, 9 2023.
- [59] David Dejour, Panagiotis G. Ntagiopoulos, and Mohammed Saffarini. Evidence of trochlear dysplasia in femoral component designs. Knee Surgery, Sports Traumatology, Arthroscopy, 22:2599–2607, 10 2014.
- [60] Thomas A. Burge, Jonathan R.T. Jeffers, and Connor W. Myant. Applying machine learning methods to enable automatic customisation of knee replacement implants from ct data. Scientific Reports, 13:1–9, 2 2023.
- [61] Meng Meng, Jinzuo Wang, Huagui Huang, Xin Liu, Jing Zhang, and Zhonghai Li. 3d printing metal implants in orthopedic surgery: Methods, applications and future prospects. Journal of Orthopaedic Translation, 42:94–112, 9 2023.