The Power of Linear Programming in Sponsored Listings Ranking: Evidence from Field Experiments
Abstract
Sponsored listing is one of the major revenue sources for many prominent online marketplaces, such as Amazon, Walmart, and Alibaba. When consumers visit a marketplace’s webpage for a specific item, in addition to that item, the marketplace might also display a ranked listing of sponsored items from various third-party sellers. These sellers are charged an advertisement fee if a user purchases any of the sponsored items from this listing. Determining how to rank these sponsored items for each incoming visit is a crucial challenge for online marketplaces, a problem known as sponsored listings ranking (SLR). The major difficulty of SLR lies in balancing the trade-off between maximizing the overall revenue and recommending high-quality and relevant ranked listings. While a more relevant ranking may result in more purchases and consumer engagement, the marketplace also needs to take account of the potential revenue when making ranking decisions. Due to the latency requirement and historical reasons, many online marketplaces use score-based ranking algorithms for SLR optimization. Alternatively, recent research also discusses obtaining the ranking by solving linear programming (LP). In this paper, we collaborate with a leading online global marketplace and conduct a series of field experiments to compare the performance of the score-based ranking algorithms and the LP-based algorithms. The field experiment lasted for days, which included million visits in total. We observed that the LP-based approach improved all major metrics by of revenue, of purchase, and of the gross merchandise value (GMV), compared to an extremely-tuned score-based algorithm that was previously used in production by the marketplace. Our heterogeneous treatment effects analysis revealed that the improved performance stemmed from the LP-based algorithm’s ability to deliver more relevant items to consumers. To enable the practice of the LP-based approaches, we developed an efficient dual-based algorithm for obtaining the ranking within the strict latency requirement. Furthermore, we investigated the flexibility of the LP-based approach to model long-term goals for the marketplace by overall planning. The proposed LP-based model has been launched on Marketplace A’s platform since the beginning of 2023, significantly improving the performance of sponsored listing in multiple dimensions.
1 Introduction
Sponsored listing is also called “sponsored products” or simply “Ads”, which is a mechanism where third-party sellers allocate additional commission fees to online marketplaces, thereby securing a higher likelihood of their items or advertisements being prominently displayed to consumers. For many online marketplaces, such as Amazon, Walmart, and Alibaba, sponsored listing is one of the major revenue sources. For example, Amazon and Google reported billion and billion of sponsored revenue in 2022 respectively 111https://ir.aboutamazon.com/annual-reports-proxies-and-shareholder-letters/default.aspx, https://abc.xyz/investor/ue.
While the proliferation of sponsored listings can bolster marketplace revenues, the alignment of these prominently displayed items with consumer interests is not guaranteed. In general, displaying more sponsored listings to consumers would simulate revenue for the marketplace, but these exhibited items are not necessarily what consumers are essentially interested in. Thus, for these marketplaces, the critical problem is deciding which items to display and how to rank the sponsored listings to attentively engage in the trade-off between the overall revenue and delivering high-quality, relevant listings for consumers in the meantime. Such a listing ranking problem is called a sponsored listings ranking (SLR) problem, which is heavily studied within the field of recommendation systems.
The design of sponsored listings ranking algorithms in practice involves the following major considerations:
-
•
Algorithm efficiency: The algorithms must be adequately efficient to meet the real-time display request latency requirement, namely, producing the ranking within at most second.
-
•
Interpretability and tractability: The ideal algorithm should offer clear and rational objectives and constraints, ensuring that the underlying decision-making process is both interpretable and traceable.
-
•
Flexibility: The proposed framework should be adaptable, allowing for adjustments in objectives and requirements to accommodate customized SLR challenges in diverse scenarios.
A prevalent industry solution to the SLR problem follows the “predict-then-optimize” paradigm, which comprises the following two steps. First, the “predict” phase involves estimating the conversion rate, which denotes the proportion of consumers completing a desired action, such as a “click” or “purchase.” These actions correspond to the business models of Cost-Per-Click (CPC) and Cost-Per-Acquisition (CPA). After estimating the action rate, the “optimization” phase focuses on selecting the sponsored items for display. This is the focus of our paper.
A common solution widely used in the industry for the “optimization” step is using score-based ranking algorithms, which involves assigning scores to items based on predetermined criteria and then ranking them for display according to these scores. Such algorithms are designed to meet the stringent latency requirements of online platforms, typically generating rankings within 0.1 seconds. The scoring criteria often encompass multiple objectives, including but not limited to the consumer action rate, the relevance of the items to the consumer, and potential revenue generation. A common practice is to employ a score function that linearly combines multiple objectives that fit online marketplaces’ interests the most (Liu et al.,, 2015; Cheng et al.,, 2016; Covington et al.,, 2016; Okura et al.,, 2017; Zhou et al.,, 2018).
However, there are several inherent limitations associated with the score-based algorithm. First, the quality of the final ranking entirely depends on the definition of the score function, posing a significant challenge for online marketplaces in picking the most suitable score function. The obtained ranking might vary greatly with the choice of score functions, and for those that are not direct measurements of the key economic features, the ranking results might be sub-optimal and unable to achieve Pareto efficiency. Furthermore, through the multi-objective score function, it is difficult to explicitly guarantee individual objectives’ performance. More specifically, the score-based method does not incorporate scenarios where marketplaces would like to set constraints on resources and considerations such as inventory, sales performances, and fairness. To resolve these issues, we propose and study an alternative approach called the LP-based algorithm in this paper. Specifically, a ranking problem can be formulated as a constraint mixed integer programming (MIP) problem. Note that since MIP is NP-hard, we relax it to an LP problem for tractability. Unfortunately, even with state-of-the-art LP solvers, solving the LP directly still cannot meet the strict latency requirement for online marketplaces. With these insights, in this paper, we first propose a dual-based algorithm for approximately solving the MIP formulation of the SLR problem that can find an approximate solution within second to meet the latency requirement. Then, we present a detailed field study, in collaboration with a leading online marketplace’s platform (referred to as “Marketplace A” for proprietary consideration), that empirically compares the performance of the proposed LP-based algorithm and an industry-level extremely-tuned score-based algorithm. The empirical study clearly showcases the effectiveness of the LP-based algorithm, which improves three key metrics for Marketplace A, namely, purchase, gross merchandise value, and marketplace revenue, in a 19-day A/B test that was performed at the online marketplace in April 2022. Subsequently, the LP-based algorithm was put into production at Marketplace A in January 2023 to help the marketplace provide high-valued sponsored items to consumers.
The contributions of the paper can be summarised as follows:
The major contribution of the paper is an extensive field study (A/B test) on Marketplace A comparing the performance of the LP-based algorithm and the extremely tuned score-based algorithm previously used in production at Marketplace A. Conducted over a span of 19 days in April 2022, the field study encompassed approximately 329 million impressions and yielded conclusive evidence of the LP-based algorithm’s superior performance, as manifested in a 1.80% increment in revenue, a 1.55% augmentation in purchase rates, and a 1.39% elevation in Gross Merchandise Value (GMV). We further present a careful performance analysis of the experiment results, which showcases that (i) the LP-based algorithm displays more relevant items to consumers, i.e., items that fit consumers’ interests, thus resulting in more sales, a higher conversion rate, and eventually more revenue; (ii) the average transaction price of the LP-based algorithm is no higher than the score-based algorithm, which demonstrates that the additional revenue does not originate from a lifted item price. To the best of our knowledge, this is the first empirical study comparing the LP-based and score-based approaches for sponsored listings ranking problems, a core problem faced by online marketplaces. After another round of an 18-day A/B test in September 2022, which demonstrated consistent results, the LP-based algorithm was put into production at Marketplace A in January 2023, generating significant growth in GMV, purchase, and revenue for Marketplace A.
Another contribution is the development of an LP-based algorithm for the SLR problem. Starting with the SLR problem formulated as a MIP problem, we apply the LP relaxation to obtain a primal-dual pair problem, then use binary search to recover the optimal dual variable. Through duality, our algorithm can obtain an integral solution that is feasible for the MIP problem, and usually with a minor optimal gap, as shown in section 3.3 through simulations. Additionally, we show that our algorithm is more than times faster than the state-of-the-art commercial LP solver on SLR instances of typical size with 50 slots and 500 items, enabling LP-based algorithms in practice for the latency requirement.
Last, we present extensions with further modeling power of the LP-based methods that can be used to solve problems with additional constraints in an online setting. In practice, beyond relevance and revenue, online marketplaces often face other constraints: consumers would prefer to browse fewer sponsored items but more items from a variety of sellers; sponsored sellers are concerned with inventory management and sales performances, and wish for their listed items to be displayed to as many consumers as possible. As these constraints exist globally and might vary over time, the score-based algorithms do not have the flexibility to address them. To overcome this limitation, we extend our initial LP-based model by constructing a comprehensive large-scale overall problem that incorporates all local optimization problems for each impression accumulated over a period. Subsequently, we introduce global constraints to the overall problem, which can be solved by the newly-developed large-scale LP solver PDLP (Applegate et al.,, 2021). After solving the overall problem offline and obtaining the optimal dual variables, we then utilize these dual variables in online LP-based SLR problems.
Note that score-based algorithms are the golden standard in the industry for sponsored listing and other ranking problems; this work can provide empirical evidence for the marketplace to implement the LP-based algorithms.
1.1 Literature reivew
This section presents related literature on sponsored listing ranking problems.
Ranking in recommendation system
Our work provides an approach for the ranking step in the recommendation system. In a recommendation system, the first step is to estimate the conversion rate of displaying the impression by machine learning algorithms, which has been quite mature and provide reasonable estimations in the online advertising industry (Liu et al.,, 2015; Cheng et al.,, 2016; Covington et al.,, 2016; Okura et al.,, 2017; Zhou et al.,, 2018). After estimating the conversion rates, online platforms are tasked with developing a ranking model that displays candidate items to consumers in a designated order, which is the focus of this paper. A majority of previous studies focus on the score-based ranking model (Zehlike et al.,, 2022; Renda and Straccia,, 2003; Montague and Aslam,, 2001; Manmatha et al.,, 2001), that is, calculating a score for each item through a customized scoring function, and then selecting the displayed items by ranking the scores. While the ranking algorithms are similar among various studies, the scoring function, however, might vary, depending on the objectives of each online platform. For instance, Covington et al., (2016) deployed a deep neural network model and used logistic regressions to generate scores for each video content on YouTube. Google Play (Cheng et al.,, 2016), instead, used only the estimated conversion rate as the score for each item, therefore, aiming to recommend the most relevant items to consumers. Netflix (Amatriain,, 2013) adopted a score function that linearly combines popularity and predicted rating for each video. As we will introduce more details in 2, Marketplace A also utilizes a score-based ranking method whose objective combines different sources of revenue (Ge et al.,, 2020). In the case of “cold start”, i.e., the launch of a new advertisement/item, where the data for conversation rate estimation is limited, Ye et al., (2023) proposed a bandit algorithm that significantly increased the success rate of cold start in field experiments.
An inevitable drawback of the score-based method is that even though online platforms aim to achieve Pareto efficiency over multi-objective (Lin et al.,, 2019), it is hard to guarantee the performance of individual objectives. An alternative approach is to formulate the problem as a mathematical programming problem, that is, maximizing an objective function while setting constraints on some other metrics and resources. Such a problem can be formulated as a mixed integer programming (MIP) problem (Celis et al.,, 2017), and sometimes referred to as an advertisement allocation problem (Mehta et al.,, 2013). We can also associate this problem with some well-studied literature on assignment problem (Ross and Soland,, 1975) and knapsack problem (Salkin and De Kluyver,, 1975). However, as the number of constraints increases, the MIP also becomes increasingly harder to solve, requiring various approximation techniques. A more comprehensive review can be referred to (Cattrysse and Van Wassenhove,, 1992; Pentico,, 2007; Karp et al.,, 1990). Particularly, Celis et al., (2017) considered the ranking problem with fairness constraints. Based on LP relaxation, they recovered integral solutions with small constraint violations. Asadpour et al., (2023) studied a ranking model that aims to maximize consumer engagement for online retail, proposing an algorithm by LP relaxation and randomized rounding. Further, through LP-relaxation and primal-dual pairs, Google (Bhalgat et al.,, 2012) addressed an advertisement allocation problem with nested packing constraints, and then approximated it with an LP-based primal-dual algorithm; Microsoft (Chen et al.,, 2011) proposed a bidding algorithm for advertisement allocation with budget constraints. Inspired by (Chen et al.,, 2011), Alibaba (Zhang et al.,, 2018)) developed a similar algorithm for a global advertisement allocation problem that optimized over accumulated search queries. It is noted that, despite the availability of standard algorithms in the existing literature for advertisement allocation problems, the introduction of new problems with distinct objectives or constraints necessitates the customization and adjustment of these paradigms. Our algorithm belongs to this category, and we provide an efficient approximate algorithm for solving the MIP problem and the first field study comparing the performance of scored-based algorithm and LP-based algorithms.
Multi-objectives selections and trade-off
Our paper also relates closely to the literature that studies the selection of objectives and trade-offs between muti-objectives. As mentioned earlier, given the variety of objectives, different online platforms may prioritize them differently. Other than maximizing revenue, online marketplaces might also need to consider extra objectives such as consumer utility, ranking relevance (Ghose et al.,, 2014), algorithm fairness (Geyik et al.,, 2019), and content diversity (Chen et al.,, 2024). For instance, online video platforms such as YouTube or Netflix emphasized more on ranking relevance (Covington et al.,, 2016; Amatriain,, 2013), while online marketplaces such as Tabao cared more about revenue (Hu et al.,, 2018). Naturally, each online marketplace has multiple objectives incorporated into the optimization framework. Agarwal et al., (2011) jointly optimized for initial clicks and post-click downstream. Xiao et al., (2017) considered the fairness conflict between individuals and the entire group. Chen et al., (2024) recommended that social media platforms should focus on increasing content diversification specifically for active consumers. Contrary to industry assumptions, their research revealed that diversified recommendations would enhance content consumption diversity only among active consumers. Adomavicius and Kwon, (2014) optimized for the aggregated diversity of a group of recommendations. Sumida et al., (2021) characterized the trade-off between revenue and utility under MNL, by constructing the objective function as a weighted sum of revenue and utility. Louca et al., (2019) proposed a similar MNL model optimization framework, weighting the sum of revenue and relevance. Li et al., (2021) considered a fairness metric evaluated by the click-throughs of different Ads and customer types. They proposed a two-stage allocation method for online advertisement, which balanced revenue and algorithm fairness. However, since the objectives might not always align, Rodriguez et al., (2012) addressed this issue using constraint optimization. On the other hand, as multi-objective optimization often resulted in many nondominated solutions and low pressure towards the Pareto front, Li et al., (2016) developed a stochastic ranking algorithm to tackle this problem.
Assortment problem
The work is also related to the literature studying assortment optimization problems, which refer to the challenge of selecting a subset of products to offer from a larger set, in an online setting, where the goal is often to maximize revenue or customer satisfaction (Kök et al.,, 2009; Caro and Gallien,, 2007; Gallego et al.,, 2020). Differing from ranking problems, assortment problems focus on studying the interaction among listed items and do not usually study the effect of orders. In assortment literature, many previous works adopt parametric models to model the purchase probability of items given a certain set of items, such as the independent demand model (IDM) and basic attrition model (BAM) (Gallego et al.,, 2019). Particularly, IDM assumes that the probability of sale for each item is independent of others, thus the optimal assortment would be the one including all items with positive revenue. However, IDM might be pessimistic in a way that when items are running out of stock, recapturing any of those sales to alternate products would be infeasible since the demands are treated as independent (Gallego et al.,, 2015). Under BAM, on the other hand, for a given assortment, the choice probability of each item is normalized by the summation of the utility of all items in that assortment. The often-used multinomial choice model (MNL) is a special case of BAM (McFadden et al.,, 1973; Luce,, 2005). Under the MNL model with no constraint, Talluri and Van Ryzin, (2004); Gallego et al., (2004) characterized the revenue-ordered property of the optimal assortment. Further, for the robust assortment optimization under MNL, the optimal assortment is still revenue-ordered (Rusmevichientong and Topaloglu,, 2012). However, in contrast to IDM, BAM might be optimistic about recapturing the sale of alternative items due to the self-normalization procedure (Gallego et al.,, 2015). Feldman et al., (2022) also emperically showed that the MNL model performed worse during multi-purchase events. Recently, there has been some research studying the ranking of the assortment of products for online retailing. Ferreira et al., (2022) studied the ranking of the selected assortment display to consumers. The proposed online learning algorithms also for maximum consumer engagement, which balanced between learning speed and optimality gap. As classic choice models for online retailing only gave limited consideration to substitution patterns, Jiang et al., (2020) proposed a high-dimensional choice as an alternative. Asadpour et al., (2023) focused on ranking assortment in the form of a submodular maximization problem. They developed offline approximation algorithms that give the maximum probability of purchases. Most of the previous works in the assortment literature focused on developing theory guarantees. The only empirical study we found on online assortment problems is Feldman et al., (2022). They novelly implemented the algorithm proposed in Rusmevichientong et al., (2010) and presented an empirical study at Alibaba comparing the multinomial logit model versus industry-level machine learning models for assortment.
2 Sponsored listing and score-based ranking at Marketplace A
In this section, we present an overview of the marketplace of Marketplace A, with a focus on sponsored listing. Then, we discuss the score-based ranking algorithm previously deployed at Marketplace A.
2.1 An overview of Marketplace A’s Marketplace And sponsored listing
The essence of the marketplace is to match the search requests from consumers by providing them with a carefully selected range of items listed by sellers, thereby enabling transactions. Providing a carefully ranked list of items is referred to as the ranking problem, which is a major task for the online marketplaces. Generally speaking, Marketplace A’s marketplace is tasked with two key ranking problems, namely, the keyword ranking (KR) and the sponsored listings Ranking (SLR). The KR pertains to the problem through which the search engine displays items according to consumer-entered keywords, which is a problem shared by not only online marketplaces but also many primary search engines like Google and Bing. For instance, when a consumer visits Marketplace A’s webpage and searches for a keyword, a list of ranked items will be displayed correspondingly as exhibited in Figure 1(a). The study of how to rank these items is called KR. Then, the consumer may click one of the displayed items that she is interested in, and enter its main page (Figure 1(b)). This specific item is called seed item of the page. Below the seed item is a carefully selected list of related items, which is called Sponsored listings items. The objective of SLR is to recommend consumer-related alternatives or complementary items that may pique the interest of consumers who might not be captivated by seed item. Sponsored listings is also phrased as “sponsored items”, “often bought together”, “you might also like”, across different online marketplaces such as Amazon and BestBuy.
Marketplace A has multiple revenue sources, among which the sponsored listing is one of the most significant. In this paper, we specialize in SLR. Particularly, the goal of SLR is to display relevant items for consumers and generate sizable revenue. For sponsored listings, Marketplace A’s revenue primarily comes from two components: 1) take fee (also called organic revenue) and 2) sponsorship fee (also called Ad revenue). For every item sold at the marketplace, a certain percentage of the price is taken by Marketplace A as a commission fee, which is referred to as take fee. The percentage (called take rate) is tiered and ranges from 3% to 15%, depending on the item’s category and price. In addition, the sellers can voluntarily sponsor their items by contributing additional fees to boost the visibility of items to consumers. Such fees will be charged proportionally to items’ prices, where the proportion is referred to as Ad Rate.
From the historical data of Marketplace A, we observed that organic revenue is highly correlated with purchase count, as a higher purchase-through rate (PTR) will lead to more purchases and thus a higher organic revenue. It means that more relevant rankings would lead to more organic revenue and less Ad revenue. Contrariwise, a new policy that generates revenue improvement usually comes with more Ad revenue and the curse of less organic revenue. Spontaneously, the trade-off between relevance and revenue could also be viewed as the one between organic revenue and Ad revenue.
When a consumer opens a webpage with a seed item, Marketplace A first selects a collection of qualified candidate items. From now on, we use the set to denote this collection. On the other hand, depending on the display settings across various platforms (Figure 2), the slot number might differ as well (up to .) Then, Marketplace A is tasked to (1) choose a subset of according to the slot number and then (2) display this subset of items in ranked order. The consumer may navigate to a promoted item and make the purchase. While looking after the welfare of all three parties (consumers, sellers, and the marketplace), the objective of SLR is to display the ranking that not only fits consumers’ interests but is also able to generate substantial revenue for both the sellers and the marketplace.


2.2 Score-based ranking for sponsored listing at Marketplace A
Score-based ranking refers to ranking listed items based on a monotonicity order of a certain score defined by the marketplace. Due to its simplicity and efficiency, score-based ranking is perhaps the most well-used algorithm for recommendation systems and sponsored listing. The key to a score-based ranking is how the score is defined. Score-based ranking is also the production model used in sponsored listing at Marketplace A, and the engineering team has done extensive studies to optimize how the score is defined for improving performance. In this section, we present the high-level ideas of this score-based ranking algorithm used at Marketplace A, which serves as the baseline algorithm in our field study compared with the LP-based algorithm we proposed.
The score-based ranking algorithm deployed for sponsored listing at Marketplace A consists of three major steps: (1) candidate selection, (2) PTR estimation, and (3) ranking, which are detailed below.
Step 1: candidate selection.
Among all the items listed by the sellers, there is only a small number of the items that are related to the seed items and thus are potential candidates for the SLR. The first step is to identify candidate set . Here, Marketplace A takes two separate approaches. One is based on the categories of seed item, and the other is developed from consumers’ history. Each listed item has been pre-labeled with various categories and sub-categories, spanning multiple layers. The first group of candidate items is determined by their categorical similarity to the seed item. For the second group, Marketplace A trains the k-nearest neighbors (KNN) algorithm featured on each consumer’s browsing and purchase history to select the related items. Eventually, the union of the first and the second group will formulate the candidate set . Meanwhile, to avoid the overwhelming number of candidate items, Marketplace A will restrict the cardinality of during the selection phase. As a result, usually, the number of candidate items ranges from to . On the other hand, as indicated previously, the number of slots might vary among different marketplaces. In general, we consider to range from to .
Step 2: purchase-through rate (PTR) estimation.
As Marketplace A adopts the CPA model, the purchase-through rate (PTR) will be regarded as the conversion rate. For each item , the marketplace would like to predict its PTR, equivalent to the probability of purchase. Naturally, we regard PTR as an appropriate metric to evaluate the relevance of an item, as it reflects the degree to which an item aligns with a consumer’s interest. Using the features of listings (like category, price, and sale history) and consumer preferences (like purchase and browsing history) from historical data, Marketplace A employs a fine-tuned XGBoost model to estimate the PTR. For each item , there is an associated predicted PTR score, denoted by . Further, for each slot , Marketplace A estimates a corresponding weight , representing the corresponding slot’s importance. Generally speaking, the first few slots have higher weights than the latter slots.
Step 3: score-based ranking. As the last step, Marketplace A introduces a score, ranks the items based on this score, and then selects the items with the highest scores to display. More specifically, the score for the -th item is defined as a weighted sum of the expected organic revenue (PTR take rate price) and the expected Ad revenue (PTR Ad Rate price) with the following form:
| (1) |
where denotes the price of the item. The term denotes the take rate of the item, which is the commission levied by Marketplace A upon the sale of the item, with a predetermined rate for each item category within the marketplace. The organic revenue constitutes the obligatory financial remittance by every vendor for each item sold on the platform. The term denotes the Ad Rate for the -th item, namely, the additional fee vendors are prepared to expend for enhanced item visibility. The Ad revenue represents a discretionary expenditure by sellers aimed at augmenting the prominence of their offerings. The parameter is the weight parameter that controls the balance between organic revenue and ad revenue. Notably, the selection of the scoring function and the calibration of has gone through extreme tuning at Marketplace over an extended period, and we believe their production model optimally harnesses the power of the score-based algorithm.
3 Linear programming (LP)-based ranking
In this section, we propose an alternative ranking approach based on linear programming (LP) to solve the SLR problem. Specifically, we first present a mixed integer programming (MIP) formulation of the SLR problem. Unfortunately, this MIP problem cannot be solved efficiently within the latency requirement of the online marketplace platform. We then propose a primal-dual algorithm for solving its LP relaxation, which leads to a feasible and almost optimal solution to the original MIP problem.
3.1 Mixed-Integer Programming (MIP) formulation for the SLR problem
Suppose we have candidate items designated to be assigned to slots . For each slot , we have the knowledge of its estimated slot weight , which represents the importance of the -th slot. In general, the customer is more likely to buy the recommended items at the first few slots than the latter ones, and such difference among slots is measured . Additionally, for each item , we estimate (1) the relevance to the seed item, , measured as the purchase rate, and (2) expected revenue as the sum of expected organic revenue and Ad revenue as we defined previously from equation (1), i.e., . Denote the vectors as .
Without the loss of generality, we assume that position weights are sorted in descending order; namely, the item at the slot with a smaller index is more likely to be purchased than the same item at a slot with the latter index:
Assumption 1 (Monotonically decreasing position weights).
The position weights is sorted in descending order, i.e., .
In the MIP formulation, we aim to maximize the expected total revenue while posing a lower bound on the overall relevance level. The binary decision variable represents a ranking plan, namely, an item is assigned to slot when takes the value , or if not. As a feasible ranking plan satisfies (i.e., each slot can only have one candidate), (i.e., each candidate can only be shown at most once), and (i.e., the decision variable is binary). For notational convenience, we denote
| (2) |
as the feasible region of a ranking. Furthermore, we can compute the maximal overall relevance as
| (3) |
is the maximal possible relevance a ranking can achieve. In the MIP formulation, we aim to find a ranking that maximizes the revenue while making sure that the overall relevance is at least times the maximal overall relevance with a pre-determined parameter :
| (4) | ||||
| s.t. | (5) | |||
| (6) |
Notice that the MIP formulation is always feasible, because the ranking that gives the maximal overall relevance store is a feasible solution. Additionally, with decreases, the feasible region of is monotonically enlarged. As a result, since a smaller will induce a possibly lower relevance value but higher revenue, the trade-off between revenue and relevance is fulfilled by the parameter .
3.2 Linear Programming (LP) relaxation and an efficient algorithm
A challenge of the real-time SLR problem is the latency requirement, which needs to be finished within 0.1 second in general. This poses a strict limitation for obtaining a ranking policy, preventing us from exactly solving MIP. Indeed, the traditional Branch-and-Bound/Branch-and-Cut method for solving MIP costs excessively long and unstable time that the marketplace marketplace cannot afford. In such cases, a typical approach is to look at and solve its LP relaxation. Unfortunately, the state-of-the-art commercial LP solvers can still not solve the LP relaxation within the latency requirement (see Section 3.3 for a computational study). Here, we present a linear time dual-based bisection algorithm that finds a feasible and approximately optimal MIP solution.
We start with presenting the LP relaxed version of MIP, by relaxing the binary variable constraint to :
| (7) | ||||
| (8) | ||||
| (9) |
where
| (10) |
Algorithm 2 presents our major algorithm. The basic idea of the algorithm is to do a bisection search for the optimal dual variable to the constraint (8), and then obtain the corresponding primal response that gives an approximate solution to the LP formulation. More specifically, the algorithm has the following three steps:
Step 1: check if the relevance constraint is redundant
Given , we could first easily verify whether the relevance constraint (5) is redundant. Removing (5), the optimal value of would be . Similar to the way of obtaining , due to the unimodularity property, we can obtain the optimal solution by (1) first sorting the vector in descending order, i.e., , and (2) set and elsewhere. Also, we can see that .
If , it means that the ranking that generates the maximum revenue is also feasible to , indicating that the relevance constraint (8) is redundant and is an optimal solution to . Then, the algorithm ends, and an optimal solution to the LP and MIP formulation is found.
Step 2: Obtain a range of the optimal dual variable
Let us consider the following primal-dual form of , denoted as :
| (11) |
Denote , where . We denote the optimal value of as , and an optimal dual variable is .
Suppose we constraint (8) is not redundant, then it follows from complementary slackness that . The second step of Algorithm 2 is to find an upper and lower bound on .
Notice that for any given , one can solve the inner maximization problem over in (11) by a simple ranking-based algorithm (see Algorithm 1), and we denote the solution . Furthermore, we know that gives a sub-gradient of by
| (12) |
Notice that is a convex function and . Furthermore, due to the feasibility of the constraint (8), we know there exists a large enough finite , such that its sub-gradient is strictly positive. Thus, we can obtain an upper-bound by iteratively doubling the value of and checking its corresponding sub-gradient. We can also obtain a lower bound during this process.
Step 3: Obtain a near-optimal dual solution and a feasible ranking When a lower bound and an upper bound of , we can do a bisection search for till , where is the target accuracy. Then it is easy to check that the primal response of is a feasible and near-optimal solution to . Eventually, Algorithm 2 outputs the primal response of .
3.3 Computational results
In this section, we compare the performance of our proposed LP-based algorithm and Gurobi, a commercial solver, for solving synthetic instances that mimic the SLR problem in practice. Recall that our goal is to solve the MIP formulation . Unfortunately, no MIP solver can possibly solve within the latency requirement or even close. To meet the latency requirement, we consider two approaches: (i) the proposed LP-based Algorithm 2, which outputs a feasible, integral, and nearly optimal solution to ; (ii) commercial LP solver Gurobi to solve the relaxed LP formulation (7), which often outputs an infeasible and fractional solution to , but it serves a good benchmark for running time comparison.
In all of our experiments, we simulate each instance (a given pair of ) 1000 times and present the average results. For Gurobi, we used the concurrent method Gurobi 10.0, which runs primal simplex, dual simplex, and barrier methods simultaneously. We set the dual feasibility tolerance to be (for Gurobi) and the to be (for LP-based Algorithm 2). The experiments run on the Dell PowerEdge R640 computing node with GB of memory. It is noted that the running time for Gurobi listed below only involves the solving time and does not include the model building time. In practice, the time latency ( seconds) is required for the sum of building and solving time. To exhibit the efficiency of the LP-based algorithm, we designed two experiments.
First, due to the special structure of the formulated SLR problem, plays an essential role in determining the computational cost of solving the problem. With a small , the relevance constraint (8) might be redundant, thus resulting in the LP-based algorithm solving extremely fast. Therefore, we would like to compare the LP-based algorithm’s and Gurobi’s performances with a wide range of . In the first experiment, by fixing the problem size ( slots and products, which is typically the largest problem size we might encounter in Marketplace A’s SLR problem) and independently uniformly generating random variables (), we set up the test for multiple ranging from to , i.e., . The optimal gap is calculated as (Optimal value of MIP - Approximated objective value of LP-based Algorithm 2)/Optimal value of MIP . As indicated in Table 1, we see that excluding the cases where is too small (), the proposed LP-based algorithm achieves more than x time improvement over Gurobi LP solver. In the meantime, the LP-based algorithm can achieve the optimal gap of less than for each instance.
| .1 | .2 | .3 | .4 | .5 | .6 | .7 | .8 | .9 | .925 | .95 | .975 | |||
| Optimality Gap (%) | 0.000* | 0.000* | 0.000* | 0.000* | 0.000* | 0.001 | 0.003 | 0.008 | 0.015 | 0.019 | 0.027 | 0.042 | ||
| LP-based time (seconds) | 0.001 | 0.001 | 0.001 | 0.001 | 0.004 | 0.009 | 0.01 | 0.01 | 0.01 | 0.01 | 0.011 | 0.012 | ||
| Gurobi time (seconds) | 0.224 | 0.205 | 0.204 | 0.205 | 0.212 | 0.231 | 0.247 | 0.264 | 0.3 | 0.317 | 0.337 | 0.362 | ||
|
289** | 269** | 262** | 252** | 48** | 24 | 26 | 27 | 30 | 31 | 30 | 30 |
In the second experiment, we would like to explore the performance of the LP-based algorithm for various problem sizes, especially when the problem dimension increases. Thus, for the second experiment, by picking (which is a reasonable value for as shown in the field study below), we test with a range of and (). As shown in Table 2, compared to Gurobi, the LP-based algorithm achieves a massive improvement, especially under large-scale problems. We see that the time improvement grows as the problem size increases, whereas the optimal gap reduces. When , the LP-based algorithm is more than x faster than Gurobi with the optimal gap to be . Under the seconds latency requirement, we see that the LP-based solver can solve a problem with a size of at most . Yet, under the same conditions, Gurobi can only solve one with a size of . Overall, the optimal gap is usually negligible () for reasonably sized instances.
The above two experiments demonstrate the efficiency of the proposed algorithm compared to state-of-the-art commercial solvers. Indeed, the LP commercial solver is not a feasible solution due to the latency requirement of the marketplace, while our proposed Algorithm 2 enables such an LP approach for sponsored listing.
| Panel A: LP-based time (seconds) | ||||||
|---|---|---|---|---|---|---|
| 50 | 100 | 200 | 500 | 1000 | 2000 | |
| 10 | 0.001 | 0.001 | 0.003 | 0.006 | 0.011 | 0.022 |
| 20 | 0.001 | 0.002 | 0.003 | 0.007 | 0.013 | 0.027 |
| 50 | 0.001 | 0.002 | 0.005 | 0.011 | 0.021 | 0.041 |
| 100 | 0.003 | 0.006 | 0.017 | 0.034 | 0.067 | |
| 200 | 0.011 | 0.027 | 0.061 | 0.128 | ||
| 500 | 0.061 | 0.125 | 0.283 | |||
| Panel B: Gurobi time (seconds) | ||||||
|---|---|---|---|---|---|---|
| 50 | 100 | 200 | 500 | 1000 | 2000 | |
| 10 | 0.003 | 0.006 | 0.012 | 0.038 | 0.102 | 0.326 |
| 20 | 0.007 | 0.014 | 0.027 | 0.085 | 0.225 | 0.671 |
| 50 | 0.017 | 0.045 | 0.110 | 0.343 | 0.851 | 2.304 |
| 100 | 0.094 | 0.205 | 0.423 | 0.844 | 1.832 | |
| 200 | 0.639 | 1.366 | 2.468 | 5.170 | ||
| 500 | 8.158 | 16.339 | 28.717 | |||
| Panel C: Time improvement (Gurobi time/LP time) | ||||||
|---|---|---|---|---|---|---|
| 50 | 100 | 200 | 500 | 1000 | 2000 | |
| 10 | 4.9 | 4.7 | 4.8 | 6.4 | 9.2 | 14.6 |
| 20 | 9.2 | 9.1 | 8.6 | 11.9 | 16.9 | 25.3 |
| 50 | 16.0 | 20.1 | 23.6 | 31.4 | 40.8 | 56.2 |
| 100 | 29.2 | 31.7 | 24.7 | 24.6 | 27.3 | |
| 200 | 58.3 | 50.0 | 40.4 | 40.4 | ||
| 500 | 133.7 | 130.3 | 101.5 | |||
| Panel D: Optimal Gap (%) | ||||||
|---|---|---|---|---|---|---|
| 50 | 100 | 200 | 500 | 1000 | 2000 | |
| 10 | 0.83 | 0.573 | 0.343 | 0.159 | 0.078 | 0.039 |
| 20 | 0.336 | 0.269 | 0.182 | 0.081 | 0.044 | 0.020 |
| 50 | 0.062 | 0.059 | 0.052 | 0.027 | 0.015 | 0.007 |
| 100 | 0.015 | 0.015 | 0.01 | 0.006 | 0.004 | |
| 200 | 0.004 | 0.004 | 0.004 | 0.004 | ||
| 500 | 0.004 | 0.004 | 0.004 | |||
4 Field experiments: design and data
To demonstrate the value and power of the LP-based algorithm, we conduct a randomized field experiment that assesses the overall performance of the LP-based model. In this section, we first introduce the settings and design of this field experiment. Then we present the results of the randomization test that exhibits the rigorousness of this design.
4.1 Experiment design
We conducted an A/B test and evaluated the performance of the proposed LP-based algorithm at Marketplace A’s Marketplace across four major countries in April and May 2022. The experiment started on April 27 and lasted for 19 days until May 16. There are four notable traffic channels that Marketplace A’s marketplace has developed for consumers to visit, which are the desktop website, the iOS App, the Android App, and the mobile website, respectively. In this field experiment, we conducted the experiment in the desktop website channel (called “dWeb”), which gathered the most traffic from consumers across all channels. The benchmark we compared with in the experiments is the score-based approach described in Section 2.2, which was the production model used at Marketplace A at the time of the experiments. It is noted that, since the score-based approach was first introduced in 2020, Marketplace A has been conducting extensive experiments on it to select its optimal hyperparameters. Accordingly, in our experiment, the current version of the score-based approach is believed to have reached its full potential.
The LP-based algorithm aims to generate more revenues for the marketplace while keeping the same level of relevance for the listed products as the score-based approach obtains. In order not to impair the overall relevance level, we decided to set in the field study after examining the pre-experiment data. More specifically, we set up the following three methods, including two treatment groups and one control group:
-
1.
LP90 (Treatment 1) For consumers assigned to this group, the displayed listings will be generated by the LP-based algorithm with hyperparameter .
-
2.
LP95 (Treatment 2) For consumers assigned to this group, the displayed listings will be generated by the LP-based algorithm with hyperparameter .
-
3.
Benchmark (Control) For consumers assigned to this group, the displayed listings will be generated by the score-based algorithm.
During the 19 days of the experiment, each consumer who entered the sponsored listings page would be randomly assigned into one of three groups where the displayed listings are generated by the corresponding method. The mechanism of assignment adopted by Marketplace A is based on unique consumers’ IDs. It means that within the duration of the experiment, each consumer will be guaranteed to receive the treatment from a fixed group, no matter how many times she re-enters the experiment.
4.2 Experiment statistics and randomization test
In what follows, we present a detailed description of the post-experiment statistics and the randomization test for the pre-experiment data. During the 19-day period, we recorded in total 32,058,321 consumers, of which 10,686,419 consumers were assigned to LP90 (Treatment 1), 10,689,158 consumers were assigned to LP95 (Treatment 2), and 10,682,744 were assigned to Benchmark (Control). The visit that each consumer pays to Marketplace A’s marketplace is called impression. During the experiment period, it is likely that each consumer pays multiple visits, generating many impressions. As a result, in total, 329 million impressions were generated. Specifically, 109,843,211 impressions were assigned to 109,868,303 impressions were assigned to LP90 (Treatment 1), LP95 (Treatment 2), and 109,567,246 consumers were assigned to Benchmark (Control). Panel A of Table 3 demonstrates the above information, as well as the aggregated revenue and gross merchandise volume (GMV), collected within the experiment period. GMV is defined as the total amount of sales completed through Marketplace A’s marketplace over a specified period of time, while revenue is a partial amount of commission fee that Marketplace A takes from GMV.
Then we show some post-experiment statistics and p-values that inspect the randomness of the assignment, that is, whether the impressions were truly randomly assigned without any bias or not. As shown in Panel A of Table 3, for the number of consumers and impressions, the minimum pairwise p-value among the three groups is larger than , indicating no significant signs of the differences among all three groups. To further strengthen the randomization of the assignment, we run the t-tests on four weeks’ pre-experiment data for the key metrics of consumers who entered our A/B tests later. Panel B of Table 3 presents information on the average expenditure spent, generated revenue, and the number of purchases made per consumer during the pre-experiment period. We observe that the number of consumers and impressions assigned to each group is statistically indistinguishable, as the minimum pairwise p-values of all pre-experiment tests are larger than . The results of the randomization tests indicate that any difference in the consumers’ purchasing behavior among these three experiment groups should be attributed to the proposed approach to which they have been assigned to.
| LP90 | LP95 | Benchmark | Min pairwise p-value | |
| (Treatment 1) | (Treatment 2) | (Control) | ||
| Panel A: Summary Statistics for experiment data | ||||
| Number of consumers | 10,686,419 | 10,689,158 | 10,682,744 | >0.99 |
| Number of impressions | 109,868,303 | 109,843,211 | 109,567,246 | >0.94 |
| Panel B: Randomization Check for pre-experiment data (per consumer) | ||||
| Expenditure(USD) | * | * | * | >0.22 |
| Revenue(USD) | * | * | * | >0.94 |
| Number of purchases | * | * | * | >0.99 |
-
•
Notes. * Due to the confidentiality of data sources, consumer-level data is forbidden to be disclosed by Marketplace A. Nevertheless, we are able to demonstrate the pairwise p-value to show the randomness of the experiment assignment.
5 Field experiment: results and analysis
In this section, we present the main results collected from the field experiment. We start with a detailed description of the financial performance of the participating experiment groups. We present three metrics as the assessments of the ranking quality (revenue and relevance) for experiment groups, which are respectively revenue, purchase count (total number of transactions), and GMV (gross merchandise volume). These are also what Marketplace A adopts as the major evaluation metrics. The purchase count measures the relevance score of the sponsored listings, and it is the realization of purchase probability. The revenue and GMV are metrics for evaluating the revenue of the marketplace. In later parts of this section, we pose a detailed analysis of the experiment data, attempting to better explain the results and interactions of these metrics across all groups. Additionally, we identify the trade-off between relevance and revenue shown by the evidence of the field experiment, which to our knowledge, is the first time in this field of research.
5.1 Performance and analyses
5.1.1 Financial performance
We start by presenting and comparing several core metrics involved in the field experiment, which are all normalized by the number of consumers. Notably, we define and present the comparison (relative change and p-values) among RevenuePerConsumer, GMVPerConsumer, NumberPurchasesPerConsumer, and AverageTransactionPrice, attributed to three experiment groups (LP95, LP90, Benchmark). In particular, RevenuePerConsumer is the total revenue generated per consumer during the experiment period; GMVPerConsumer is the total expenditure spent per consumer during the experiment period; NumberPurchasesPerConsumer is the total number of purchases made per consumer during the experiment period; AverageTransactionPrice is the average item sold price per transaction. Table 4 also demonstrates the relative change of two treatment groups (LP95 and LP90) over the control group (Benchmark) and the associated p-values of the pairwise t-tests.
The results revealed in Table 4 show that, compared to Benchmark, both LP95 and LP90 exhibit improvements in all major metrics, some of which are statistically significant. For LP95, RevenuePerConsumer, GMVPerConsumer, and NumberPurchasesPerConsumer are respectively 0.0293, 0.5553, and 0.0162, indicating 0.81%, 2.96%, and 3.22% increases compared to Benchmark. Among them, increases of GMVPerConsumer and NumberPurchasesPerConsumer are significant with p-values less than 0.001. On the other hand, for LP90, RevenuePerConsumer, GMVPerConsumer, and NumberPurchasesPerConsumer are respectively 0.0295, 0.5465, and 0.0159, indicating 1.80%, 1.39%, and 1.55% increases compared to Benchmark. Amid them, GMVPerConsumer and NumberPurchasesPerConsumer of the LP-based algorithm display significantly distinguishable improvement over Benchmark, with p-values less than 0.03.
| LP95 | LP90 | |
|---|---|---|
| (Treatment 1) | (Treatment 2) | |
| RevenuePerConsumer (USD) | 0.81% (0.32) | 1.80% (<0.03) |
| GMVPerConsumer (USD) | 2.96% (<0.001) | 1.39% (0.11) |
| NumberPurchasesPerConsumer | 3.22% (<0.001) | 1.55% (<0.001) |
| AverageTransactionPrice (USD) | -0.23% | -0.20% |
5.1.2 Average transaction price
Another critical but less direct metric that we investigate is AverageTransactionPrice. Indeed, AverageTransactionPrice reveals some unique information that accesses the ranking quality from another perspective. To promote the overall revenue, an immediate approach that the ranking model could take is to display listings with higher prices, forcing the consumers to spend more expenditure on the same items. Such shortcuts causing price discrimination will lift the revenue in the short term, yet, it will damage the consumers’ experiences in the longer run, thus hurting the long-term revenue (Nishimura,, 1989). Ideally, we would wish for a ranking model that could recommend more relevant but not necessarily pricier items to consumers. Thus, here we examine AverageTransactionPrice of LP95 and LP90, which are actually 0.23% and 0.20% lower than Benchmark, indicating that the revenue increase obtained by the LP-based approach does not originate from the lifted listing prices.
5.1.3 Regression analysis
To further analyze the factors and mechanisms that might contribute to the differences in performances of the LP-based model compared to Benchmark, in this section, we conduct several regression analyses. In order to perform the analysis in a more exhaustive matter, we investigate the data based on per impression instead of per consumer, since (1) SLR is based on per impression and (2) Table 3 indicates that each consumer might generate multiple impression during the experiment period, thus per impression is more fine-grained than per consumer. The specific dependent variables we define and select in this analysis are , , , , and . For impression , is the revenue that Marketplace A takes; indicates whether one or more purchases that have been made; is the logged average listing prices for all displayed items (log is used to lower the effect of outliers); is the weighted sum of the predicted PTR, defined as the inner product between position weight and relevance score ; indicates whether the purchased item locates in the first slots. It is noted that the and is a binary variable that indicates whether no purchase was made (takes the value zero) or purchase made successfully (takes the value one). Further, and are two noteworthy characteristics that evaluate the ranking quality. Last, we also examine the ranking of purchased items. In our analysis of Marketplace A’s data, we observe that slot weight aligns more closely with a step function. Specifically, within the same page — where, in Marketplace A’s context, there are slots — the weights are relatively consistent. However, when the consumer is required for additional action, such as clicking a button or scrolling down to view more slots, the weight decays dramatically. Given this observation, our approach studies the ranking of purchased items by focusing on a binary variable, , which assesses whether the purchased item is ranked within the top slots.
Next, we implement ordinary least squares (OLS) regression model with the following specification:
| (13) |
where is the dependent variable, and }; is the intercept; is the coefficient; is the binary variable indicating which method (treatment or control) the current impression has been assigned to; is the error term. We run this regression with respect to LP90 and LP95, respectively. Due to the exceedingly large scale of full data and practical restrictions in terms of data privacy, we here examine the sample data by uniformly randomly selecting 690,611 impressions for each experiment group, which counts 2,071,833 impressions in total. Since we have shown that the field experiments were truly randomly assigned and according to the law of large numbers, we believe that the regression results on the sampled data should be representative as well. Later on, we will also show more evidence for regression robustness.
Table 5 demonstrates the regression results in impression level. Since Benchmark is picked as the baseline in our experiment, the coefficients shown in Table 5 indicate the difference in attributions to the dependent variables between two LP-based algorithms and Benchmark. Both the coefficients in Column (1) and Column (2) are positive, revealing that the impression assigned to the LP-based algorithms will generate more revenue and purchases than Benchmark. Furthermore, Columns (3) and (4) suggest the reason for LP90’s and LP95’s better performances are not due to the lifted price, since the coefficients in Column (3) are negative, indicating that the LP-based methods do not recommend pricier items. Instead, Column (4) indicates that such an increase in performance can be attributed to the fact that LP-based methods display more relevant items. Column (5) also strengthens the results by showing the positive coefficient of LP95 alongside a marginally negative coefficient of LP90. It suggests that, compared to Benchmark, more items were purchased in the top slots under LP95, since LP95 is expected to produce more relevant ranked listings.
| Dependent varaible | |||||
| RevenuePerImpression | PurchaseIndicator | LogAveagePrice | WeightedPTR | FirstPageRankIndicator | |
| (1) | (2) | (3) | (4) | (5) | |
| LP90 | 0.056**** | 0.000**** | -0.064**** | 0.1169**** | -0.003**** |
| [0.016] | [0.000] | [0.002] | [0.061] | [0.001] | |
| LP95 | 0.120**** | 0.014**** | -0.1091**** | 0.4826**** | 0.0116**** |
| [0.017] | [0.000] | [0.002] | [0.074] | [0.001] | |
| Observations | 2,071,833 | 2,071,833 | 2,071,833 | 2,071,833 | 2,071,833 |
-
•
Notes. The value inside the square brackets is the robust standard error.
**** .
5.2 Heterogeneous treatment effects analysis
In this section, we present heterogeneous treatment effect analysis to understand when the LP-based model generates more revenue compared to the score-based model. Particularly, the results show that the LP-based algorithms generate more revenue when (multiple) purchases occur in an impression and when the recommended items have a high purchase-to-click ratio.
More specifically, for each impression , we define as the number of purchased items and as the ratio of the purchase number to the click number. Then we perform two OLS regressions with the following specifications:
| (14) | ||||
| (15) |
where is the dependent variable; is the binary variable indicating which method (score-based or LP-based) the current impression has been assigned to. In this analysis, we use LP90 for the LP-based method, because it obtains a more balanced improvement in terms of all three major metrics (revenue, GMV, Number of purchases).
| Dependent varaible | ||
| Revenue | Revenue | |
| (1) | (2) | |
| LP90 | 0.004* | -0.012*** |
| [0.002] | [0.004] | |
| LP90 PurchaseNum | 0.304*** | |
| [0.115] | ||
| LP90 PurchaseToClick | 0.451**** | |
| [0.127] | ||
| Observations | 1,381,222 | 1,381,222 |
-
•
Notes. The value inside the square brackets is the robust standard error.
*; ** ;***;****.
Table 6 presents the regression results from the heterogeneous treatment analyses. Column (1) shows that the coefficient of the interaction of LP90 approach and is positive, meaning that the difference in financial performances between LP90 and Benchmark (the score-based algorithm) increases when there are more purchases occurred within a single impression. We believe this comes from the fact that the objective function in the LP problem maximizes expected revenue directly, in contrast to the Benchmark (score-based algorithm), which relies on a scoring function not directly tied to revenue. Further, Column (2) reports that the coefficient of the interaction of LP90 approach and is positive. Notice that an item with a high purchase-to-click ratio represents a high-quality item. It demonstrates that LP90 generates more revenue on high-quality items.
5.3 Revenue relevance trade-off
Through the LP model, we can identify the trade-off between revenue and relevance. When the parameter in problem increases, the relevance increases as the optimal revenue decreases. In this section, we then take a closer look to inspect this trade-off with the empirical evidence from the field experiment. From September 13th, 2022 to September, 27th, 2022, we conducted a second A/B test on the same marketplace (dWeb), in which we mainly focused on exploring the comparison of performances for various values of . In total, we have set up four experiment groups, which are named respectively LP90, LP85, LP80, and LP75, taking the associated to be 0.90, 0.85, 0.80, and 0.75. In total, we count 17,931,775 unique consumers and 199,681,466 impressions. Specifically, LP90 was assigned 4,483,091 consumers, generating 49,916,423 impressions; LP85 was assigned 4,487,531 consumers, generating 49,983,811 impressions; LP80 was assigned 4,479,883 consumers, generating 49,883,948 impressions; LP75 was assigned 4,481,270 consumers, generating 49,897,284 impressions. We concentrate on two metrics: RevenuePerConsumer and NumberPurchasesPerConsumer since these are the most essential evaluation metrics for revenue and relevance, as we explained before.
We set LP75 to be the benchmark, of which we compute the relative change of metrics for other groups over. Table 7 shows the apparent trade-off over these two matrics. For RevenuePerConsumer, compared to LP75, the relative changes of LP90, LP85, LP80 are 1.24%, 0.60%, and 0.30%. For the NumberPurchasesPerConsumer, compared to LP75, the relative changes of LP90, LP85, LP80 are -1.19%, -0.89%, and 0.11%. As , the hyperparameter controlling the overall relevance, decreases, NumberPurchasesPerConsumer drops as well while RevenuePerConsumer increases. Additionally, we plot the comparison of these metrics with the error bar in Figure 3.
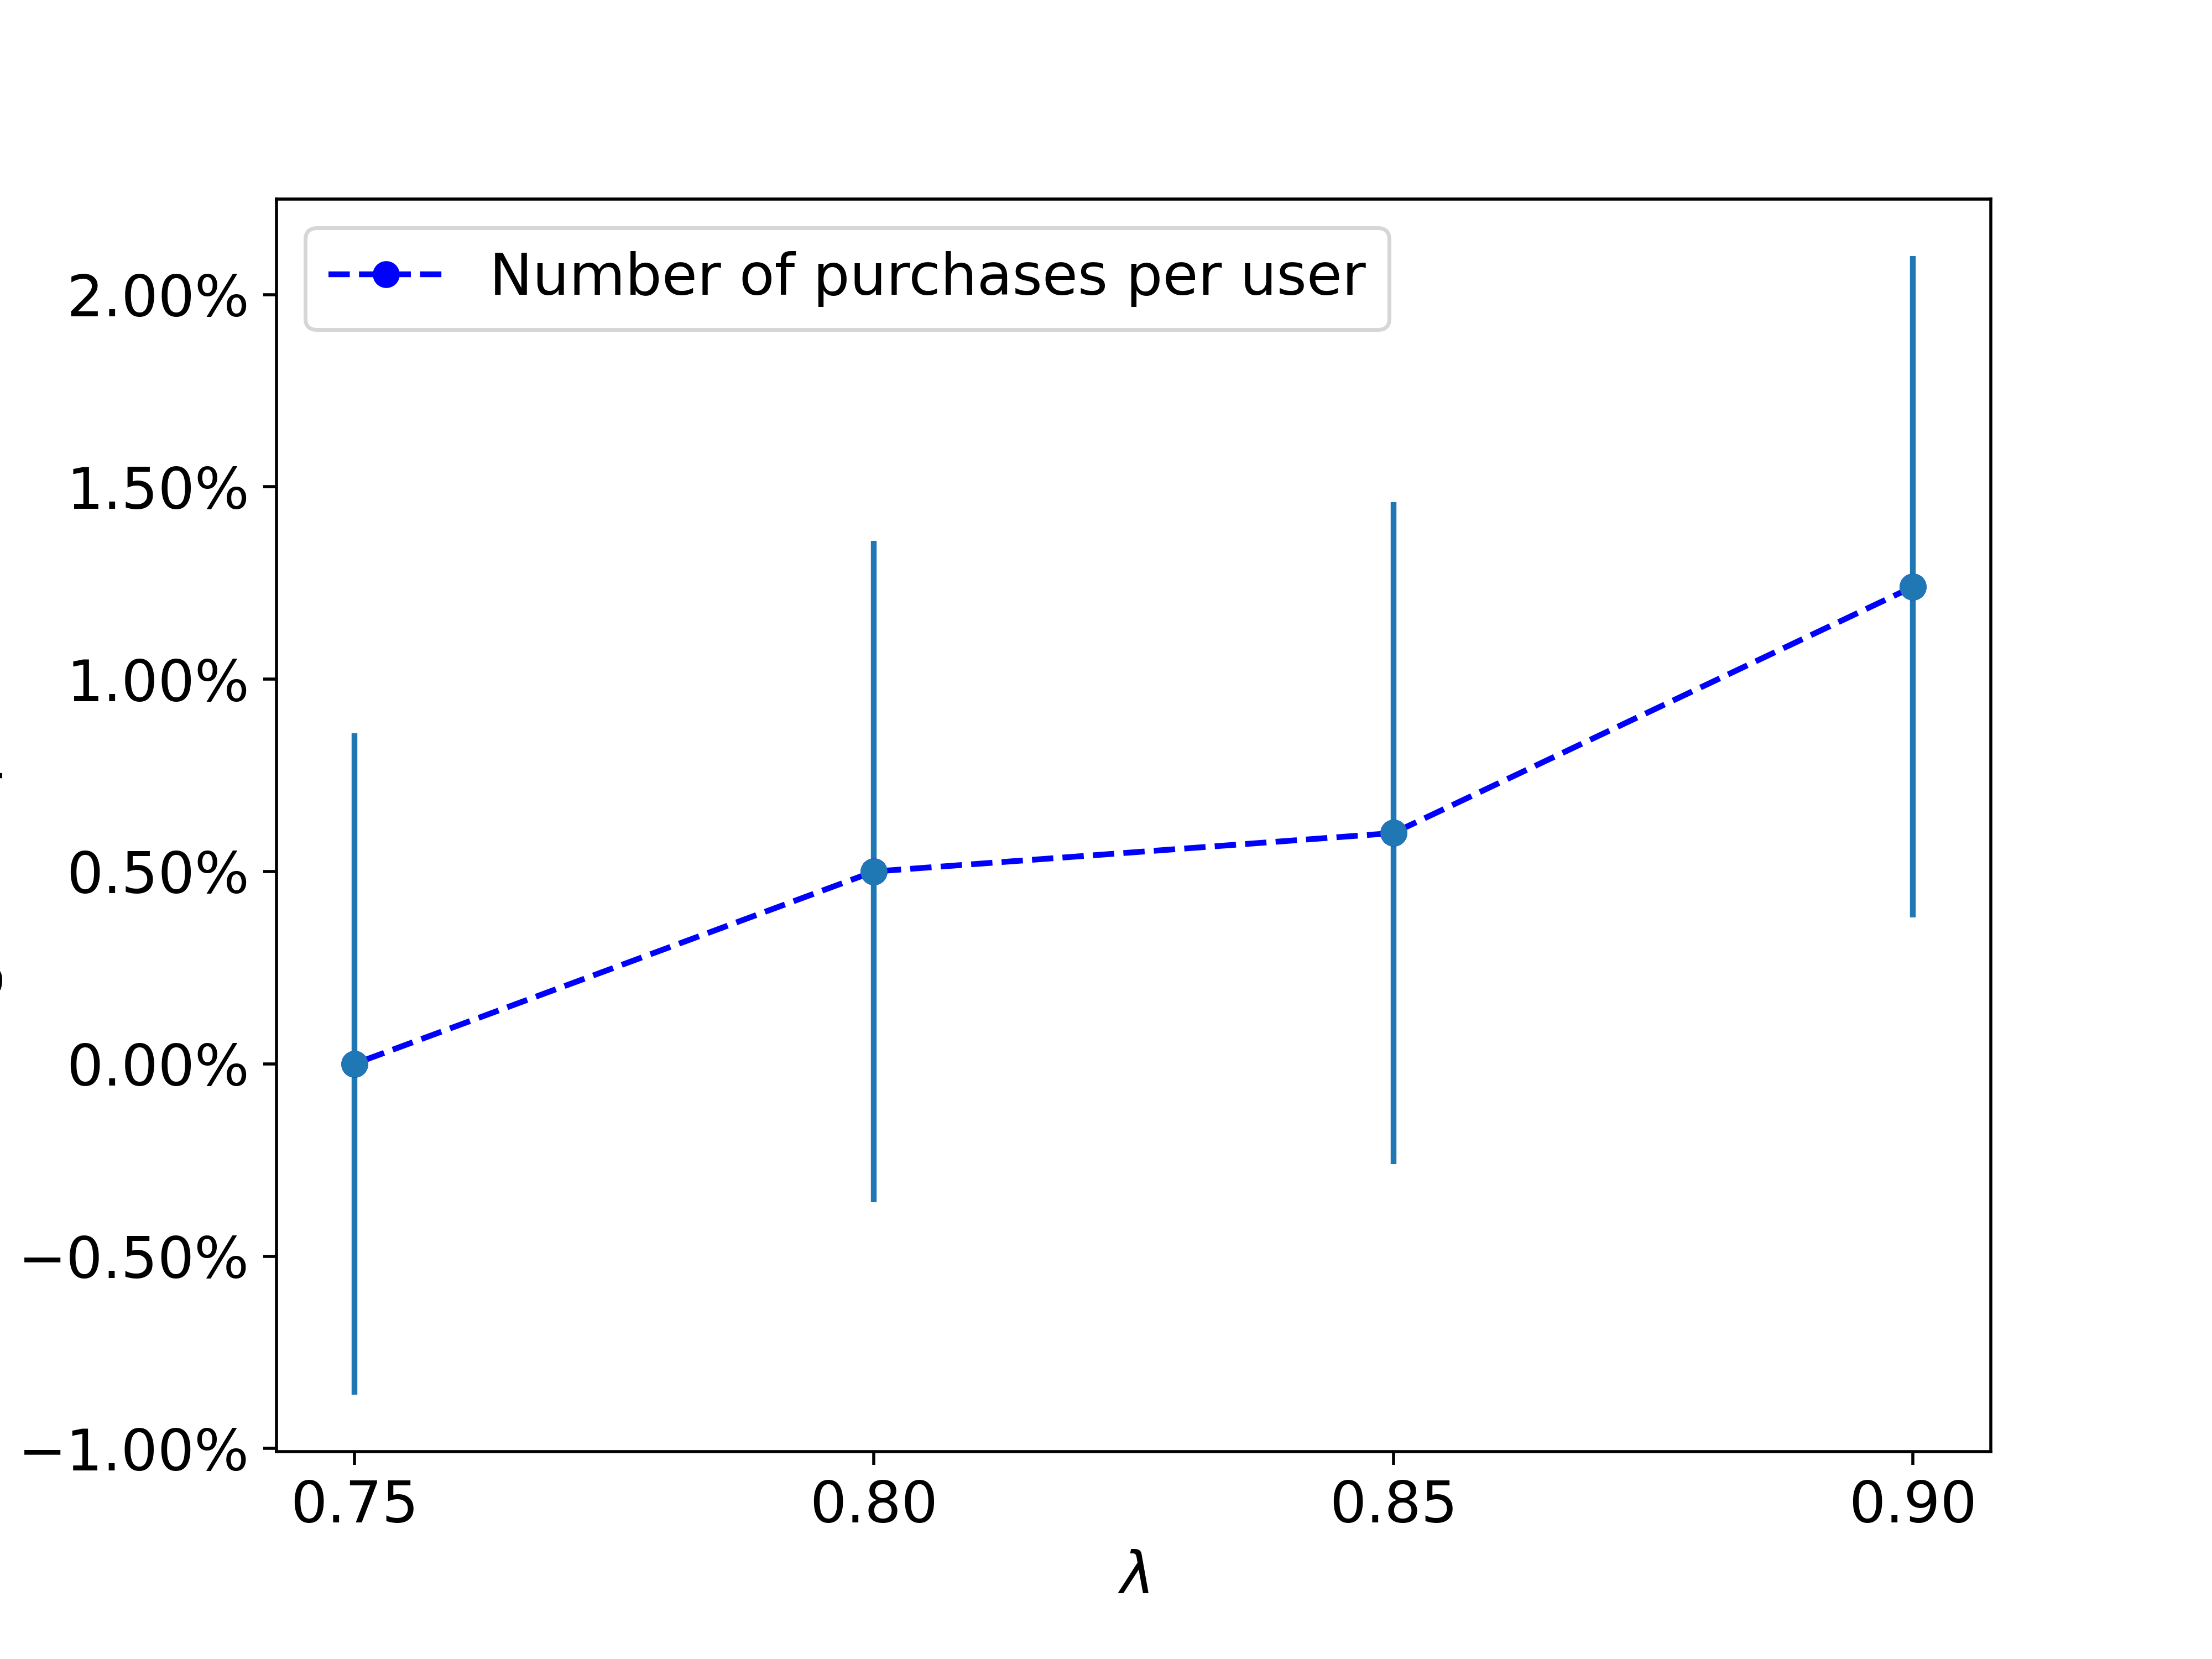
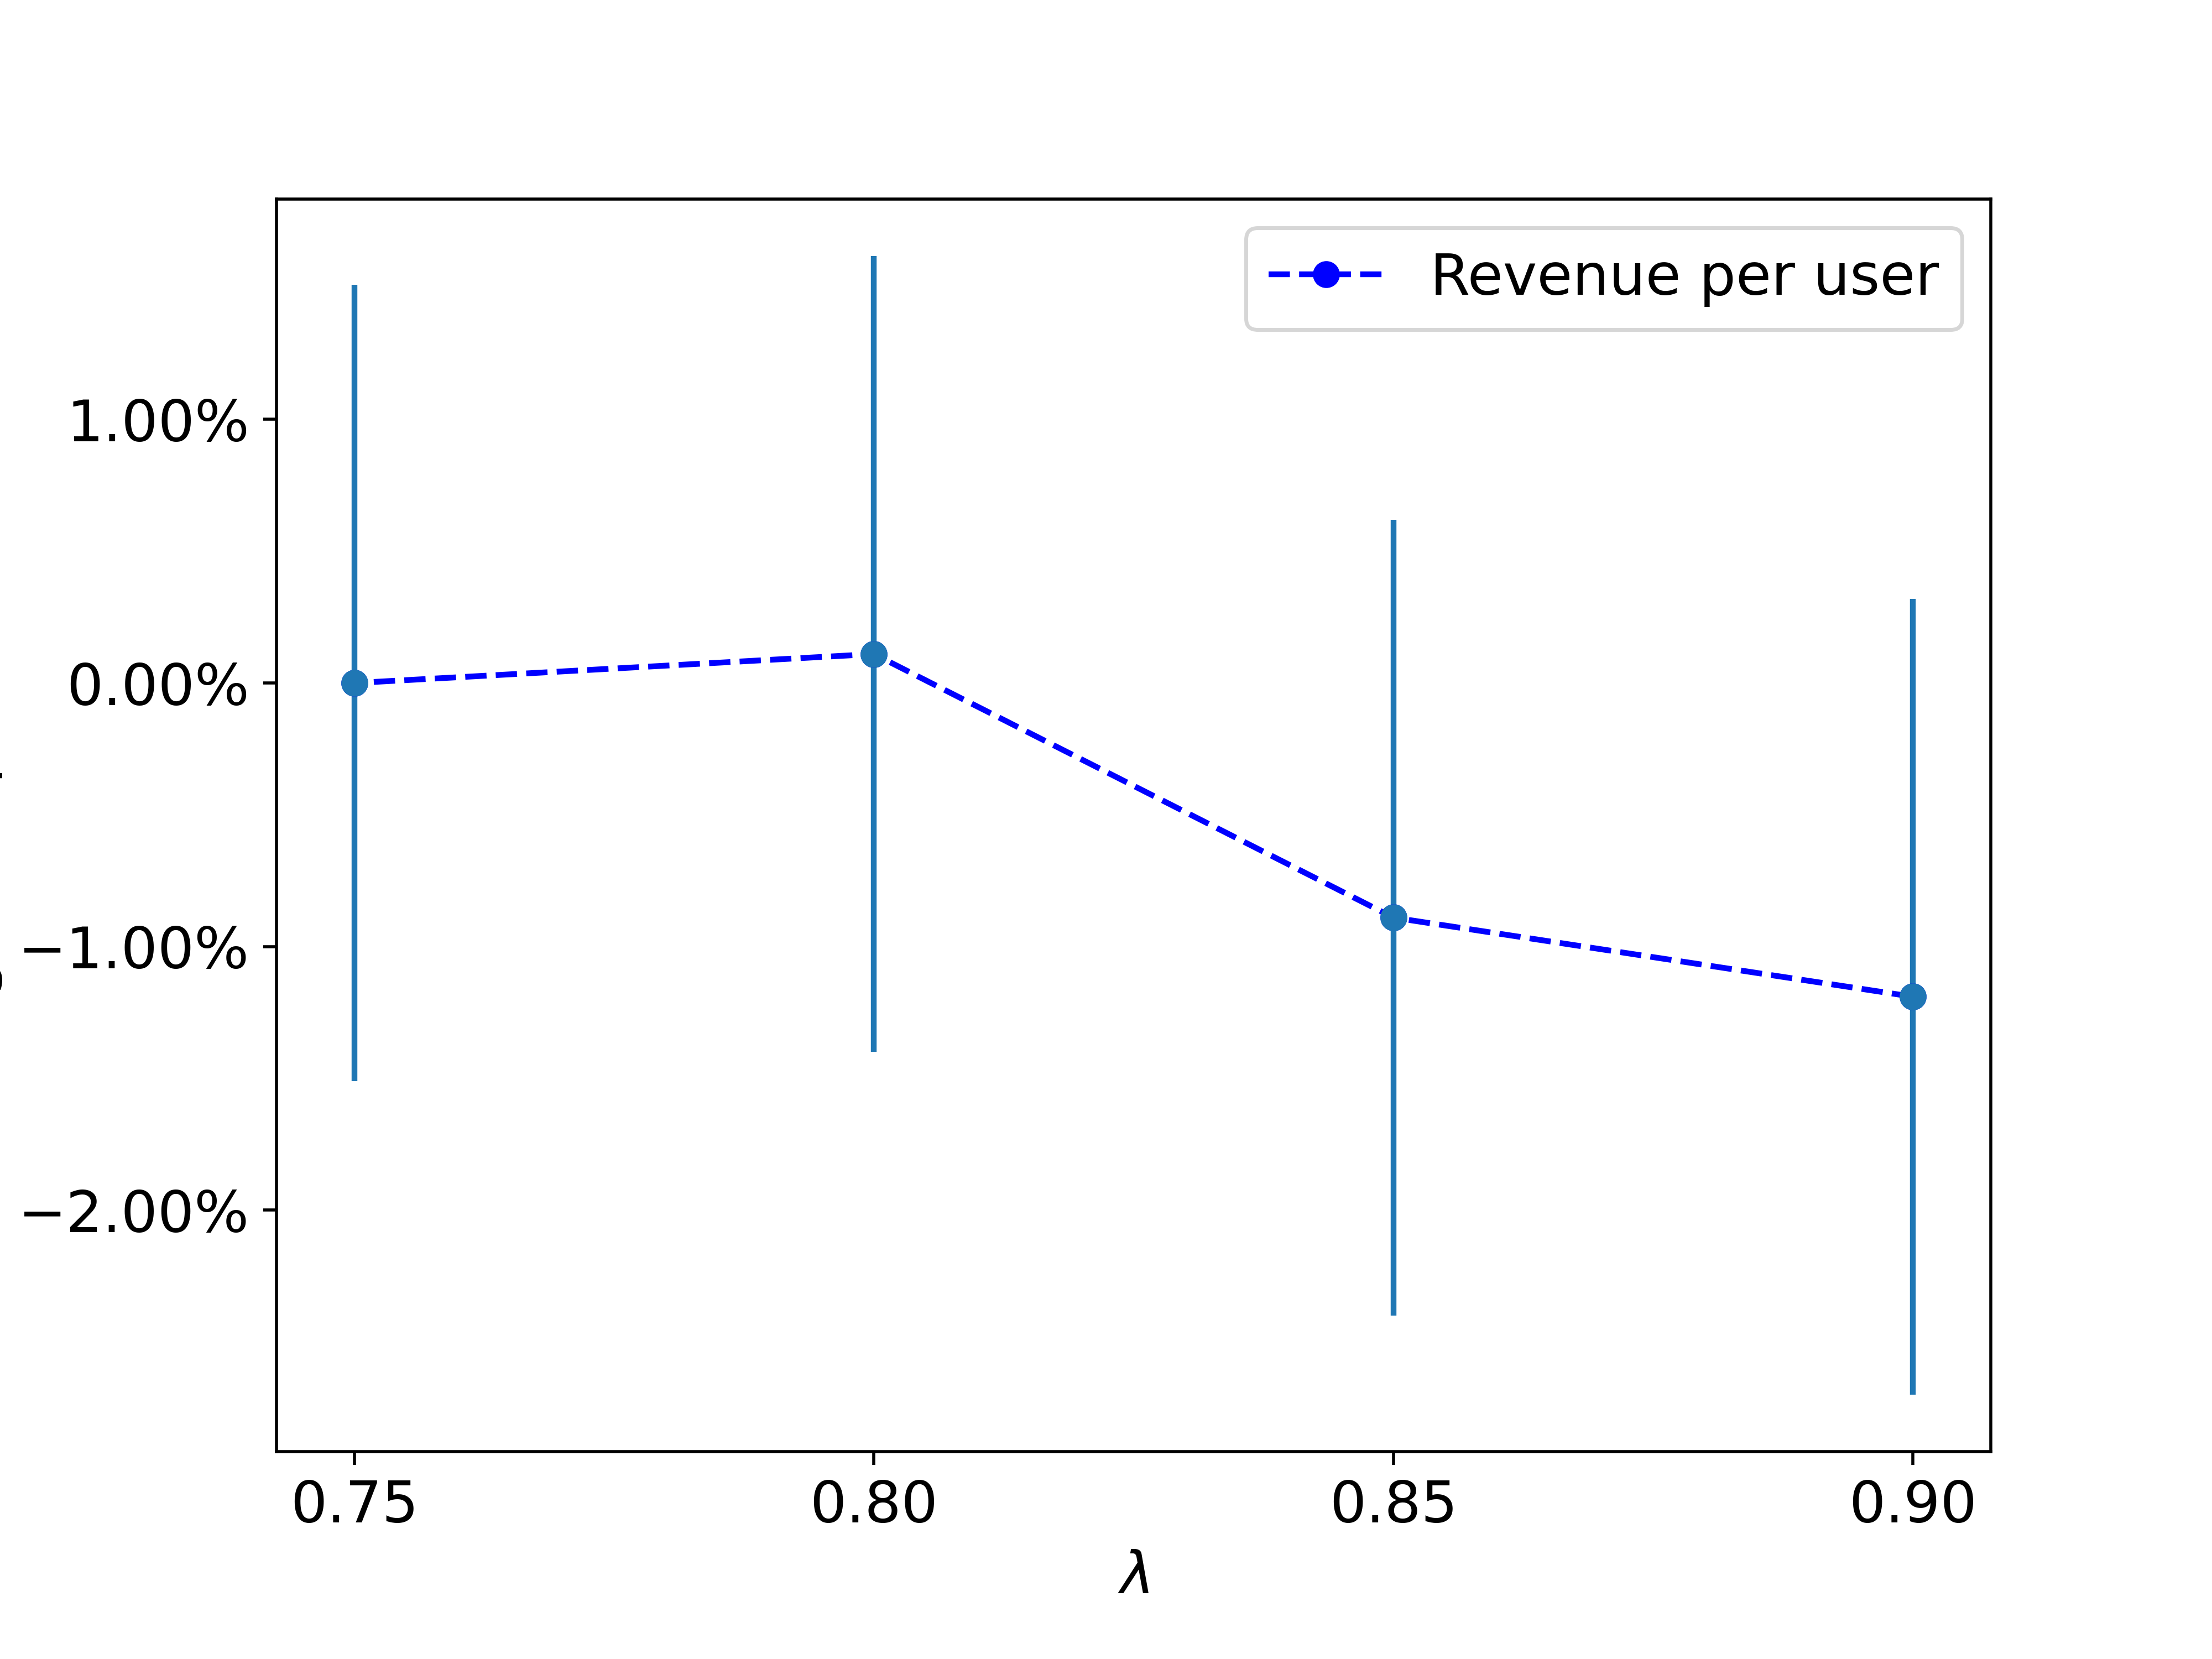
| LP90 | LP85 | LP80 | |
|---|---|---|---|
| RevenuePerConsumer (USD) (p-value) | -1.19% (0.12) | -0.89% (0.25) | 0.11% (0.89) |
| NumberPurchasesPerConsumer (p-value) | 1.24% (<0.01) | 0.60% (0.167) | 0.50% (0.25) |
-
•
Notes. Most of the demonstrated p-values above do not display evidence for significant differences. The reason for that is largely attributed to the lack of data samples. The closer the mean of the two groups, the larger the amount of samples we would require to show the statistically significant differences. In practice, an A/B test would only run for at most two weeks, not being able to generate enough amount of samples. Nevertheless, instead of focusing on hypothesis testing, the purpose of this experiment is to explore the trade-off of the performances for different groups by changing the hyperparameter .
6 Extension: Overall planning
In practice, there may be additional requirements from marketplaces and/or customers. For instance, (1) some marketplaces would like to pose constraints such as inventory limits or targeted revenue for each seller or product category, and (2) some consumers way prefer the diversity of items shown to them. These global constraints involve many impressions over a period; thus, we call it overall planning. Unfortunately, there is no guarantee that a score-based algorithm can satisfy such constraints because a score-based algorithm takes greedy operations for local objectives. On the other hand, these constraints can be naturally incorporated into an LP-based algorithm, as described below.
6.1 LP-based algorithm for overall planning
The basic idea is to utilize historical data to obtain corresponding dual variables (i.e., reduced costs) associated with the overall planning constraints and then utilize these dual variables in the online LP-based ranking.
Step 1: Obtain dual variables for global constraints Given a historical dataset that records the impressions for each day, suppose there are impressions, unique consumers, and a group of selected sellers who pay additional Ad fees and accordingly pose requirements on inventory and revenue. For each impression , it has slots and candidate items. Let denote the associated position weight for each slot , revenue and relevance for each candidate item . Similar to the previous setting, for each impression , we can get the maximum relevance score that any ranking can obtain, and define any relevance hyperparameter .
For a selected seller , there is an inventory limit , and a target revenue within a time period (usually a day). We consider the following overall planning constraints: (i) from the perspective of market fairness, the online marketplace does not interfere with the number of items a single seller could display to a single consumer ; (ii) for each consumer , she would prefer candidate items from various diverse sellers instead of a few who have paid high Ad fees. Therefore, we would set up a lower bound of the total of sellers whose items are displayed to her, denoted by . (iii) After paying an extra Ad rate, the seller would want to display his items to at least number of consumers. We would highlight that any combination of these constraints (even some similar constraints) can be incorporated into this algorithmic framework.
Suppose we have impressions in the historical data, indexed by ,i.e., . We select unique sellers, indexed by , and unique consumers, indexed by . Each consumer has total impressions. Moreover, among these impressions, the candidate items are provided by sellers.
Using historical data, we can obtain the optimal ranking with overall constraints (i), (ii), (iii) by solving the following LP:
| (16) | ||||
| s.t. | (17) | |||
| (18) | ||||
| (19) | ||||
| (20) | ||||
| (21) | ||||
| (22) | ||||
| (23) | ||||
| (24) |
where (17) associates with the relevance constraint, (18) associates with the inventory limit constraint, (19) associates with the revenue constraint, (20) associates with the minimum seller constraint, and (21) associates with the minimum consumer constraint.
Notice that the above LP could be large in terms of the size of the decision variable and the number of constraints, therefore we cannot solve it in real time. Instead, we can collect the data from the last time period and solve the above offline LP. Then, we obtain the optimal dual variables (inventory limit constraint (18)), (the revenue constraint (19)), (the minimum seller constraint (20)), and (minimum consumer constraint (21)).
Later, for each incoming impression induced by consumer , we can modify the previous LP problem proposed in by adding extra terms associated with to the objective function. The modified LP problem is illustrated in below:
| s.t. | |||
Notice that the LP formulation can be huge in practice. We present numerical experiments on solving such problems with the recent development of solvers in the next section, which demonstrates the traceability of this approach.
6.2 Computational results for overall planning
In this section, we present the experiment results for the overall planning problem from Section 6. The overall planning is formalized as a large-scale problem using the data from a certain period; therefore, it can only be solved offline. Therefore, in this experiment, we formulate the optimization problem using the historical data of an entire day. Specifically speaking, we would set up the restrictions on the existing inventory and the targeted revenue for the selected top sellers who have the most listed items. In total, we filter out 5,408 sellers and formulate an optimization problem with 265,646,022 variables, 26,423,572 constraints, and 962,620,739 non-zeros. We use two solvers, which are Gurobi (version 9.0) and OR-Tools 333https://developers.google.com/optimization/lp/lp_advanced, and compare their performances in terms of the solving time, number of iterations, and minimum memory spaces required.
Currently, Gurobi adopts three widely-used methods to solve the LP problem, which are respectively primal simplex, dual simplex, and barrier. For OR-Tools, we choose the method of Practical Large-Scale Linear Programming using Primal-Dual Hybrid Gradient (PDLP) (Applegate et al.,, 2021, 2023, 2024), which specializes in solving large-scale LP problems efficiently. Thus, in this experiment, we incorporate four groups (Primal Simplex, Dual Simplex, Barrier, and PDLP) in total, and compare the performance of PDLP to all other groups. For these experiment groups, under different cores and threads, we evaluate their performance in terms of the solving time. Similar to the previous section, we implement this experiment with the Dell PowerEdge R640 computing node. It is noted that in our case, due to the restricted computing resources, the upper limit of the running time is set to be 48 hours ( seconds).
| Solving method | PDLP | Barrier | Primal simplex | Dual simplex |
|---|---|---|---|---|
| Number of threads | 4 | 4 | 1* | 1* |
| Able to solve the problem correctly? | Yes | Yes | Yes | No |
| Average solving time (sec) | 27,458 | 56,236 | 171,396 | ** |
| Number of iterations | 3,328 | 208 | 206 | ** |
| Ratio of cases reaching the time limit | 0 | 0 | 80%*** | ** |
-
•
Notes. In total, the problem contains 265,646,022 variables, 26,423,572 constraints, and 962,620,739 non-zeros. We run each experiment with the same settings 5 times and take the average of each metric to report. In cases where the solving time limit is reached before the solution is given, we use the time limit(172,800 seconds) as its solving time in terms of calculating the average solving time.
-
•
* For Primal and Dual simplex methods, Gurobi only allows 1 thread to solve the problem, which cannot be altered.
-
•
** Dual simplex fails to give the correct solution, of which the metrics will not be reported.
-
•
*** Only 1 out of 5 instances finished solving within the time limit.
Out of four groups, we first find that Gurobi Dual simplex method fails to deliver the correct solution due to the numerical sensitivity caused by the excessively large number of variable coefficients, and Gurobi Primal simplex reach the time limit for four out of the five runs. Both PDLP and Gurobi Barrier can solve the problem, while PDLP is averagingly twice as fast as Gurobi Barrier. This demonstrates that solving the huge-scale overall planning problem with the LP-based method is tractable with modern computing architectures and optimization solvers.
7 Conclusion
In this paper, we present a comprehensive field study on using LP-based algorithms in sponsored listing. The results demonstrate the power of LP-based algorithms in improving all major metrics compared to the traditional score-based algorithm. To enable the use of LP-based algorithms, we present an efficient dual-based algorithm that can satisfy the strict latency requirement. We further demonstrate the flexibility of the LP-based methods in incorporating overall planning constraints. Note that score-based algorithms are the golden standard in the industry for sponsored listing and other ranking problems; this work can provide empirical evidence for marketplaces to implement LP-based algorithms.
References
- Adomavicius and Kwon, (2014) Adomavicius, G. and Kwon, Y. (2014). Optimization-based approaches for maximizing aggregate recommendation diversity. INFORMS Journal on Computing, 26(2):351–369.
- Agarwal et al., (2011) Agarwal, D., Chen, B.-C., Elango, P., and Wang, X. (2011). Click shaping to optimize multiple objectives. In Proceedings of the 17th ACM SIGKDD international conference on Knowledge discovery and data mining, pages 132–140.
- Amatriain, (2013) Amatriain, X. (2013). Big & personal: data and models behind netflix recommendations. In Proceedings of the 2nd international workshop on big data, streams and heterogeneous source Mining: Algorithms, systems, programming models and applications, pages 1–6.
- Applegate et al., (2021) Applegate, D., Díaz, M., Hinder, O., Lu, H., Lubin, M., O’Donoghue, B., and Schudy, W. (2021). Practical large-scale linear programming using primal-dual hybrid gradient. Advances in Neural Information Processing Systems, 34:20243–20257.
- Applegate et al., (2024) Applegate, D., Díaz, M., Lu, H., and Lubin, M. (2024). Infeasibility detection with primal-dual hybrid gradient for large-scale linear programming. SIAM Journal on Optimization, 34(1):459–484.
- Applegate et al., (2023) Applegate, D., Hinder, O., Lu, H., and Lubin, M. (2023). Faster first-order primal-dual methods for linear programming using restarts and sharpness. Mathematical Programming, 201(1):133–184.
- Asadpour et al., (2023) Asadpour, A., Niazadeh, R., Saberi, A., and Shameli, A. (2023). Sequential submodular maximization and applications to ranking an assortment of products. Operations Research, 71(4):1154–1170.
- Bhalgat et al., (2012) Bhalgat, A., Feldman, J., and Mirrokni, V. (2012). Online allocation of display ads with smooth delivery. In Proceedings of the 18th ACM SIGKDD international conference on Knowledge discovery and data mining, pages 1213–1221.
- Caro and Gallien, (2007) Caro, F. and Gallien, J. (2007). Dynamic assortment with demand learning for seasonal consumer goods. Management science, 53(2):276–292.
- Cattrysse and Van Wassenhove, (1992) Cattrysse, D. G. and Van Wassenhove, L. N. (1992). A survey of algorithms for the generalized assignment problem. European journal of operational research, 60(3):260–272.
- Celis et al., (2017) Celis, L. E., Straszak, D., and Vishnoi, N. K. (2017). Ranking with fairness constraints. arXiv preprint arXiv:1704.06840.
- Chen et al., (2024) Chen, G., Chan, T., Zhang, D., Liu, S., and Wu, Y. (2024). The effects of diversity in algorithmic recommendations on digital content consumption: A field experiment. Available at SSRN 4365121.
- Chen et al., (2011) Chen, Y., Berkhin, P., Anderson, B., and Devanur, N. R. (2011). Real-time bidding algorithms for performance-based display ad allocation. In Proceedings of the 17th ACM SIGKDD international conference on Knowledge discovery and data mining, pages 1307–1315.
- Cheng et al., (2016) Cheng, H.-T., Koc, L., Harmsen, J., Shaked, T., Chandra, T., Aradhye, H., Anderson, G., Corrado, G., Chai, W., Ispir, M., et al. (2016). Wide & deep learning for recommender systems. In Proceedings of the 1st workshop on deep learning for recommender systems, pages 7–10.
- Covington et al., (2016) Covington, P., Adams, J., and Sargin, E. (2016). Deep neural networks for youtube recommendations. In Proceedings of the 10th ACM conference on recommender systems, pages 191–198.
- Feldman et al., (2022) Feldman, J., Zhang, D. J., Liu, X., and Zhang, N. (2022). Customer choice models vs. machine learning: Finding optimal product displays on alibaba. Operations Research, 70(1):309–328.
- Ferreira et al., (2022) Ferreira, K. J., Parthasarathy, S., and Sekar, S. (2022). Learning to rank an assortment of products. Management Science, 68(3):1828–1848.
- Gallego et al., (2004) Gallego, G., Iyengar, G., Phillips, R., and Dubey, A. (2004). Managing flexible products on a network. Available at SSRN 3567371.
- Gallego et al., (2020) Gallego, G., Li, A., Truong, V.-A., and Wang, X. (2020). Approximation algorithms for product framing and pricing. Operations Research, 68(1):134–160.
- Gallego et al., (2015) Gallego, G., Ratliff, R., and Shebalov, S. (2015). A general attraction model and sales-based linear program for network revenue management under customer choice. Operations Research, 63(1):212–232.
- Gallego et al., (2019) Gallego, G., Topaloglu, H., et al. (2019). Revenue management and pricing analytics, volume 209. Springer.
- Ge et al., (2020) Ge, Z., Zhou, W., Lute, J., and Ilardi, A. (2020). Relevance constrained re-ranking in sponsored listing recommendations.
- Geyik et al., (2019) Geyik, S. C., Ambler, S., and Kenthapadi, K. (2019). Fairness-aware ranking in search & recommendation systems with application to linkedin talent search. In Proceedings of the 25th acm sigkdd international conference on knowledge discovery & data mining, pages 2221–2231.
- Ghose et al., (2014) Ghose, A., Ipeirotis, P. G., and Li, B. (2014). Examining the impact of ranking on consumer behavior and search engine revenue. Management Science, 60(7):1632–1654.
- Hu et al., (2018) Hu, Y., Da, Q., Zeng, A., Yu, Y., and Xu, Y. (2018). Reinforcement learning to rank in e-commerce search engine: Formalization, analysis, and application. In Proceedings of the 24th ACM SIGKDD international conference on knowledge discovery & data mining, pages 368–377.
- Jiang et al., (2020) Jiang, Z. Z., Li, J., and Zhang, D. (2020). A high-dimensional choice model for online retailing. Jun and Zhang, Dennis, A High-Dimensional Choice Model for Online Retailing (September 6, 2020).
- Karp et al., (1990) Karp, R. M., Vazirani, U. V., and Vazirani, V. V. (1990). An optimal algorithm for on-line bipartite matching. In Proceedings of the twenty-second annual ACM symposium on Theory of computing, pages 352–358.
- Kök et al., (2009) Kök, A. G., Fisher, M. L., and Vaidyanathan, R. (2009). Assortment planning: Review of literature and industry practice. Retail supply chain management: Quantitative models and empirical studies, pages 99–153.
- Li et al., (2016) Li, B., Tang, K., Li, J., and Yao, X. (2016). Stochastic ranking algorithm for many-objective optimization based on multiple indicators. IEEE Transactions on Evolutionary Computation, 20(6):924–938.
- Li et al., (2021) Li, X., Rong, Y., Zhang, R., and Zheng, H. (2021). Online advertisement allocation under customer choices and algorithmic fairness.
- Lin et al., (2019) Lin, X., Chen, H., Pei, C., Sun, F., Xiao, X., Sun, H., Zhang, Y., Ou, W., and Jiang, P. (2019). A pareto-efficient algorithm for multiple objective optimization in e-commerce recommendation. In Proceedings of the 13th ACM Conference on recommender systems, pages 20–28.
- Liu et al., (2015) Liu, Q., Yu, F., Wu, S., and Wang, L. (2015). A convolutional click prediction model. In Proceedings of the 24th ACM international on conference on information and knowledge management, pages 1743–1746.
- Louca et al., (2019) Louca, R., Bhattacharya, M., Hu, D., and Hong, L. (2019). Joint optimization of profit and relevance for recommendation systems in e-commerce. In RMSE@ RecSys.
- Luce, (2005) Luce, R. D. (2005). Individual choice behavior: A theoretical analysis. Courier Corporation.
- Manmatha et al., (2001) Manmatha, R., Rath, T., and Feng, F. (2001). Modeling score distributions for combining the outputs of search engines. In Proceedings of the 24th annual international ACM SIGIR conference on Research and development in information retrieval, pages 267–275.
- McFadden et al., (1973) McFadden, D. et al. (1973). Conditional logit analysis of qualitative choice behavior.
- Mehta et al., (2013) Mehta, A. et al. (2013). Online matching and ad allocation. Foundations and Trends® in Theoretical Computer Science, 8(4):265–368.
- Montague and Aslam, (2001) Montague, M. and Aslam, J. A. (2001). Relevance score normalization for metasearch. In Proceedings of the tenth international conference on Information and knowledge management, pages 427–433.
- Nishimura, (1989) Nishimura, K. G. (1989). Customer markets and price sensitivity. Economica, pages 187–198.
- Okura et al., (2017) Okura, S., Tagami, Y., Ono, S., and Tajima, A. (2017). Embedding-based news recommendation for millions of users. In Proceedings of the 23rd ACM SIGKDD international conference on knowledge discovery and data mining, pages 1933–1942.
- Pentico, (2007) Pentico, D. W. (2007). Assignment problems: A golden anniversary survey. European Journal of Operational Research, 176(2):774–793.
- Renda and Straccia, (2003) Renda, M. E. and Straccia, U. (2003). Web metasearch: rank vs. score based rank aggregation methods. In Proceedings of the 2003 ACM symposium on Applied computing, pages 841–846.
- Rodriguez et al., (2012) Rodriguez, M., Posse, C., and Zhang, E. (2012). Multiple objective optimization in recommender systems. In Proceedings of the sixth ACM conference on Recommender systems, pages 11–18.
- Ross and Soland, (1975) Ross, G. T. and Soland, R. M. (1975). A branch and bound algorithm for the generalized assignment problem. Mathematical programming, 8(1):91–103.
- Rusmevichientong et al., (2010) Rusmevichientong, P., Shen, Z.-J. M., and Shmoys, D. B. (2010). Dynamic assortment optimization with a multinomial logit choice model and capacity constraint. Operations research, 58(6):1666–1680.
- Rusmevichientong and Topaloglu, (2012) Rusmevichientong, P. and Topaloglu, H. (2012). Robust assortment optimization in revenue management under the multinomial logit choice model. Operations research, 60(4):865–882.
- Salkin and De Kluyver, (1975) Salkin, H. M. and De Kluyver, C. A. (1975). The knapsack problem: a survey. Naval Research Logistics Quarterly, 22(1):127–144.
- Sumida et al., (2021) Sumida, M., Gallego, G., Rusmevichientong, P., Topaloglu, H., and Davis, J. (2021). Revenue-utility tradeoff in assortment optimization under the multinomial logit model with totally unimodular constraints. Management Science, 67(5):2845–2869.
- Talluri and Van Ryzin, (2004) Talluri, K. and Van Ryzin, G. (2004). Revenue management under a general discrete choice model of consumer behavior. Management Science, 50(1):15–33.
- Xiao et al., (2017) Xiao, L., Min, Z., Yongfeng, Z., Zhaoquan, G., Yiqun, L., and Shaoping, M. (2017). Fairness-aware group recommendation with pareto-efficiency. In Proceedings of the eleventh ACM conference on recommender systems, pages 107–115.
- Ye et al., (2023) Ye, Z., Zhang, D. J., Zhang, H., Zhang, R., Chen, X., and Xu, Z. (2023). Cold start to improve market thickness on online advertising platforms: Data-driven algorithms and field experiments. Management Science, 69(7):3838–3860.
- Zehlike et al., (2022) Zehlike, M., Yang, K., and Stoyanovich, J. (2022). Fairness in ranking, part i: Score-based ranking. ACM Computing Surveys, 55(6):1–36.
- Zhang et al., (2018) Zhang, W., Wei, C., Meng, X., Hu, Y., and Wang, H. (2018). The whole-page optimization via dynamic ad allocation. In Companion Proceedings of the The Web Conference 2018, pages 1407–1411.
- Zhou et al., (2018) Zhou, G., Zhu, X., Song, C., Fan, Y., Zhu, H., Ma, X., Yan, Y., Jin, J., Li, H., and Gai, K. (2018). Deep interest network for click-through rate prediction. In Proceedings of the 24th ACM SIGKDD international conference on knowledge discovery & data mining, pages 1059–1068.