Toward a realistic model of multilayered bacterial colonies
Abstract
Bacteria are prolific at colonizing diverse surfaces under a widerange of environmental conditions, and exhibit fascinating examples of self-organization across scales. Though it has recently attracted considerable interest, the role of mechanical forces in the collective behavior of bacterial colonies is not yet fully understood. Here, we construct a model of growing rod-like bacteria, such as Escherichia coli based purely on mechanical forces. We perform overdamped molecular dynamics simulations of the colony starting from a few cells in contact with a surface. As the colony grows, microdomains of strongly aligned cells grow and proliferate. Our model captures both the initial growth of a bacterial colony and also shows characteristic signs of capturing the experimentally observed transition to multilayered colonies over longer timescales. We compare our results with experiments on E. coli cells and analyze the statistics of microdomains.
Key words: bacteria, active matter, orientational order, geometry, mechanics, mono-to-multilayer transition
Abstract
Бактерiї продуктивно колонiзують рiзноманiтнi поверхнi в широкому дiапазонi умов навколишнього середовища. Вони демонструють захоплюючi приклади самоорганiзацiї на рiзних масштабах. Незважаючи на те, що роль механiчних сил у колективнiй поведiнцi бактерiальних колонiй вивчається протягом тривалого часу, вона ще не повнiстю зрозумiла. У данiй роботi ми розглядаємо модель росту паличкоподiбних бактерiй, таких як Escherichia coli, засновану виключно на механiчних силах. Ми виконуємо моделювання колонiї методом сильно демпфованої молекулярної динамiки, починаючи з кiлькох клiтин, якi контактують iз поверхнею. У мiру зростання колонiї мiкроскупчення сильно впорядкованих клiтин ростуть i розмножуються. Наша модель вiдслiдковує як початковий рiст бактерiальної колонiї, так i демонструє багатообiцяючi ознаки фiксацiї експериментально спостережуваного переходу до багатошарових колонiй протягом бiльш тривалого перiоду часу. Ми порiвнюємо нашi результати з експериментами на клiтинах E. coli та аналiзуємо статистику мiкродоменiв.
Ключовi слова: бактерiї, активне середовище, орiєнтацiйний порядок, геометрiя, механiка, перехiд з одно- до багатошарового стану
1 Introduction
Microbial life in general exists not as cells freely floating in an aqueous environment (planktonic state), but rather as sessile, surface associated colonies [1]. These sessile, self-organized communities often develop into biofilms, defined as matrix-enclosed colonies adhering to each other and/or to surfaces [1, 2]. This matrix, called extracellular polymeric substances (EPS), is composed of biopolymers, nucleic acids, and lipids which produce cohesion of the biofilm, adhesion to the substrate, and a number of protective functions [3]. Starting from the initial attachment, followed by the growth, proliferation, and ultimately colonization, biofilms represent self-regulated active microbial communities where an interplay of geometry, order and growth-mediated mechanics determine their emerging structure and topology [4, 5, 6, 7, 8, 9, 10]. From dental surfaces and open wounds, cancer and gut environments to the biological growth observed on maritime structures (biofouling), biofilms can grow and thrive under diverse settings, thereby regulating infectious diseases and human health, as well as determining the durability of maritime vessels [11] and medical devices such as intravenous catheters, prosthetic heart valves, joint prostheses, peritoneal dialysis catheters, and cardiac pacemakers [12]. Importantly, biofilms can also impact the respiratory mucous and the airways of patients with cystic fibrosis, thus regulating patient health and response to medical treatment [13]. Because of the specificity of the physical and biological interactions among its constituent cells, biofilms are often considered an emergent form of microbial life, as the properties and function of biofilms may outperform those of the constituent cells [12].
The first step in the development of a biofilm is the growth of a colony of cells multiplying on a substrate, initially at an exponential rate, until nutrient limitations cause a plateauing of the colony size. In this initial phase of rapid expansion, biofilms self-organize into monolayers wherein contact forces between neighboring cells and with the substrate play a prominent role [14, 15]. These contact forces lead to an orientational transition reminiscent of liquid-crystalline phase transitions. As the degree of confinement decreases, rod-like cells transition from a long-ranged nematic state to a globally disordered state characterized by microdomains with short-range nematic order [16, 17, 18, 14].
Considerable work has focused on the transition from a two-dimensional monolayer of cells to a three-dimensional (3D) biofilm. A crucial step in the development of a 3D structure is the verticalization of cells [19, 15], where the growth of mechanical stresses among the growing cells leads to a buckling instability that turns some cells away from a planar configuration parallel to the substrate [15].
Recent work has shown that, following verticalization, the second layer spreads over the first layer, and thereafter the third layer starts to develop on the second layer and so on [20]. Over time, this monolayer stacking process leads to the 3D morphology of the bacterial colony emerging from multiple flat layers of dividing cells parallel to the underlying flat substrate. Developing a model for this monolayer stacking transition is the main goal of this work.
2 Bacterial model
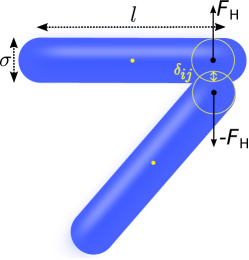
We model each bacterial cell as a spherocylinder [21] of length , depending on time , and diameter capped at both ends by hemispheres of the same diameter . Each cell is described by the vector to its center-of-mass position and a unit vector for its orientation . In the overdamped limit, the equations of motion read
| (2.1) | ||||
| (2.2) |
where and are characteristic translational and rotational drag coefficient, respectively, is the identity matrix [22]. In equations (2.1)–(2.2) represents a constant adhesion force applied to center of each rod and is a restoring torque that returns our rods to planar alignment, respectively, and is the unit vector normal to the substrate. Both and physically stem from the adhesive forces within the EPS matrix produced by and surrounding the cells. Additionally, to model thermal fluctuations, we include a small fluctuating torque with amplitude .
In equation (2.1), , where , and is the distance between the center of the cells; represents a Hertzian repulsion force between overlapping spherocylinders with cell stiffness (dependent on Young’s modulus) [23, 19]; this repulsion is calculated by means of virtual spheres of diameter centered at the closest points between the axes of spherocylinders so that the cylinders are in contact whenever the distance between the centers of the virtual spheres is such that . The smallest distance between two spherocylinders is computed using the algorithm by Vega and Lago [24]. The substrate also exerts a Hertzian repulsion , where is the overlap of the spherocylinder with the solid substrate. In equation (2.2), , where is the vector to the contact point.
We use the following potentials to model the cell-cell interaction acting between each bacterium and their neighboring cells and the cell-substrate potential with the confining surface [22]
| (2.3) |
In equation (2.3), represents a short-range cell-cell attraction with relative strength , where is the attraction position, the width of the potential [22], whereas represents the attraction between cell and substrate modelled through a Yukawa-like potential with , where is the depth of Yukawa potential, is the relative distance between cell and substrate, and is the position of the substrate in our simulations.
Bacterial cell proliferation is the driving force underpinning mechanical interactions in a colony [25, 26, 27]. Away from division events, the cell length growth obeys a linear law (with coefficient ) modified to include a mechanoresponse of the cell to the growing pressure exerted by other cells due to proliferation stresses
| (2.4) |
A cell divides when it reaches a split length , a small random offset in the daughter cells’ length is also used. In equation (2.4), is a growth rate constant. It has been observed that when colonies grow, the increasing pressure exerted by each cell on its neighbors leads to a slowdown in the cell length growth, akin to a contact inhibition [23, 25]; the term in square brackets is a sigmoid function that models such mechanoresponse to the growing pressure, where represents a scale parameter regulating the steepness of this mechanoresponse, is the total overlap between a cell and its neighbors, and is the inflection point of this dependence. To avoid artificial synchronization effects in cell divisions across the colony, when a cell divides, the two daughter cells differ in length by a random amount with maximum amplitude.
Figure 1 shows a schematic illustration of two spherocylinders; the thin yellow circles represent the virtual spheres used to compute the overlap and the Hertzian repulsion between the bacterial cells. We perform molecular dynamics simulations using an Euler integration scheme with a time step .
3 Results and discussion
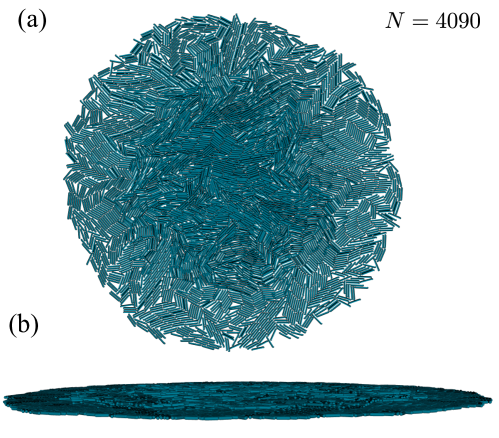
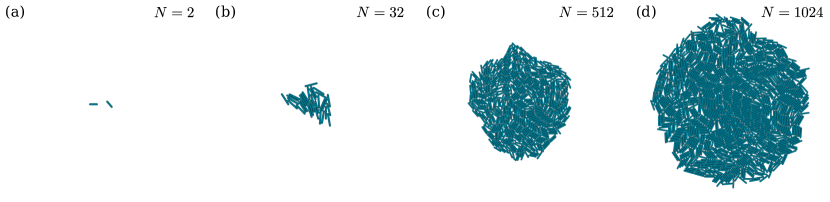
Figure 2 shows a sequence of snapshots from a simulated colony growing from a starting configuration of two randomly oriented cells that, after a number of cycles of growth and division reaches a maturation stage comprising multiple layers [15]. In agreement with experimental evidence [28, 29], the colony initially grows as a flat, circular monolayer. We note that our simulations reproduce the tangential alignment of cells at the outer edge of the colony. This is due to the fact that a tangentially-oriented rod is mechanically stable to the forces of neighboring cells, whose torques cancel out statistically [28].
As the colony grows, the mechanical stresses mutually exerted on the cells increase, until a threshold value is met and the verticalization transition is crossed [19], resulting in the extrusion of some cells from the initial monolayer. Figure 2(d) shows that some cells have formed the seeds of a flat, second layer, growing directly on top of the initial layer with all cells aligned parallel to the underlying substrate [20]. Figure 3 shows the configuration of a colony which has developed a large second layer, visible from the central darker region in figure 3(a) and from the edge-view in figure 3(b).
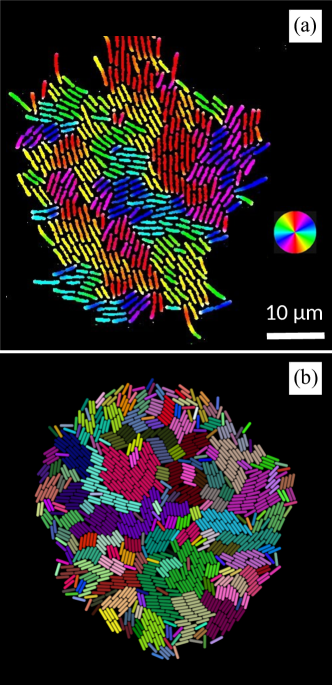
Close inspection of the colonies reveals that neighboring cells exhibit a large degree of local alignment. Microdomains, best captured in bacterial monolayers, are defined as clusters of cells that display a large local nematic order parameter [14]. Figure 4(a) shows a micrograph of bacterial colony captured experimentally, using E. coli (strain C600-WT) bacteria grown on nutrient-rich agar surface. The non-motile strain of E. coli bacteria were grown at around 30℃, showing a doubling time of approximately 40 minutes. The duration of our experiments were short enough (up to a few hours), ensuring that the expanding monolayers remained nutrient-replete throughout the observation time-scale. The growth of a single bacterium into bacterial monolayers was imaged using time-lapse microscopy (phase contrast mode), acquiring images at 5 minute intervals. Initially, the colony expanded as a monolayer (2D), spanning multiple generations, before extruding into the third dimension to reach a complex 3D structure. The color coding shows that a large degree of local nematic order is present in the monolayer system, and the local orientation can be used to define microdomains. As can be observed in Figure 4(a, b), the intersection of three or more nematic microdomains (i.e., intersection of three or more colored clusters), typically represents topological defect sites [30], the dynamics of which have been discussed in detail elsewhere [6, 20].
In order to investigate more closely the presence of microdomains, we employ a density-based clustering algorithm. We consider two cells to belong to the same cluster if the angle between their orientations and their center-of-mass distance . Using these metrics, we use the density-based spatial clustering of applications with noise (DBSCAN) algorithm [31]. Figure 4(b) shows the results of the DBSCAN cluster analysis on a representative model colony. Similarly to the experimental results, there is a broad distribution of microdomains, differing in size and detailed morphology. Both simulated and experimental microdomains display a large local nematic order and also large local smectic order [32, 33] (though the latter is less pronounced in the experiments, due to the intrinsic biological variability of the cell properties).
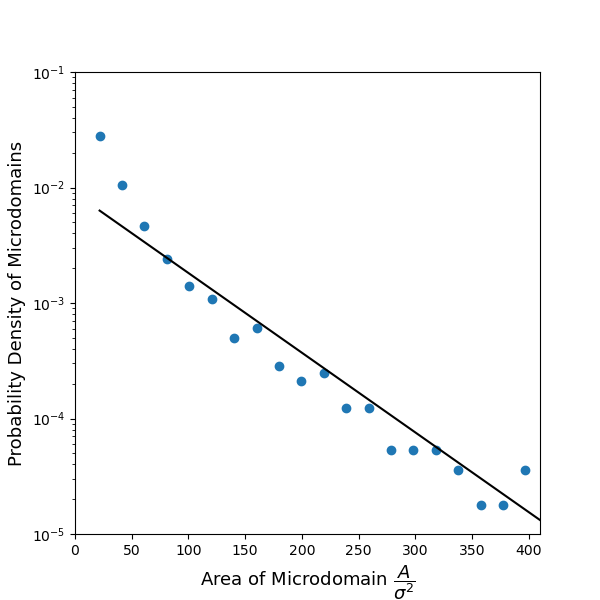
Figure 5 shows the probability distribution of the microdomains’ area resulting from the clustering analysis described above and averaged over 39 independent simulations. Our simulations show an exponential distribution in agreement with experimental measurements [14]; furthermore, our estimate for the characteristic domain area , which implies that the typical size of these microdomains is , which also agrees with the measurement [14].
In summary, we have discussed a model for proliferating bacterial colonies where rod-like cells grow and divide on a substrate. The model includes steric repulsions among cells and substrate, and also the short-range attractive forces induced by the EPS matrix. The simulated colonies initially grow as a 2D layer, and after a verticalization event, form a second layer where cells are also aligned parallel to the substrate. The comparison of our simulation results with experiments on E. coli cells shows a good match of the morphological features of the colonies. A cluster analysis of the microdomains reveals an exponential distribution of microdomain sizes, in agreement with recent experiments [14]. It would be interesting to explore the statistics of the mechanical forces underpinning the formation, growth, and splitting of microdomains across the multiple layers of the bacterial colony. Specifically, the interplay of geometry and topological defects at the boundaries of microdomains with the dynamical forces shaping those domains is the primary candidate for the mechanism underpinning the development of the colony.
Acknowledgements
This work was supported by the UK Engineering and Physical Sciences Research Council (EPSRC) grant EP/S515140/1 for Loughborough University National Productivity Investment Fund (NPIF) 2018. J.C. and M.G.M. gratefully acknowledge EPSRC grant EP/W522569/1. A.S. thanks the Institute for Advanced Studies, University of Luxembourg (AUDACITY Grant: IAS-20/CAMEOS) and the Luxembourg National Research Fund’s ATTRACT Investigator Grant (Grant no. A17/MS/11572821/MBRACE) and CORE Grant (C19/MS/13719464/TOPOFLUME/Sengupta) for supporting this work.
References
- [1] Costerton J. W., Lewandowski Z., Caldwell D. E., Korber D. R., Lappin-Scott H. M., Annu. Rev. Microbiol., 1995, 49, No. 1, 711–745, doi:10.1146/annurev.mi.49.100195.003431.
- [2] Hartmann R., Singh P. K., Pearce P., Mok R., Song B., Díaz-Pascual F., Dunkel J., Drescher K., Nat. Phys., 2019, 15, No. 3, 251–256, doi:10.1038/s41567-018-0356-9.
- [3] Flemming H.-C., Wingender J., Nat. Rev. Microbiol., 2010, 8, No. 9, 623–633, doi:10.1038/nrmicro2415.
- [4] Araújo N. A. M., Janssen L. M. C., Barois T., Boffetta G., Cohen I., Corbetta A., Dauchot O., Dijkstra M., Durham W. M., Dussutour A., et al., Soft Matter, 2023, 19, 1695–1704, doi:10.1039/D2SM01562E.
- [5] Nijjer J., Li C., Zhang Q., Lu H., Zhang S., Yan J., Nat. Commun., 2021, 12, No. 1, 6632, doi:10.1038/s41467-021-26869-6.
- [6] Sengupta A., Front. Phys., 2020, 8, No. 184, doi:10.3389/fphy.2020.00184.
- [7] Allen R. J., Waclaw B., Rep. Prog. Phys., 2018, 82, No. 1, 016601, doi:10.1088/1361-6633/aae546.
- [8] Drescher K., Dunkel J., Nadell C. D., Van Teeffelen S., Grnja I., Wingreen N. S., Stone H. A., Bassler B. L., PNAS, 2016, 113, No. 14, E2066–E2072, doi:10.1073/pnas.1601702113.
- [9] Karimi A., Karig D., Kumar A., Ardekani A. M., Lab Chip, 2015, 15, No. 1, 23–42, doi:10.1039/C4LC01095G.
- [10] Farrell F. D. C., Hallatschek O., Marenduzzo D., Waclaw B., Phys. Rev. Lett., 2013, 111, No. 16, 168101, doi:10.1103/PhysRevLett.111.168101.
- [11] Tiron R., Mallon F., Dias F., Reynaud E. G., Renewable Sustainable Energy Rev., 2015, 43, 1263–1272, doi:10.1016/j.rser.2014.11.105.
- [12] Hall-Stoodley L., Costerton J. W., Stoodley P., Nat. Rev. Microbiol., 2004, 2, No. 2, 95–108, doi:10.1038/nrmicro821.
- [13] Mazza M. G., J. Phys. D: Appl. Phys., 2016, 49, No. 20, 203001, doi:10.1088/0022-3727/49/20/203001.
- [14] You Z., Pearce D. J., Sengupta A., Giomi L., Phys. Rev. X, 2018, 8, No. 3, 031065, doi:10.1103/PhysRevX.8.031065.
- [15] You Z., Pearce D. J., Sengupta A., Giomi L., Phys. Rev. Lett., 2019, 123, No. 17, 178001, doi:10.1103/PhysRevLett.123.178001.
- [16] Dell’Arciprete D., Blow M. L., Brown A. T., Farrell F. D. C., Lintuvuori J. S., McVey A. F., Marenduzzo D., Poon W. C. K., Nat. Commun., 2018, 9, No. 1, 4190, doi:10.1038/s41467-018-06370-3.
- [17] Boyer D., Mather W., Mondragón-Palomino O., Orozco-Fuentes S., Danino T., Hasty J., Tsimring L. S., Phys. Biol., 2011, 8, No. 2, 026008, doi:10.1088/1478-3975/8/2/026008.
- [18] Sheats J., Sclavi B., Cosentino Lagomarsino M., Cicuta P., Dorfman K. D., R. Soc. Open Sci., 2017, 4, No. 6, 170463, doi:10.1098/rsos.170463.
- [19] Beroz F., Yan J., Meir Y., Sabass B., Stone H. A., Bassler B. L., Wingreen N. S., Nat. Phys., 2018, 14, No. 9, 954–960, doi:10.1038/s41567-018-0170-4.
- [20] Dhar J., Thai A. L. P., Ghoshal A., Giomi L., Sengupta A., Nat. Phys., 2022, 18, No. 8, 945–951, doi:10.1038/s41567-022-01641-9.
- [21] Earl D. J., Ilnytskyi J., Wilson M. R., Mol. Phys., 2001, 99, No. 20, 1719–1726, doi:10.1080/00268970110069551.
- [22] Pearce P., Song B., Skinner D. J., Mok R., Hartmann R., Singh P. K., Jeckel H., Oishi J. S., Drescher K., Dunkel J., Phys. Rev. Lett., 2019, 123, No. 25, 258101, doi:10.1103/PhysRevLett.123.258101.
- [23] Volfson D., Cookson S., Hasty J., Tsimring L. S., PNAS, 2008, 105, No. 40, 15346–15351, doi:10.1073/pnas.0706805105.
- [24] Vega C., Lago S., Comput. Chem., 1994, 18, No. 1, 55–59, doi:10.1016/0097-8485(94)80023-5.
- [25] Wittmann R., Nguyen G. P., Löwen H., Schwarzendahl F. J., Sengupta A., Commun. Phys., 2023, 6, No. 1, 331, doi:10.1038/s42005-023-01449-w.
- [26] Willis L., Huang K. C., Nat. Rev. Microbiol., 2017, 15, No. 10, 606–620, doi:10.1038/nrmicro.2017.79.
- [27] Jun S., Si F., Pugatch R., Scott M., Rep. Prog. Phys., 2018, 81, No. 5, 056601, doi:10.1088/1361-6633/aaa628.
- [28] Su P.-T., Liao C.-T., Roan J.-R., Wang S.-H., Chiou A., Syu W.-J., PloS ONE, 2012, 7, No. 11, e48098, doi:10.1371/journal.pone.0048098.
- [29] Grant M. A. A., Wacław B., Allen R. J., Cicuta P., J. R. Soc. Interface, 2014, 11, No. 97, 20140400, doi:10.1098/rsif.2014.0400.
- [30] Ilnytskyi J. M., Trokhymchuk A., Schoen M., J. Chem. Phys., 2014, 141, No. 11, 114903, doi:10.1063/1.4894438.
- [31] Ester M., Kriegel H.-P., Sander J., Xu X., In: Proceedings of the Second International Conference on Knowledge Discovery and Data Mining (KDD-96), AAAI, 1996, 226–231.
- [32] Paget J., Mazza M. G., Archer A. J., Shendruk T. N., Nat. Commun., 2023, 14, No. 1, 1048, doi:10.1038/s41467-023-36506-z.
- [33] Paget J., Alberti U., Mazza M. G., Archer A. J., Shendruk T. N., J. Phys. A: Math. Theor., 2022, 55, No. 35, 354001, doi:10.1088/1751-8121/ac80df.
Ukrainian \adddialect\l@ukrainian0 \l@ukrainian
До реалiстичного моделювання багатошарових бактерiальних колонiй [М. Т. Хан, Я. Камманн, А. Сенгупта, Е. Ренцi, М. Г. Мацца]М. Т. Хан, Я. Камманн, А. Сенгупта, Е. Ренцi, М. Г. Мацца
Мiждисциплiнарний центр математичного моделювання та кафедра математичних наук, Унiверситет Лафборо, Лафборо, Лестершир LE11 3TU, Великобританiя
Група фiзики живої речовини, Факультет фiзики та матерiалознавства, Люксембурзький унiверситет, 162 A, Авеню де ля Фаянсерi, L-1511 Люксембург, Люксембург
Iнститут перспективних дослiджень, Люксембурзький унiверситет, 2 Авеню де л’Унiверсiте, L-4365 Еш-сюр-Альзетт, Люксембург
Факультет математики, фiзики та електротехнiки, Нортумбрiйський унiверситет, Ньюкасл-апон-Тайн, NE1 8ST, Великобританiя