A candidate supermassive black hole in a gravitationally-lensed galaxy at
Abstract
While supermassive black holes (BHs) are widely observed in the nearby and distant universe, their origin remains debated with two viable formation scenarios with light and heavy seeds. In the light seeding model, the first BHs form from the collapse of massive stars with masses of , while the heavy seeding model posits the formation of seeds from direct collapse. The detection of BHs at redshifts , edging closer to their formation epoch, provides critical observational discrimination between these scenarios. Here, we focus on the JWST-detected galaxy, GHZ 9, at that is lensed by the foreground cluster, Abell 2744. Based on 2.1 Ms deep Chandra observations, we detect a candidate X-ray AGN, which is spatially coincident with the high-redshift galaxy, GHZ 9. The BH candidate is inferred to have a bolometric luminosity of , which corresponds to a BH mass of assuming Eddington-limited accretion. This extreme mass at such an early cosmic epoch suggests the heavy seed origin for this BH candidate. Based on the Chandra and JWST discoveries of extremely high-redshift quasars, we have constructed the first simple AGN luminosity function extending to . Comparison of this luminosity function with theoretical models indicates an over-abundant BH population, consistent with a higher-than-expected seed formation efficiency.
Subject headings:
Galaxy clusters – Gravitational lensing – High redshift galaxies – Supermassive black holes – X-ray active galactic nuclei1. Introduction
While BHs play a central role in the evolution of galaxies, their origin remains unsettled. Historically, two main formation scenarios can describe the birth of the first BHs: the light (e.g. Madau & Rees, 2001; Volonteri et al., 2003) and the heavy seed channels (e.g. Volonteri & Rees, 2005; Begelman et al., 2006; Lodato & Natarajan, 2006a; Wise et al., 2019). In the former channel, seed BHs form from the collapse of population III stars with . Although seeds are abundant in this channel, growing them by orders of magnitude in mass is challenging and may require sustained super-Eddington accretion. As an alternative to the traditional light seed model, a population of seeds forming in dense stellar structures was proposed (e.g. Regan et al., 2020; Schleicher et al., 2022). Per the heavy seed channel, BHs could originate from the collapse of massive gas clouds and end up with birth masses of .
Several physical processes and scenarios have been invoked to explain the direct collapse of pristine gas in primordial halos. Early theoretical work suggested the irradiation of pristine atomic cooling halos by Lyman-Werner photons to suppress gas cooling and fragmentation (Lodato & Natarajan, 2006b) as prerequisites for direct collapse. Recent simulations suggest that multiple feasible pathways exist to form heavy initial BH seeds from direct collapse: Cold flows that are expected to occur naturally in standard structure formation at early epochs could lead to direct collapse and BH seed formation (Latif et al., 2022). The rapid amplification of light seeds in specific environments like gas-rich, dense nuclear star clusters can also result in the formation of heavy seeds within a few million years (Alexander & Natarajan, 2014). Wise et al. (2019) suggests that dynamical heating in rapidly growing pre-galactic gas clouds is the main driver to form seeds with masses of . Recent work by Mayer et al. (2024) describes a very rare scenario, in which the merger of gas-rich galaxies leads to the formation of dense, compact supermassive disks that can also directly collapse into BHs.
To probe the origin of BH seeds, the detection of BHs provides the cleanest observational test (Ricarte & Natarajan, 2018a). Until recently, the high-redshift BH population has remained hidden. However, Chandra and JWST observations have started to reveal the presence of a handful of candidate AGN in the very early universe (Bogdán et al., 2024; Larson et al., 2023; Maiolino et al., 2023).
We probe high-redshift BHs by exploring faint X-ray sources that are magnified by gravitational lensing behind the lensing galaxy cluster, Abell 2744 (). The JWST UNCOVER (Ultradeep NIRSpec and NIRCam ObserVations before the Epoch of Reionization) survey reported the detection of high-redshift () lensed galaxies behind Abell 2744 (Atek et al., 2023). Using deep Chandra X-ray observations, we follow up these high-redshift galaxies and search for X-ray emission associated with their central BHs.
We search for X-ray emission co-spatial with the 19 lensed galaxy candidates in the keV (soft), keV (hard), and keV (broad) band merged Chandra images. We emphasize that this is a preliminary search designed solely to identify possible X-ray sources. We identified two galaxies with statistically significant X-ray detections: UHZ 1 (, ) at a spectroscopic redshift of (Bogdán et al., 2024; Goulding et al., 2023), and GHZ 9 (, ) at a photometric redshift of (Atek et al., 2023). While UHZ 1 is detected in the hard band, GHZ 9 is primarily detected in the soft band. Our previous paper describes the X-ray detection and inferred properties of a heavily obscured active galactic nucleus (AGN) in UHZ 1 (Bogdán et al., 2024). Here, we focus on GHZ 9 (see Section 2 for its detailed properties), and present the candidate X-ray AGN associated with it. Other, less significant detections and non-detections of the galaxies behind Abell 2744, will be discussed in a follow-up paper.
We assume the following values for the standard cosmological parameters: , , and , and all error bars represent uncertainties.
2. The GHZ 9 Galaxy
GHZ 9 (also known as galaxy ID 52008 in Atek et al. 2023) is a Lyman-break galaxy with a dropout in the F115W NIRCam bandpass (Figure 1), which suggests its high-redshift nature. Its photometric redshift, stellar mass and star formation rate are obtained by spectral energy distribution (SED) modeling.
The templates used in SED modeling do not include the contribution from AGN or broad emission lines; the former is highly uncertain even at low redshift and line emission can be very different at the high ionization rates inferred in these highly star-forming galaxies. With these caveats in mind, we note that the redshift of GHZ 9 ranges from (Atek et al. (2023), eazy code) through (Atek et al. (2023), beagle code) to as low as (Castellano et al. (2022), eazy code). Note that these redshifts are in agreement within uncertainty. Similarly, the stellar mass ranges from (Atek et al., 2023) to (Castellano et al., 2022), and the star formation rate from (Atek et al., 2023) to (Castellano et al., 2022).
A potential concern is that the probability distribution function (PDF) for the photometric redshift of GHZ 9 shows a secondary peak at . Follow-up measurements with NIRCam will conclusively determine the redshift. We note that systematic issues, such as the template choices mentioned above, would only act to broaden the PDF around the primary peak. For the rest of this paper, we proceed under the assumption that the true redshift of GHZ 9 is from Atek et al. (2023).
Wang et al. (2024a) performed SED modeling of all JWST-detected galaxies in the Abell 2744 field using the prospector package. In their model, they also included a potential AGN contribution, which is further discussed in Section 4.4. For GHZ 9, they obtained a best-fit redshift of , a stellar mass of , and a star formation rate of . These properties are consistent with those obtained without an AGN component.
The lensing magnification at the position of GHZ 9 is (Atek et al., 2023), which we use to correct the observed quantities.
3. Analysis of the Chandra data
We utilized 98 Chandra ACIS observations centered on the core of the galaxy cluster Abell 2744. The total available exposure time of the data is Ms (Table LABEL:tab:data). The analysis was carried out using standard CIAO tools (version 4.15) and the CALDB version 4.10.7 (Fruscione et al., 2006).
The main steps of the data reduction were identical to those presented in Bogdán et al. (2022). First, we reprocessed the individual observations using the chandra_repro tool. We filtered high-background periods, which resulted in a reduction in the total exposure time. To correct for minor astrometric variations across the individual observations and to minimize the aspect difference between individual data sets, we applied the wcs_match tool. Finally, the observations were merged using the merge_obs task, which also accounts for the various roll angles of individual observations.
We probed the accuracy of absolute astrometry by comparing the centroids of 25 Chandra–JWST source pairs with off-axis angles varying in a wide range from sources close to the aim point to sources with offset. The X-ray sources have a median detection significance of on the merged keV band Chandra image, while the JWST sources in these pairs have a median brightness of in the F200W band. We found an average offset of with a dispersion of . The largest individual offset among these sources was . These results agree with those obtained in previous studies (e.g. Liu et al., 2021).
We generated exposure maps for each observation assuming a power-law model with a slope of , which is typical for high-redshift AGN (Vito et al., 2019; Wang et al., 2021a), and with a Galactic column density of . The Chandra point spread function (PSF) varies across the field-of-view, and GHZ 9 is located at offset from the aim point at all observations, implying a broad PSF. To construct the PSF for each observation, we ran the MARX111https://space.mit.edu/cxc/marx/ ray-trace simulator through the simulate_psf CIAO tool for a monochromatic source with keV energy for each observation. In the keV band, the mean PSF radius with enclosed counts fraction is at the location of GHZ 9.
4. Results
4.1. An X-ray source associated with GHZ9
In Figure 1, we present the keV band Chandra X-ray and JWST near-infrared images of GHZ 9 and its surroundings. An X-ray source co-spatial with GHZ 9 is detected in the keV band but remains undetected in the keV band. The centroid of the X-ray source is from the center of GHZ 9, which offset is consistent with the accuracy of the astrometry (Section 3).
Panel (c) of Figure 1 also shows the presence of a bright star (Gaia ID 2320218780150294272 Smart & Nicastro, 2013) located toward the north from GHZ 9. The star is detected both in the Chandra and JWST images. Although the star is cleanly separated from GHZ 9 in the JWST images, the broad Chandra PSF (Section 3) introduces complexity to the X-ray analysis as the bright star is expected to contribute to the observed emission at the position of GHZ 9222At the location of the bright star, the simulated PSF has a slightly elliptical shape, elongated in the northeast-southwest direction, thus the major axis is not aligned with GHZ 9-X.. Finally, we also highlight another low-redshift galaxy about to the southwest from GHZ 9, which galaxy is further discussed in Section 4.6. For clarity, we refer to the X-ray point source co-spatial with GHZ 9 as GHZ 9-X, and to the southwest galaxy as SW galaxy throughout the rest of the paper.
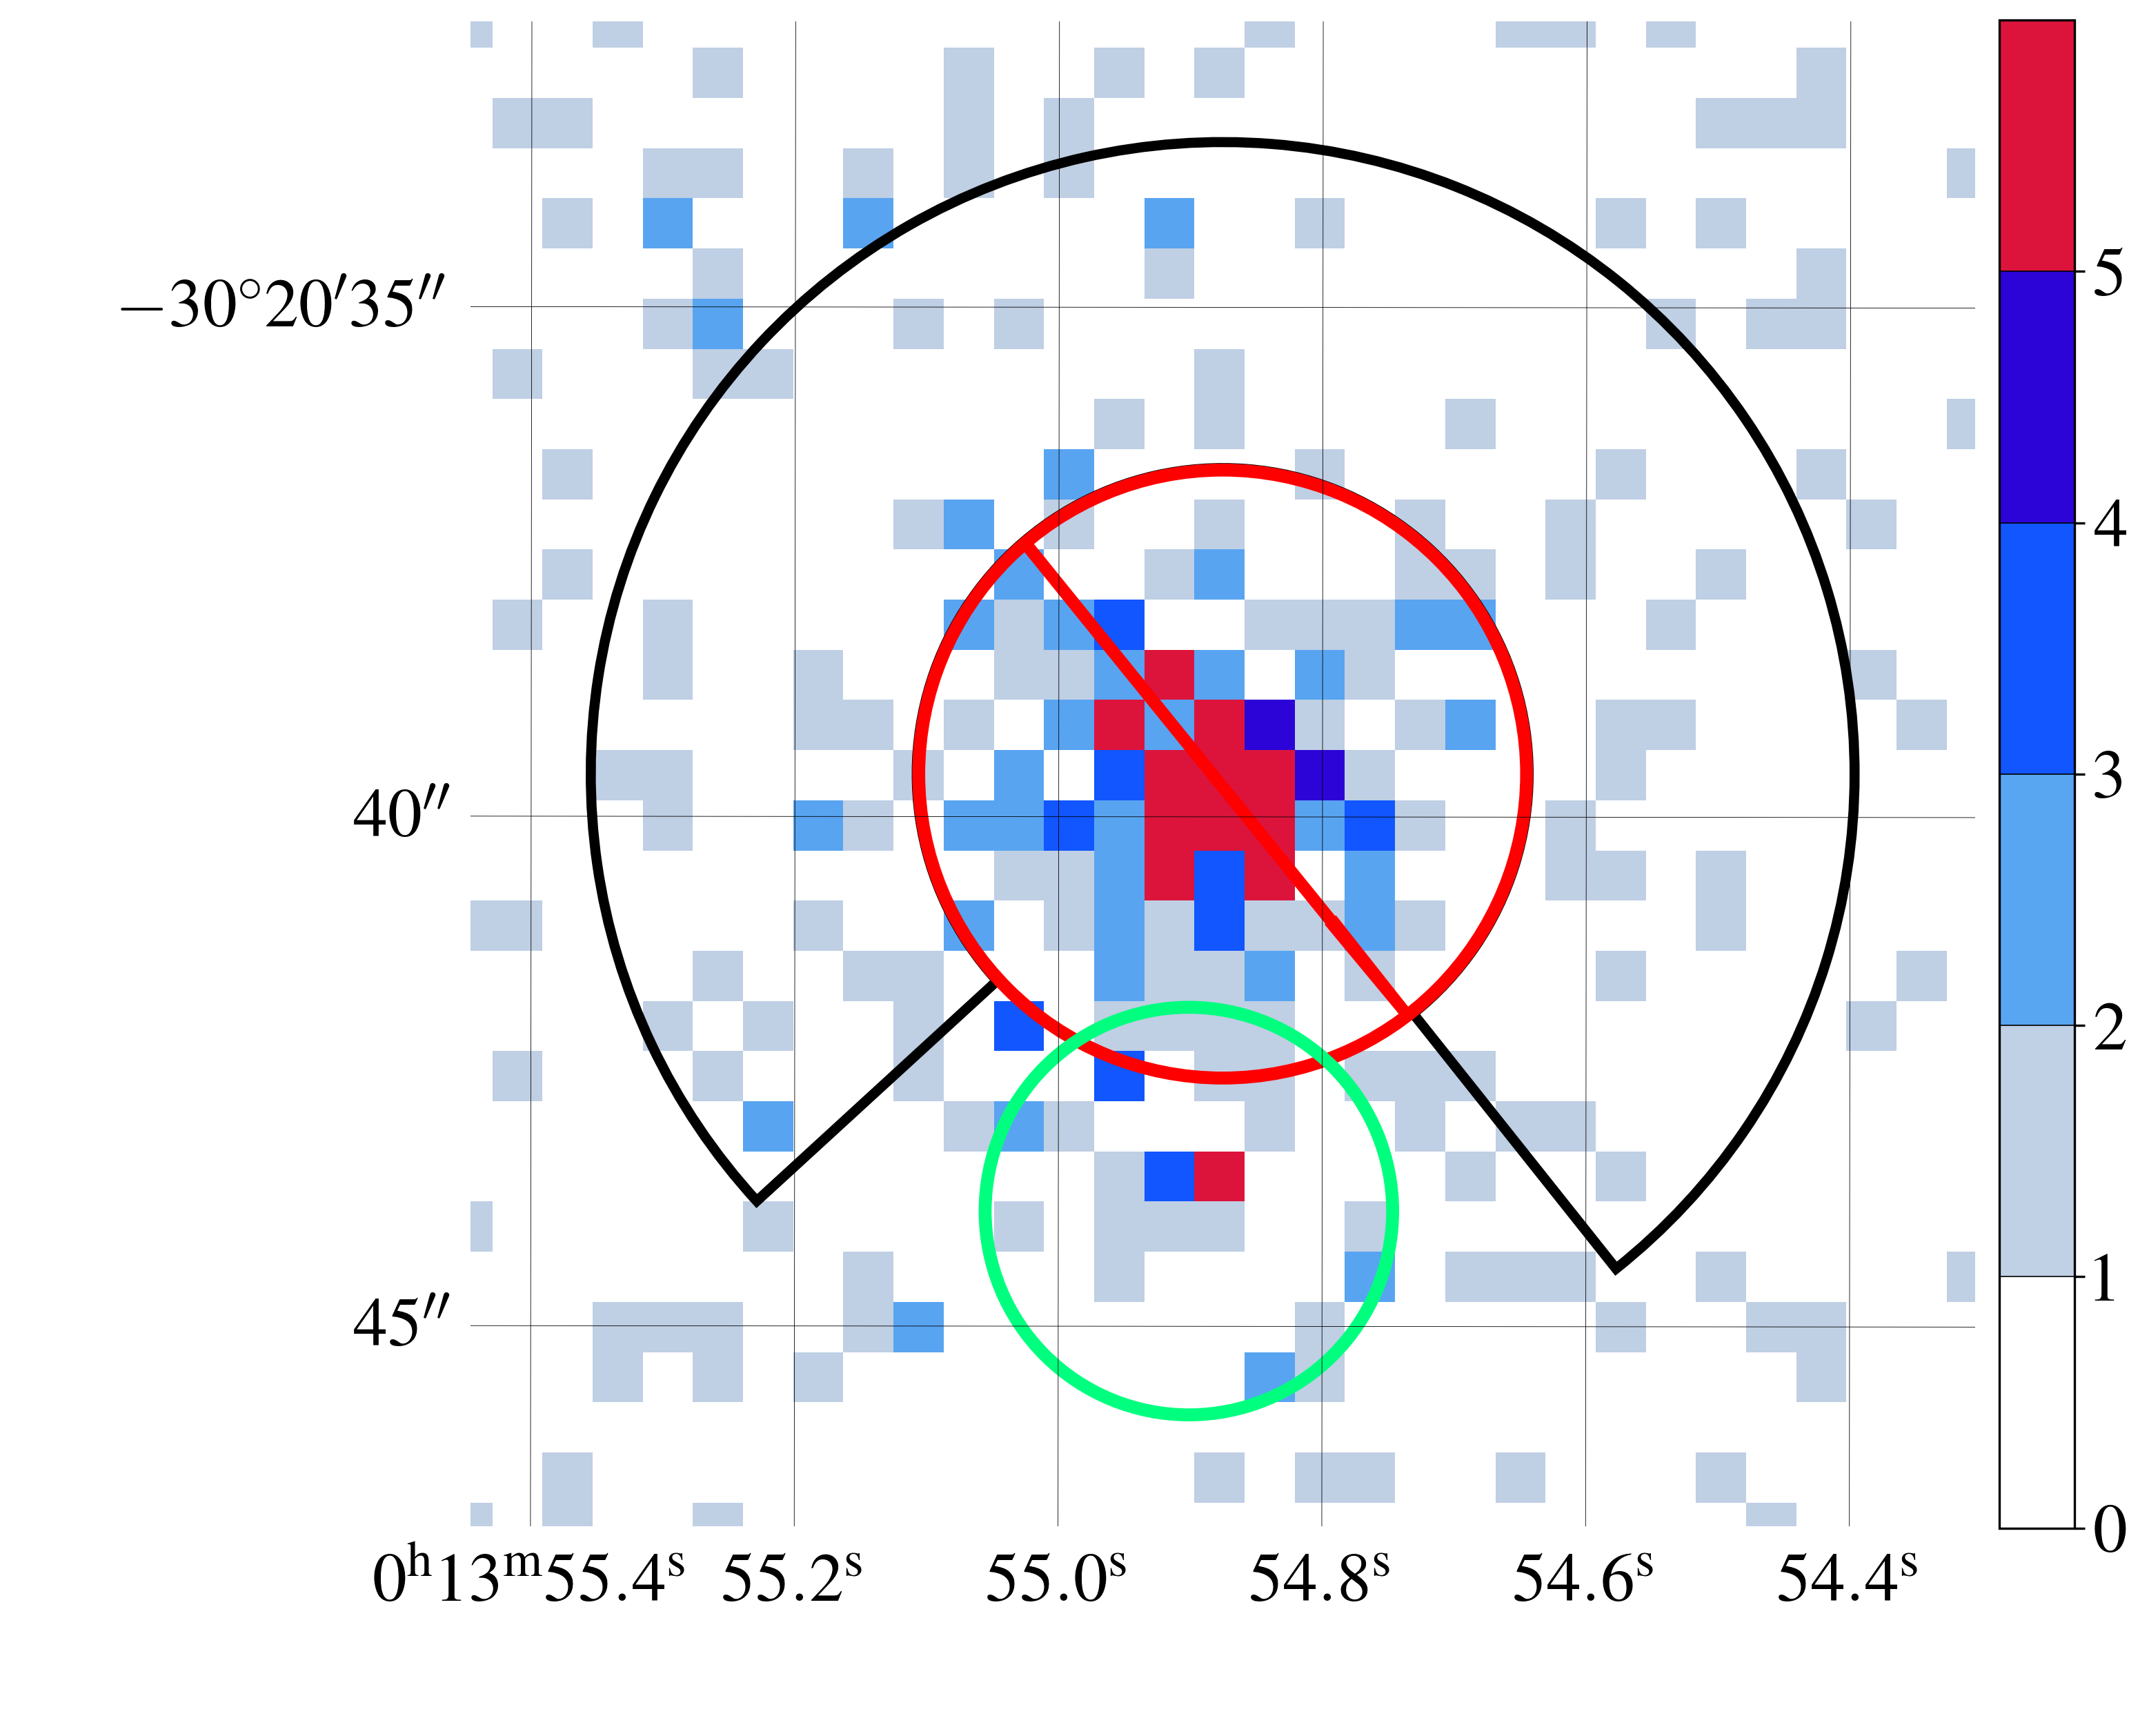
To derive the brightness of GHZ 9-X, we carried out forced photometry at the position of GHZ 9. To this end, we extracted the counts from the soft and hard band Chandra images using a circular region that is centered on GHZ 9. We also exclude an circle centered at the star (see Figure 2). Within this source region, we measured and counts in the keV and keV bands, respectively. To account for the background emission and derive the number of net counts associated with the source, we employ two approaches.
In the first approach, we describe the background with two components: (i) the background emission originating from the ICM of Abell 2744, and the sky333Sky background includes the cosmic X-ray background, and the diffuse emission from the Milky Way and the Local Hot Bubble. and instrumental background components, (ii) spillover counts originating from the nearby star. Note that GHZ 9-X is located at a projected distance from the cluster core, where the emission from the intracluster medium (ICM) drops to of the core value. At this radius, the instrumental background dominates the overall background (Kovács et al., 2023), and surpasses both the ICM emission and the sky background. To account for the background emission, we used a local, , rectangular region around GHZ 9-X, excluding and circular regions around the star and GHZ 9-X, respectively. We assigned circular regions centered on each pixel within the rectangle, which resulted in 328 background regions. We extracted the number of counts within each region and found a mean value of counts after scaling the areas. We emphasize that none of the individual circular background regions had counts. To derive the number of spillover counts from the star, we rely on the simulated Chandra PSF normalized to the stellar brightness. Specifically, we extracted the keV band radial surface brightness profile of the star using circular annuli. Then, we matched the distribution of the stellar profile with that obtained from the simulated PSF. We obtained excellent agreement between the observed and simulated profiles, confirming that the star is a point source. Because the extraction region of GHZ 9-X is located at offset from the star (Figure 2), we integrated the normalized simulated PSF distribution within this annulus, and scaled the result to the area of the GHZ 9-X region. We concluded that the star contributes with counts. Thus, the spillover counts from the star and the background emission contribute a total of counts to the GHZ 9-X extraction region. Given the total counts in the source region, we conclude that GHZ 9-X has net counts. Assuming Poisson distribution, the probability of detecting counts, given the above estimated background level, is , which corresponds to a detection significance of . In the keV band, the X-ray source is not detected with a high statistical significance, hence we derive a upper limit of counts. This non-detection is consistent with the assumed power law model (Section 3).
In the second approach, we estimated the two background components simultaneously from the star’s PSF wing with radii (Figure 2) measured in the observed image. Within this wedge, we defined 70 overlapping circular regions with radius and offset identical to that of the GHZ 9-X source region, and extracted the counts within each circle. The counts associated with the star within a region were excluded from this analysis. The mean keV background level within the wedge is counts and no regions have counts. We thus conclude that net counts are associated with GHZ 9-X in the soft band, which provides a detection probability of and a detection significance of , assuming Poisson distribution. In agreement with the previous approach, the source is not significantly detected in the keV band.
Both approaches reveal comparable detection significances ( and ) in the soft band, and indicate the presence of an X-ray source co-spatial with GHZ 9.
4.2. Hardness ratios
To further test whether GHZ 9-X is distinct from the nearby star, we compare the spectral characteristics of the two sources. Due to the relatively low number of counts originating from GHZ 9-X, we limit our analysis to deriving X-ray hardness ratios. We define the hardness ratio as , where and are the number of counts measured in the and bands, respectively. We calculated the hardness ratios and the associated confidence limits using the BEHR (Bayesian Estimation of Hardness Ratios) code (Park et al., 2006) for GHZ 9-X and the star using the regions defined in Section 4.1 and shown in Figure 2. For GHZ 9-X, the background counts were extracted from the annular wedge (Figure 2), while for the star we used a nearby circular region with radius.
We obtained hardness ratios of and , for the star and GHZ 9-X, respectively. This suggests that GHZ 9-X does not have the same spectral characteristics as the star. The observed hardness ratio for GHZ 9-X is consistent with an unobscured or mildly obscured power law model with a slope of . However, due to the relatively low number of counts and the uncertainties associated with the hardness ratios, we cannot further characterize the spectral properties of the source.
4.3. The luminosity and BH mass of the candidate X-ray AGN
GHZ 9-X has net counts within the extraction radius in the keV band (Section 4.1). We use the mean of these values and the Gehrels approximation to derive its confidence limit (Gehrels, 1986), which yields net counts. As the spectral characteristics of the galaxy do not indicate high-level obscuration, we assume a Galactic column density of (Willingale et al., 2013). Additionally, we consider that the source region encircles of the counts due to the local PSF. Finally, we correct for the lensing magnification. Thus, we obtain a keV band (restframe keV) flux of .
To derive the bolometric luminosity of GHZ 9-X, we utilize the correction derived by Lusso et al. (2012). Therefore, we first compute the keV band luminosity based on the keV band flux and the assumed power law model with , which results in . Applying the bolometric correction of leads to a bolometric luminosity of . We note that converting the soft band fluxes to the keV band and using the correction yields similar bolometric luminosities. Assuming accretion at the Eddington limit, the obtained bolometric luminosity corresponds to a BH mass of .
The uncertainties quoted for the bolometric luminosity and BH mass are statistical; they do not include systematic uncertainties. Systematic uncertainties could result from the not well-constrained slope of the power-law model: for example, a slope would give a lower X-ray flux. The uncertain redshift of GHZ 9 could also affect the observed quantities; if the redshift was , the luminosity and mass of the BH would be lower. Additional uncertainties arise from the intrinsic scatter in the relation Lusso et al. (2012), from potential intrinsic absorption that would lead to a higher inferred luminosity and BH mass, and from potential deviations from the assumed Eddington-limited accretion. Specifically, in the case of super-Eddington accretion, the BH mass could be up to a few times smaller, while lower accretion rates and the presence of intrinsic absorption could result in significantly larger BH masses. Follow-up JWST spectroscopic observations could substantially reduce these uncertainties and provide a more accurate BH mass measurement.
4.4. Broadband SED of GHZ 9
Recently, Wang et al. (2024b) performed photometric SED fitting on over 60,000 galaxies in the Abell 2744 field. They used the prospector code to determine galaxy properties, including a model that accounted for a potential AGN component. This approach provides an estimate of the contribution of the AGN to the observed light by JWST. For GHZ 9, the AGN fraction was estimated at . We emphasize that this SED fitting was exclusively based on the JWST data and did not consider the X-ray detection discussed in this work.
By combining the Chandra X-ray and JWST near-infrared data, we conducted a preliminary SED fitting employing the accretion disk model described by Kubota & Done (2018), following the methodology outlined by Azadi et al. (2023). The accretion disk SEDs were primarily constrained by the X-ray data given the high luminosity of GHZ9-X, which suggests that the X-ray emission is unlikely to be dominated by the host galaxy. Indeed, the broadband SED indicates that GHZ9-X is likely a Type-2 AGN, consistent with the findings of Wang et al. (2024b), confirming that the JWST emission predominantly arises from the host galaxy rather than the AGN accretion disk.
Assuming the Milky Way dust extinction curve and assuming that the dust grains in the AGN torus are similar to those in the interstellar medium, we estimate that a column density of could effectively obscure the AGN signal in the JWST bands. We emphasize that this level of column density will not significantly affect the X-ray data measured in the restframe keV band, hence the inferred X-ray luminosity and BH mass presented in Section 4.3 will remain invariant. Our preliminary SED modeling included only the accretion disk component, however, a comprehensive modeling approach requires both the accretion disk and host galaxy components, with corrections made for the torus and host galaxy absorption affecting the visible/UV photometry associated with the accretion disk. Although full SED modeling of GHZ 9 is beyond the scope of the present work, our conclusions are well constrained by the preliminary SED modeling.
4.5. Random galaxy simulations
Because we searched for X-ray sources co-spatial with 19 JWST-identified galaxies, we assess the likelihood that GHZ 9-X is a random upwards fluctuation. First, we employ the CIAO wavdetect tool to determine the detection significance of the X-ray source in the keV band. Because the vicinity of GHZ 9 has a low-level emission from the galaxy cluster, we only ran wavdetect in a region around the galaxy. The X-ray source was detected at a significance threshold of . Projecting this result to the entire ACIS-I array, we expect false detections.
Next, we assess the probability distribution of getting a chance alignment between a JWST source and an X-ray source in the Chandra data. To this end, we simulate random X-ray sources and use the full catalog of JWST sources in the Abell 2744 field (Weaver et al., 2024) to measure the distribution of separation distances between the simulated X-ray sources and the JWST sources. Because the offset between the X-ray source and GHZ 9 is , we integrate the obtained distribution out to . Then, we normalize this value by the number of simulated random X-ray sources and the expected number of false detections, take into account the ratio between the JWST and Chandra field-of-views, and account for the fact that we searched for X-ray sources at JWST galaxies. We thus find that the likelihood of having a falsely detected X-ray source within from the position of a high-redshift JWST galaxy is , corresponding to .
4.6. A low-redshift galaxy in the proximity of GHZ 9
Situated at angular distance to the southwest from GHZ 9, a galaxy (Weaver et al., 2024) is resolved in the JWST images (Figure 1). The same galaxy is detected in the Hubble Frontier Field Deep Space catalog (Shipley et al., 2018; Nedkova et al., 2021) and described as a low-stellar-mass galaxy () with a photometric redshift of . We discuss if GHZ 9-X could be associated with this lower redshift galaxy.
Based on the distribution of the keV band counts around GHZ 9-X, we find that its best-fit centroid is and . This corresponds to projected distances of from GHZ 9 and from the SW galaxy. This suggests that GHZ 9-X is co-spatial with GHZ 9. The accuracy of the astrometry, and hence the association between GHZ 9-X and GHZ 9, is further supported by the relative distances between the bright star and GHZ 9-X on the Chandra image and between the bright star and GHZ 9 on the JWST image. The importance of this is that even though there may be differences in the absolute astrometry between the two space telescopes, the relative distances should be identical. On the Chandra image, the projected distance between the centroid of the bright star and GHZ 9-X is , while on the JWST image, the projected distance between the centroid of the star and GHZ 9 is . This small difference (about half a Chandra pixel) between the relative distances suggests that the X-ray source is associated with GHZ 9 rather than the SW galaxy. Indeed, the projected distance between the bright star and the SW galaxy is on the JWST image, which is substantially larger than that measured between the bright star and GHZ 9-X on the Chandra image.
As a caveat, we note that systematic studies of deep Chandra fields, which explored larger samples of X-ray-optical source pairs, suggest that the positional uncertainty depends on the Chandra off-axis position and the brightness of the source (e.g. Lehmer et al., 2005; Goulding et al., 2012). Based on these works and considering that GHZ 9-X resides from the ACIS-I aim point and is a relatively faint source, the systematic positional uncertainty could be as large as . We note that if GHZ 9-X were to be associated with the SW galaxy, its X-ray luminosity would be .
Taken together, we conclude that while the X-ray source is most likely associated with GHZ 9, due to potential systematic uncertainties in the astrometry, we cannot completely rule out that the X-ray source is associated with the SW galaxy. Follow-up JWST spectroscopic observations could conclusively determine if GHZ 9 hosts an accreting BH.
5. Discussion & Conclusions
Considering the evidence presented in Section 4, we assume that GHZ 9-X is a rapidly growing BH. If confirmed by follow-up observations, at (i.e. merely Myrs after the Big Bang), it would be one of the earliest accreting BHs ever detected. In this section, we discuss the potential origin and the theoretical implications of the BH candidate.
To infer the origin of this BH, we track the assembly history of light and heavy seeds (Figure 3). A light initial seed accreting at its Eddington rate for 330 Myrs (from to ), would only reach a final mass of , falling short of the inferred BH mass by orders of magnitude. To reach this mass, a light seed must continuously accrete at least twice the Eddington rate, which is not supported by simulations (see the discussion below and Willott et al., 2010; Smith et al., 2018). In contrast, heavy seeds accreting at or somewhat below the Eddington rate can easily reach the BH mass of GHZ 9-X within the available cosmic timeframe.
While there are likely multiple mechanisms available for forming direct collapse BHs, the halos where they form are expected to be rare peaks and clustered at early times. Therefore, the detection of two Outsize Black Hole Galaxy (OBG) candidates (GHZ 9 and UHZ 1) behind the same lensing cluster is unsurprising. Taken together, these two detections suggest that the formation of direct collapse BHs might be more efficient than previously assumed, adding support to the existence of multiple potential formation pathways, such as cold gas flows in early halos (Latif et al., 2022), mergers of massive gas-rich galaxies in the early Universe (Mayer et al., 2024), or early star-burst clusters (Kroupa et al., 2020). In more exotic scenarios, some models predict the emergence of primordial BHs with masses of (e.g. Carr et al., 2021; Escrivà et al., 2022).
Figure 3 shows that the light seed channel is only feasible with sustained super-Eddington accretion for hundreds of Myrs (Figure 3). Although state-of-the-art simulations cannot track the formation and evolution of these seeds ab initio, they offer insights into the growth of early BHs. Using the Renaissance simulation suite, Smith et al. (2018) followed the growth of over 15,000 light seeds and found that these seeds grow extremely inefficiently, with the most active BHs growing by over 300 Myrs. Of this large ensemble, only one seed experienced a brief period of super-Eddington accretion. Thus, Smith et al. (2018) concluded that light seeds cannot reach by . A similar conclusion was found based on the CAT (Cosmic Archaeology Tool) semi-analytic model, which found that light BH seeds cannot reach the masses and luminosities of quasars observed at (Trinca et al., 2022).
The Chandra/JWST discovery of AGN paves the way for building the luminosity function of AGN in the early universe and comparing the observational data with theoretical predictions. Current theoretical studies utilize semi-empirical models/semi-analytic models to trace the formation and assembly history of BH populations over cosmic time. These works vary both the BH seeding and the growth prescriptions to discern potential surviving observational signatures of initial BH seeding. Notably, Ricarte & Natarajan (2018b) predict bolometric luminosity functions for accreting BHs at a range of redshifts for the light and heavy seed models. In Figure 4, we compare the Ricarte & Natarajan (2018b) model predictions of AGN luminosity functions at based on UHZ 1 and GHZ 9 and at using data from Greene et al. (2024). The observed AGN number density at exceeds the theoretical expectations for the light and heavy seed models. We note that the AGN luminosity functions at are nearly identical, hence AGN at these redshifts cannot be used to discriminate between seeding models. The difference relative to the model predictions becomes striking at , where the observed AGN number density exceeds the theoretically predicted values by several orders of magnitude. This suggests that the efficiency of heavy seed formation is theoretically underestimated, hinting that multiple channels for heavy seed formation may simultaneously operate in the early universe. We note that the presented luminosity function is based on two sources that were detected in the single, and relatively small, field of Abell 2744. To establish a more accurate luminosity function of AGN, the sample size of high-redshift AGN should be increased, and cosmic variance should be explored by adding other sightlines.
Acknowledgements. We thank the reviewer for their constructive report. O.E.K and N.W. are supported by the GAČR EXPRO grant No. 21-13491X. Á.B., M.A., W.R.F, C.J., and R.P.K acknowledge support from the Smithsonian Institution and the Chandra Project through NASA contract NAS8-03060. PN acknowledges support from the Black Hole Initiative at Harvard University, which is funded by grants from the John Templeton Foundation and the Gordon and Betty Moore Foundation. This paper employs a list of Chandra datasets, obtained by the Chandra X-ray Observatory, contained in https://doi.org/10.25574/cdc.194 (catalog DOI: X). JWST data presented in this article were obtained from the Mikulski Archive for Space Telescopes (MAST) at the Space Telescope Science Institute, which can be accessed via https://dx.doi.org/10.17909/kw3c-n857 (catalog DOI).
References
- Alexander & Natarajan (2014) Alexander, T. & Natarajan, P. 2014, Science, 345, 1330
- Atek et al. (2023) Atek, H., Chemerynska, I., Wang, B., et al. 2023, MNRAS, 524, 5486
- Atek et al. (2023) Atek, H., Chemerynska, I., Wang, B., et al. 2023, Monthly Notices of the Royal Astronomical Society, 524, 5486
- Azadi et al. (2023) Azadi, M., Wilkes, B., Kuraszkiewicz, J., et al. 2023, ApJ, 945, 145
- Bañados et al. (2018) Bañados, E., Venemans, B. P., Mazzucchelli, C., et al. 2018, Nature, 553, 473
- Begelman et al. (2006) Begelman, M. C., Volonteri, M., & Rees, M. J. 2006, MNRAS, 370, 289
- Bogdán et al. (2024) Bogdán, Á., Goulding, A. D., Natarajan, P., et al. 2024, Nature Astronomy, 8, 126
- Bogdán et al. (2022) Bogdán, Á., Kovács, O. E., Jones, C., et al. 2022, ApJ, 927, 34
- Carr et al. (2021) Carr, B., Clesse, S., García-Bellido, J., & Kühnel, F. 2021, Physics of the Dark Universe, 31, 100755
- Castellano et al. (2022) Castellano, M., Fontana, A., Treu, T., et al. 2022, arXiv e-prints, arXiv:2212.06666
- Escrivà et al. (2022) Escrivà, A., Kuhnel, F., & Tada, Y. 2022, arXiv e-prints, arXiv:2211.05767
- Fruscione et al. (2006) Fruscione, A., McDowell, J. C., Allen, G. E., et al. 2006, in Society of Photo-Optical Instrumentation Engineers (SPIE) Conference Series, Vol. 6270, Society of Photo-Optical Instrumentation Engineers (SPIE) Conference Series, ed. D. R. Silva & R. E. Doxsey, 62701V
- Gehrels (1986) Gehrels, N. 1986, ApJ, 303, 336
- Goulding et al. (2012) Goulding, A. D., Forman, W. R., Hickox, R. C., et al. 2012, ApJS, 202, 6
- Goulding et al. (2023) Goulding, A. D., Greene, J. E., Setton, D. J., et al. 2023, ApJ, 955, L24
- Greene et al. (2024) Greene, J. E., Labbe, I., Goulding, A. D., et al. 2024, ApJ, 964, 39
- Kovács et al. (2023) Kovács, O. E., Zhu, Z., Werner, N., Simionescu, A., & Bogdán, Á. 2023, A&A, 678, A91
- Kroupa et al. (2020) Kroupa, P., Subr, L., Jerabkova, T., & Wang, L. 2020, MNRAS, 498, 5652
- Kubota & Done (2018) Kubota, A. & Done, C. 2018, MNRAS, 480, 1247
- Larson et al. (2023) Larson, R. L., Finkelstein, S. L., Kocevski, D. D., et al. 2023, ApJ, 953, L29
- Latif et al. (2022) Latif, M. A., Whalen, D. J., Khochfar, S., Herrington, N. P., & Woods, T. E. 2022, Nature, 607, 48
- Lehmer et al. (2005) Lehmer, B. D., Brandt, W. N., Alexander, D. M., et al. 2005, ApJS, 161, 21
- Liu et al. (2021) Liu, A., Tozzi, P., Rosati, P., et al. 2021, A&A, 648, A47
- Lodato & Natarajan (2006a) Lodato, G. & Natarajan, P. 2006a, MNRAS, 371, 1813
- Lodato & Natarajan (2006b) Lodato, G. & Natarajan, P. 2006b, MNRAS, 371, 1813
- Lusso et al. (2012) Lusso, E., Comastri, A., Simmons, B. D., et al. 2012, MNRAS, 425, 623
- Madau & Rees (2001) Madau, P. & Rees, M. J. 2001, ApJ, 551, L27
- Maiolino et al. (2023) Maiolino, R., Scholtz, J., Witstok, J., et al. 2023, arXiv e-prints, arXiv:2305.12492
- Mayer et al. (2024) Mayer, L., Capelo, P. R., Zwick, L., & Di Matteo, T. 2024, ApJ, 961, 76
- Mortlock et al. (2011) Mortlock, D. J., Warren, S. J., Venemans, B. P., et al. 2011, Nature, 474, 616
- Nedkova et al. (2021) Nedkova, K. V., Häußler, B., Marchesini, D., et al. 2021, MNRAS, 506, 928
- Park et al. (2006) Park, T., Kashyap, V. L., Siemiginowska, A., et al. 2006, ApJ, 652, 610
- Regan et al. (2020) Regan, J. A., Wise, J. H., Woods, T. E., et al. 2020, The Open Journal of Astrophysics, 3, 15
- Ricarte & Natarajan (2018a) Ricarte, A. & Natarajan, P. 2018a, MNRAS, 481, 3278
- Ricarte & Natarajan (2018b) Ricarte, A. & Natarajan, P. 2018b, MNRAS, 481, 3278
- Schleicher et al. (2022) Schleicher, D. R. G., Reinoso, B., Latif, M., et al. 2022, MNRAS, 512, 6192
- Shipley et al. (2018) Shipley, H. V., Lange-Vagle, D., Marchesini, D., et al. 2018, ApJS, 235, 14
- Smart & Nicastro (2013) Smart, R. L. & Nicastro, L. 2013, VizieR Online Data Catalog, I/324
- Smith et al. (2018) Smith, B. D., Regan, J. A., Downes, T. P., et al. 2018, MNRAS, 480, 3762
- Trinca et al. (2022) Trinca, A., Schneider, R., Valiante, R., et al. 2022, MNRAS, 511, 616
- Vito et al. (2019) Vito, F., Brandt, W. N., Bauer, F. E., et al. 2019, A&A, 630, A118
- Volonteri et al. (2003) Volonteri, M., Haardt, F., & Madau, P. 2003, ApJ, 582, 559
- Volonteri & Rees (2005) Volonteri, M. & Rees, M. J. 2005, ApJ, 633, 624
- Wang et al. (2024a) Wang, B., Leja, J., Labbé, I., et al. 2024a, ApJS, 270, 12
- Wang et al. (2024b) Wang, B., Leja, J., Labbé, I., et al. 2024b, ApJS, 270, 12
- Wang et al. (2021a) Wang, F., Fan, X., Yang, J., et al. 2021a, ApJ, 908, 53
- Wang et al. (2021b) Wang, F., Yang, J., Fan, X., et al. 2021b, ApJ, 907, L1
- Weaver et al. (2024) Weaver, J. R., Cutler, S. E., Pan, R., et al. 2024, ApJS, 270, 7
- Willingale et al. (2013) Willingale, R., Starling, R. L. C., Beardmore, A. P., Tanvir, N. R., & O’Brien, P. T. 2013, MNRAS, 431, 394
- Willott et al. (2010) Willott, C. J., Albert, L., Arzoumanian, D., et al. 2010, AJ, 140, 546
- Wise et al. (2019) Wise, J. H., Regan, J. A., O’Shea, B. W., et al. 2019, Nature, 566, 85
We list the analyzed Chandra ACIS observations of Abell 2744 in Table LABEL:tab:data.
| Observation ID | Detector | Observation Date | Observation ID | Detector | Observation Date | ||
|---|---|---|---|---|---|---|---|
| 2212 | 17.82 | ACIS-S | 2001-09-03 | 25938 | 18.66 | ACIS-I | 2022-11-26 |
| 7915 | 18.11 | ACIS-I | 2006-11-08 | 25963 | 37.59 | ACIS-I | 2022-11-26 |
| 8477 | 44.63 | ACIS-I | 2007-06-10 | 25937 | 30.78 | ACIS-I | 2022-11-27 |
| 8557 | 27.30 | ACIS-I | 2007-06-14 | 25278 | 9.78 | ACIS-I | 2022-12-02 |
| 7712 | 8.07 | ACIS-I | 2007-09-10 | 27575 | 19.65 | ACIS-I | 2022-12-02 |
| 26280 | 11.39 | ACIS-I | 2022-01-18 | 25936 | 12.92 | ACIS-I | 2023-01-26 |
| 25912 | 15.10 | ACIS-I | 2022-04-18 | 27678 | 12.42 | ACIS-I | 2023-01-27 |
| 25911 | 16.59 | ACIS-I | 2022-04-19 | 25939 | 14.32 | ACIS-I | 2023-01-28 |
| 25934 | 18.96 | ACIS-I | 2022-04-21 | 27679 | 11.93 | ACIS-I | 2023-01-28 |
| 25931 | 14.55 | ACIS-I | 2022-04-23 | 27680 | 13.21 | ACIS-I | 2023-01-28 |
| 25954 | 13.39 | ACIS-I | 2022-04-24 | 27681 | 9.78 | ACIS-I | 2023-01-29 |
| 25928 | 15.36 | ACIS-I | 2022-05-03 | 25909 | 19.33 | ACIS-I | 2023-05-24 |
| 25942 | 15.18 | ACIS-I | 2022-05-04 | 27856 | 15.88 | ACIS-I | 2023-05-25 |
| 25958 | 11.81 | ACIS-I | 2022-05-04 | 27857 | 12.92 | ACIS-I | 2023-05-26 |
| 25971 | 12.62 | ACIS-I | 2022-05-04 | 27563 | 11.70 | ACIS-I | 2023-06-08 |
| 25932 | 14.08 | ACIS-I | 2022-05-05 | 25941 | 32.65 | ACIS-I | 2023-06-09 |
| 25972 | 31.14 | ACIS-I | 2022-05-18 | 27896 | 13.73 | ACIS-I | 2023-06-10 |
| 25970 | 23.99 | ACIS-I | 2022-06-12 | 25917 | 35.62 | ACIS-I | 2023-06-22 |
| 25919 | 25.03 | ACIS-I | 2022-06-13 | 25950 | 29.69 | ACIS-I | 2023-06-30 |
| 25920 | 29.67 | ACIS-I | 2022-06-13 | 25946 | 29.69 | ACIS-I | 2023-07-01 |
| 25922 | 31.11 | ACIS-I | 2022-06-14 | 25965 | 35.63 | ACIS-I | 2023-07-07 |
| 25968 | 26.92 | ACIS-I | 2022-07-12 | 25960 | 24.76 | ACIS-I | 2023-07-08 |
| 25967 | 33.12 | ACIS-I | 2022-08-01 | 25926 | 61.18 | ACIS-I | 2023-07-12 |
| 25929 | 26.42 | ACIS-I | 2022-08-26 | 25955 | 43.42 | ACIS-I | 2023-07-20 |
| 25925 | 23.41 | ACIS-I | 2022-09-02 | 25921 | 16.87 | ACIS-I | 2023-08-04 |
| 25956 | 13.90 | ACIS-I | 2022-09-02 | 25959 | 15.39 | ACIS-I | 2023-08-05 |
| 25913 | 19.64 | ACIS-I | 2022-09-03 | 27974 | 28.71 | ACIS-I | 2023-08-05 |
| 25915 | 20.31 | ACIS-I | 2022-09-03 | 25940 | 27.72 | ACIS-I | 2023-08-10 |
| 25923 | 10.64 | ACIS-I | 2022-09-04 | 25966 | 18.84 | ACIS-I | 2023-08-13 |
| 25279 | 23.69 | ACIS-I | 2022-09-06 | 28370 | 20.73 | ACIS-I | 2023-08-13 |
| 25924 | 21.54 | ACIS-I | 2022-09-07 | 25933 | 23.88 | ACIS-I | 2023-08-15 |
| 25944 | 20.85 | ACIS-I | 2022-09-08 | 28483 | 20.22 | ACIS-I | 2023-08-19 |
| 25957 | 21.29 | ACIS-I | 2022-09-08 | 25935 | 24.08 | ACIS-I | 2023-08-20 |
| 27347 | 21.45 | ACIS-I | 2022-09-09 | 27780 | 14.90 | ACIS-I | 2023-08-21 |
| 25918 | 20.38 | ACIS-I | 2022-09-13 | 25943 | 16.69 | ACIS-I | 2023-08-31 |
| 25953 | 24.24 | ACIS-I | 2022-09-17 | 28872 | 13.09 | ACIS-I | 2023-09-01 |
| 25908 | 21.83 | ACIS-I | 2022-09-23 | 25916 | 22.20 | ACIS-I | 2023-09-03 |
| 27449 | 9.78 | ACIS-I | 2022-09-24 | 25964 | 20.32 | ACIS-I | 2023-09-05 |
| 25910 | 19.31 | ACIS-I | 2022-09-25 | 25961 | 18.84 | ACIS-I | 2023-09-09 |
| 27450 | 9.78 | ACIS-I | 2022-09-26 | 28886 | 9.96 | ACIS-I | 2023-09-10 |
| 25945 | 16.77 | ACIS-I | 2022-09-27 | 28887 | 19.85 | ACIS-I | 2023-09-10 |
| 25948 | 26.80 | ACIS-I | 2022-09-30 | 25962 | 21.81 | ACIS-I | 2023-09-11 |
| 25969 | 26.92 | ACIS-I | 2022-10-09 | 25927 | 20.53 | ACIS-I | 2023-09-16 |
| 25914 | 27.77 | ACIS-I | 2022-10-15 | 25947 | 14.90 | ACIS-I | 2023-09-24 |
| 25907 | 36.80 | ACIS-I | 2022-11-08 | 28920 | 15.28 | ACIS-I | 2023-09-25 |
| 25973 | 18.15 | ACIS-I | 2022-11-11 | 25952 | 10.84 | ACIS-I | 2023-09-27 |
| 25930 | 19.16 | ACIS-I | 2022-11-15 | 28934 | 19.83 | ACIS-I | 2023-09-29 |
| 27556 | 24.64 | ACIS-I | 2022-11-15 | 27739 | 21.31 | ACIS-I | 2023-10-01 |
| 25951 | 28.45 | ACIS-I | 2022-11-18 | 25277 | 18.68 | ACIS-I | 2023-10-02 |