Synergy of Information in Multimodal IoT Systems - Discovering the impact of daily behaviour routines on physical activity level
Abstract
The intricate connection between daily behaviours and health necessitates robust behaviour monitoring, particularly with the advent of IoT systems. This study introduces an innovative approach, exploiting the synergy of information from various IoT sources, to assess the alignment of behaviour routines with health guidelines. We grouped routines based on guideline compliance and used a clustering method to identify similarities in behaviours and key characteristics within each cluster. Applied to an elderly care case study, our approach unveils patterns leading to physical inactivity by categorising days based on recommended daily steps. Utilising data from wristbands, smartphones, and ambient sensors, the study provides insights not achievable with single-source data. Visualisation in a calendar view aids health experts in understanding patient behaviours, enabling precise interventions. Notably, the approach facilitates early detection of behaviour changes during events like COVID-19 and Ramadan, available in our dataset. This work signifies a promising path for behavioural analysis and discovering variations to empower smart healthcare, offering insights into patient health, personalised interventions, and healthier routines through continuous IoT-driven data analysis.
Corresponding author: Mohsen Shirali (m_shirali@sbu.ac.ir)
Keywords. Behaviour Modelling, Physical Activity Monitoring, Process Mining, Synergy, Internet of Things, Smart Home, Wristband, Multimodality.
1 Introduction
The study of human behaviour has gained increasing attention, particularly within health and well-being in recent years. These fields acknowledge the close connection between human behaviour patterns and health conditions in a way that an improper lifestyle or changes in daily habits can be early indicators of diseases [1, 2]. For instance, physical inactivity stands out as a significant risk factor for certain diseases such as obesity, diabetes, and cardiovascular problems, underscoring the importance of accurately measuring activity levels to identify individuals at risk [3]. Many research studies also have proved the utility of monitoring daily activities to detect abnormal behaviours and discover deviations from typical routines, signaling early stages of health problems (e.g. dementia, Alzheimer’s, osteoporosis, arthritis) [4, 5, 6] or timely detection of hazardous incidents occurrence (such as falls) [7].
Consequently, in light of this relationship between human activities and behaviours with health conditions, global health associations and organizations regularly release guidelines to encourage people to achieve healthier physical conditions through lifestyle strengthening. These guidelines offer specific recommendations for individuals, mainly concerning quantities and frequencies of specific activities. In this context, by understanding people’s daily activities and behaviour routines, healthcare professionals can ensure individuals engage in the right activities that are conducive to their health at the right times. Therefore, a comprehensive insight into a patient’s health condition is a prerequisite for healthcare experts, if they aim to provide effective healthcare services.
The professionals can keep track of individuals’ activities to inspect whether their behaviour aligns with the health guidelines. This information also allows the implementation of more precise interventions to prevent the onset of diseases and enhance the accuracy of medical treatments [2]. Moreover, on a broader scale, tracking daily behaviours facilitates lifestyle monitoring, paving the way for offering personalised health solutions.
Daily behaviour refers to a recurring sequence of human movements, actions or gestures, and the patterns for these behaviours can provide insights into an individual’s daily routines, habits, and activities [8, 9]. Examples of behaviour patterns include sleep/wake cycles, bathroom usages, meal times, and mobility routines [10, 11]. Hence, the most common way to study an individual’s behaviour is by monitoring everyday activities. Previously, these activities were assessed manually through interviews and questionnaires, which was time-consuming and prone to errors. Luckily, the introduction of Internet of Things (IoT) technologies and the widespread use of smartphones and wearable devices have made automated monitoring feasible and accessible and benefit this process by making it more efficient and accurate [12, 13].
The main idea of IoT is to connect anything/everything (e.g., sensors, devices, machines, people, etc.) to gather intelligence from such objects [14, 15]. In this way, the IoT devices enable continuous monitoring of individuals and understanding of human behaviour, by providing valuable objective data on their activities (possibly in real-time) [13, 16]. Sensor data are collected passively without human effort; allowing users to forget about the device and continue with their day [17, 18]. Meanwhile, using data mining techniques on the collected sensor readings, different types of activities can be recognised and classified based on their unique sensor signatures and in this way behaviour patterns can be extracted.
The activities that have been explored in the literature are different from the perspective of their impact on health status, the difficulty of sensing, detecting and performing [8, 19]. Therefore, different systems consist of wearable and ambient devices equipped with various types of sensors are commonly used to identify activities and behavioural patterns. Caregivers and researchers are primarily interested in monitoring the ability of individuals to perform two sets of activity classes; Activities of Daily Living (ADLs) and instrumental ADLs (iADLs), because of their role in health management and the assessment of individuals’ ability for living independently [20]. ADLs involve self-care tasks like bathing, eating, walking and sitting, while iADLs involve activities related to interacting with the physical and social environment, such as food preparation, housekeeping, using the telephone and managing medications [12].
However, merely detecting the activities and visualising the behaviour patterns is not enough and individuals need complementary guidance and interpretation from health professionals based on the data and monitoring results. Comparing behavioural routines with desired guidelines to describe how, when, and for how long different activities should or should not be carried out helps in achieving personalised healthcare and self-tracking of adherence to a healthy lifestyle. Therefore, if IoT devices can offer comprehensive and accurate insights into human activities and behaviours, health experts can intervene and provide individualized health services. In this way, accurate recognition of activities and an in-depth and comprehensive picture of behaviour patterns with adequate reliability are essential for monitoring and analysing behaviours [21, 22]. Achieving this goal using sensors in off-the-shelf IoT devices is a significant challenge for IoT systems in the healthcare domain.
The main problem is that raw data from IoT devices often have inadequate quality and each sensor type comes with limitations in detecting the activities, which can hinder the full utilization of IoT systems and data mining potential [23]. As a result, domain experts, such as medical staff, may not fully rely on insights generated by IoT technology and its corresponding analysis and may question the credibility of these systems [24]. Moreover, the outcome of the analysis, e.g. behaviour models can be hard to comprehend due to their complexity.
This has motivated us to address the problem of using an IoT-based system for behavioural analysis. We aim to explore how understanding daily behaviour routines can assist healthcare providers in their assessment. In our research, we identify daily activities to model several routines for daily behaviour, and then investigate how these routines align with health guidelines. We have described our proposed approach for longitudinal monitoring by considering elderly care daily behaviour and lifestyle monitoring in terms of having adequate physical activity levels. We use an IoT system with several sensors to obtain a comprehensive view of human behaviours to achieve this. In addition, we utilise Process Mining techniques to highlight routine variations in a clear and understandable way for clinical staff.
Indeed, we aim to investigate how using multiple sources of data and the synergy of information from multiple data sources affects the quality and comprehensiveness of behavioural modelling. We want to determine whether this approach increases the readability and effectiveness of discovered behaviour models or adds to the complexity of the models and makes them unreadable. Thus, to address the need for continuous monitoring of behaviour routines and lifestyle, our paper contributes to:
-
•
Showing the complementary impact of using data from multiple input sources and the synergy of information to improve the efficiency of behaviour modelling
-
•
Discriminate daily behaviours based on their alignment with health guidelines
-
•
Utilising Process Mining techniques to provide insightful models of daily behaviour daily and categories to facilitate behaviour analysis
-
•
Conducting a proof of concept evaluation on a dataset collected from a real-life smart home scenario for elderly care that considers a typical health-related issue, monitoring of physical inactivity. We evaluate the effectiveness of our proposed approach in highlighting the reasons for the experienced physical activity level.
The rest of the paper is organised as follows. In section 2, some required background knowledge and related works are mentioned. Section 3 introduces the proposed approach and selected elderly care case study with detailed information on the used dataset. Then, in 4 we illustrated our experiments on the use case dataset and the results for investigation of daily routines based on location and activities are represented. A discussion on behavioural analysis is also provided in Section 5. Finally, Section 6 concludes the paper.
2 Related work
In recent years, many efforts have been made to develop IoT systems in the healthcare domain and to study human behaviours. In this section, the required background knowledge for understanding these systems and a summary of conducted research based on the type of sensors which are used in the IoT system are provided. Moreover, since process mining is the main idea and focus of this paper, the IoT systems which use this method for behaviour analysis are briefly reviewed in Section 2.2.
2.1 IoT-based behaviour analysis
With the advent of ambient and wearable sensors, many efforts have been made by the academia and industry to leverage IoT and human-centric technologies such as Ambient Assisted Living (AAL), smart homes and wearables in healthcare domain in order to address the increasing demand for higher quality of health and well-being services [15, 14, 25, 16]. These systems primarily target elderlies, patients with chronic diseases and individuals with disabilities to improve their quality of life and independence while reducing the burden on caregivers and healthcare systems. Some examples include fall detection, medication reminders, home automation, and social interaction platforms [26].
In many studies, IoT devices with built-in sensors have been used with machine learning algorithms for continuous long-term monitoring which refers to collecting data of user’s activities on an ongoing basis, without interruption or gaps in data collection [10]. Based on the collected data, the behaviour patterns (or markers) such as sleep/wake behaviours, activities or activity levels can be identified. These markers were used to predict pain [27] or mobility, cognition, and depression symptoms in older adults [6]. Additionally, the changes in behaviour patterns may also be indicative of health events or changes in health status and provide insights into how individuals with chronic health conditions manage their health [10, 28]. Also, the detection of changes in behaviour, resulted from treatment regimens for chronic conditions, could determine prescribed treatment regimen adherence and impact [29]. In the following sections, more detailed information on the benefits of using different sensors in IoT systems for behaviour analysis (Section 2.1.1) and a summary of the proposed works (Sections 2.1.2 and 2.1.3) is provided.
2.1.1 Sensor modalities in IoT systems
As mentioned, multiple sensor types have been utilised in IoT systems for behaviour monitoring so far. Ambient sensors are designed to collect data about the environment and activities within a space without requiring direct interaction or intervention from individuals. They are typically embedded or installed in everyday settings (i.e homes or buildings) and can monitor various aspects of the environment, including motion, light, temperature, and door usage. On the other hand, wearable sensors are worn by users on the body or clothes and require individuals to wear or carry them [10]. Accelerometers, magnetometers, gyroscopes, or wearable cameras besides devices to measure physiological variables like heart rate and blood pressure are examples of wearables which are used in the existing works [13, 19, 16].
Ambient sensors do not need periodic charging and have no disturbance. These sensors operate passively and unobtrusively, allowing for continuous and long-term data collection, while wearable sensors collect data regardless of the location of the user [7]. Besides, both wearable and ambient sensors have their limitations. Ambient sensors work in a limited area and using a system with pure ambient sensors is less capable of identifying detailed changes and elaborate actions. Another limitation is that they must be well-placed in the environment to record data regularly and accurately [30, 11, 31]. When the conditions are not suitable for these sensors, or they are not installed correctly, the collected data will be incomplete or incorrect [23]. On the other hand, wearable-based solutions also come with the complexity of sensor placements, higher cost, and obtrusiveness for users [32]. Also, wearables rely on battery resources and need to be correctly positioned on the body. If these two things are not done correctly, wearable-based data collection will be disrupted.
Therefore, each type of sensor has its limitations when used separately. Consequently, the challenges which both sensor types have lay the foundation to develop hybrid sensory systems to tackle these problems [13]. By combining data from multiple sources in healthcare, professionals can make more informed decisions and improve diagnostic accuracy [3]. However, utilising multiple sensors for monitoring massively increases the quantity of available data for analysis, bringing a new complexity level [31]. Regardless of the challenges for storage management, the variety and volume of data complicate the analysis process as it takes time to select the right sensor to detect a specific activity [33].
2.1.2 IoT systems with a single type of sensors
Ambient sensors have the potential to provide new insights into how individuals such as patients with chronic health conditions manage their health at home. They are used to monitor the behaviour patterns, daily routines and activities of individuals within the home areas to support timely interventions for optimal health outcomes. For example, movements, sleep interruptions, bathroom usage, and time spent out of the home are listed as behaviour markers in [10]. In this study, these behaviour markers and their descriptive statistics were calculated using sensors in participants’ homes to aid in recognising falls, bowel issues, urinary tract infections, and disrupted sleep. The results represent pieces of evidence that continuous sensor-based monitoring of patient behaviour in home settings can be used to provide automated detection of health events; the events that may be difficult to detect through traditional clinical assessments [10].
In another study [34], behaviour patterns were divided into three types; temporal, location, and frequent activity sets. This study highlights that inferred patterns can change over time due to various factors such as health conditions, new activities, and personal interests. Hence, a one-size-fits-all approach may not be effective and personalised classifiers to capture the changing behaviour patterns and timely correlations (e.g. weekly, monthly) are recommended [34].
Moreover, wearable devices are also used to provide insights into different aspects of individuals’ daily lives. An investigational method combining physiological and location data gleaned from a wristband is used in [35] to identify daily activities that participants struggled with, providing a more comprehensive understanding of the participants’ experiences. Rodrigues et al. in [36] present a review of techniques based on IoT for healthcare, based on the most recent publications and industrial products available in the market.
2.1.3 Multi-modal IoT Systems
As mentioned to overcome the challenges of different sensors and due to accuracy issues, in some health applications, systems with multi-sensor modalities have been utilised. Various data fusion methods and their applications in different areas have been proposed and reviewed so far. Pires et al in [26] built a roadmap for achieving the identification of ADLs such as walking, sitting, and sleeping, by combining data from accelerometers, gyroscopes, and magnetometers on mobile devices. In addition, a combination of RFID devices for tagging key objects and a single accelerometer on the dominant wrist was used for accurate activity recognition [12].
Also, in [7], the authors show that if different types of sensors are deployed together in a well-designed and precise manner, the system can provide better accuracy for ADL recognition and behaviour monitoring than if these sensors were utilised separately. They utilised a combination of contact sensors, thermal sensors, and accelerometers. Contact sensors were attached to objects such as doors, cups, kettles, cupboards, and containers, while thermal sensors were used to collect ambient sensor data and accelerometers used as wearable sensors.
In 2011, EMUTEM (Environment Multimodal pour la Télésurveillance Médicale) was proposed in [37] as a multimodal system for in-home healthcare monitoring. It integrates various sensors, including microphones, a wearable device (RFpat), infrared sensors, and home automation sensors, to collect elderly physiological and behavioural data, acoustic environment information, and environmental conditions. Then, each modality’s data is analysed using specific algorithms and a fusion approach based on fuzzy logic and medical recommendations are employed to combine the outputs from different subsystems. This multimodal fusion enhances the system’s reliability by detecting distress situations and offers a powerful tool for in-home health care monitoring.
In [33], a multi-sensor system was proposed to diagnose early-stage Alzheimer’s patients. This multi-sensor surveillance system integrates video recordings and accelerometer data to identify activities within a medical clinical protocol, specifically focusing on iADLs. The system aims to assess the independence, executive functions and cognitive abilities of older individuals, particularly in relation to Alzheimer’s disease. The inclusion of a wearable accelerometer improved event detection performance, and enhanced the accuracy and effectiveness of activity recognition compared to a system relying solely on video data.
In [32], wearable sensors are used to identify specific daily activities and ambient sensors are used to show the user’s daily routine at room-level. In fact, the whole task of recognising all defined activities was divided into several sub-tasks according to the room-level location information captured by infrared sensors. In this way, the computational time drops for each room-level sub-task and the recognition accuracy improves due to avoidance of misclassification for some confusing activities by separating them into different room groups.
In [38] an elderly care system was proposed, using video processing technology as the core, combined with sound, infrared, and pulse detections. The system aims to detect abnormal activities, such as falling or staying too long in the toilet and notify their relatives in case of any unexpected occurrence. Additionally, in [21], ambient and wearable sensors are used for data collection and a set of behaviour markers are extracted on a daily basis. These behaviour markers were investigated to see if they contain information about a person’s daily behaviour routine. The results of this study indicate the relation between behaviour markers and health status, so that the markers can be used to track and predict changes in health status over time.
2.2 Behaviour process mining
Typical pattern recognition algorithms use computational techniques to identify common patterns in datasets, leading to mathematical representations or models. While they have achieved high accuracy in modelling human behaviour, the complexity of these models makes it difficult for experts to understand and correct them. In the healthcare domain, understandability is the key and understandable data-driven systems are more preferred since they allow the expert to understand the reasons behind the system’s recommendation and provide clues for better decisions in daily practice [39].
Process Mining (PM) is a discipline that provides a set of tools to discover human-understandable models from event logs 111Event log is a set of events within a time interval with every single event occurred at a given point in time [40, 41].[41]. In fact, the goal of process mining is to turn event data into insights and actions and its algorithms are able to maximise the understandability of the models inferred [39].
A process is an ordered series of activities that are executed (repetitively) with the aim of achieving a specific goal. Thus, the notion of the process can be leveraged to describe most of the behaviours we adopt in our daily life [42]. Therefore, it is possible to create a simplified graphical model of human activities on a daily basis by using process mining techniques on data collected from sensors. In this way, graphically understandable representations of human behaviours will be extracted and since they can easily be understood by human experts, the PM-discovered models offer valuable insights into specific behaviour patterns [2].
In addition, when a reference model is available, conformance-checking techniques in PM can be applied to assess individuals’ daily routines in satisfying a particular goal, discover the deviations in doing the activities and even verify the possible ignorance of specific steps. PM techniques support individual behaviour analysis not only for detecting behavioural changes but also to offer a human-understandable view of the real changes of a user [43].
The applicability of different PM algorithms to create behaviour processes is reviewed in [2]. Heuristic Miner [44] takes the less frequent transition out from the graph to simplify the state transition model, which represents behaviours and the Fuzzy Miner [45] can also be used to provide a more intuitive visualisation in a cartographic manner. In addition, Lull et. al in [46] applied an interactive process mining system on data obtained from PIR sensors installed in a solo-resident house. The location of the person in different areas of the house is considered as different activities and then the PALIA [47] algorithm is used to model the transitional events inside a house in a TPA [48]. The results of this study highlight that with the comparison of daily TPAs, it is possible to study the behaviour changes and intra-subject variabilities.
Therefore, the results of initial experiments demonstrate the usefulness of process mining techniques in creating graphical insights into human activity in a smart home environment [2]. However, the applicability of PM techniques on multi-modal datasets to merge data from multiple sources and to discover behaviour processes which represent the insight from all sensor modalities has not been investigated yet, and we are proposing this idea in the rest of the paper.
3 Behaviour analysis and the elderly health monitoring case study
Our proposed approach aims to tackle the issue of using IoT systems for behavioural analysis. It involves using well-known health measures to group daily data into several days with labels representing alignment with health guidelines, like healthy and unhealthy labels). We will then investigate the impact of different behaviour routines on pursuing a healthy regime and achieving health goals, and whether they align with health guidelines. The behaviour routines are modelled and extracted based on the daily activities and movements of a subject, , making them highly representative of the habits and characteristics of that person.
It is important to note that daily routines can change over time due to changes in behaviour (intentionally or unconsciously), health-related issues, or external factors and occasions. These behaviour changes will result in different variants in behaviour models, which can be challenging to identify if the changes are insignificant. In this section, we will first provide an overview of our proposed approach and then describe the specifics of the behaviour monitoring case study that we have chosen for evaluation.
3.1 The proposed Behaviour analysis approach
The proposed behaviour analysis approach aims to explore how understanding daily behaviour routines, using IoT-based systems, can assist healthcare providers in their assessment.
To gather information about individuals and their surroundings during daily activities which possibly affect behaviour routines, our first step involves deploying an IoT system equipped with various sensors and devices. This system, designed to be multi-modal, taps into different sources to offer a more complete understanding of an individual’s actions and their environment. Picture it like having a team of sensors, each providing a unique perspective on what’s happening. By aggregating these diverse viewpoints and leveraging the synergy of information, we create a holistic and comprehensive picture of the person’s behaviour and surroundings. This approach allows us to capture a richer and more detailed dataset, providing a solid foundation for our behaviour analysis.
The second step involves using a specific measure that indicates the alignment with health guidelines, as a marker to distinguish between healthy and less healthy behaviours. To achieve this, we establish distinct groups based on how well behaviours align with these guidelines. We sort behaviours into different categories – one (or more) categories for behaviours that comply with the guidelines, and other categories for those that may deviate (based on their distance from the expected healthy pattern). We then apply this grouping to instances of behaviour routines, like daily or weekly activities, based on the health measure values gathered in our data. It’s essential to choose health indicators that are regularly monitored, allowing us to consistently categorise behaviour routines. For example, if we have daily measurements, we can evaluate daily routines, while weekly measurements enable us to assess weekly behaviour patterns. By systematically comparing and studying behaviour routines over different periods, we gain insights into how these routines influence health outcomes.
Thirdly, we discover behaviour models for each set of behaviour routine instances, categorised based on the defined health measures. We consider all of the traces and their corresponding behaviour models in each category together to understand the patterns for each group better. Next, using the data gathered from our multi-modal IoT system, which captures various aspects of an individual’s actions, we conduct multi-dimensional clustering. This involves looking at different types of events recorded by our system, like location and activity, and linking them together based on their time correlation. In fact, multiple event types describes a single behaviour, which assists us in acquiring multiple models for every single behaviour routine, highlighting more information to create comprehensive behaviour models. This approach lets us consider the various facets of a person’s behaviour in an interconnected way. Leveraging Process Mining techniques, particularly the PALIA algorithm, aids us in creating easy-to-understand models, in the form of TPAs. The TPAs, equipped with heatmaps representing duration, not only reveal differences between routines but also present these differences in a clear and understandable manner for healthcare professionals.
For instance, the behaviour models can focus on two crucial aspects: the location of the person and the activity they are engaged in at a given time. Through the PALIA algorithm, we separately analyse the location and activity events in our dataset to form behaviour models. Clustering comes into play to identify similarities within each health-related group, helping us uncover similarities and dominant events that define a particular class more accurately. The duration and frequency of events within these models influence the meaning of processes, shaping the corresponding behaviours and the variations. By closely examining behaviour models we gain insights into which activities and routines contribute to the variations and which variations align more closely with physical health guidelines. This method provides a detailed understanding of the differences within behaviours, guiding us in pinpointing elements that are most beneficial for health.
Ultimately, it is essential to present the outcomes of data analysis in a clear and understandable format for further review by experts. The extracted insights only become valuable when they can be comprehended by individuals and utilised for informed decision-making, without the need for extensive data knowledge. To achieve this, our proposed approach prioritises visual clarity, opting for Process Mining (PM) techniques renowned for their ability to communicate findings straightforwardly. Our contribution extends to this visualisation aspect by adopting an iconic representation of behaviours instead of relying on numerical data, with colours indicating durations for easy interpretation. Since we are exploring behaviour variations, presenting these differences over time through a timeline view of the behaviour instances serves as an effective solution. This user-friendly tool aggregates all the insights, utilising icons to represent the main characteristics of behaviour classes. This visual representation acts as a powerful aid for healthcare staff, by aggregating all the insights.
In summary, to analyse individuals’ behaviour and their impact on health based on the proposed approach, the following steps are needed:
-
1.
Utilise a multi-modal IoT system with various sensors for logging data during daily activities,
-
2.
Use a health metric, defined by the guidelines, to categorise behaviour routines into groups aligned with health guidelines,
-
3.
Discover behaviour models for the instances in each categorised behaviour routine, considering various aspects and leveraging multi-dimensional clustering,
-
4.
inspect the clusters to discover their similarity and differences and extract clusters’ main characteristics,
-
5.
visualise the result in an understandable manner to showcase behaviour variations over time.
In the following section, we are going to investigate the feasibility and the effectiveness of our proposed approach in discovering insights by applying it to a case study to analyse behaviour routines and highlight daily variations.
3.2 Elderly care behavioural monitoring case study
To empirically validate our proposed approach, we conducted an in-depth case study utilising an IoT dataset that refers to the behaviour of a 60-year-old woman living independently in her apartment [49]. The components which are used for data collection are the ambient sensors installed in the house, a wristband and a smartphone.
3.2.1 Data Collection
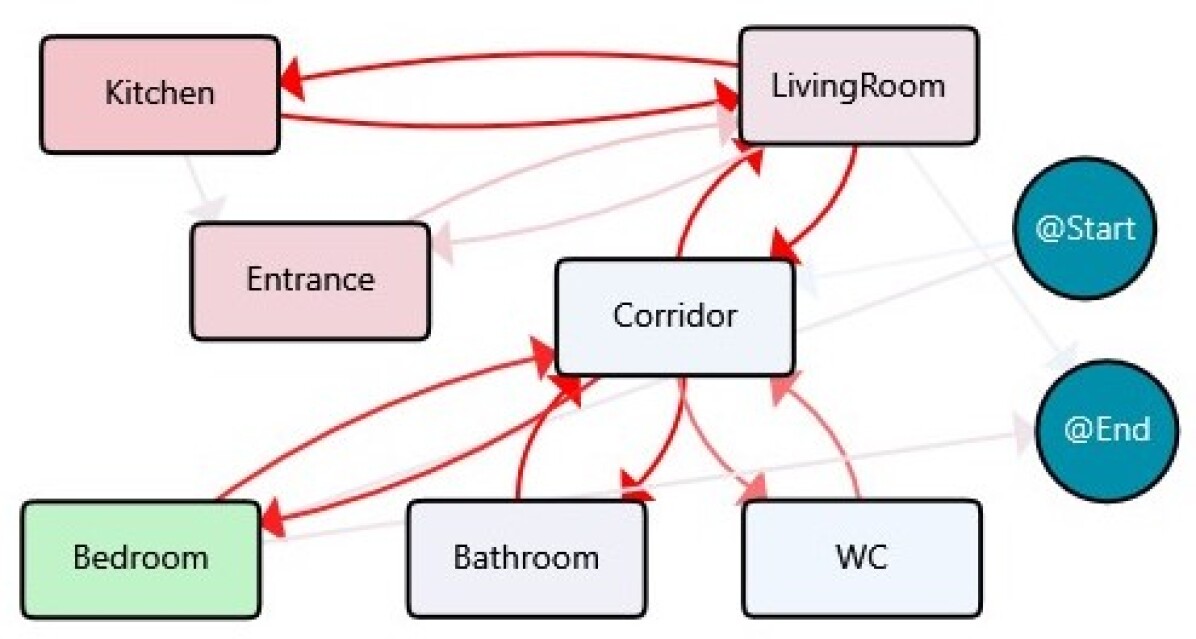
The sensors in the house are used to perceive the environment, e.g. the activities performed by the resident, during the day. The installed devices are 15 binary sensors positioned on furnishing elements, appliances, and doors. Indeed, the ambient sensory information includes readings from multiple PIR sensors showing the presence of the subject in different areas of the solo-resident house (including Bedroom, LivingRoom, Kitchen, Entrance, Corridor, Bathroom and WC) and some activities performed in these areas (like praying or using telephone), a power usage sensor indicating TV usage, contact sensors highlighting the opening and closing of the Bathroom, WC and closet doors and a gas detection sensor detecting cooking activity. In addition, with the aid of a mobile application, smartphone usage information is collected to show the timestamps of mobile usage and the names of the used applications. Also, the subject wore a wristband (Xiaomi Mi Band-3) during the data collection and it was used to obtain daily walking steps, active time and sleep-related data such as night sleep time, duration and quality.
All of the data modalities were collected for 146 days between January 9th, 2020 and June 2nd, 2020. During this time, several exciting events occurred, which are likely to have influenced the resident’s behaviour. On the 35th day, there was heavy snowfall, which led to a power outage that lasted for several hours. On the 40th day, the COVID-19 pandemic started, and the region went into lockdown. Additionally, from the 109th day to the 137th day, it was the month of Ramadan, a religious month for Muslims. During this time, the resident likely changed her habits, such as meal times, praying times and duration, and sleeping intervals, due to fasting from sunrise to sunset.
3.2.2 Dataset pre-processing and event log
The ambient sensors have collected data about the daily activities and the location of the user, in the form of a sensor log. Each event represents a measurement taken by a sensor and includes the record timestamp, sensor name, and value (i.e. the measurement of the sensor, on/off state). Since the objective is to monitor the behaviour of the subject at the level of activities executed during the day, the dataset requires some abstraction. The dataset includes sensors’ raw readings at a low level of abstraction representing the presence of the subject near the appliances, the open or closed state of doors and the use of the stove. We pre-processed the raw data and lifted the abstraction level of sensor data to recognisable activities and events according to the subject’s presence in different locations of the house by looking at the areas in which sensors are mounted. In this way, we can detect events related to the visited home locations and activities for the entire dataset period.
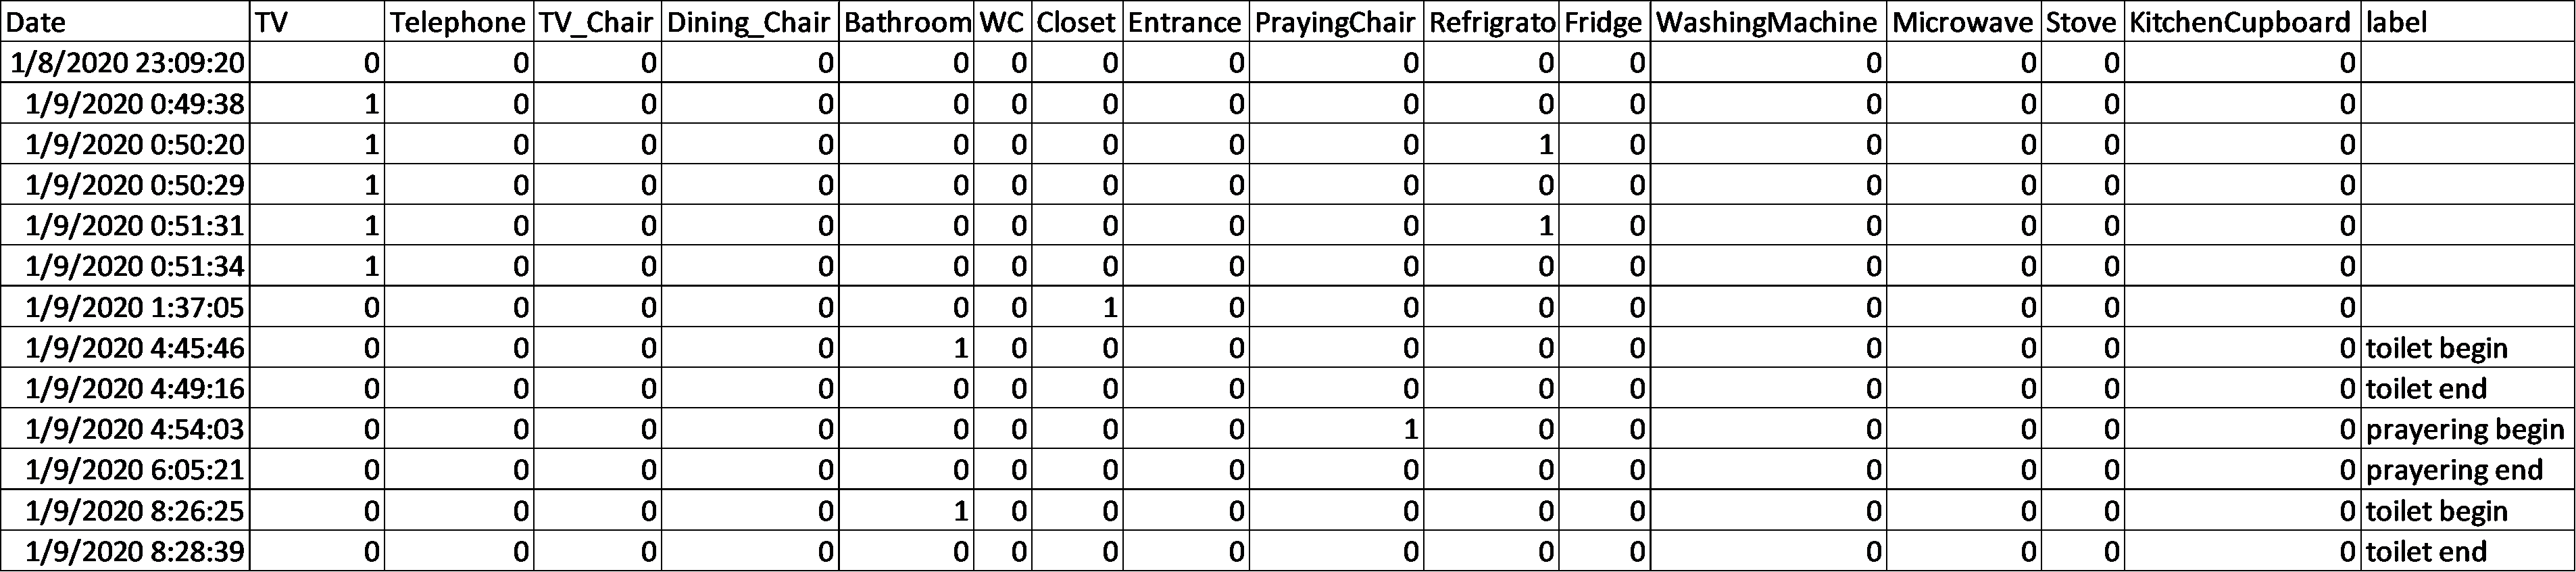
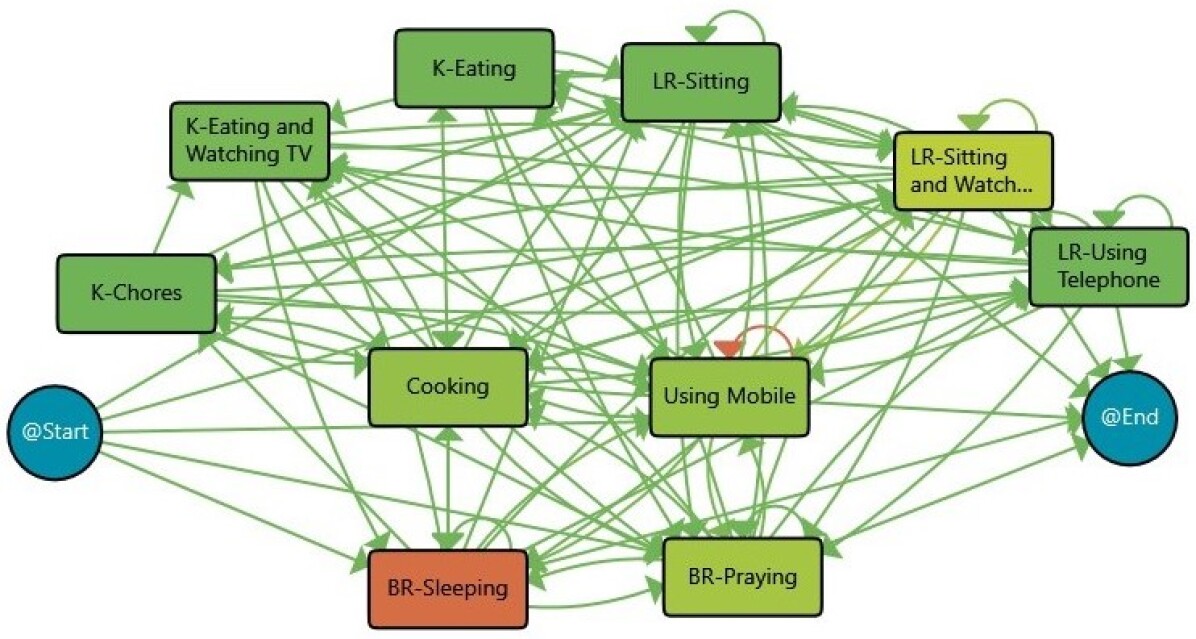
Furthermore, in order to use Process Mining techniques on this dataset, an event log including the records with Case ID, activity name, start timestamp and end timestamp is required. We used the abstracted events resulting from raw records of PIR sensors to create this event log. The mobile usage events from the smartphone log were also inserted into this event log, while the names of applications were replaced with their respective categories. Later, based on the objective of this article for using activities for behaviour analysis, all the events related to it were labeled as ”UsingMobile”. This re-labelling helped to reduce the complexity and number of nodes in the process maps as well as to treat all mobile usage events as similar behaviours. We then added information from the wristband (sleep times, active time and daily steps) to create a single multi-modal IoT dataset, after cross-checking the events and removing the noises and missed events, by conducting the method proposed in [23]. At the end, the event log includes location events from seven different locations: Bedroom, Bathroom, WC, Corridor, LivingRoom, Kitchen and Entrance and the activity events are eating, eating and watching, chores, sitting, sitting and watching, using the telephone, praying, sleeping and using mobile.
Since we are only analysing a single subject (case) in this scenario, we will examine daily behaviour models by considering dates as case IDs. This will enable us to discover a process map for each day. It is important to note that we have trimmed the events that started on one day and ended on the next day at midnight and split them into two events. As a result, we have collected events for each day from 00:00:00 to 23:59:59. A part of the sensor log, the extracted location events and the final resulted event log after integration of mobile usage and wristband events are represented in Figure 1.

4 Behaviour Analysis based on Physical Activity Levels
As explained in the Section 3.1, in order to implement the proposed approach, it is necessary to group the behaviour routines into separate categories or classes based on their characteristics or a measurable parameter, such as healthy or unhealthy routines. This categorisation enables us to distinguish between the routines belonging to different classes and identify the dissimilarities between them.
Regular physical activity is one of the critial factors in prevention or treatment of diseases, as well as enhancing overall public health and well-being [50, 18]. Thus, an individual’s level of physical activity can serve as a useful indicator of their lifestyle and health condition. Therefore, to show how our proposed approach works, physical activity is considered as a parameter to determine different healthy and unhealthy groups and we aim to explore how daily behaviour routines impact reaching desirable physical activity levels for maintaining good health. To achieve this, we investigated the physical activity levels for various days and identified the differences in daily behaviour routines that could contribute to these levels. We conducted a two-dimensional clustering to provide behaviour models with detailed information. The steps for the proposed approach are as follows:
-
1.
Define three levels for physical activity, “Insufficient”, “Sufficient” and “Desirable”.
-
2.
Use a physical activity-based marker (like daily steps) to determine three levels of physical activity and define up and down thresholds for each level.
-
3.
Assign a label for physical activity level to each day within the experiment period using the thresholds on the values of the activity marker for that day.
-
4.
Group together the days with identical labels.
-
5.
Use a process discovery technique (PALIA) on location and activity events to discover separate process models for each group.
-
6.
Use a clustering technique (QTC algorithm) to cluster the days of each group based on the events related to the locations and activities.
-
7.
Analyse the location and activity clusters’ process maps to discover the dominant characteristics and behaviours of each group.
By following this approach, we can determine what types of activities and daily routines are more effective in increasing or decreasing the daily physical activity level and, therefore, are more useful for physical health.
4.1 The levels for physical activity
The number of steps taken each day is an appropriate indicator to measure physical activity. Thanks to the progress of IoT and wearable devices this parameter can be easily monitored with a simple wristband. This makes it easy to track whether a person is following a healthy regime and lifestyle. Health experts suggest that healthy adults should aim for 4,000-18,000 steps per day and a target of 10,000 steps per day is reasonable to help reduce the negative effects of prolonged sitting and sedentary behaviours on health.
We analysed the daily steps data (measured by the wristband in our dataset) to assess the level of physical activity on a daily basis. To categorise physical activity level, we determined two thresholds based on recommended daily step counts and the range of values in our dataset. Hence, the three following levels are considered for physical activity:
-
•
Insufficient Level. for daily steps less than 4000,
-
•
Sufficient Level. for daily steps between 4000 to 10000, and
-
•
Desirable Level. for daily steps more than 10000.
Figure 2 shows the distribution of values for daily steps over 146 days, along with two guidelines representing the thresholds of 4000 and 10000 for the three levels of physical activity.
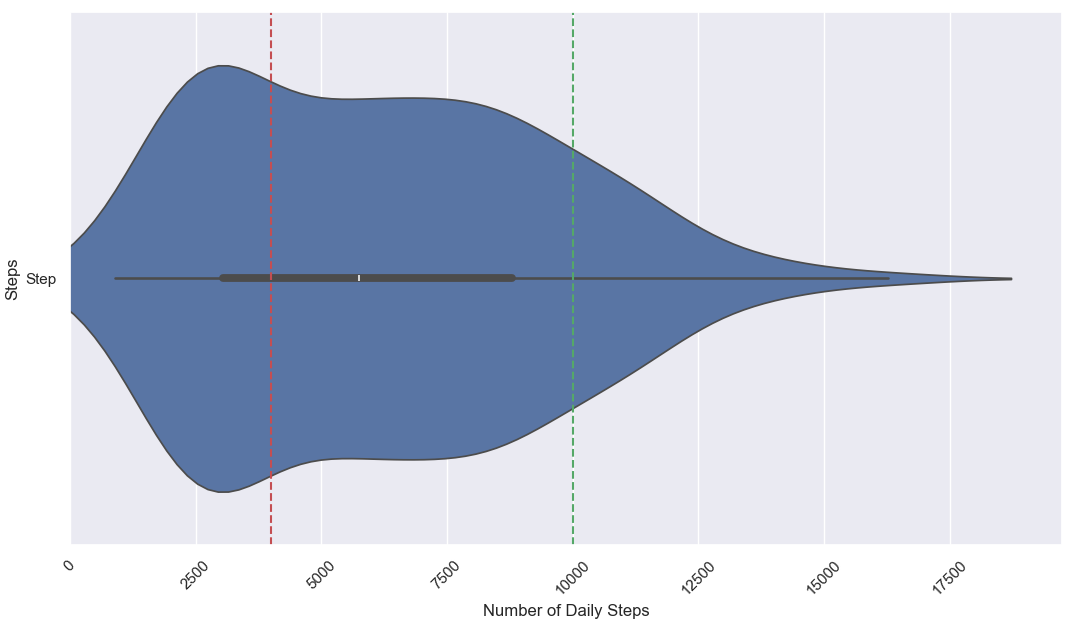
Using these thresholds, we categorised daily steps into three levels and assigned a label to each day based on its level. This allowed us to divide the days of our experiment into three groups: Insufficient (50 days), Sufficient (74 days), and Desirable (22 days), each representing a different level of physical activity.
4.2 Discovering behavioural routines for physical activity level groups
The PALIA is one of the process discovery algorithms that has been used successfully with Indoor Locations Systems and smart homes to analyse people’s movements and for behaviour monitoring [46, 43]. It utilises various techniques for syntactical pattern recognition to generate a readable model of the process in the form of a formal automaton called timed parallel automaton (TPA). In our case study, we have employed PALIA to model the processes of location and activity events for each group.
We then clustered the days in each physical activity level group into multiple clusters based on the similarity of their process models and extracted the main behavioural characteristics of the days within each cluster. By clustering the process models, we are able to group the most similar location/activity behaviour patterns together, and then the models of clusters are used in association with statistical analysis to inspect the possible correlation between behaviour patterns and physical activity levels.
In this regard, the Quality Threshold Clustering (QTC) algorithm is utilised to cluster the discovered behaviour process models. For location-based process models, the similarity and join parameters of 25% and 5% are used, respectively, to create the clusters. However, for activity-based clusters, due to the higher variation of activity routines, higher values of the similarity parameter are used in the clustering algorithm to limit the number of resulting clusters. In the following sections, the results of discovering the location and activity-based process models and their clustering are presented.
4.2.1 Group 1: Insufficient physical activity level clusters and main routines
This group pertains to the 50 days where the subject did not cover the required 4000 steps and her physical activity was not enough. Therefore, we analyse the daily behaviour routines of these days to understand the activities and the areas of the house that the subject spent time on to identify the patterns responsible for the lack of physical activity.
4.2.1.1 Location-based clustering
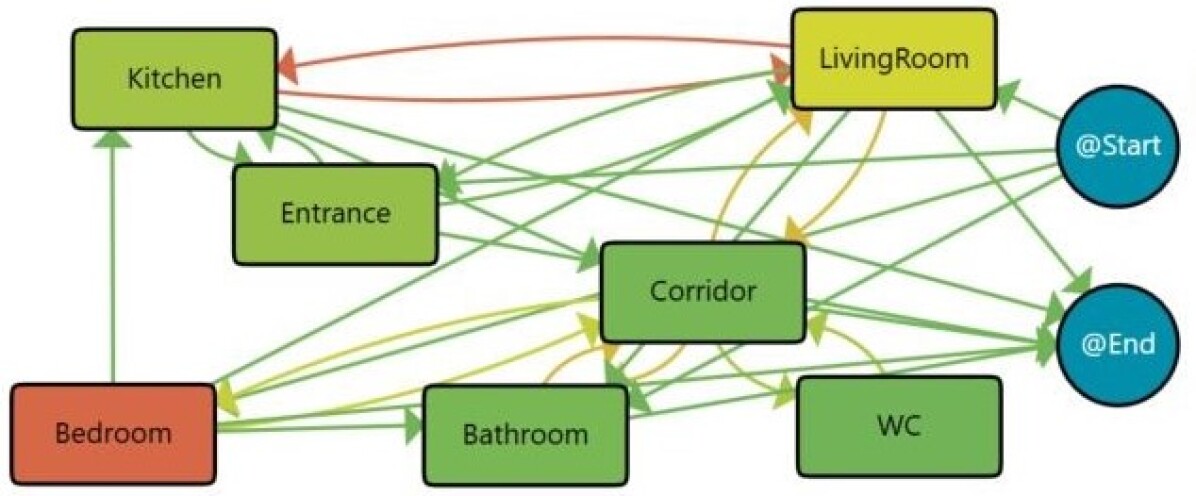
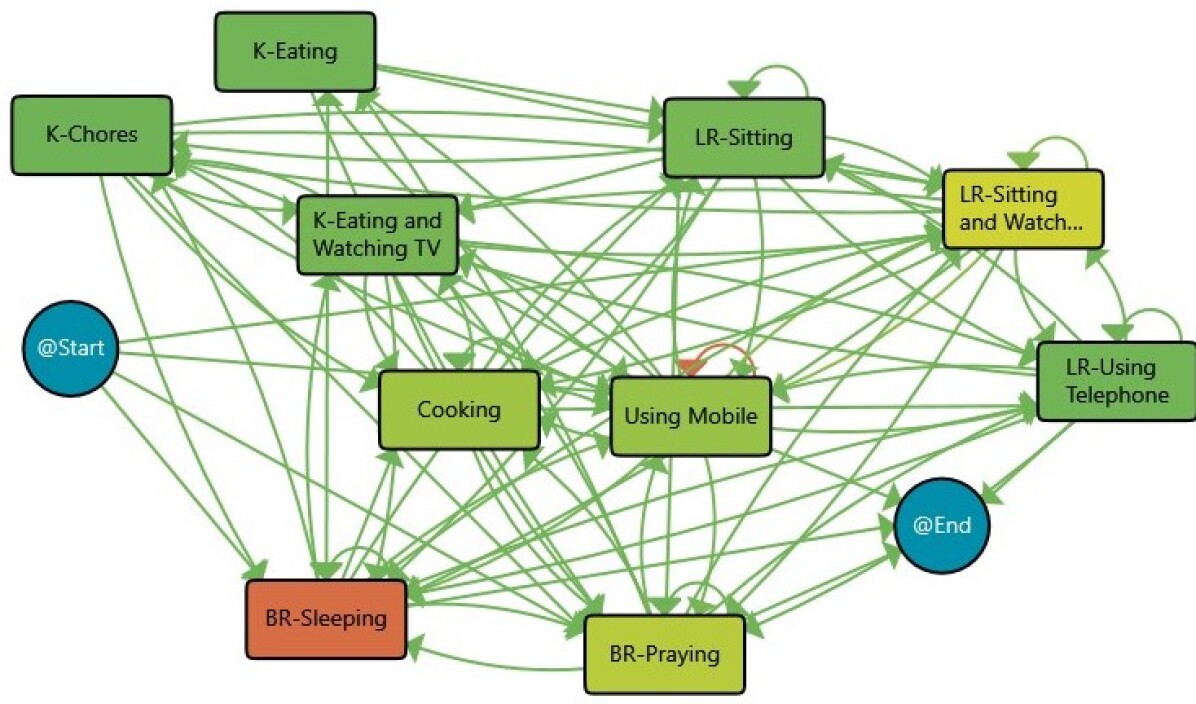
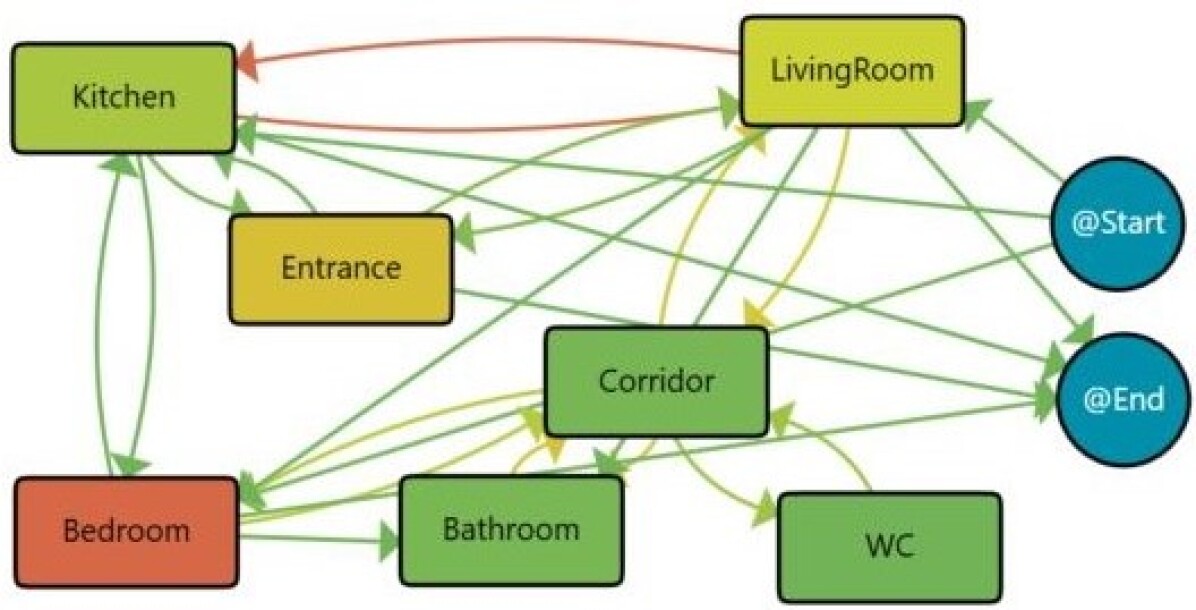
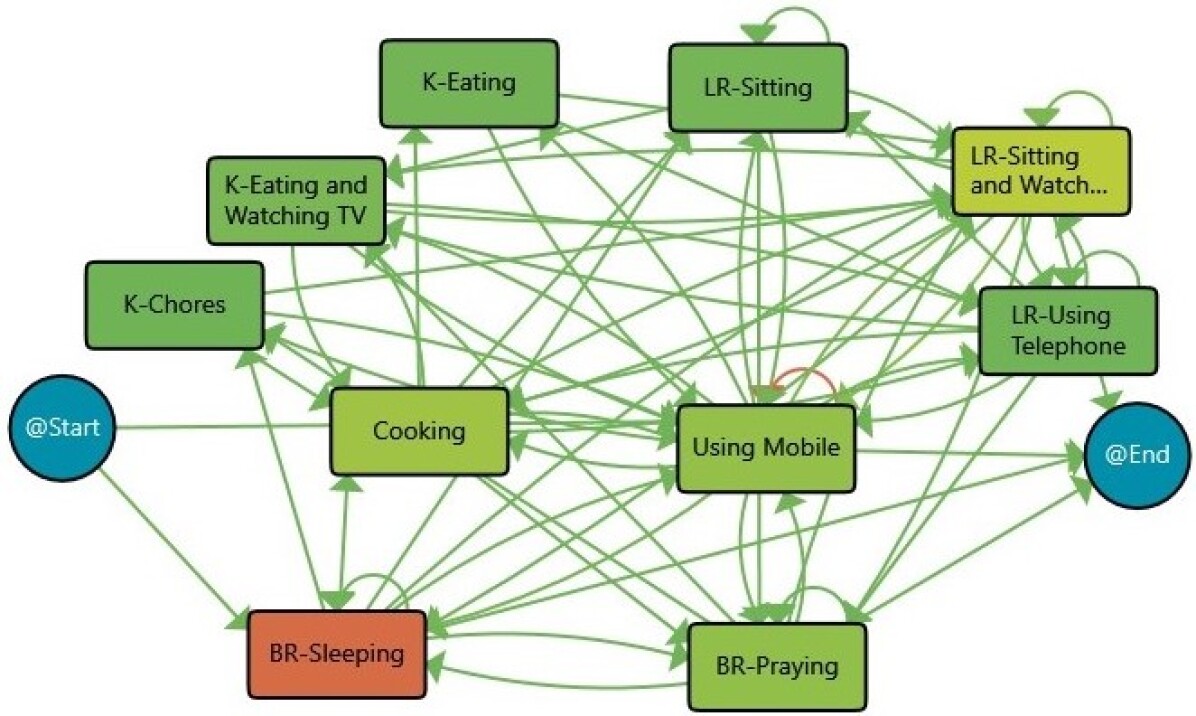
The process model based on the location events by considering all of the 50 days within the insufficient physical activity group is illustrated in Figure 3(a). It is apparent that the person mostly spent her time in the Bedroom (half of the day) and the LivingRoom is the second most stayed place. Additionally, there were many transitions observed between the kitchen and the LivingRoom.
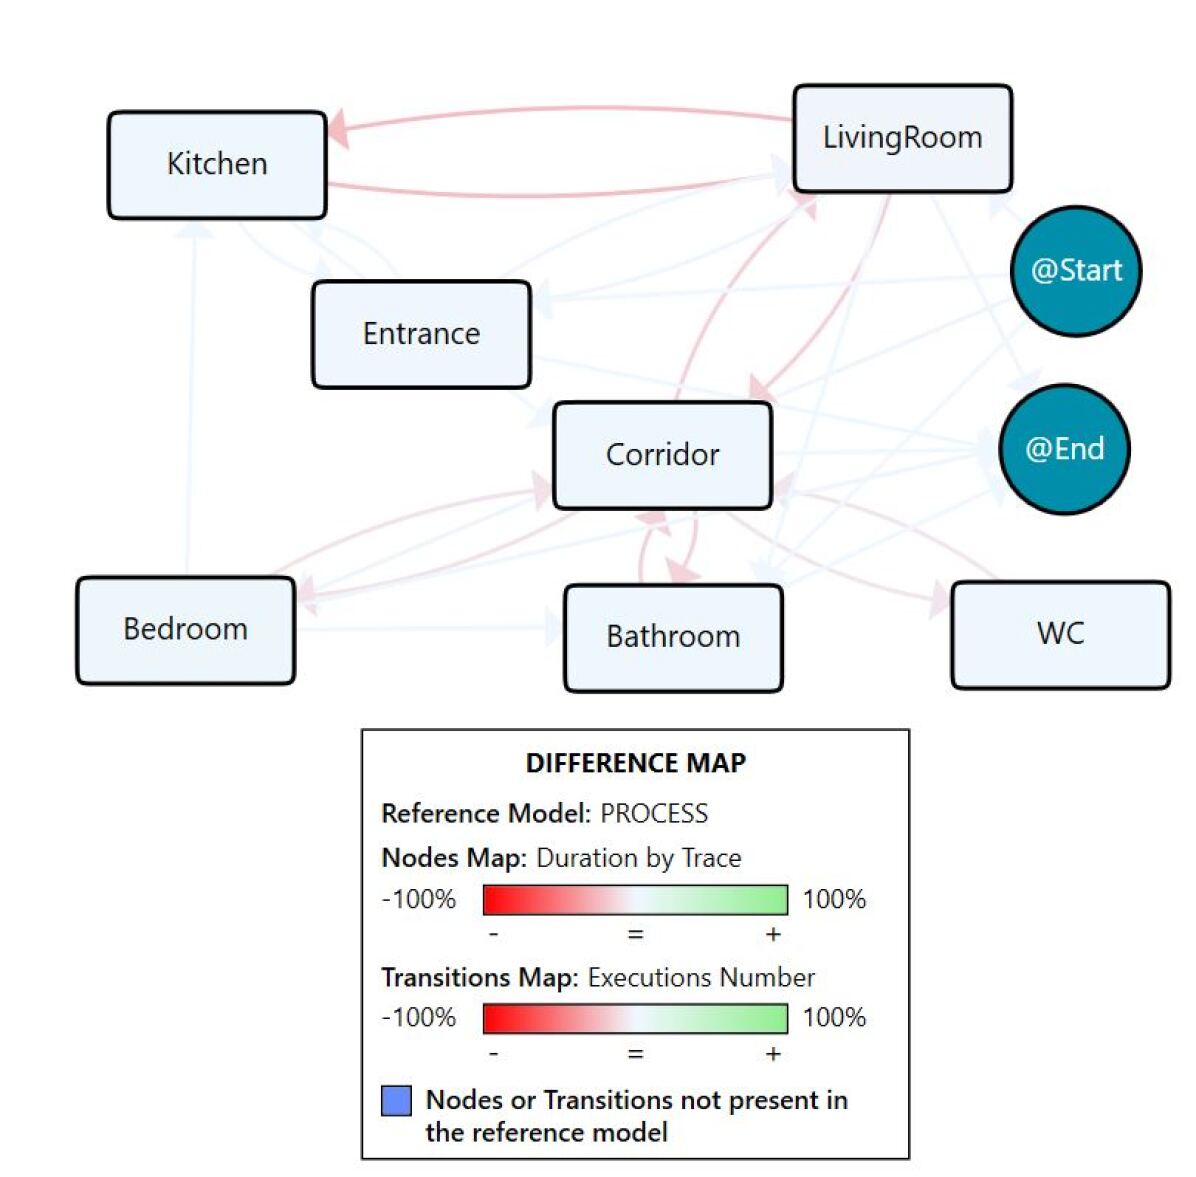
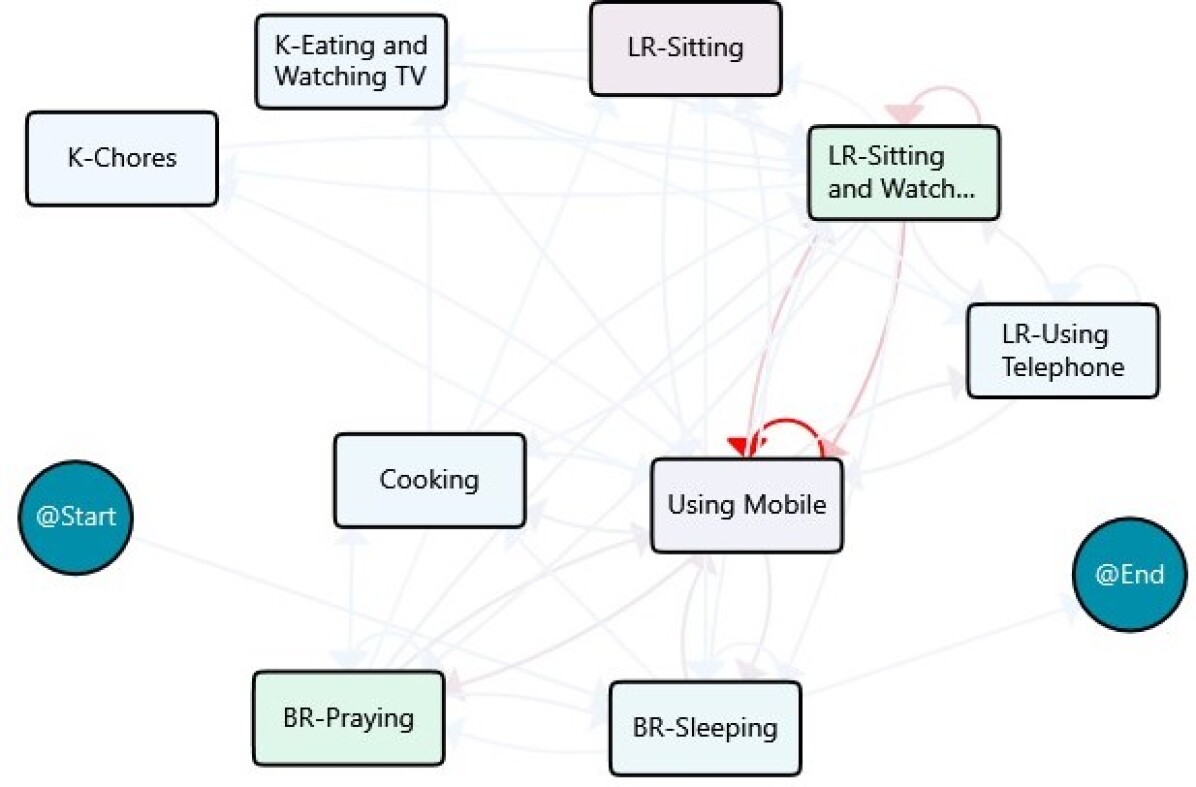
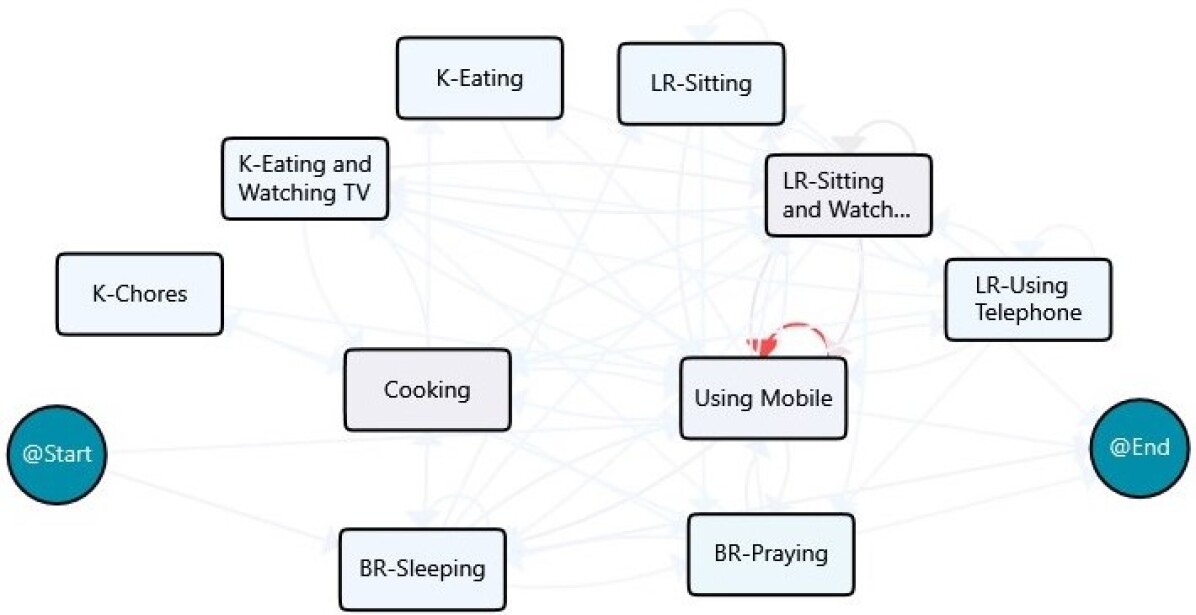
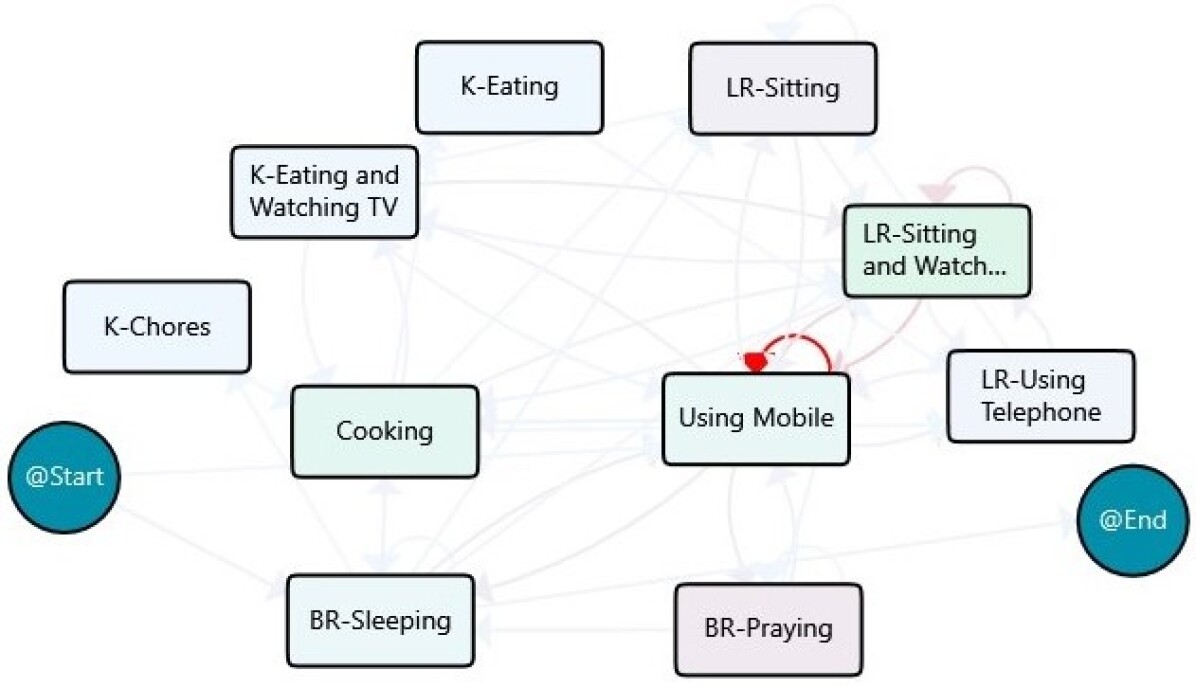
The location-based process maps within the insufficient physical activity level group are clustered into two main groups of 38 days and 6 days while the other 6 days are ignored and labelled as outliers due to their lack of similarity with other models. The process maps for these clusters are presented in Figure 3(b) and 3(c), and the primary characteristics and followed routines for each cluster are summarised in Table 1. It should be noted that the nodes and transitions in the cluster maps are coloured relative to the basic location process map.
The difference between process maps and statistics of these two clusters highlights that for the days with insufficient physical activity, we have a pattern related to the Insufficient-L1 cluster, which subject spent almost more than 12 hours of the day in the Bedroom and about two hours out-of-home. On the other side, for the days in the Insufficient-L2 cluster, the behaviour pattern is different and the times for these places decreased, and instead, time spent at the LivingRoom ( hours) and Kitchen ( hours) almost increased by 25% and 15%, respectively. In addition, the transitions between almost all areas of the house are decreased in relative to the basic model. Therefore, the proportion of the day that the person went out and was active was small compared to the proportion that was at home.

| Cluster | No. of Days | Main Characteristics |
|---|---|---|
| Insufficient-L1 | 38 | Bedroom H, LivingRoom H, Kitchen H and out-of-home H |
| Insufficient-L2 | 6 | Bedroom H, LivingRoom H, Kitchen H and out-of-home H |
| Outlier | 6 | No specific pattern |
4.2.1.2 Activity-based clustering
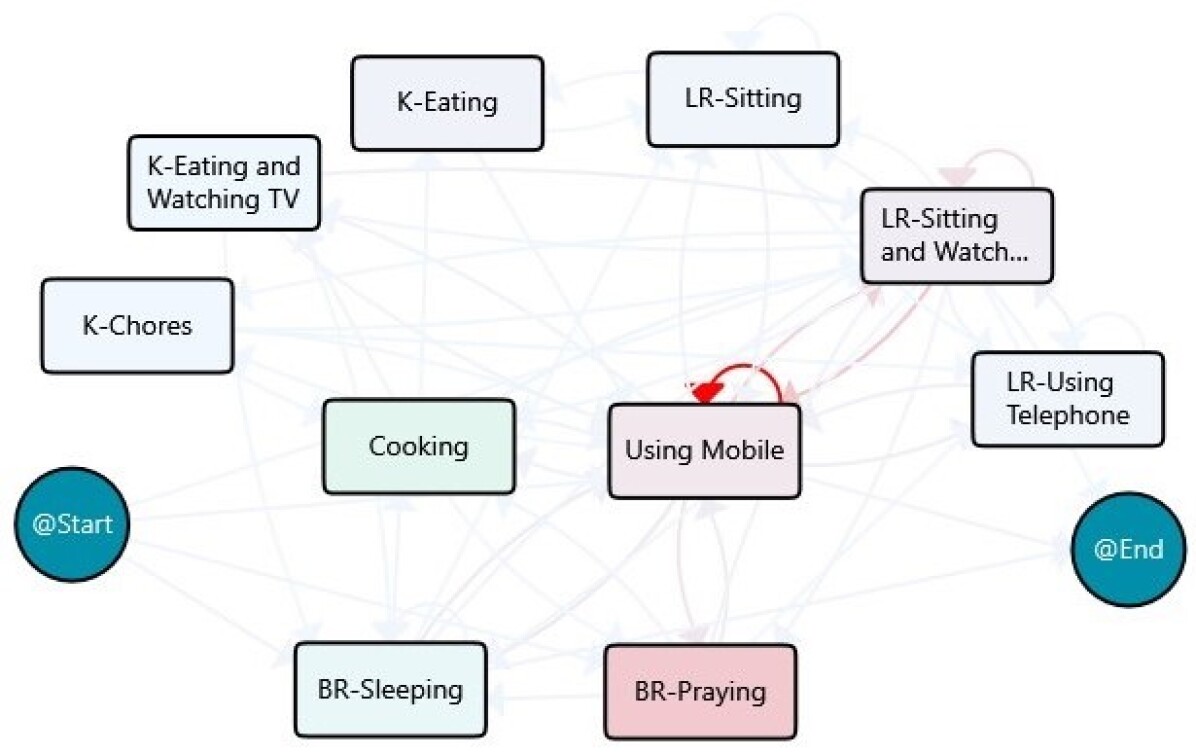
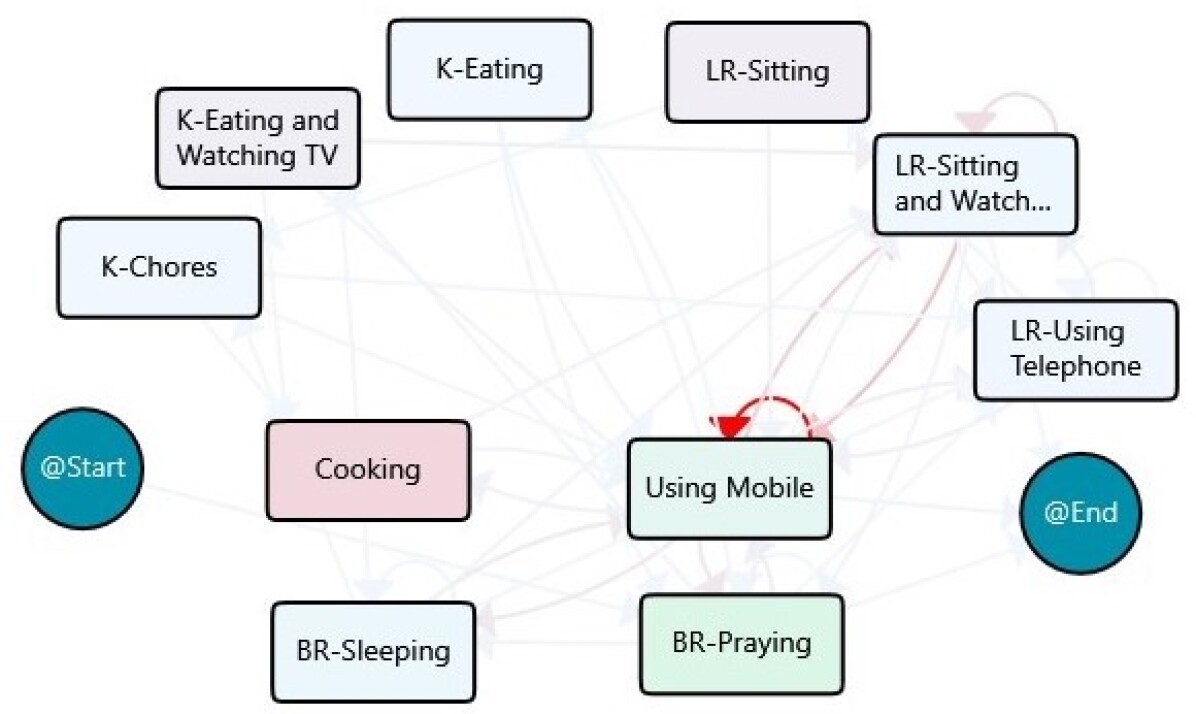
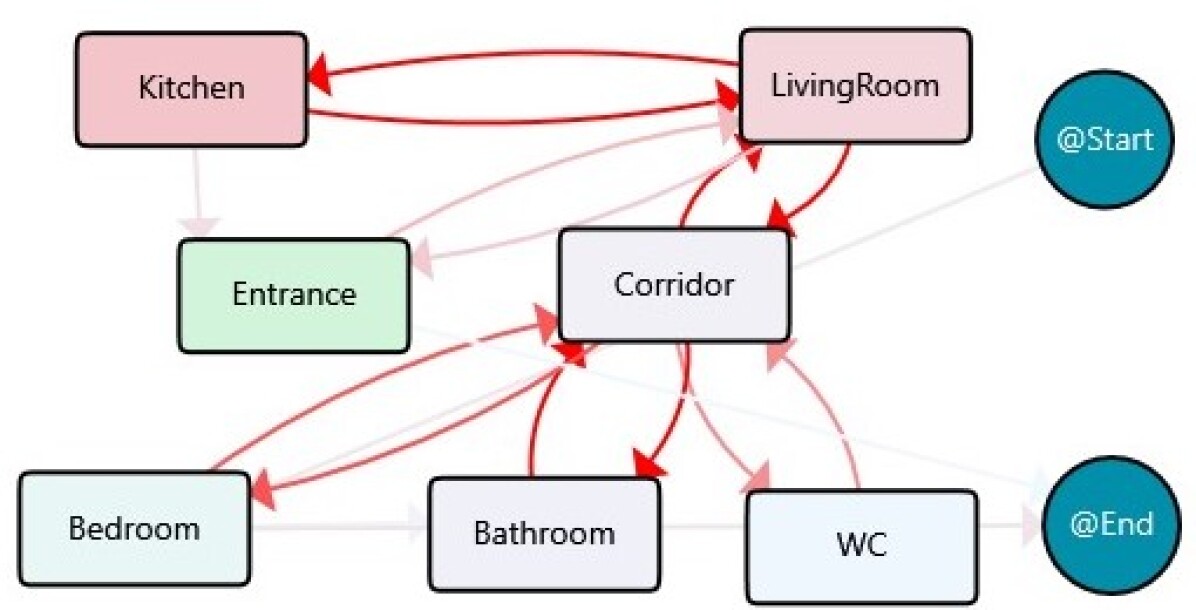
The process model based on activities for the Insufficient group is also discovered in order to give an insight into the impact of different activities on physical activity. The result is provided in Figure 4 and Sleeping is the most frequent activity in this group.
The clustering based on activity process maps also divided the days with insufficient activity levels into two main clusters (the clustering was based on similarity and join parameters of 35% and 5% respectively). One cluster had 31 days, another cluster had 6 days, and 13 days remained unclustered. Figure 4 displays the process maps for the derived clusters, and Table 2 outlines the main characteristics of each cluster. Both clusters show that the subject slept for about 8 hours and spent approximately 2 hours Cooking and 1.5 hours using her smartphone. However, the second cluster had more time allocated for Praying and Watching TV.

| Cluster | No. of Days | Main Characteristics |
|---|---|---|
| Insufficient-A1 | 31 | Sleeping H, Praying H, Watching TV H, Cooking H and Using phone H |
| Insufficient-A2 | 6 | Sleeping H, Praying H, Watching TV H, Cooking H and Using phone H |
| Outlier | 13 | No specific pattern |
The location and activity-based clusters clearly highlight that on days which are recognised as days with insufficient physical activity, the subject was mostly inactive throughout the day. She spent the largest portion of the daytime in a sedentary state, engaging in activities like Sleeping and Sitting (for Praying and Watching TV) and only leaving the home for a short period. Additionally, the transitions inside the home were also low and these routines are aligned with the expectations for the days with insufficient physical activity.
4.2.2 Group 2: Sufficient physical activity level clusters and main routines
The same approach for clustering based on locations and activities is also applied to the 74 days with the label of sufficient physical activity level, the day with values between 4000 and 10000 for measured daily steps.
4.2.2.1 Location-based clustering
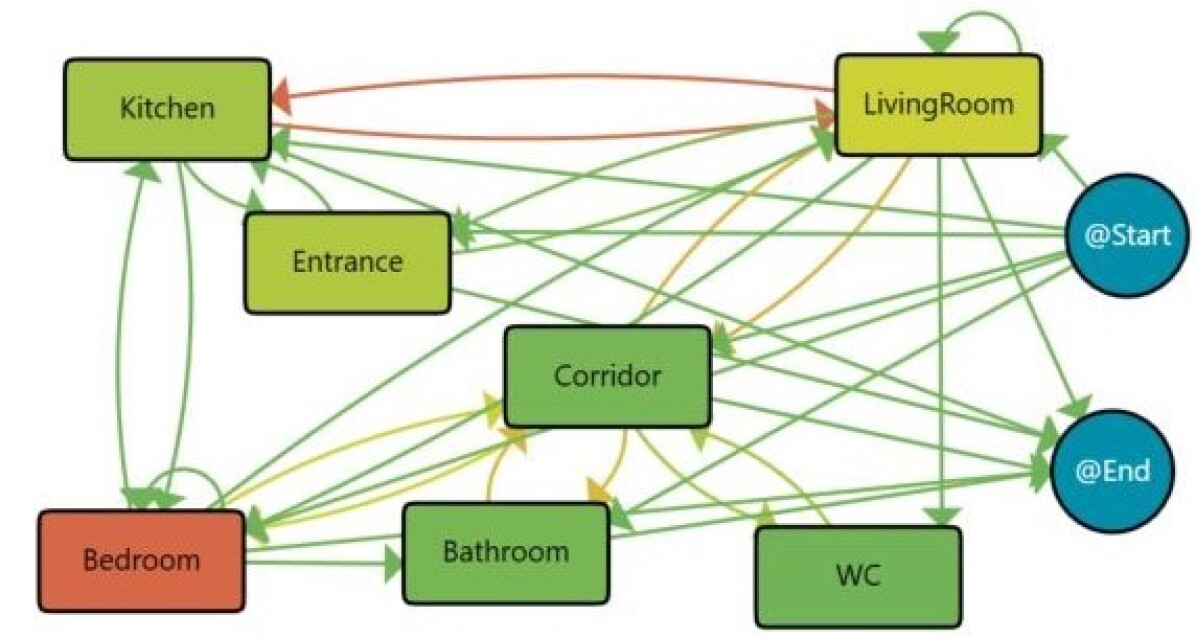
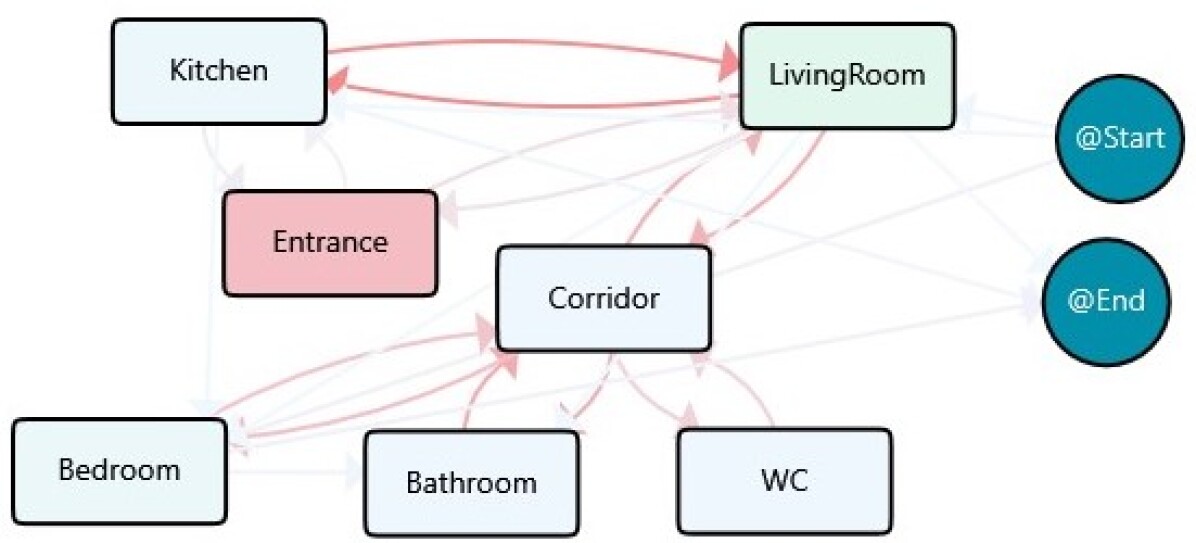
The extracted location-based process map for the Sufficient group is illustrated in Figure 5(a). According to the TPA model, the days within the sufficient physical activity group follow the daily routines that the most time is spent in the Bedroom, LivingRoom, Entrance (outside of the home and Kitchen respectively. Similar to the preceding group, frequent transitions between the Kitchen and the Living Room are evident.
The location-based process maps associated with the days exhibiting sufficient physical activity levels are grouped into three primary clusters, with 53 days, 6 days, and 4 days. Conversely, the remaining 11 days are categorized as outliers. Figure 5(b), 5(c), and 5(d) show the process maps for these clusters, while Table 3 provides a summary of the key characteristics and routines followed in each cluster.
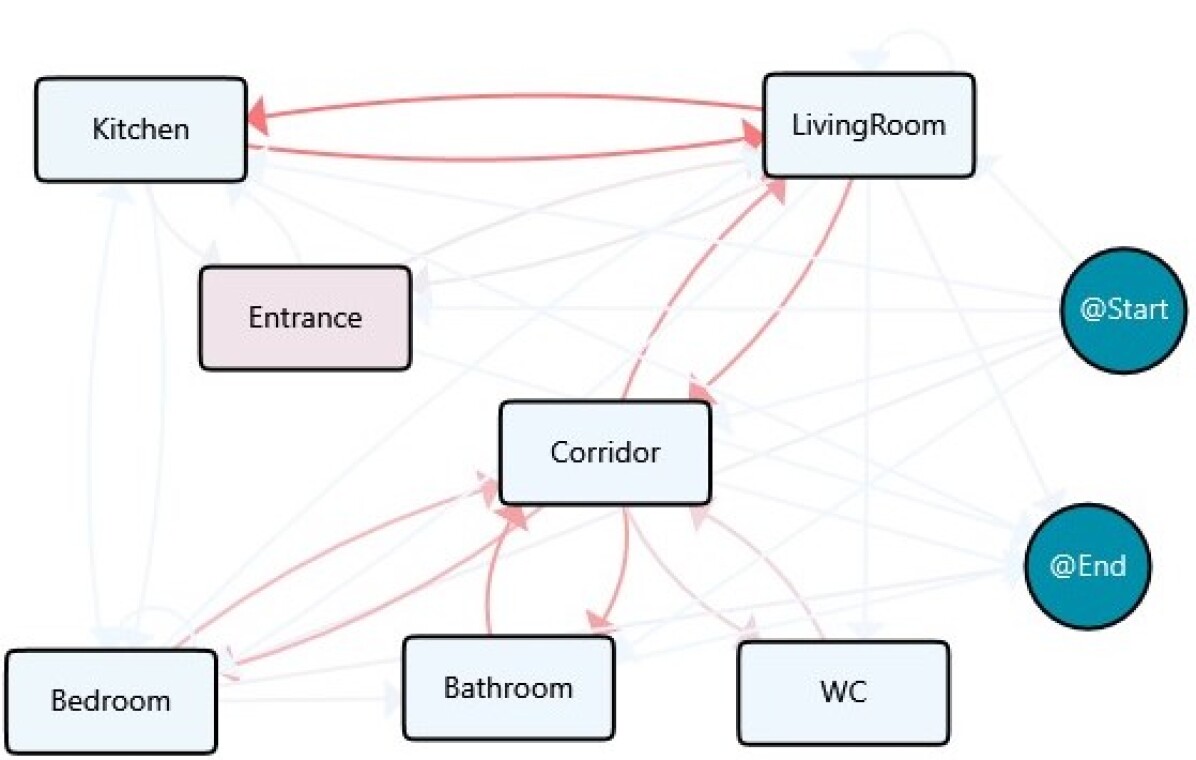

The differences in daily routines between the clusters in Sufficient and Insufficient activity groups reveal intriguing insights. Specifically, within the Sufficient-L3 cluster containing 4 days, we observe that, on average, subjects spent approximately 15 hours in the Bedroom—an unusually high duration compared to all other clusters in both the Sufficient and Insufficient groups. However, the extended time spent outside the home (around 2.5 hours) likely contributed to covering at least 4000 steps, leading to the classification of these 4 days within the sufficient activity group. On the contrary, the Sufficient-L2 cluster includes 6 days characterised by a considerable duration spent out-of-home. Despite this, these days are also classified as having sufficient physical activity, possibly attributed to periods of inactivity during the out-of-home intervals.
| Cluster | No. of Days | Main Characteristics |
|---|---|---|
| Sufficient-L1 | 53 | Bedroom H, LivingRoom H, Kitchen H and out-of-home H |
| Sufficient-L2 | 6 | Bedroom H, LivingRoom H, Kitchen H and out-of-home H |
| Sufficient-L3 | 4 | Bedroom H, LivingRoom H, Kitchen H and out-of-home H |
| Outlier | 11 | No specific pattern |
4.2.2.2 Activity-based clustering
The process model based on activities for Sufficient group is shown in Figure 6(a), which indicates that Sleeping is the most frequent activity in this group, just like the Insufficient group. Also, The process maps for the three derived clusters are provided in Figures 6(b), 6(c) and 6(d) respectively and Table 4 summarises the main characteristics of each cluster.
From an activity perspective, the days with sufficient physical activity level are clustered into 3 classes. The first cluster, Sufficient-A1, consists of 55 days with around 8 hours of Sleeping, more than 2 hours of Praying, 3 hours of Watching TV, and 1.5 hours of Cooking and Using smartphone. This pattern is almost repeated for the majority of the days with sufficient activity levels. However, for 8 days in the second cluster, Sufficient-A2, there is an increase in sleep time and cooking, but less time is spent on Praying. Oppositely, the third cluster, Sufficient-A3 consists of 5 days belongs to the behaviour models with more Praying and Using smartphone, but less Cooking. Additionally, there are 6 outlier days that do not fit into any of the three clusters.

| Cluster | No. of Days | Main Characteristics |
|---|---|---|
| Sufficient-A1 | 55 | Sleeping H, Praying H, Watching TV H, Cooking H and Using phone H |
| Sufficient-A2 | 8 | Sleeping H, Praying H, Watching TV H, Cooking H and Using phone H |
| Sufficient-A3 | 5 | Sleeping H, Praying H, Watching TV H, Cooking H and Using phone H |
| Outlier | 6 | No specific pattern |
4.2.3 Group 3: Desirable physical activity level clusters and main routines
There are 22 days in our dataset which has more than 10000 covered daily steps and they are included in the Desirable group. Thus, to highlight the correlation between locations and activities with the high physical activity level of these days, the same analyses based on the proposed approach are applied to the location and activity-based behaviour models of these days.
4.2.3.1 Location-based clustering
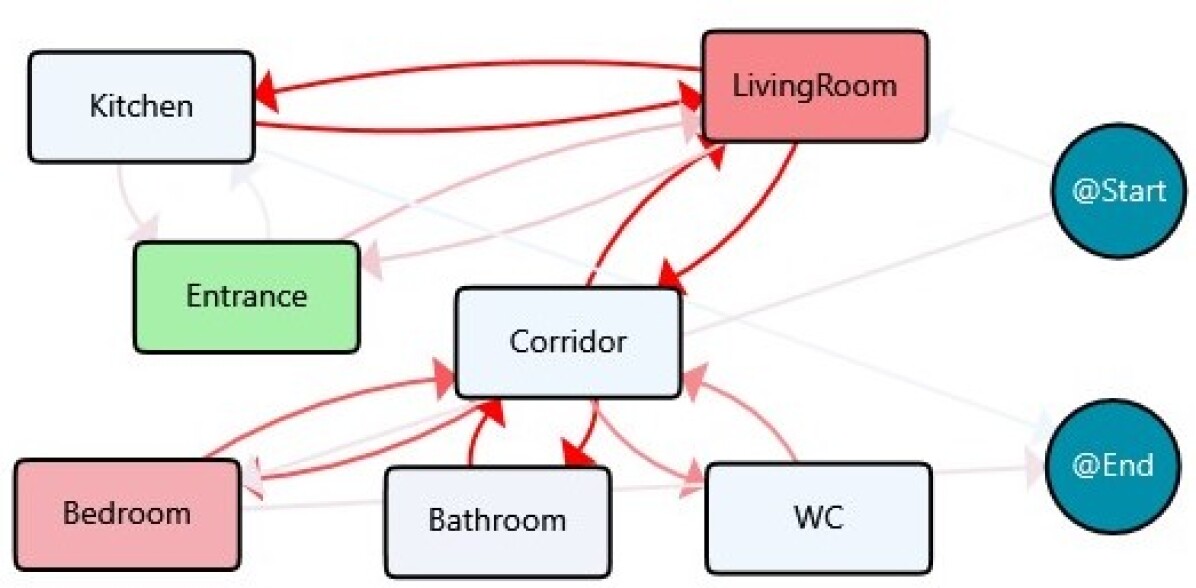
The location-based process maps associated with the physical activity level group exhibiting desirable levels are grouped into three primary clusters, with 15, 2, and 2 days and the remaining 3 days are categorized as outliers. Figure 5(b) (b), 5(c) (c), and 5(d) (d) show the process maps for these clusters, while Table1 provides a summary of the key characteristics and routines followed in each cluster.
Regarding the 22 days with desirable physical activity levels (i.e. the days which have more than 10000 daily steps) it is expected that the subject spend more time out of home. As shown in Figure 7(a) (a), the TPA models indicate that the days falling within this category mostly follow daily routines. These days are typically spent for approximately 10 hours in the Bedroom and around 6 hours outside the home. Similar to the previous group, there are significant movements between the Kitchen and the Living Room.
The desirable physical activity level group’s associated process maps are classified into three primary clusters, which last for 15 days, 2 days, and 2 days, respectively. The residual 3 days are identified as outliers. The process maps for these clusters are displayed in Figure 7(b), 7(c), and 7(d), while Table5 summarizes the main features and behaviour followed in each cluster.
The resident for the days in Desirable-L1 cluster spent roughly 5 hours outside of the home each day and this time is even higher for other clusters. By contrast, less time spent in different areas of the home including Bedroom, LivingRoom and Kitchen in relative to the clusters for other groups. This underscores the importance of leaving the house to engage in physical activity.
| Cluster | No. of Days | Main Characteristics |
|---|---|---|
| Desirable-L1 | 15 | Bedroom H, LivingRoom H, Kitchen H and out-of-home H |
| Desirable-L2 | 2 | Bedroom H, LivingRoom H, Kitchen H and out-of-home H |
| Desirable-L3 | 2 | Bedroom H, LivingRoom H, Kitchen H and out-of-home H |
| Outlier | 3 | No specific pattern |
4.2.3.2 Activity-based clustering
To examine the impact of activities on achieving desirable physical activity, the process models of days in the Desirable group are discovered by taking into account the activity events. Two classes were identified after clustering analysis - Desirable-A1 with 14 days, Desirable-A2 with 5 days and 3 days did not fit into these clusters. The TPAs for the behaviour models based on the activities are illustrated in Figure 8 and Table 6 highlights the main features of the clusters. The results show that sleeping for about 7.5 hours and watching TV for about 3-4 hours are the activities with the highest duration. The main difference between the days in the Desirable-A1 and Desirable-A2 clusters is that the subject spent an additional hour on watching TV and cooking on the days in the latter cluster.
| Cluster | No. of Days | Main Characteristics |
|---|---|---|
| Desirable-A1 | 14 | Sleeping H, Praying H, Watching TV H, Cooking H and Using phone H |
| Desirable-A2 | 5 | Sleeping H, Praying H, Watching TV H, Cooking H and Using phone H |
| Outlier | 3 | No specific pattern |
4.3 A calendar view - Looking into the variations of behaviour routines over time
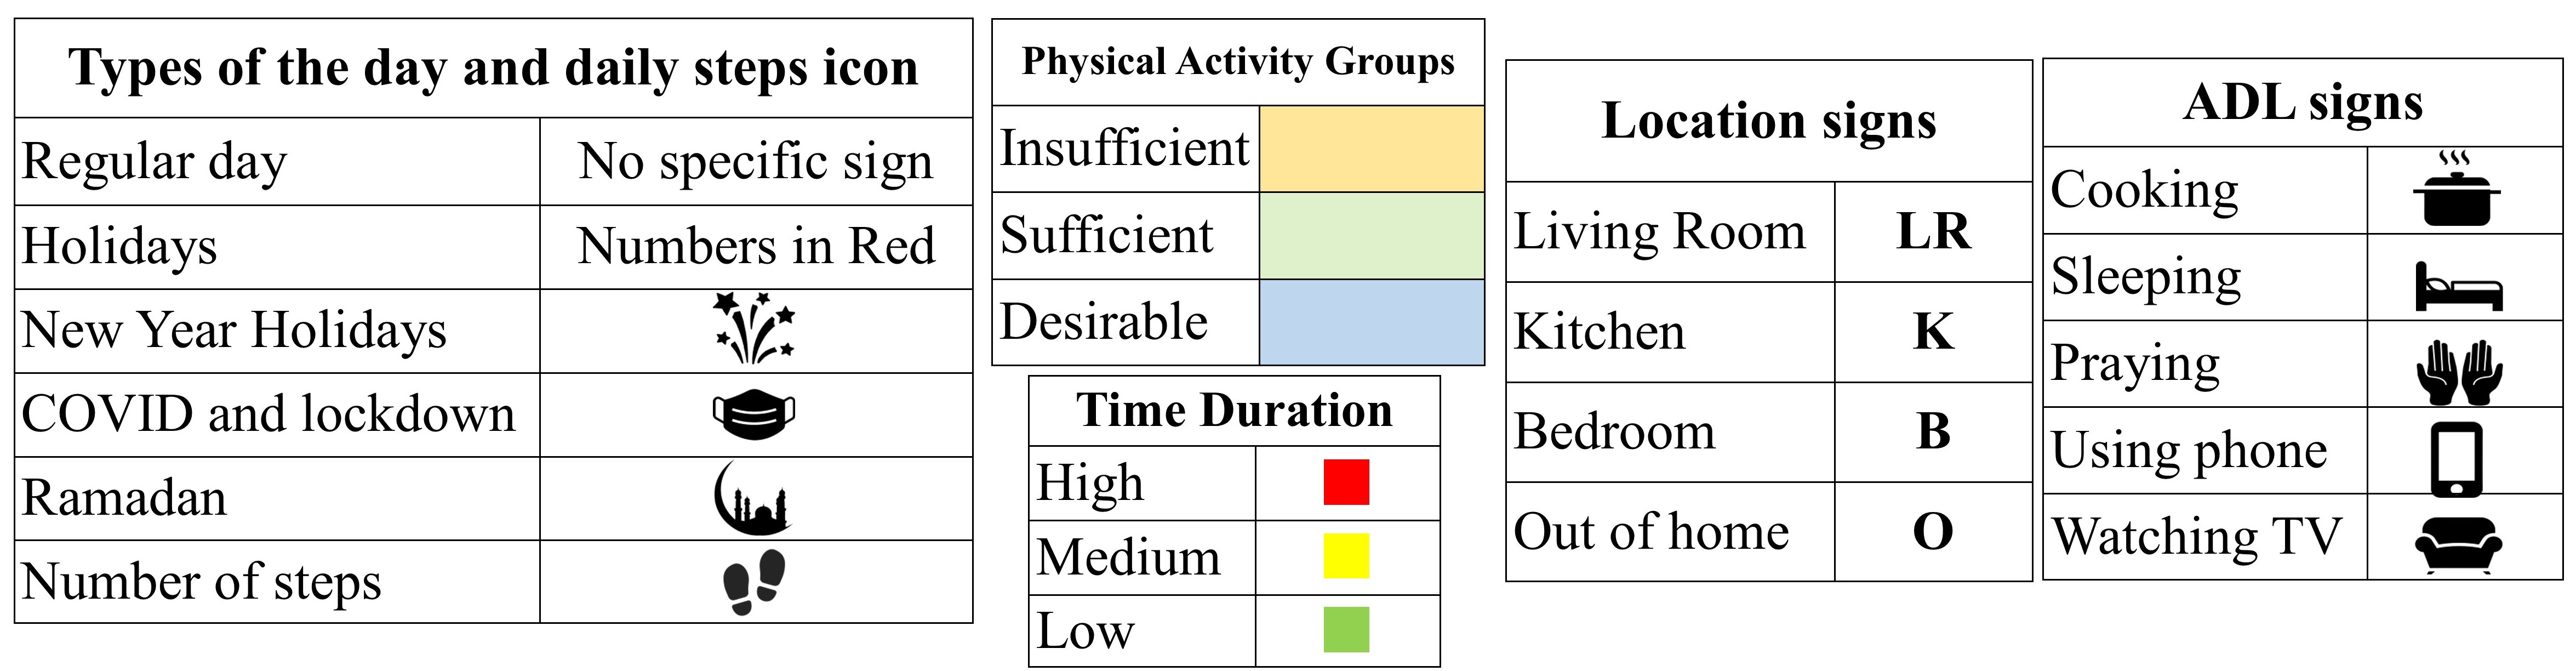
To summarise and represent the findings based on the physical activity level and discovered clusters for daily behaviour routines, all the key points in association with the values for daily steps are visualised in a single calendar shown in Figure 9. The day cells are coloured based on their assigned physical activity level group and icons related to the location and activities (if the day has been clustered into a specific location or activity class) are coloured based on their dedicated time. Furthermore, as mentioned in Section 3.2.1, our case study’s data collection period coincided with several events. The calendar view includes icons representing these events to facilitate exploring the possible correlation between daily behavioural routines and external factors.
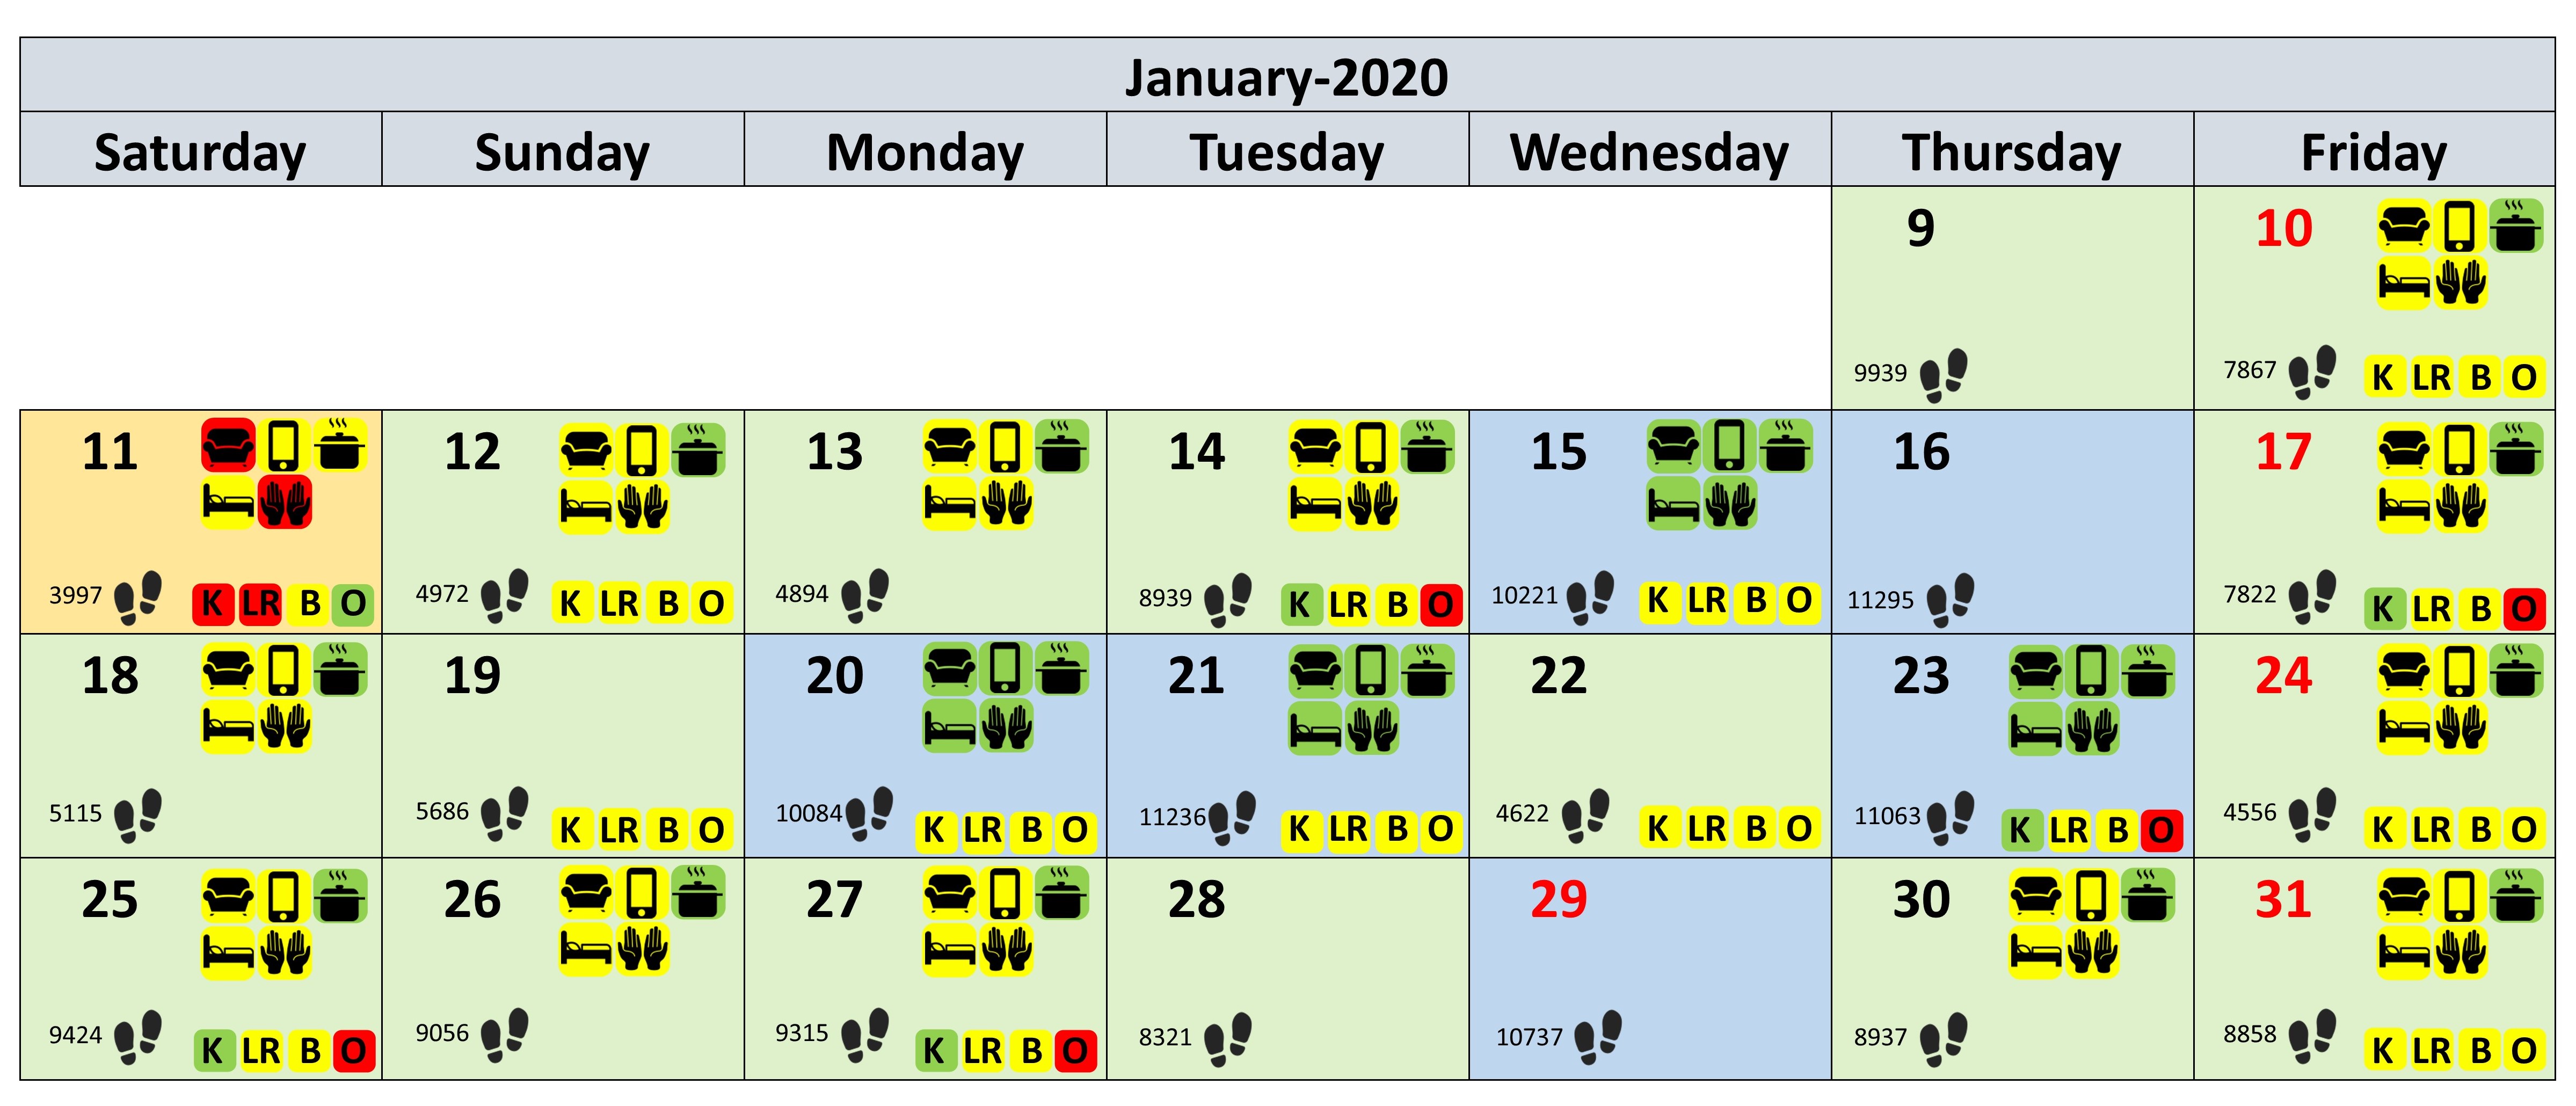
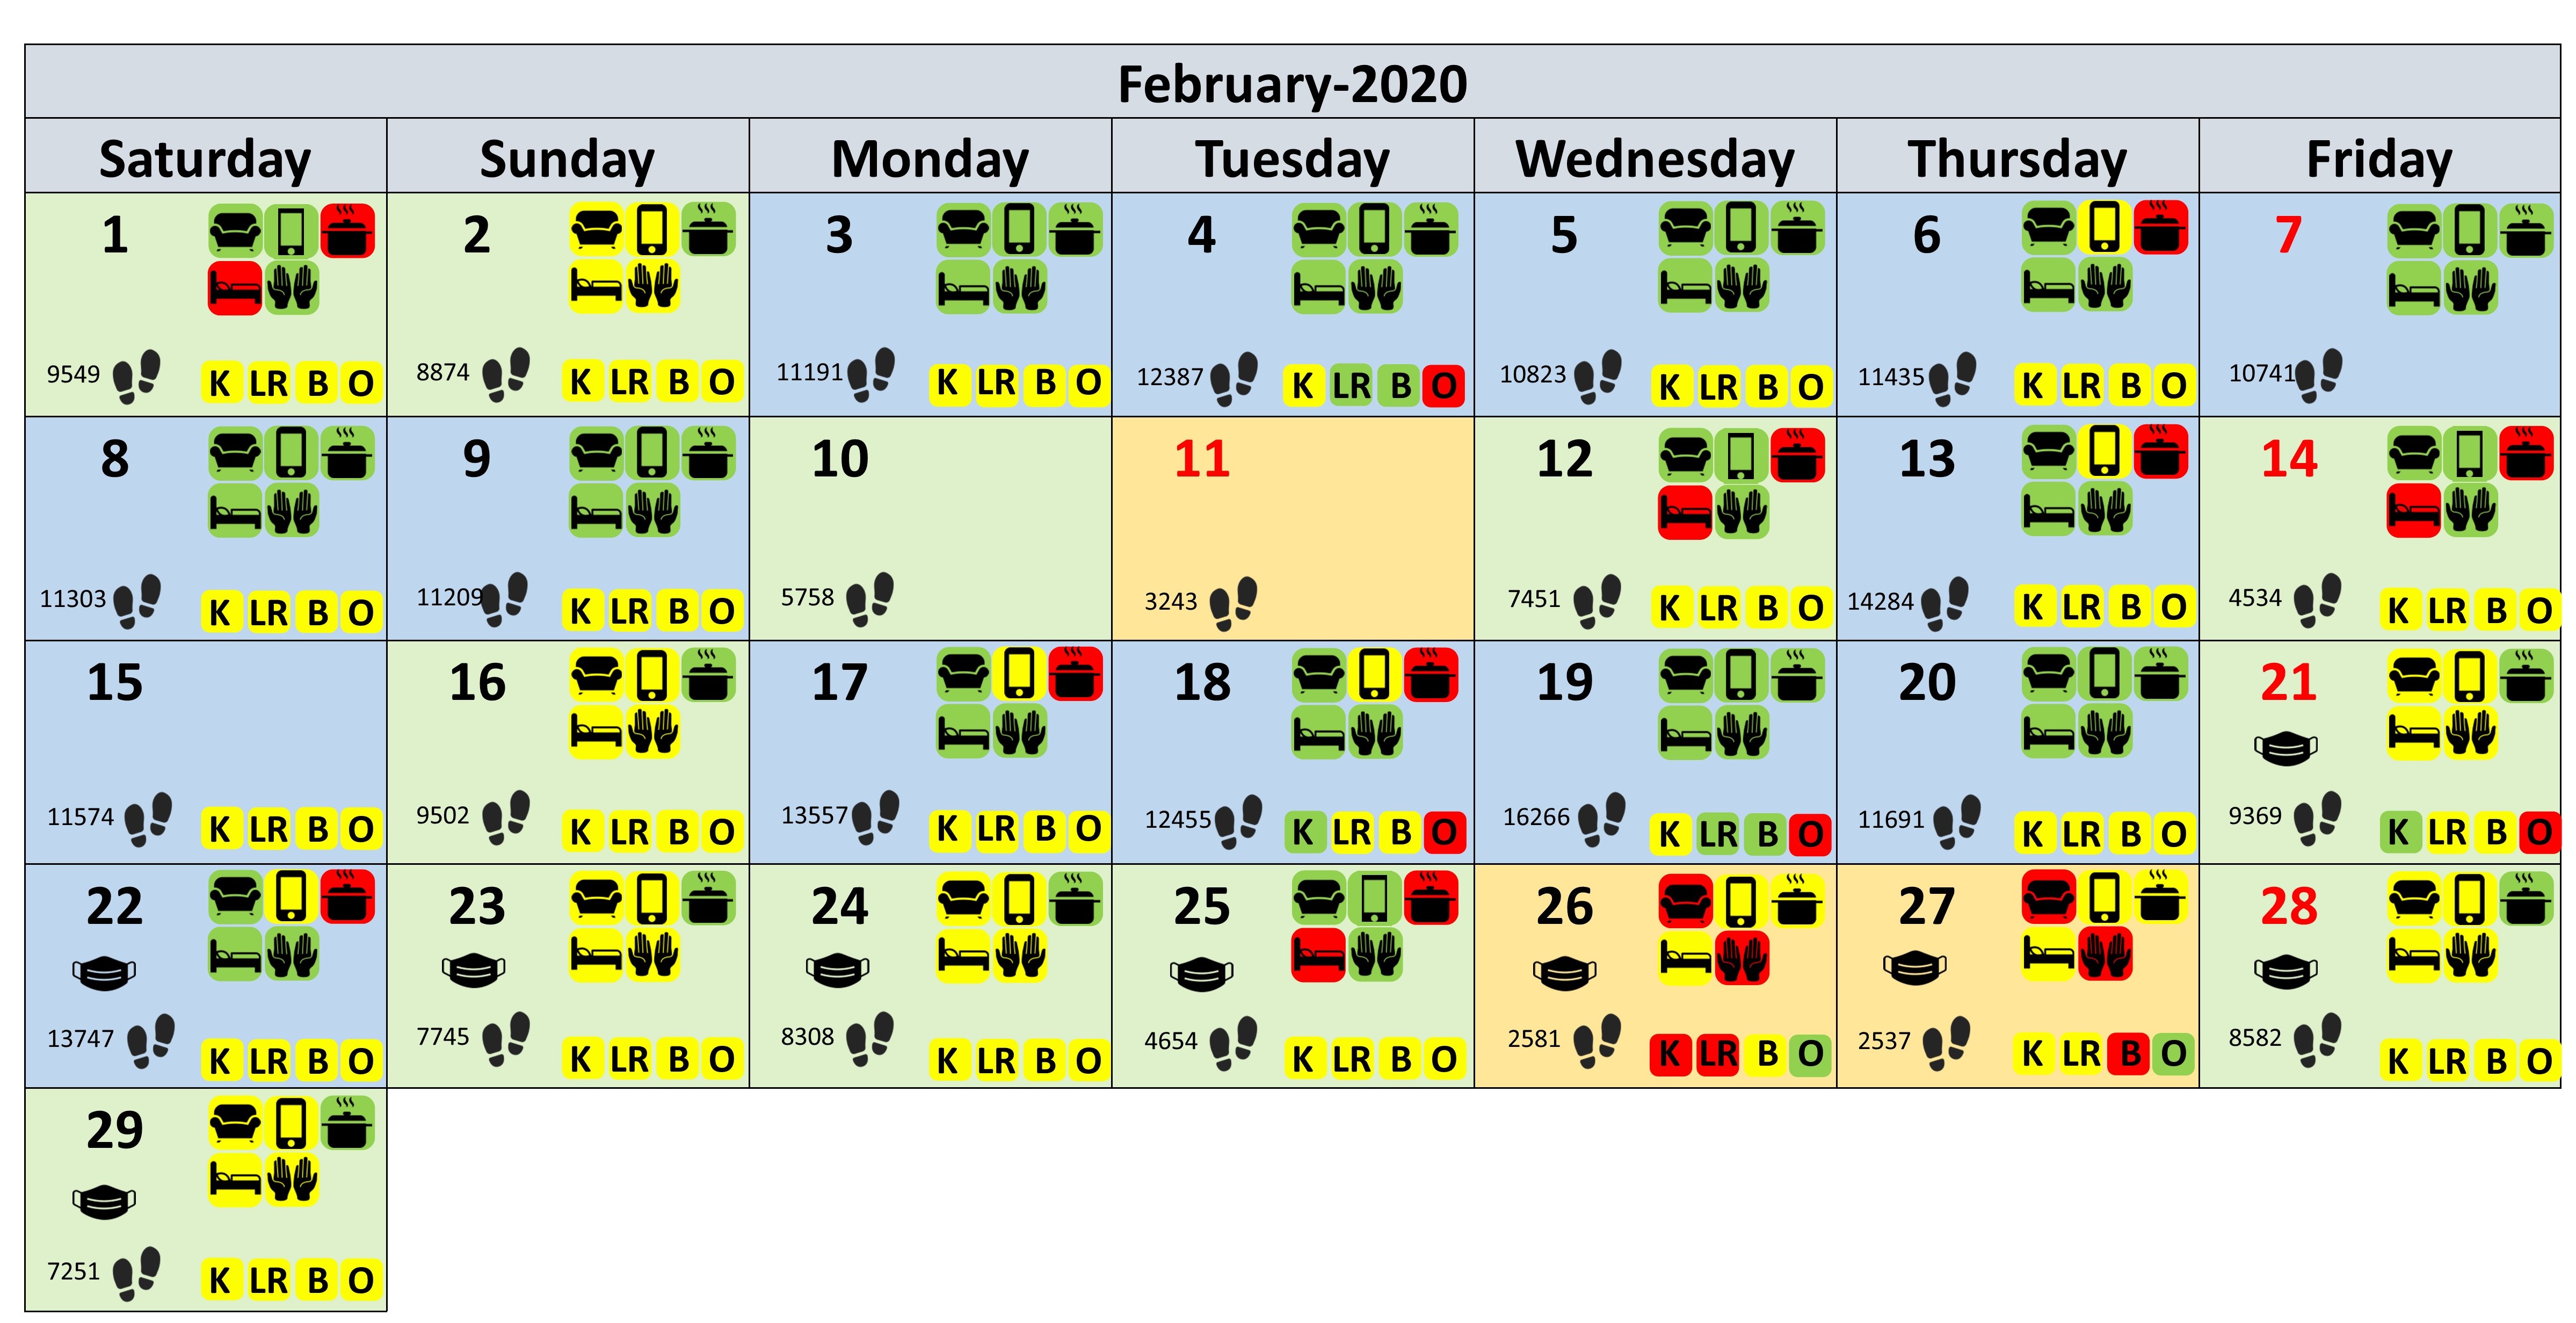
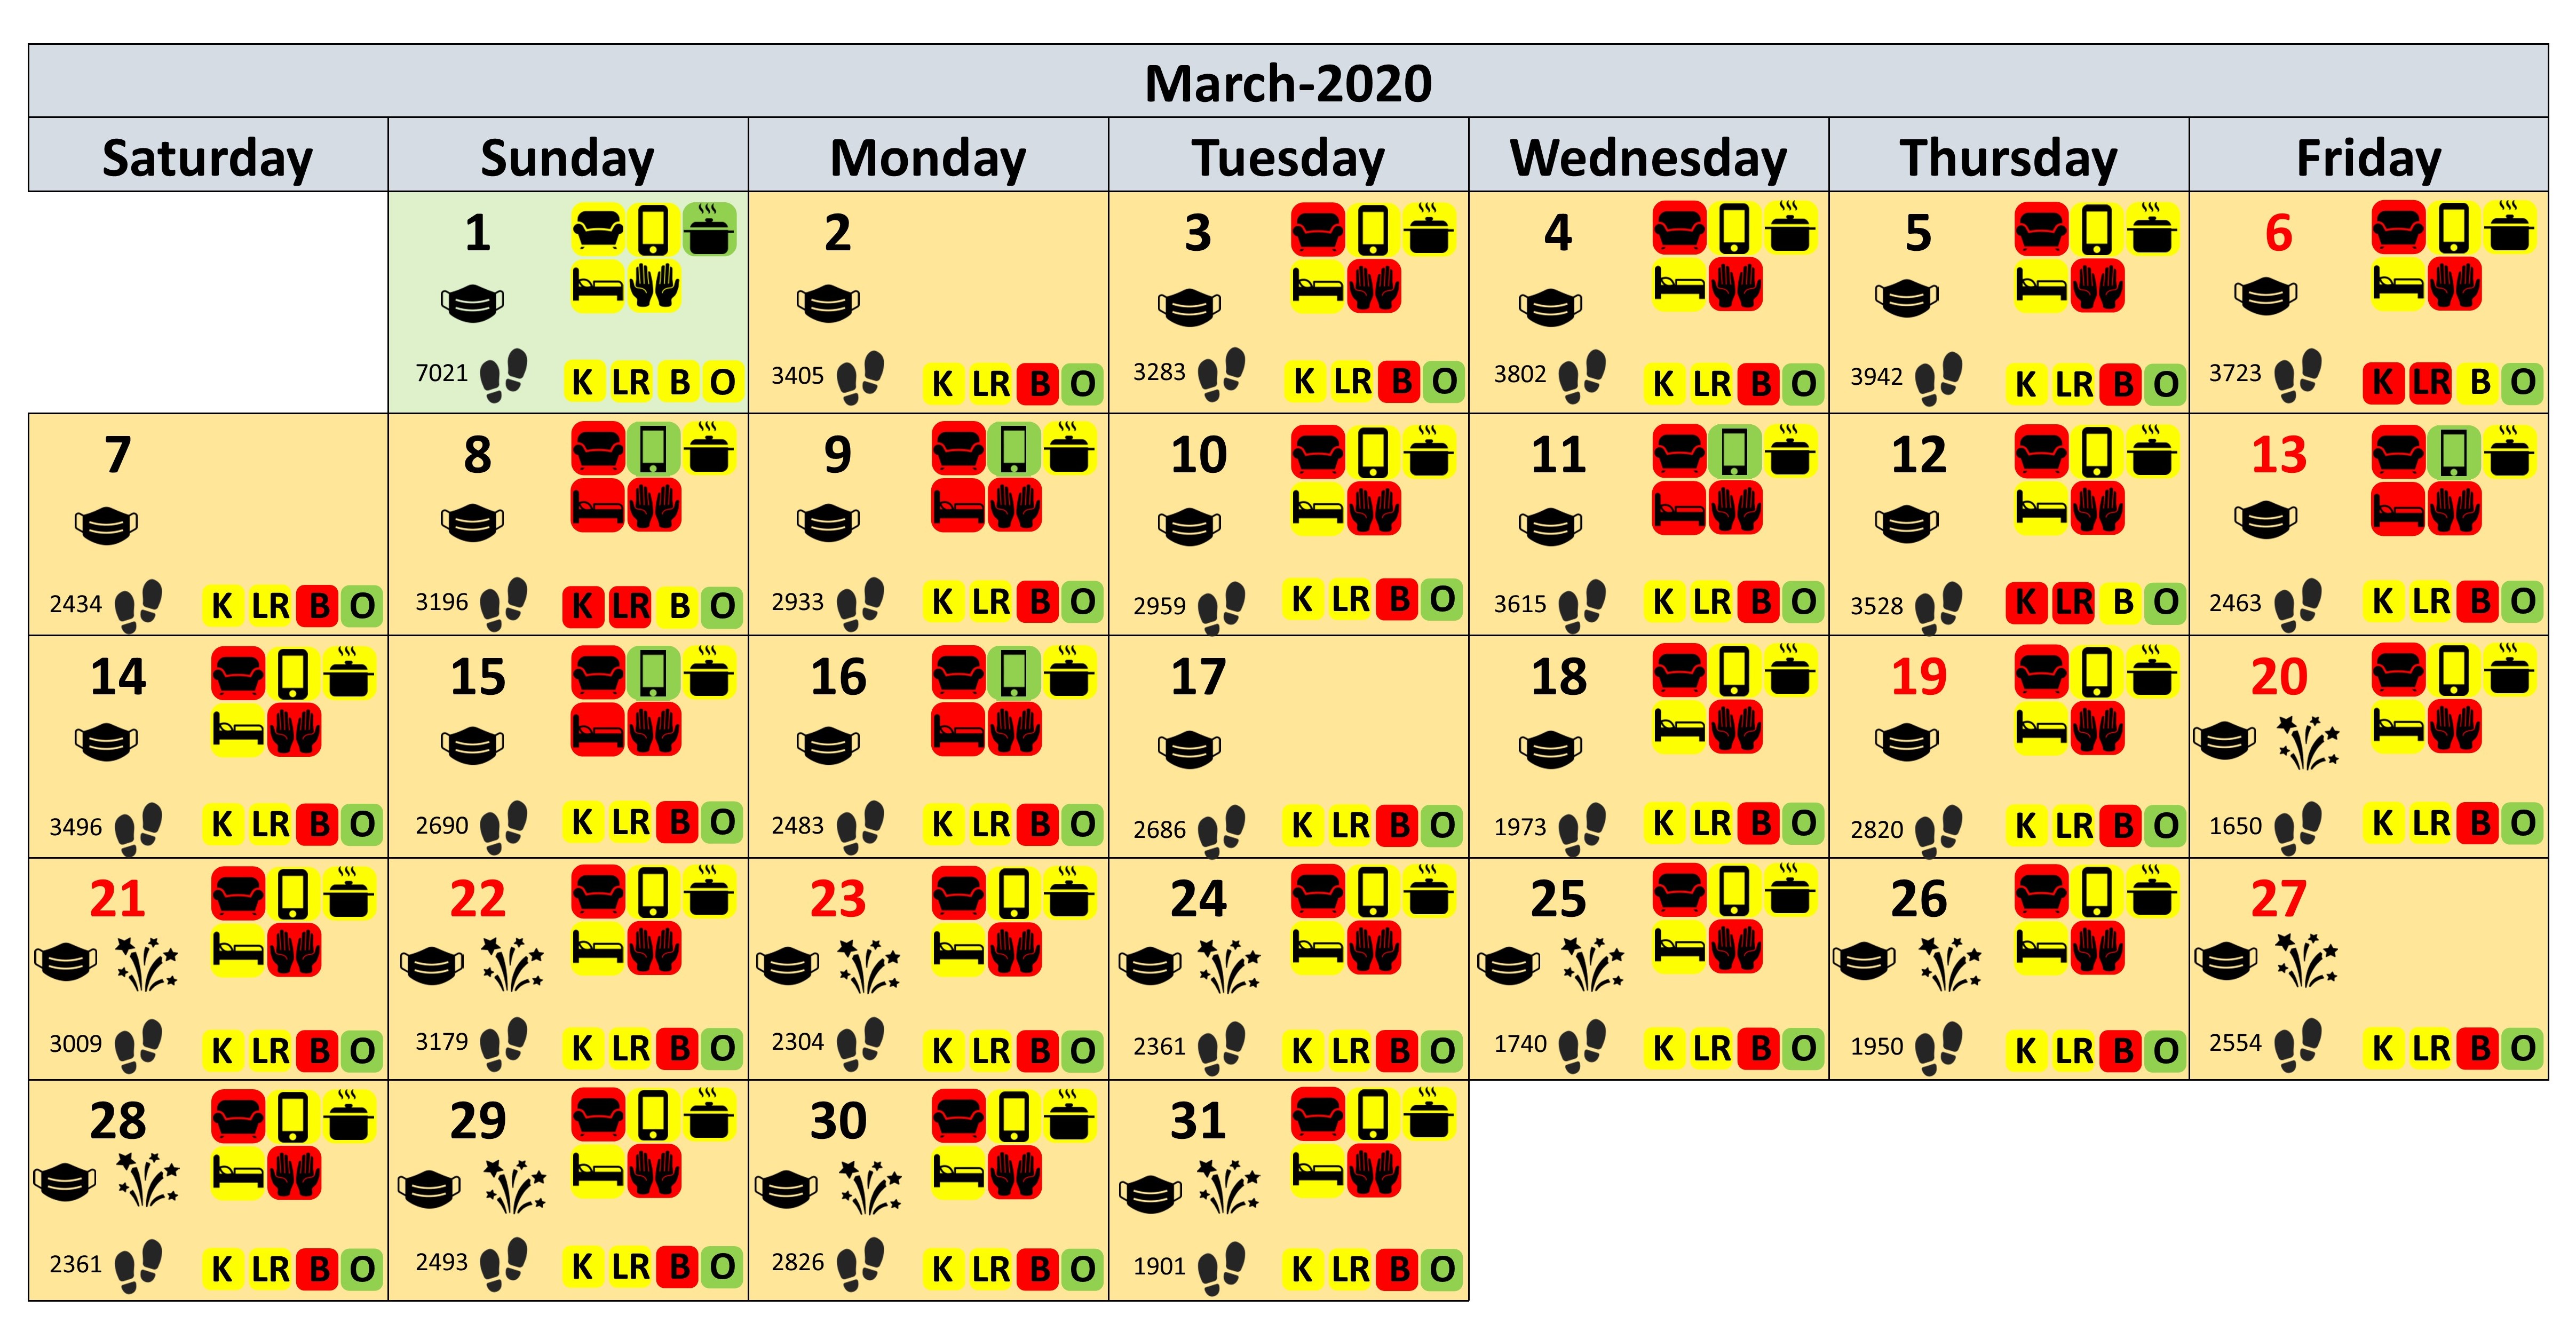
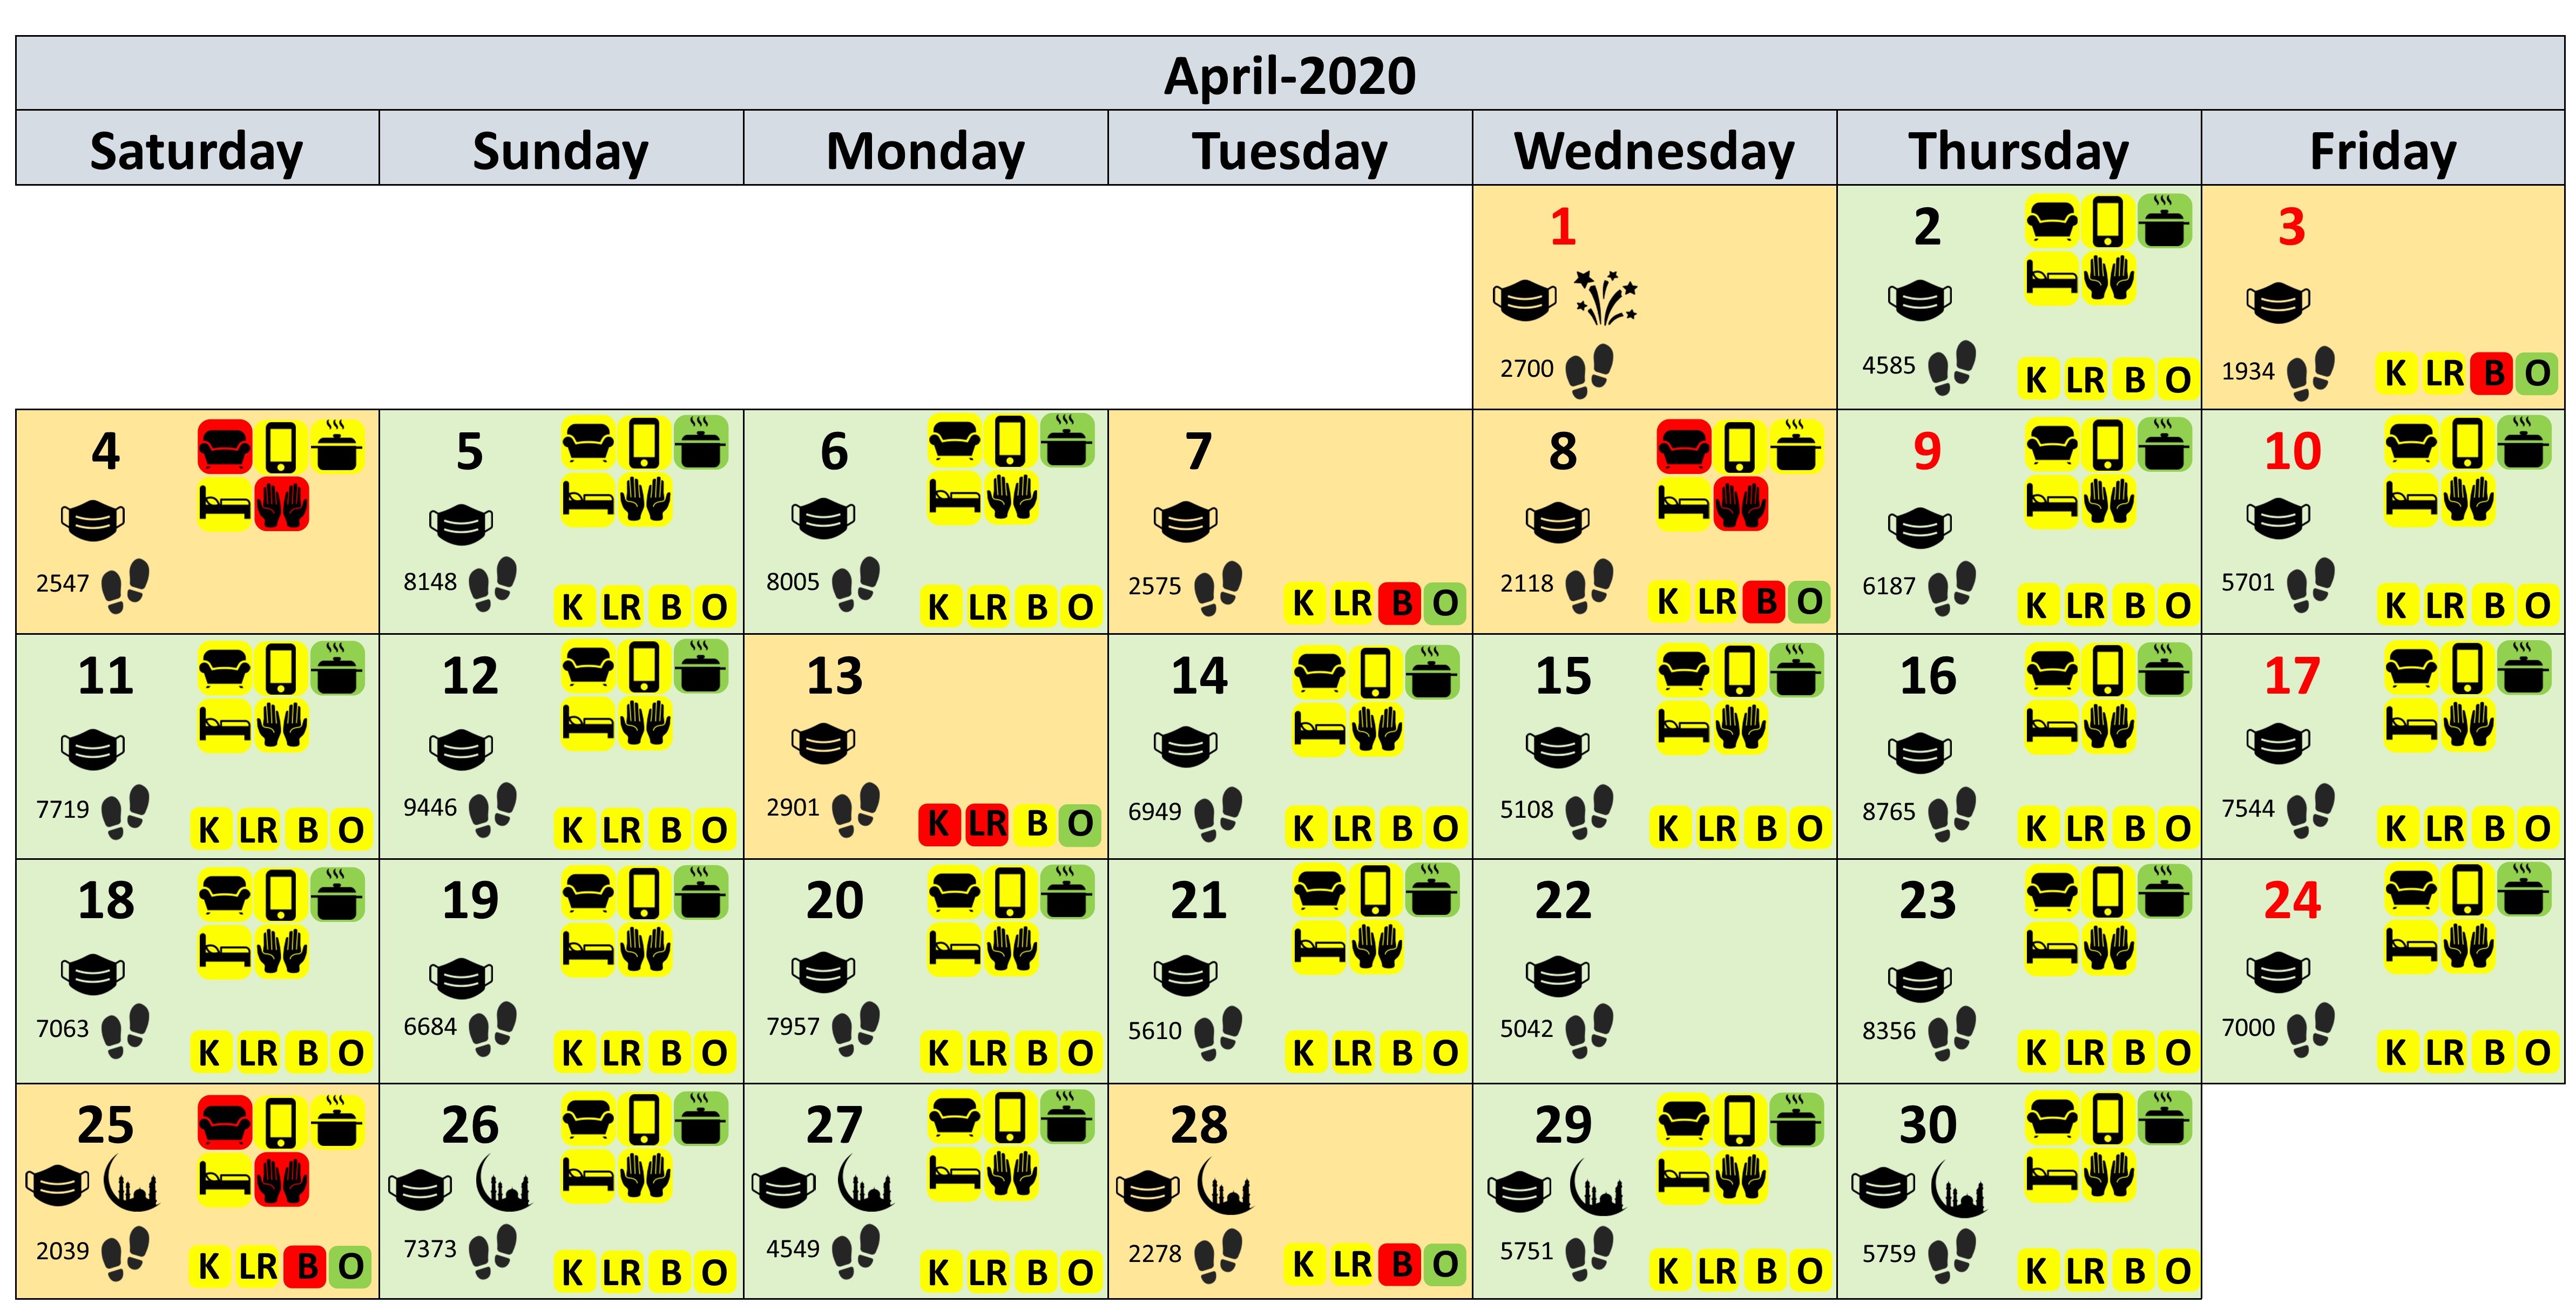
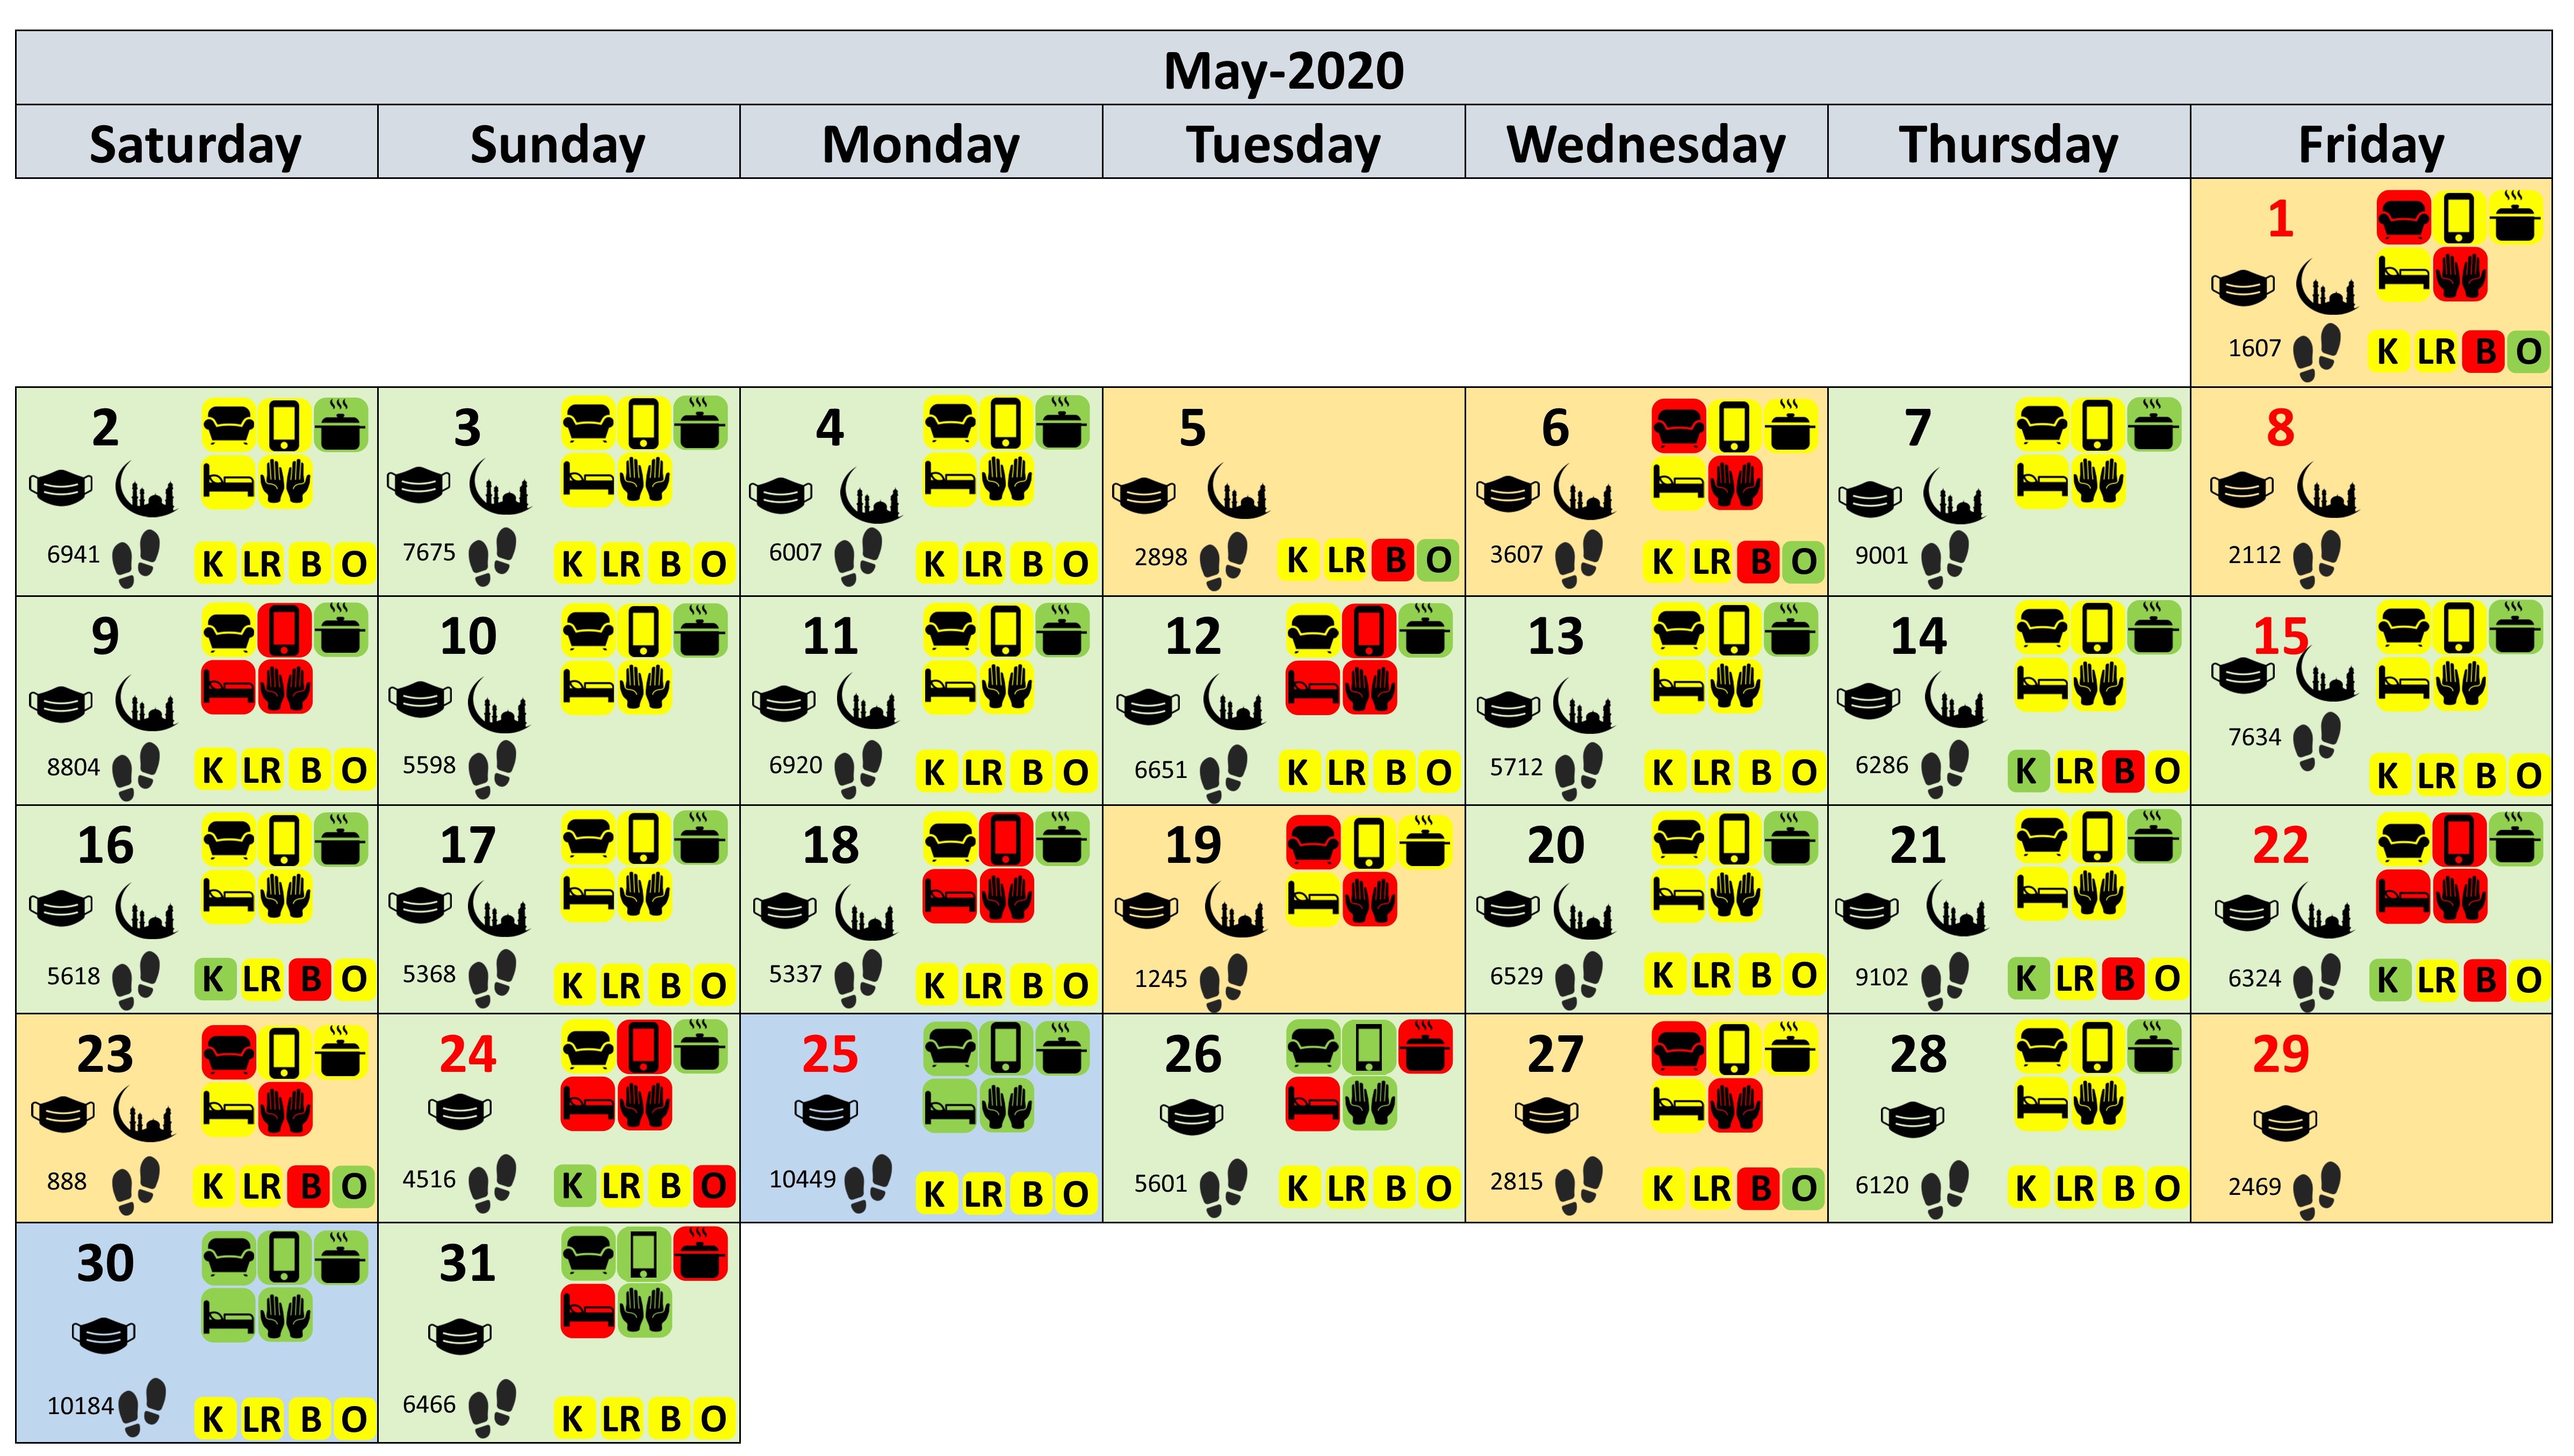
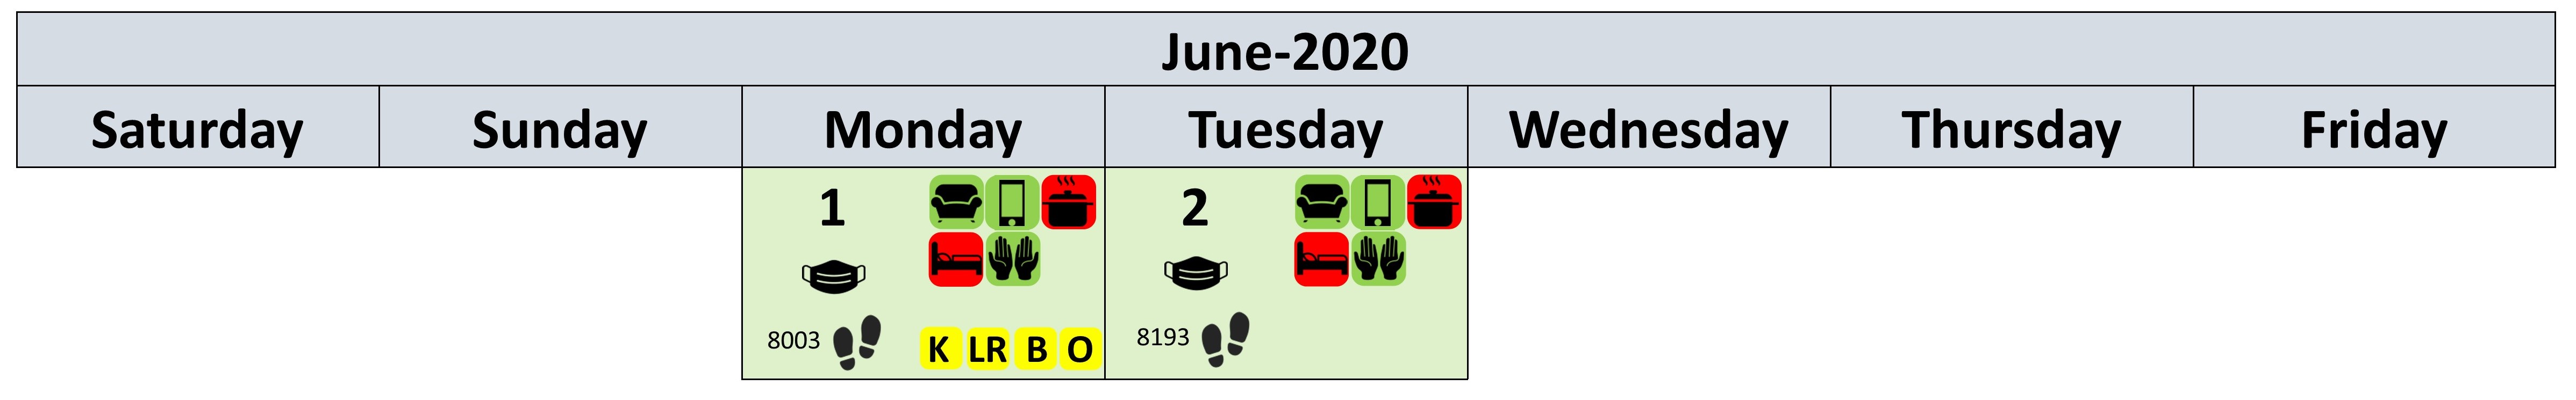
Upon examining the calendar and taking into account the start of the COVID-19 pandemic and subsequent lockdown in the region, it is obvious that the number of days with desirable physical activity levels has drastically decreased. Instead, we can observe a greater number of days recognised as having insufficient physical activity, particularly in March where the subject did not engage in enough physical activity on any day. This has motivated us to compare the number of days for each physical activity group according to prior-known events, which is reported in Table 7. This decline in the physical activity is also consistent with the daily values for the duration of out-of-home events. The calendar view clearly shows that with the start of COVID-19, there is no day with a high value for being out-of-home (the icons for this event are all in green or yellow colors indicating low or medium duration events for being out-of-home), highlighting the subject’s efforts to stay at home (as expected), which has inevitably caused a decrease in physical activity.
| Type of days | Insufficiant | Sufficiant | Desirable | Total |
|---|---|---|---|---|
| Regular | 2 | 22 | 19 | 43 |
| COVID and lockdown | 48 | 52 | 3 | 103 |
| Ramadan | 8 | 21 | - | 29 |
| New Year Holidays | 13 | - | - | 13 |
Furthermore, a similar change in the behaviour routines due to external events is expected for the month of Ramadan. According to the fasting and intentional decrease in eating times, changes in cooking behaviour are expected and we anticipated to see routines with less time spent for cooking. The analysis of the subject’s calendar revealed that during Ramadan, out of the 29 days, cooking activities were of medium duration on only 5 days, and on 21 days it was at a low level (the clustering algorithm ignored the other 3 days). Conversely, after Ramadan, the subject spent a high amount of time cooking on 4 out of 10 days, and before Ramadan it was 9 days out of 117.
In summary, the evaluation of the selected case study on elderly care carried out by applying the proposed approach declares the potential of behavioural analysis in tracking behaviour routines and investigating adherence to health guidelines, such as recommendations for physical activity. Continuous data collection by IoT devices and the discovery of behavioural process models enable the identification of subjects’ behaviour habits by highlighting their daily routines and patterns. Furthermore, the calendar view provides an appropriate visualization for easier reviewing and tracking of behaviour changes. For instance, it is easy to identify days (or weeks) where the person did not engage in appropriate physical activity and determine the reasons and daily routines that led to this lack of activity.
5 Discussion
Our activities and behaviours have a profound impact on our physical health, forming a crucial connection between daily routines with our health status. In this study, we showcased the potential of conducting behavioural analysis to gain an understandable picture of health conditions. To do this, we focused on leveraging information from daily life, collected by IoT devices and proposed a method to extract insightful knowledge on behaviour routines. By inspecting daily routines in terms of locations and activities, we were able to investigate how closely individuals aligned with well-known health guidelines, such as recommended values for daily steps. Our analysis demonstrated that identifying daily routines provides a comprehensive view of individuals’ habits and is a critical foundation for further health investigation. This comprehensive view empowers health experts to understand the actual patterns followed by patients in reality. As a result, they can provide more accurate interventions and enhance the potential for timely and effective health monitoring and treatment.
Furthermore, the potential of behaviour analysis is not restricted to the example and solution presented in this article. It offers a wide scope for the development of innovative healthcare systems. The interplay between behaviour and health can be explored and investigated from various perspectives that require additional research and inquiry in the future. In the following, we will briefly mention some of these perspectives.
-
•
In-depth behaviour exploration. Physical inactivity poses a significant health risk, and while tracking daily steps (as considered in our case study) is a simple measure, it only captures the absence of walking or running activities. However, there are other dimensions to physical activity, such as prolonged periods of remaining stationary or engaging in sedentary behaviours, which can also impact health negatively. Therefore, a comprehensive investigation into extended periods of sedentary routines and the effects of both sedentary and active tasks on overall health is another crucial aspect in discovering the experienced physical inactivity. For instance, as a future work in our case study, we plan to quantify this type of inactivity by accounting the time spent in activities that are conducted while seated, such as watching TV, eating, praying, and using the telephone.
Besides physical activity, exploring the influence of certain daily life habits on behaviour and health, like the following examples, may also be of interest.
-
–
Examining sleep patterns, including the time, frequency, and quality of sleep, and their impact on both physical and mental health, as well as subsequent behaviours.
-
–
Investigating the correlation between dietary habits, calorie intake and expenditure, and their implications for overall health and weight control.
-
–
Inspecting smartphone usage, along with exploring various mobile-based activities like gaming or social media, and their effects on physical health.
-
–
Assessing the impact of the work environment on behaviour and comparison of patterns in week and weekend days.
-
–
-
•
Early spotting of behaviour changes. Gaining a thorough understanding of individuals’ daily patterns and behaviour evolution allows for the timely detection of deviations, particularly valuable in monitoring conditions such as dementia and Alzheimer’s. In these cases, labelling daily behaviours as healthy or unhealthy and discovering the clusters which deviate from health guidelines could assist in identifying the main reasons for behaviour changes. Also, a visualisation tool like the calendar view can illuminate the onset of changes. Moreover, by harnessing online data collection, these types of behaviour analysis and monitoring approaches support the prompt identification of behavioural shifts, paving the way for early medical interventions that have the potential to impede the progression of diseases. This proactive strategy enhances our ability to address health concerns at an early stage, contributing to improved outcomes and quality of life for individuals affected by these conditions.
-
•
Longitudinal monitoring and tracking adherence to therapy. Regularly monitoring the behaviour of patients over time is an effective way to keep track of chronic diseases. This approach facilitates identifying any unusual patterns that may indicate health problems, which is particularly important for conditions such as cardiovascular disease and diabetes. The insights gathered on the behavior patterns can be summarized and presented in daily, weekly, and monthly reports. These reports can be used as a foundation during regular follow-up appointments with health experts to gain an overall view of the patient’s condition and what has transpired between sessions. Instead of relying solely on what patients report, the doctors can refer to actual data to determine if they are taking their medications as advised, and figure out how effective the treatment is. This helps them to make adjustments to medications, try alternative prescriptions, and ensure patients receive the appropriate care.
Moreover, behavioural analysis can provide valuable insights into the recovery progress of people after surgery or rehabilitation from a health problem. Early detection of any issues in treatment is critical, and tracking adherence to therapy and recovery progress can facilitate this process. It enables physicians to monitor the health of their patients and provide timely care when needed.
-
•
Monitoring lifestyle Monitoring and staying informed. Many people today are interested in staying healthy and follow routines and diet plans to keep fit. The increasing popularity of wearable devices, smart scales, and health apps that track food and workouts is a testament to the fact that people are interested in being more self-aware about their health. In this situation, a system that utilises a behaviour modelling approach, like the proposed one, can create easy-to-understand reports that visualise daily routines and behaviour. It helps them keep track of their routines and see how well they’re following health guidelines. It allows individuals to audit adherence to health guidelines, and then the insights gained can contribute to refining and updating these guidelines based on new discoveries. This system can look at behaviours and lifestyles, considering events and outside factors. If it notices any unhealthy changes, it can alert the user and provide feedback to get back to a healthy lifestyle. It’s like having a friendly reminder to stay on track and make choices that are good for your health.
Additionally, it should be noted that the application of the proposed approach is not limited to human behaviour analysis and it also holds significant potential for broader applications beyond healthcare. The steps and operations are versatile and they can be adapted to be used in diverse domains, such as analysing consumer behaviour, business processes, or societal trends. By utilising information about the processes, routines and trends, grouping them according to guidelines or preferences and then applying clustering techniques, this approach can unravel patterns and trends’ characteristics in any dataset where guidelines exist for categorising behaviours. For example, targeted marketing strategies can be developed by considering customers’ purchase history, and the inefficiencies and productivity at work environments can be analysed by examining employee and workers’ behaviours, activities and interactions. The ability to provide a comprehensive view of trends and visualise the evolution in diverse datasets underscores the universal applicability of behavioural analysis like the proposed one. As long as guidelines exist to categorise and align data, this approach becomes a valuable tool for extracting meaningful insights and facilitating informed decision-making in various domains.
Beyond exploring behavioural analysis possibilities and use cases, it’s crucial to understand the technology that makes these applications work, as it directly impacts the effectiveness of healthcare services. Our case study showcased the power of using IoT systems for data collection and demonstrated how information from various sources, gives us a more complete picture for behavioural analysis. We collected daily steps from a wristband, tracked smartphone usage, and observed movements and activities through ambient sensors, allowing us to analyze behaviour based on locations and activity clusters. Moving forward, we can extend this approach by tapping into smartphones to capture social interactions, smart home devices for entertainment data, sleep patterns, and even physiological variables like blood pressure and heart rate through wearables. A multi-modal IoT system with diverse data types collected from different devices can bring together much of this information in order to not only provide a thorough understanding of physical activities but also shed light on the context and situations individuals experience, broadening the scope for a more comprehensive analysis.
Furthermore, the synergy of information from multiple sensors creates a stronger and more reliable picture than what a single source can provide. Multiple sources of information could complete each other. Our case study demonstrated this synergy by using the data from inside the home (gathered by ambient sensors), combined with the wristband and smartphone info when the person is outside. This combination gives us a more complete view, preventing us from relying too much on just one perspective. For example, we noticed some days (four days in Sufficient-L3 cluster, Section 4.2.2.1) with adequate steps, labelled as days with sufficient physical activity. However, the ambient data showed that during those days, the person spent a long time in the Bedroom, mostly doing sedentary stuff – not so great for health. This problem is something we wouldn’t catch if we only looked at steps and showed the impact of doing multi-modal monitoring. Combining data from different sources helps us spot patterns, like being inactive for a long time and then suddenly being super active, which isn’t good for health. Our case study and the contribution in aggregating information from various sources clearly showed that it is feasible to achieve a more detailed and reliable analysis. This can reveal the complex dynamics of behaviours and their impact on health.
Ultimately, there is no doubt that innovative approaches for behavioural analysis, like the one proposed in this article, not only enhance the understanding of individual behaviours but also open avenues for personalised healthcare interventions, promoting a healthier and more informed lifestyle. However, these systems and using IoT devices for monitoring personal life still need more widespread acceptance. It is crucial that people embrace the idea of using IoT devices to track their daily lives, while health experts welcome these systems and are willing to use them. This acceptance is the key to making smart healthcare solutions successful and widely used in our society.
6 Conclusion
The paper underscores the potential of innovative behavioural analysis in understanding individual behaviours and tailoring healthcare interventions. By leveraging information from multi-modal IoT systems and aggregating the data, we can obtain a comprehensive view of physical health. We have investigated this potential in our study by considering a use case and data collected by a multi-modal IoT system including ambient sensors in the house, a wristband and a smartphone. The proposed approach for behaviour analysis involves grouping daily routines based on their alignment with health guidelines. These routines are then modelled by process mining techniques and clustered to highlight similarities between daily routines from several days. We also provided a calendar view to visualise all extracted information in an understandable format and illustrate how it can be used to discover the relation between several activities and health guidelines. The impact of external events on the behaviour can also be identified. The outcome of behavioural analysis and the resulting comprehensive view can empower health experts to provide more accurate interventions based on actual behavioural patterns. This enhances the potential for timely and effective health monitoring and interventions.
References
- [1] A. Fleury, M. Vacher, and N. Noury, “SVM-based multimodal classification of activities of daily living in health smart homes: sensors, algorithms, and first experimental results,” IEEE transactions on information technology in biomedicine, vol. 14, no. 2, pp. 274–283, 2009.
- [2] M. R. Ma’arif, “Revealing daily human activity pattern using process mining approach,” in 2017 4th International Conference on Electrical Engineering, Computer Science and Informatics (EECSI), pp. 1–5, IEEE, 2017.
- [3] J. Qi, P. Yang, L. Newcombe, X. Peng, Y. Yang, and Z. Zhao, “An overview of data fusion techniques for Internet of Things enabled physical activity recognition and measure,” Information Fusion, vol. 55, pp. 269–280, 2020.
- [4] K. S. Santacruz and D. Swagerty, “Early diagnosis of dementia,” American Family Physician, vol. 63, no. 4, pp. 703–714, 2001.
- [5] S. Enshaeifar, P. Barnaghi, S. Skillman, A. Markides, T. Elsaleh, S. T. Acton, R. Nilforooshan, and H. Rostill, “The Internet of Things for dementia care,” IEEE Internet Computing, vol. 22, no. 1, pp. 8–17, 2018.
- [6] A. Alberdi, A. Weakley, M. Schmitter-Edgecombe, D. J. Cook, A. Aztiria, A. Basarab, and M. Barrenechea, “Smart home-based prediction of multidomain symptoms related to alzheimer’s disease,” IEEE journal of biomedical and health informatics, vol. 22, no. 6, pp. 1720–1731, 2018.
- [7] M. Garcia-Constantino, A. Konios, M. A. Mustafa, C. Nugent, and G. Morrison, “Ambient and wearable sensor fusion for abnormal behaviour detection in activities of daily living,” in 2020 IEEE International Conference on Pervasive Computing and Communications Workshops (PerCom Workshops), pp. 1–6, IEEE, 2020.
- [8] D. J. Cook and N. Krishnan, “Mining the home environment,” Journal of intelligent information systems, vol. 43, pp. 503–519, 2014.
- [9] S. Palipana, B. Pietropaoli, and D. Pesch, “Recent advances in rf-based passive device-free localisation for indoor applications,” Ad Hoc Networks, vol. 64, pp. 80–98, 2017.
- [10] R. Fritz, K. Wuestney, G. Dermody, and D. J. Cook, “Nurse-in-the-loop smart home detection of health events associated with diagnosed chronic conditions: A case-event series,” International Journal of Nursing Studies Advances, vol. 4, p. 100081, 2022.
- [11] M. Shirali, J.-L. Bayo-Monton, C. Fernandez-Llatas, M. Ghassemian, and V. Traver Salcedo, “Design and evaluation of a solo-resident smart home testbed for mobility pattern monitoring and behavioural assessment,” Sensors, vol. 20, no. 24, 2020.
- [12] M. Stikic, T. Huynh, K. Van Laerhoven, and B. Schiele, “ADL recognition based on the combination of RFID and accelerometer sensing,” in 2008 second international conference on pervasive computing technologies for healthcare, pp. 258–263, IEEE, 2008.
- [13] M. Cornacchia, K. Ozcan, Y. Zheng, and S. Velipasalar, “A survey on activity detection and classification using wearable sensors,” IEEE Sensors Journal, vol. 17, no. 2, pp. 386–403, 2016.
- [14] A. Rayes and S. Salam, Internet of Things from Hype to Reality: The Road to Digitization. Cham: Springer International Publishing, 2022.
- [15] A. Whitmore, A. Agarwal, and L. Da Xu, “The Internet of Things—a survey of topics and trends,” Information systems frontiers, vol. 17, pp. 261–274, 2015.
- [16] M. Swan, “Sensor mania! the Internet of Things, wearable computing, objective metrics, and the quantified self 2.0,” Journal of Sensor and Actuator Networks, vol. 1, no. 3, pp. 217–253, 2012.
- [17] P. P. Morita, K. S. Sahu, and A. Oetomo, “Health monitoring using smart home technologies: Scoping review,” JMIR mHealth and uHealth, vol. 11, p. e37347, 2023.
- [18] T. Sztyler, J. Völker, J. Carmona Vargas, O. Meier, and H. Stuckenschmidt, “Discovery of personal processes from labeled sensor data: An application of process mining to personalized health care,” in Proceedings of the International Workshop on Algorithms & Theories for the Analysis of Event Data: Brussels, Belgium, June 22-23, 2015, pp. 31–46, CEUR-ws. org, 2015.
- [19] A. Wang, G. Chen, X. Wu, L. Liu, N. An, and C.-Y. Chang, “Towards human activity recognition: A hierarchical feature selection framework,” Sensors, vol. 18, no. 11, p. 3629, 2018.
- [20] N. C. Krishnan and D. J. Cook, “Activity recognition on streaming sensor data,” Pervasive and mobile computing, vol. 10, pp. 138–154, 2014.
- [21] D. J. Cook and M. Schmitter-Edgecombe, “Fusing ambient and mobile sensor features into a behaviorome for predicting clinical health scores,” IEEE Access, vol. 9, pp. 65033–65043, 2021.
- [22] A. Sheth, U. Jaimini, and H. Y. Yip, “How will the internet of things enable augmented personalized health?,” IEEE intelligent systems, vol. 33, no. 1, pp. 89–97, 2018.
- [23] M. Shirali, Z. Ahmadi, C. Fernández-Llatas, J.-L. Bayo-Monton, and G. Di Federico, “A process mining-based error correction approach to improve data quality of an iot-sourced event log,” Under Review, 2024.
- [24] A. Sheth, P. Anantharam, and K. Thirunarayan, “Applications of multimodal physical (iot), cyber and social data for reliable and actionable insights,” in 10th IEEE International Conference on Collaborative Computing: Networking, Applications and Worksharing, pp. 489–494, IEEE, 2014.
- [25] A. Dohr, R. Modre-Opsrian, M. Drobics, D. Hayn, and G. Schreier, “The internet of things for ambient assisted living,” in 2010 seventh international conference on information technology: new generations, pp. 804–809, IEEE, 2010.
- [26] I. M. Pires, N. M. Garcia, N. Pombo, and F. Flórez-Revuelta, “From data acquisition to data fusion: a comprehensive review and a roadmap for the identification of activities of daily living using mobile devices,” Sensors, vol. 16, no. 2, p. 184, 2016.
- [27] R. L. Fritz, M. Wilson, G. Dermody, M. Schmitter-Edgecombe, and D. J. Cook, “Automated smart home assessment to support pain management: multiple methods analysis,” Journal of Medical Internet Research, vol. 22, no. 11, p. e23943, 2020.
- [28] G. Sprint, D. J. Cook, and R. Fritz, “Behavioral differences between subject groups identified using smart homes and change point detection,” IEEE journal of biomedical and health informatics, vol. 25, no. 2, pp. 559–567, 2020.
- [29] G. Sprint, D. J. Cook, R. Shelly, M. Schmitter-Edgecombe, et al., “Using smart homes to detect and analyze health events,” Computer, vol. 49, no. 11, pp. 29–37, 2016.
- [30] H. Y. Teh, A. W. Kempa-Liehr, and K. I.-K. Wang, “Sensor data quality: A systematic review,” Journal of Big Data, vol. 7, no. 1, pp. 1–49, 2020.
- [31] C. Fernandez-Llatas, J. M. Benedi, J. M. Gama, M. Sepulveda, E. Rojas, S. Vera, and V. Traver, “Interactive process mining in surgery with real time location systems: Interactive trace correction,” Interactive process mining in healthcare, pp. 181–202, 2021.
- [32] Y. Wang, S. Cang, and H. Yu, “A data fusion-based hybrid sensory system for older people’s daily activity and daily routine recognition,” IEEE Sensors Journal, vol. 18, no. 16, pp. 6874–6888, 2018.
- [33] C. F. Crispim-Junior, F. Bremond, and V. Joumier, “A multi-sensor approach for activity recognition in older patients,” in The Second International Conference on Ambient Computing, Applications, Services and Technologies-AMBIENT 2012, XPS/ThinkMindTM Digital Library, 2012.
- [34] P. Lago, C. Jiménez-Guarín, and C. Roncancio, “A case study on the analysis of behavior patterns and pattern changes in smart environments,” in Ambient Assisted Living and Daily Activities: 6th International Work-Conference, IWAAL 2014, Belfast, UK, December 2-5, 2014. Proceedings 6, pp. 296–303, Springer, 2014.
- [35] J.-h. Shin, Y. Her-Xiong, R. Tredinnick, and K. Ponto, “Toward understanding everyday lives of older adults: A methodological exploration,” The Gerontologist, vol. 61, no. 8, pp. 1241–1253, 2021.
- [36] J. J. Rodrigues, D. B. D. R. Segundo, H. A. Junqueira, M. H. Sabino, R. M. Prince, J. Al-Muhtadi, and V. H. C. De Albuquerque, “Enabling technologies for the Internet of health Things,” Ieee Access, vol. 6, pp. 13129–13141, 2018.
- [37] H. Medjahed, D. Istrate, J. Boudy, J.-L. Baldinger, and B. Dorizzi, “A pervasive multi-sensor data fusion for smart home healthcare monitoring,” in 2011 IEEE international conference on fuzzy systems (FUZZ-IEEE 2011), pp. 1466–1473, IEEE, 2011.
- [38] Z. He, D. Lu, Y. Yang, M. Gao, et al., “An elderly care system based on multiple information fusion,” Journal of healthcare engineering, vol. 2018, 2018.
- [39] C. Fernandez-Llatas, J. Munoz-Gama, N. Martin, O. Johnson, M. Sepulveda, and E. Helm, Process Mining in Healthcare, pp. 41–52. Cham: Springer International Publishing, 2021.
- [40] W. M. Van der Aalst, B. F. Van Dongen, J. Herbst, L. Maruster, G. Schimm, and A. J. Weijters, “Workflow mining: A survey of issues and approaches,” Data & knowledge engineering, vol. 47, no. 2, pp. 237–267, 2003.
- [41] W. Van Der Aalst, Process Mining. Berlin, Heidelberg: Springer Berlin Heidelberg, 2016.
- [42] G. Di Federico and A. Burattin, “Do you behave always the same? a process mining approach,” in International Conference on Process Mining, pp. 5–17, Springer, 2022.
- [43] C. Fernández-Llatas, J.-M. Benedi, J. M. García-Gómez, and V. Traver, “Process mining for individualized behavior modeling using wireless tracking in nursing homes,” Sensors, vol. 13, no. 11, pp. 15434–15451, 2013.
- [44] A. Weijters and J. T. S. Ribeiro, “Flexible heuristics miner (fhm),” in 2011 IEEE symposium on computational intelligence and data mining (CIDM), pp. 310–317, IEEE, 2011.
- [45] C. W. Günther and W. M. Van Der Aalst, “Fuzzy mining–adaptive process simplification based on multi-perspective metrics,” in International conference on business process management, pp. 328–343, Springer, 2007.
- [46] J. J. Lull, J. L. Bayo, M. Shirali, M. Ghassemian, and C. Fernandez-Llatas, Interactive Process Mining in IoT and Human Behaviour Modelling, pp. 217–231. Cham: Springer International Publishing, 2021.
- [47] C. Fernandez-Llatas, B. Valdivieso, V. Traver, and J. M. Benedi, “Using process mining for automatic support of clinical pathways design,” Data mining in clinical medicine, pp. 79–88, 2015.
- [48] C. Fernandez-Llatas, S. F. Pileggi, V. Traver, and J. M. Benedi, “Timed parallel automaton: A mathematical tool for defining highly expressive formal workflows,” in 2011 Fifth Asia Modelling Symposium, pp. 56–61, IEEE, 2011.
- [49] M. Falah Rad, M. Shakeri, K. Khoshhal Roudposhti, and I. Shakerinia, “Probabilistic elderly person’s mood analysis based on its activities of daily living using smart facilities,” Pattern Analysis and Applications, pp. 1–14, 2022.
- [50] S. N. Blair and T. S. Church, “The fitness, obesity, and health equation: is physical activity the common denominator?,” Jama, vol. 292, no. 10, pp. 1232–1234, 2004.