Optimal prevention strategies for chronic diseases in a compartmental disease trajectory model
2Gender Medicine Unit, Division of Endocrinology and Metabolism, Department of Internal Medicine III, Medical University of Vienna, Spitalgasse 23, A-1090 Vienna, Austria
3Complexity Science Hub Vienna, Josefstädter Strasse 39, A-1080 Vienna, Austria
4Supply Chain Intelligence Institute Austria, Josefstädter Strasse 39, A-1080 Vienna, Austria
5Santa Fe Institute, 1399 Hyde Park Road, Santa Fe, NM 87501, USA
peter.klimek@meduniwien.ac.at
)
Abstract
In countries with growing elderly populations, multimorbidity poses a significant healthcare challenge. The trajectories along which diseases accumulate as patients age and how they can be targeted by prevention efforts are still not fully understood. We propose a compartmental model, traditionally used in infectious diseases, describing chronic disease trajectories across 132 distinct multimorbidity patterns (compartments). Leveraging a comprehensive dataset from approximately 45 million hospital stays spanning 17 years in Austria, our compartmental disease trajectory model (CDTM) forecasts changes in the incidence of 131 diagnostic groups and their combinations until 2030, highlighting patterns involving hypertensive diseases with cardiovascular diseases and metabolic disorders. We pinpoint specific diagnoses with the greatest potential for preventive interventions to promote healthy aging. According to our model, a reduction of new onsets by 5% of hypertensive diseases (I10–I15) leads to a reduction in all-cause mortality over a period of 15 years by 0.57 (0.06)% and for malignant neoplasms (C00–C97) mortality is reduced by 0.57 (0.07)%. Furthermore, we use the model to assess the long-term consequences of the Covid-19 pandemic on hospitalizations, revealing earlier and more frequent hospitalizations across multiple diagnoses. Our fully data-driven approach identifies leverage points for proactive preparation by physicians and policymakers to reduce the overall disease burden in the population, emphasizing a shift towards patient-centered care.
1 Introduction
In many western countries, there is a persistent trend of increasing life expectancy [1]. From 1999 to 2019, life expectancy in Europe increased by 7.8% [2], and specifically, in Austria by 3.8% and 6.0% for women and men, respectively [3]. This trend is expected to continue. By 2050, the proportion of the Austrian population over 65 years will increase from 19.4% (2019) to 27.7% [4, 5]. However, since 2011, the rate of increase in life expectancy has been slowing down in several EU countries, mainly due to a slowdown in improvements in mortality from cardiovascular disease and potentially due to increasing prevalence of diabetes and obesity [6]. In Austria, the life expectancy in self-perceived (very) good health decreased from 65.9 (2014) to 63.1 years (2019) for men and from 66.6 (2014) to 64.7 years (2019) for women [7, 8]. The increase in total life expectancy together with the decrease of life expectancy under healthy conditions may be explained in part by excellent acute medical care and emergency medicine, and at the same time, a lack of adequate prevention programs for noncommunicable diseases (NCDs) which would be necessary to improve health of an aging population [9].
An aging population is associated with an increase in the prevalence of chronic diseases [10]. As chronic diseases often share risk factors, this is expected to increase the number of people with multiple health conditions [11]. This phenomenon, referred to as ’multimorbidity’, is one of the major challenges facing countries with aging populations [12]. Most research on the increase in multimorbidity focuses either on a small or a specific subset of individuals [13, 14, 15] and/or specific chronic diseases [16, 17, 18]. Research on multimorbidity itself, in a broader context is rare, despite its pressing development, and varies in terms of study setting, data sources, study population and type of measure [19]. One reason for this knowledge gap is the lack of a clear definition of multimorbidity [20]. Studies often define multimorbidity as the presence of a certain number of diagnoses (two or more). However, disease progression and treatment depend strongly on which diseases co-occur [21, 12]. An alternative to simply defining multimorbidity by the count of diagnoses would be to define multimorbidty as the presence of disease patterns in the form of sequences of diseases individuals are diagnosed with over their life-course, so-called disease trajectories [22].
The field of network medicine has advanced the understanding of the nature of disease trajectories through numerous studies of so-called phenotypic comorbidity networks, where nodes represent diseases and links describe their associations, the observed relationships between diseases and various factors such as genetics, lifestyle, or environmental exposures. Population-wide electronic health records (EHR) or medical claims data have also allowed us to identify such trajectories on a large scale [23, 21, 27, 28, 29, 30, 31, 32, 33, 24, 25, 26]. Specifically, it was found that patients tend to develop diseases that are in close network proximity to diseases they have already been diagnosed with. This facilitates predicting future diseases based on medical history [23, 21]. A major challenge in studying long-term disease trajectories is the large number of possible disease combinations and their temporal permutations. By clustering frequently co-occurring diseases and quantifying how they condition each other, it is possible to reliably uncover long-term disease trajectories, as a series of disease combinations (health states), for populations within countries [22, 34]. However, studies on the temporal evolution of multimorbidity, especially in the context of an aging population, remain scarce, both in terms of retrospective data analyses [35, 36, 37], and for predictive modelling. The bottlenecks are methodological challenges and data requirements [38, 39].
Nevertheless, disease trajectory modelling holds the promise of identifying leverage points for optimal prevention schemes derived from a quantitative basis. Recent research suggests the existence of "critical points" or high-risk points in disease trajectories [22]. These points represent combinations of health conditions that, when taken together, inevitably increase the risk of acquiring further diseases and, ultimately, mortality. Prevention schemes should then be designed to target patient groups before they reach these "points of no return". Predictive and fully interpretable models for how patients follow their disease trajectories can then be used to perform ex ante assessments of a large set of potential prevention strategies to identify those that lead to optimal outcomes.
There is a tradition of using both quantitative network-based approaches and compartmental frameworks, to describe the health status of individuals, to study the public health effects of interventions, and to forecast epidemiological developments in the context of infectious diseases. This became apparent during the Covid-19 pandemic, where such models played a pivotal role in decision support. While hitherto such modelling approaches have remained largely unexplored for NCDs. Why there is such a remarkable methodological gap between communicable and noncommunicable diseases is not entirely clear. One reason may be that it is not clear to date if and how the disease-causing mechanisms that underlie chronic diseases can be put into mathematical language.
Here, we close this gap by developing a compartmental, network-based model for the investigation of chronic disease trajectory dynamics within the Austrian population. Our starting point is the observation that many chronic diseases tend to co-occur due to a shared disease etiology. For instance, diagnoses such as hypertension, dyslipidemia, or overweight (the metabolic syndrome) are well known risk factors for type 2 diabetes [40]. Diabetic patients are frequently diagnosed with diagnoses like polyneuropathy, stroke, cardiovascular diseases, or combinations thereof [41]. We identify groups or "multimorbidity clusters" of frequently co-occurring diagnoses (a cluster for the metabolic syndrome, several clusters for diabetic complications, etc.) and quantify how likely patients progress from one specific cluster to another over time. The result is a compartmental model in which every patient is assigned a health state, a cluster, per year. While for infectious disease dynamics these compartments typically correspond to e.g. susceptible, infected, or recovered individuals, for chronic diseases these compartments correspond to different multimorbidity clusters.
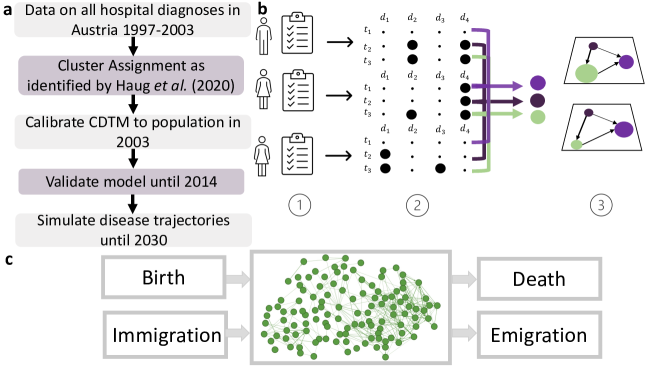
The approach is outlined in Figure 1. Using an extensive dataset covering all hospital diagnoses in Austria between 1997 and 2014 (approx. 45,000,000 hospital stays of about 9,000,000 individuals), a transition network between multimorbidity clusters describing patterns of co-occurring diseases (ICD-10 codes covered range from A00 to N99) was developed by Haug et al. (2020) [22]. Here, we extend this framework to a population-dynamics compartmental model and simulate the multimorbidity patterns of the entire Austrian population from 2003 to 2030, incorporating demographic changes (migration, birth, and death provided by the Austrian National Statistics Office) as well as individuals acquiring new diagnoses on the basis of their multimorbidity cluster, enabling both in- and out-of-sample predictions. Both, the incidences of the different diagnoses and the temporal development of multimorbidity within the population can be addressed in the new framework.
We demonstrate the versatility of this novel compartmental disease trajectory model (CDTM) in several case studies. Initially, we forward project the annual incidence of diagnoses (A00-N99) and combinations thereof in a baseline scenario. This projection considers the predicted changes in demographics by the national statistics office but no improvements in death rates, diagnostic procedures, treatments, etc. Subsequently, we conduct a series of simulations to assess the overall and long-term impact of hypothetical disease prevention efforts. We focus on specific diseases and assume that new therapies or increased surveillance lead to improved prevention rates for these diagnoses, resulting in a reduction in new onset diagnoses. Our model enables us to compute how this decrease in diagnoses affects the risk to progress to other multimorbidity patterns and their associated mortality across the entire diagnostic spectrum. By comparing the simulations of each hypothetically prevented diagnosis, we can quantitatively estimate which kind of preventions lead to the greatest overall reduction in mortality. Additionally, we study scenarios for the long-term impact of the Covid-19 pandemic. We estimate the impact of sequelae of a SARS-CoV-2 infection on the disease burden and expected deaths in the Austrian population in a pessimistic and optimistic scenario.
2 Methods
2.1 Data Characteristics and Compartmental Disease Trajectory Model (CDTM)
The compartmental, network-based approach employed in this study relies on a comprehensive dataset provided by the Austrian Ministry of Health. The dataset covers all hospital records from all hospitals in Austria from 1997 to 2014. The dataset covers over 45 million stays for over 9 million different individuals. For each stay, the sex, age-group (5-year interval), duration of the stay, exit reason as well as main and side diagnoses on three digit level ICD-10 codes are recorded.
To construct the multimorbidity network underlying the compartmental disease trajectory model (CDTM), we follow a recently proposed machine learning approach [22]. All diagnoses for a specific subset of individuals are extracted from the dataset (individuals who did not receive a diagnosis from 1997-2002 but did receive a diagnosis from 2003-2014) and the health state per patient and year are encoded as binary vectors, Figure 1b. Each entry corresponds to one of the 131 diagnose groups defined by the WHO. An entry with a value of 1 indicates that the individual was diagnosed with the respective diagnosis group, while a value of 0 indicates the absence of such a diagnosis. Note that these diagnoses are cumulative, indicating that an individual remains diagnosed with a disease throughout the observation period, as the dataset lacks information on the resolution or recovery of diagnoses over time. A hierarchical clustering algorithm (DIVCLUS-T) identified 132 multimorbidity patterns. These patterns, multimorbidity clusters, serve as nodes in a multiplex network, with directed edges representing transition probabilities between these patterns. Each layer of the network corresponds to a specific age and sex group. The directed edges between two clusters and are weighted based on the age- () and sex () dependent probabilities () of transitioning from one cluster to another within a single time step.
The nodes and links in this multilayer network provide the basis for the states and their transitions in a compartmental model, see Figure 1c.
We model the Austrian population by extracting all diagnoses of individuals with a hospital stay in the dataset from 1997-2003 and assigning them a multimorbidity cluster (compartment or network node) following Haug et al. (2020) [22]. We compare the number of individuals per age and sex group with the actual population size according to Statistics Austria at the start of 2003 and add the difference as into a compartment of individuals with no hospital stays at all (cluster 0). (Figure 1a) [4]. Individuals in the population are modeled as random walkers transitioning over the multimorbidity network. In particular, the model assumes that an individual with sex, , and age, , assigned to cluster, , transitions to another cluster with probability , as observed in the data.
Each multimorbidity cluster is defined by a set of 131 probabilities describing the probability of being diagnosed with diagnose group , given that the patient is in cluster . We calculate for each cluster and diagnose group a probability of being diagnosed with the respective group when transitioning to that cluster.
2.2 Calibration and Simulation
In each simulation year, individuals are assigned a specific multimorbidity cluster based on age and sex-dependent transition probabilities . If an individual’s cluster assignment differs from that of the previous simulation year, they are subsequently diagnosed with diseases in accordance with the probabilities associated with the 131 diagnostic groups corresponding to their new cluster (). This dynamic process enables the model to project and predict disease incidences on a yearly basis.
Also on an annual basis the model incorporates several demographic factors: individuals are born, migrate, and pass away according to historical data and a baseline scenario of population movements provided by Statistics Austria [4].
The number of deaths per cause (i.e. a specific disease) are only available until 2019. From 2019 onwards, our assumption is the distribution of deaths by cause from 2019 onwards. Forecasts of deaths by age and sex from 2019 onwards are only available for scenarios that already include the effect of the Covid-19 pandemic. Therefore, we use the 2019 projections and assume the same sex and age distribution of deaths from 2019 onwards to establish a baseline without the impact of the pandemic [42].
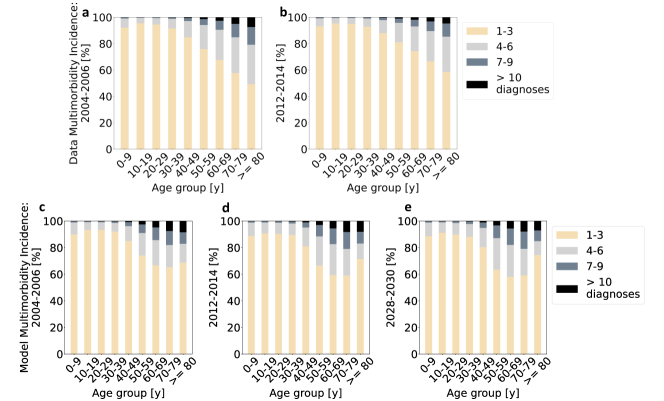
To calibrate the model, we adjust the age and sex-dependent transition probabilities by applying an age-dependent factor.We reduce the transition probabilities for the first three ten-year age groups (0-29 years) by 65%, for the age group 30-39 years by 60%, for the age group 40-49 years by 40%, for the age group 50-59 years by 20% and for the age group 60-69 years by 10%. The transition probabilities of the last three ten-year age groups (70+ years) are not reduced. The reduction factors were estimated via a grid search comparing the number diagnoses per individual in the simulation of the model and the dataset. See Figure S2 a-d for the number of diagnoses per individual across 10-year age groups (0-9, 10-19,…) from the dataset and the model result for 2004-2006 and 2012-2014.
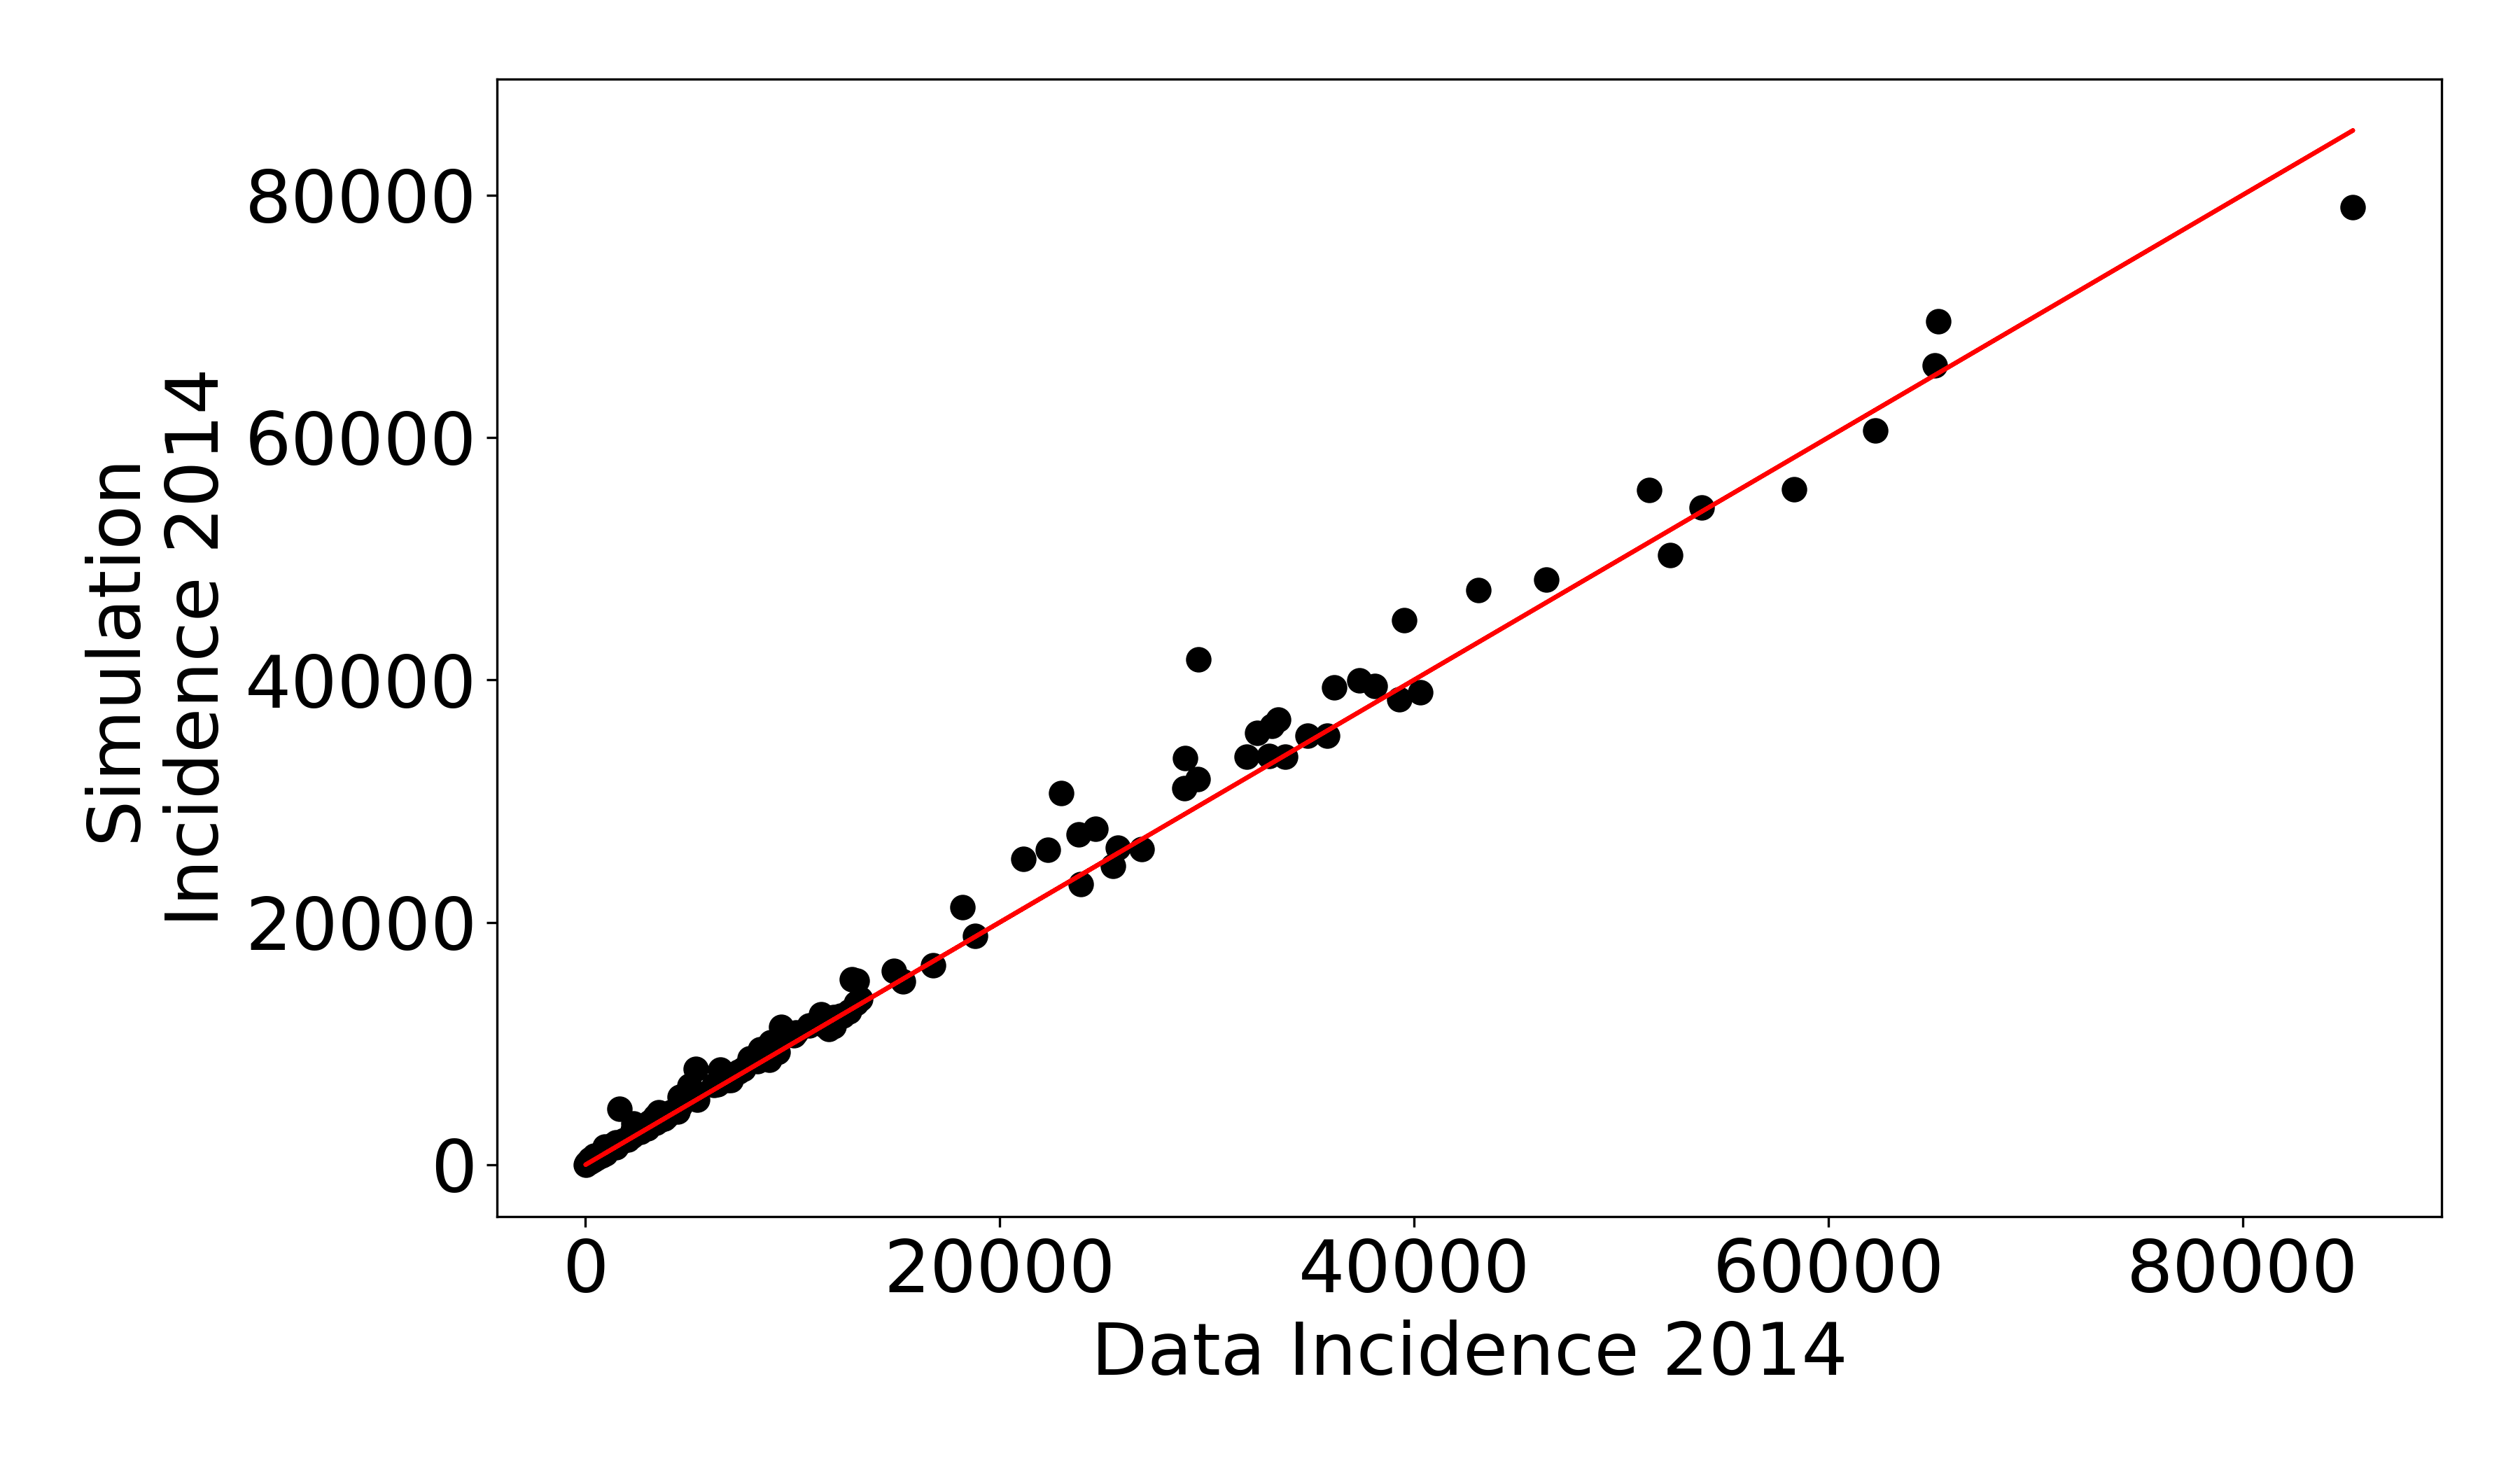
We simulate the model for the calibration period spanning from 2003 to 2014. During this calibration phase, the model computes, for each diagnosis group, age group, and sex group, the discrepancies in the diagnosed cases between the simulation result and data in age group , referred to as . The first three ten-year age groups are combined into one age group (0-29 years), the age groups 30-39 and 40-49 years are combined into one. The other age groups remain 10-year age groups. This simplification is introduced because the discrepancies among younger individuals grouped in ten-year age groups, are too small in the case of specific diagnosis groups. The values are subsequently distributed annually, factoring in age and sex groups, allowing for a refinement of the model and a more accurate representation of disease dynamics. See Figure S1 for incidences in 2014 from the dataset compared to the model result at the end of the calibration period, in 2014.
To distribute the discrepancies in diagnosed cases () across diagnostic groups, age groups, and sex groups, from 2015 onwards, we employ a rate calculation. Specifically, we determine a rate for each combination of diagnosis, age-, and sex group. We use the geometric mean of the rates from the data of the final three years of the calibration period, namely 2012, 2013, and 2014, for the forecast simulation period, spanning from 2015 to 2030.
2.3 Observables
We introduce several measures to describe the dynamics of the disease trajectories. The relative incidence change () of single diagnose groups refers to the measure of how the incidence of a particular diagnosis has changed in year , relative to the initial incidence in year .
| (1) |
To study the development of multimorbidity in terms of the number of diagnoses received, we define multimorbidity incidence as the frequency of individuals receiving diagnoses ( = 1-3, 4-6, 7-9, >10). To study the development of multimorbidity as specific disease patterns, we look at the relative occurrence of a multimorbidity cluster, , per year , which is defined as the ratio of transitions to cluster, , to the total number of transitions in that year.
The decrease in all-cause mortality (total number of deaths) due to reduction of new-onset diagnoses is measured in reduction in death numbers and prevented deaths per prevented diagnosis. We measure the reduction in death numbers by comparing the total number of deaths in a simulation run where the new-onset diagnoses of a particular diagnose group is reduced by a factor, , to deaths due to all death causes in a simulation with no reduction. Prevented deaths per prevented diagnoses are computed by dividing the total number of deaths by the total number of reduced diagnoses for the simulation where a certain diagnose group is reduced by a factor .
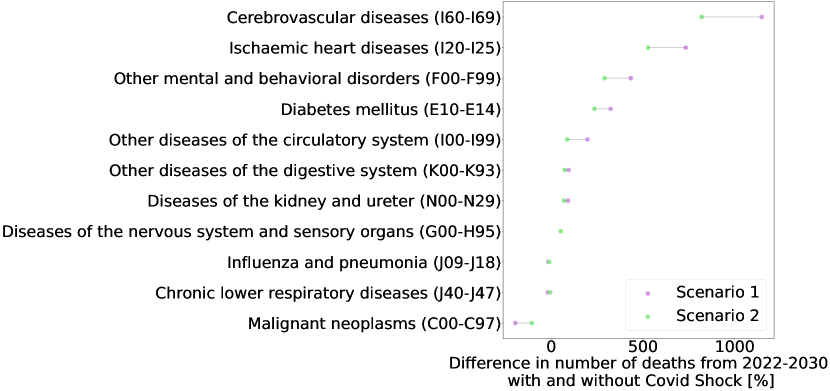
The impact of the Covid-19 Shock on the overall disease burden is estimated by computing the difference in number of diagnoses from 2022-2030 between the main and the respective Covid-19 Shock scenario, compared to the main scenario (difference in incidence). Additionally, we compute the average years until diagnosis and compare the Covid-19 Shock to the main scenario. This quantifies how much earlier, on average, individuals are diagnosed with a diagnose group as a result of the simulated Covid-19 Shock.
2.4 Scenarios
To assess the potential impact of interventions such as prevention efforts or the introduction of new medications, we perform scenario simulations with modified transition probabilities. In this framework, we annually reduce the incidence of one of the 131 diagnostic groups, thereby allowing us to evaluate the cumulative effects of these interventions over time. To reduce the incidence of one diagnose, , we reduce the transition probability , by multiplying it by a factor (in our case ):
| (2) |
The first term in equation (2), refers to the transition probability of individuals who will not be diagnosed with after transitioning from cluster to , the second term refers to the transition probability of individuals already diagnosed with and the last term refers to the transition probability (reduced by a factor ) of individuals who would be diagnosed with after transitioning to cluster .
We estimate how the Covid-19 pandemic might affect the future incidence of diagnoses and death numbers by implementing a "Covid-19 Shock". In the Covid-19 Shock scenario, we assume that every person in Austria has been infected with SARS-CoV-2 at least once by the year 2022. Subsequently, we simulate the associated mortality resulting from post-acute sequelae of SARS-CoV-2 infections based on empirical data [43]. To estimate the heightened likelihood of individuals being diagnosed with specific diseases following a SARS-CoV-2 infection, we employ Hazard Ratios (HR) reported in the retrospective cohort studies (Table S1). To calculate this increased probability, we analyze the frequency of diagnostic codes (per age- and sex group) specified in the retrospective cohort studies within the 131 diagnostic groups in the original dataset. Per age- and sex group, this frequency is then multiplied by the probability assigned to each diagnostic group. The resulting numbers are used to externally allocate the additional diagnoses within the population. Subsequently, we assign new multimorbidity clusters to individuals, taking into account all the diagnostic groups with which they have been diagnosed. For the annual number of deaths, we take derived death rates from the main scenario and multiply them by the number of diagnoses in the Covid-19 Shock scenarios.
3 Results
3.1 Impact of aging population on disease burden
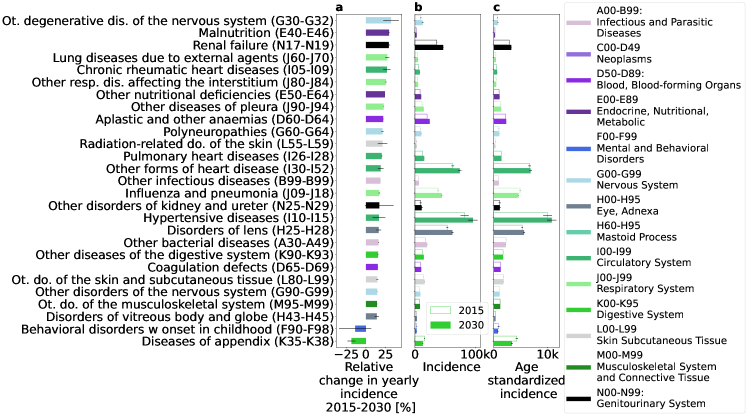
The out-of-sample simulation time span ranges from 2015 to 2030. Within this period we evaluate predictions for annual changes in the incidence of the 131 diagnostic groups, thereby facilitating an exploration of the evolving disease burden within the population. Figure 2a illustrates the relative change in incidence () between 2030 and 2015 for selected diagnoses ( > 13%) and Figure 2b the absolute incidence values for the years 2015 (unfilled bars) and 2030 (filled bars). Increases in incidence are observed for diseases affecting the nervous system, the genitourinary system and the circulatory system. For other degenerative diseases of the nervous system (G30-G32) we observe = 32.04% (9.92), from 9,700 (9600) diagnoses in 2015 to 13,000 (1,300) in 2030. For malnutrition (E40-E46) we find an increase of 24.49% (9.92), from 2,200 (13) diagnoses in 2015 to 2,800 (17) in 2030. For renal failure (N17-N19), = 29.21% (1.63), increasing from 36,000 (590) diagnoses in 2015 to 46,800 (760) diagnoses in 2030. These are all diagnosis codes primarily prevalent in elderly patients. Whereas a decrease in by 18.50% (5.00), from 15,800 (800) diagnoses in 2015 to 12,800 (640) in 2030, is visible for diseases affecting younger individuals such as behavioral disorders and diseases of the appendix (for information on incidence stratified by age, see Figure S3).
For age-standardized incidence values, the age structure in 2030 is standardized to the structure in 2015 (Figure 2c). An increase in age-standardized incidence, such as for renal failure (N17-N19), from 2,900 (50) diagnoses in 2015 to 3250 (50) in 2030, highlights that the changes in incidence observed in the Figure 2a and b are not influenced by demographic shifts (aging population) but by shifts in the overall health status of the population.
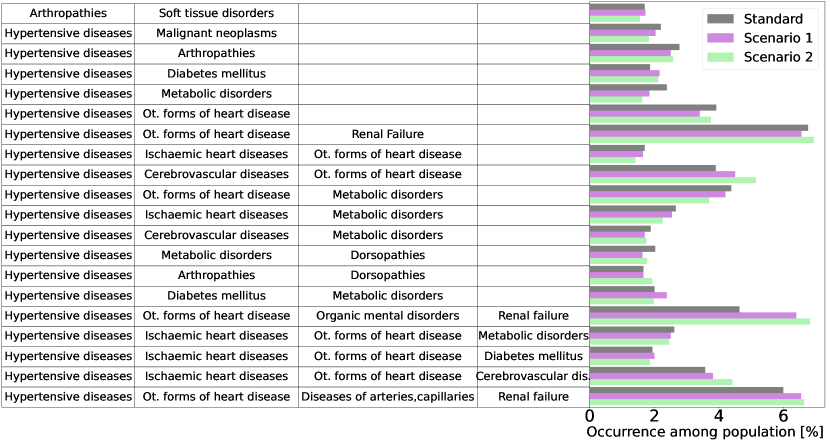
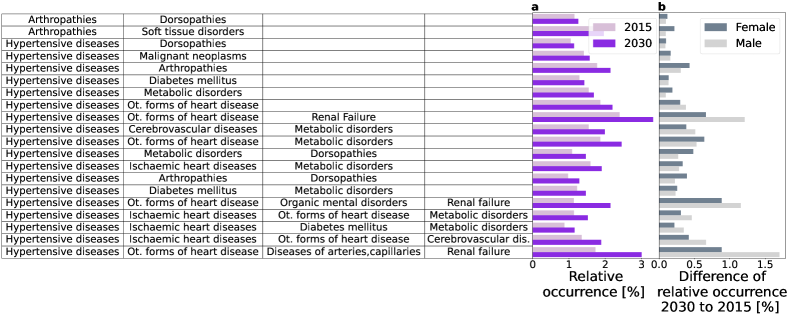
The CDTM further allows us to examine the development of the frequency of combinations of diagnoses from each multimorbidity cluster. Figure 3a offers insight into the 20 most assigned multimorbidity cluster in 2015, comparing the relative occurrence of these combinations in both 2015 and 2030. We show the inclusion diagnoses per multimorbidity cluster. The most common multimorbidity clusters are primarily those including hypertensive diseases. This does not change during the forecast period. For the disease pattern describing the co-occurrence of hypertensive diseases (I10–I15), other forms of heart disease (I30–I52), diseases of arteries, arterioles and capillaries (I70–I79) and renal failure (N17–N19) we find an increase in relative occurrence from 1.73% to 3.0% from 2015 to 2030. The relative occurrence of the pattern including hypertension, other forms of heart disease, organic, including symptomatic, mental disorders (F00–F09) and renal failure, increases from 1.13% to 2.14%. The third highest increase in relative occurrence from 2.40% to 3.32% is observed for hypertensive diseases, other forms of heart disease and renal failure. Figure 3b contrasts the difference in this relative occurrence between 2030 and 2015, stratified by gender. The difference in relative occurrence between 2015 and 2030 varies for males and females mainly in disease patterns including renal failure. For instance, males show an increase of 1.70% and females an increase of 0.88% between 2015 and 2030 in the disease pattern encompassing hypertensive diseases, other forms of heart disease, diseases of arteries, arterioles, and capillaries, and renal failure.
3.2 Leverage points for optimal prevention schemes
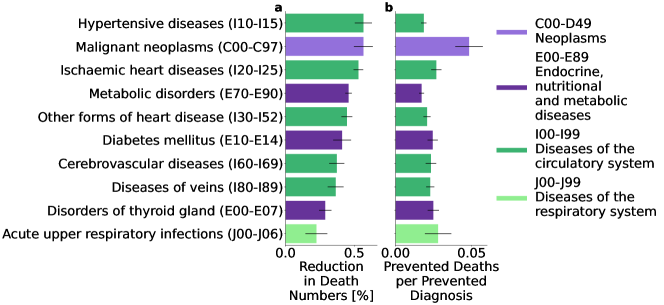
Specific interventions can be expected to lead to decreases in incidence. In the following, for each diagnosis, we evaluate how much a relative reduction of 5% in the transition probabilities leading to new onsets of the diagnosis impacts all-cause mortality, see Figure 4. We show the 10 diagnoses with the largest effect on all-cause mortality only for potentially preventable diseases (by medication, prevention efforts, vaccinations, etc.) (Figure 4 a). These groups include C00-D49, E00-E99, F00-F99, I00-I99, J00-J99 and N00-N99. We find the greatest reduction in deaths per diagnosis for diseases affecting the circulatory system, neoplasms, endocrine, nutritional and metabolic diseases, and diseases of the respiratory system. Each bar refers to the average relative reduction in the number of deaths over a period of 15 years per reduced diagnoses over 10 iterations due to a 5% reduction in the transition probabilities of individuals who would be diagnosed with the corresponding diagnosis on the y-axis.
For hypertensive diseases (I10-I15) we find a reduction of 0.57 (0.06)%, for malignant neoplasms a reduction of 0.57 (0.07)% and for ischaemic heart diseases (I20-I25) a reduction of 0.53 (0.04)% in all-cause mortality. These diagnosis groups are the main causes of death in Austria [44]. Less important causes of deaths are diseases of veins (I80-I89) (0.36 (0.06)%) and disorders of the thyroid gland (E00-E07) (0.29 (0.05)%), suggesting that a reduction of new onsets of diseases in these diagnose groups leads to a reduction in potentially fatal sequelae.
To account for a potential bias due to differences in the incidence of the reduced diagnose group and potential sequelae, we compute the ratio of prevented deaths per prevented diagnose. Note that we do not just count the prevented diagnoses of the diagnosis group on the y-axis, but include all groups to account for the number of sequelae prevented. We find that there are 0.05 (0.01) prevented deaths per prevented diagnosis due to a reduction of 5% of new onset malignant neoplasms, suggesting improvements in prevention of malignant neoplasms as the optimal leverage point (Figure 4 b).
3.3 Impact of post-acute Covid-19 sequelae on population health
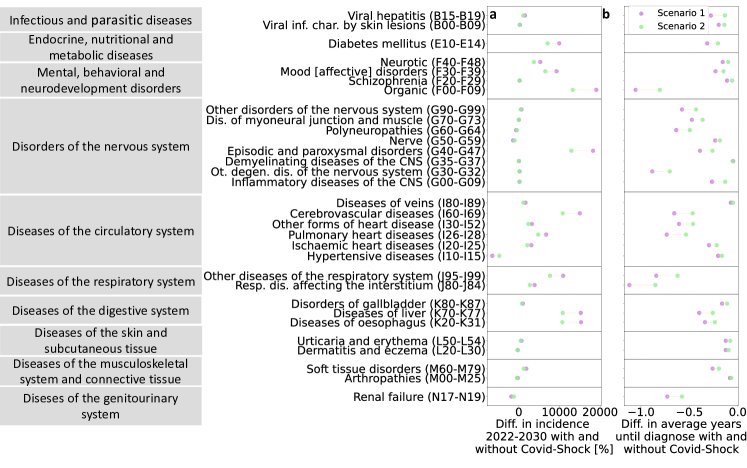
As another example, we evaluate the impact of the Covid-19 pandemic on the incidence rates of potential sequelae arising from SARS-CoV-2 infections, along with consequential shifts in all-cause mortality. In the pessimistic scenario 1, we reduce the HRs by 15%, and in scenario 2 by 40%. This reflects the potential influence of less severe viral variants and future vaccination campaigns. We analyze the difference in the total number of diagnoses accumulated over nine years (all new onset diagnoses from 2022-2030) between the baseline and Covid-19 Shock scenarios, compared to the baseline scenario (Figure 5a), as well as the average time until diagnosis between the main and the Covid-19 Shock scenarios (Figure 5b), serving as an indicator of expedited diagnosis within the Covid-19 Shock scenarios.
The largest differences between the baseline and Covid-19 Shock scenarios are observed for sequelae affecting the respiratory system, digestive system, and mental, behavioral, and neurodevelopment disorders. For other respiratory diseases (J95–J99), scenario 1 predicts 10,905 more diagnoses (equivalent to 0.13 diagnoses per 1,000 persons per year, based on the population in 2022 population [45]), while scenario 2 forecasts 7,684 additional diagnoses (0.09 diagnoses per 1,000 persons per year) compared to the baseline scenario. On average, diagnoses occur 0.84 years earlier in scenario 1 and 0.82 years earlier in scenario 2 than in the baseline scenario.
For respiratory diseases affecting the interstitium (J80–J84), scenario 1 shows 3,900 additional diagnoses (0.05 diagnoses per 1,000 persons per year) and scenario 2 2,700 diagnoses (0.03 diagnoses per 1,000 persons per year) more compared to the baseline scenario, with diagnoses occurring 1.12 and 0.85 years earlier, respectively. We find 15,300 more diagnoses (0.19 diagnoses per 1,000 persons per year) of diseases of the liver (K70–K77) in scenario 1 and 10,800 diagnoses more (0.13 diagnoses per 1,000 persons per year) in scenario 2, with diagnoses occurring 0.4 and 0.26 years earlier, respectively.
Organic, including symptomatic, mental disorders demonstrate 19,000 and 13,300 more diagnoses (0.23 and 0.16 diagnoses per 1,000 persons per year) in scenarios 1 and 2, respectively. Diagnoses occur 1.06 and 0.81 years earlier in scenario 1 and 2, respectively.
We examine the contrast in the number of fatalities recorded during the period spanning 2022 to 2030 between the main and the two Covid-19 Shock scenarios (see Figure S4). Notably, there is a rise in deaths attributed to cerebrovascular diseases (I60–I69: 1147-819 deaths), ischaemic heart diseases (I20–I25: 733-538 deaths), other mental and behavioral disorders (F00–F99: 434-291 deaths) and diabetes mellitus (E10–E14: 324-236 deaths) in response to the Covid-19 Shock. In contrast, fatalities from malignant neoplasms exhibit a reduction across in both Covid-19 Shock scenarios. This may be attributed to individuals succumbing to alternative causes of death earlier in the simulation.
3.4 Model quality
Figure S1 represents the incidences of 131 diagnostic groups resulting from both the simulation and the dataset at the end of the calibration period in 2014. We find good agreement between the annual incidences in the data and the simulation with a Pearson correlation coefficient of across all diagnoses.
Figure S2 shows a comparative analysis of the dynamics of multimorbidity incidence between the simulation and the dataset. In addition, we present the projection of multimorbidity incidence for the time span 2028-2030, derived from the simulation results. In Figure S2, the number of individuals receiving diagnoses is expressed as a percentage within each age group. Notably, marginal fluctuations are observed in the evolution of the multimorbidity incidence.
The model effectively captures the dynamics of multimorbidity among the younger age cohorts (0-59). For the three oldest age groups ( 60), deviations from the empirical data become apparent when comparing the results for 2012-2014 between the data and the model. In particular, the proportion of highly multimorbid individuals (more than ten diagnoses) is overestimated by a few percentage points in the model. In both, data and model, we see that the distribution of the age-specific multimorbidity incidence remains fairly robust over time, even in the projections until 2030.
We find that some diagnoses show a substantial inflation in the discrepancy between data and simulation over time. There are 36 diagnostic groups with an absolute error in 2014 exceeding 5% of the 2014 incidence and surpassing 500 cases per annum, as well as those manifesting a 1.3-fold error increase from 2010 to 2014. These diagnoses are excluded from further analysis of changes in incidence.
4 Discussion
We generalize compartmental models as used in epidemiology for modeling infections diseases in a way that they can be used for long-term predictive modeling of chronic diseases. The main idea behind it is to reconstruct individual chronic disease trajectories between different sets of pathological conditions that are represented as "compartments".
The essence of the model is that it can be fully calibrated from actual nationwide observational data. We present a realization of the model that is based on an extensive dataset of hospital diagnoses in Austria from 1997 to 2014. We simulate demographic changes (births, migration, deaths) and the acquisition of new diagnoses based on a multimorbdity network. We calibrate the model within the period 2003-2014 and forecast changes in the incidence of 131 diagnostic groups and combinations thereof from 2015 to 2030. To our knowledge, the CDTM is the first of its kind by encompassing 131 diagnostic groups spanning diseases from A00-N99 across all age groups. This comprehensive microsimulation framework allows for realistic projections of the incidence of individual diseases and multimorbidity. Additionally, it offers a valuable framework for evaluating the ramifications of various scenarios on the disease burden within the population, such as prevention efforts, new medication or new diagnostic techniques. We identify diagnoses which, when targeted with prevention efforts could decrease all-cause mortality and promote healthy aging in an optimal way.
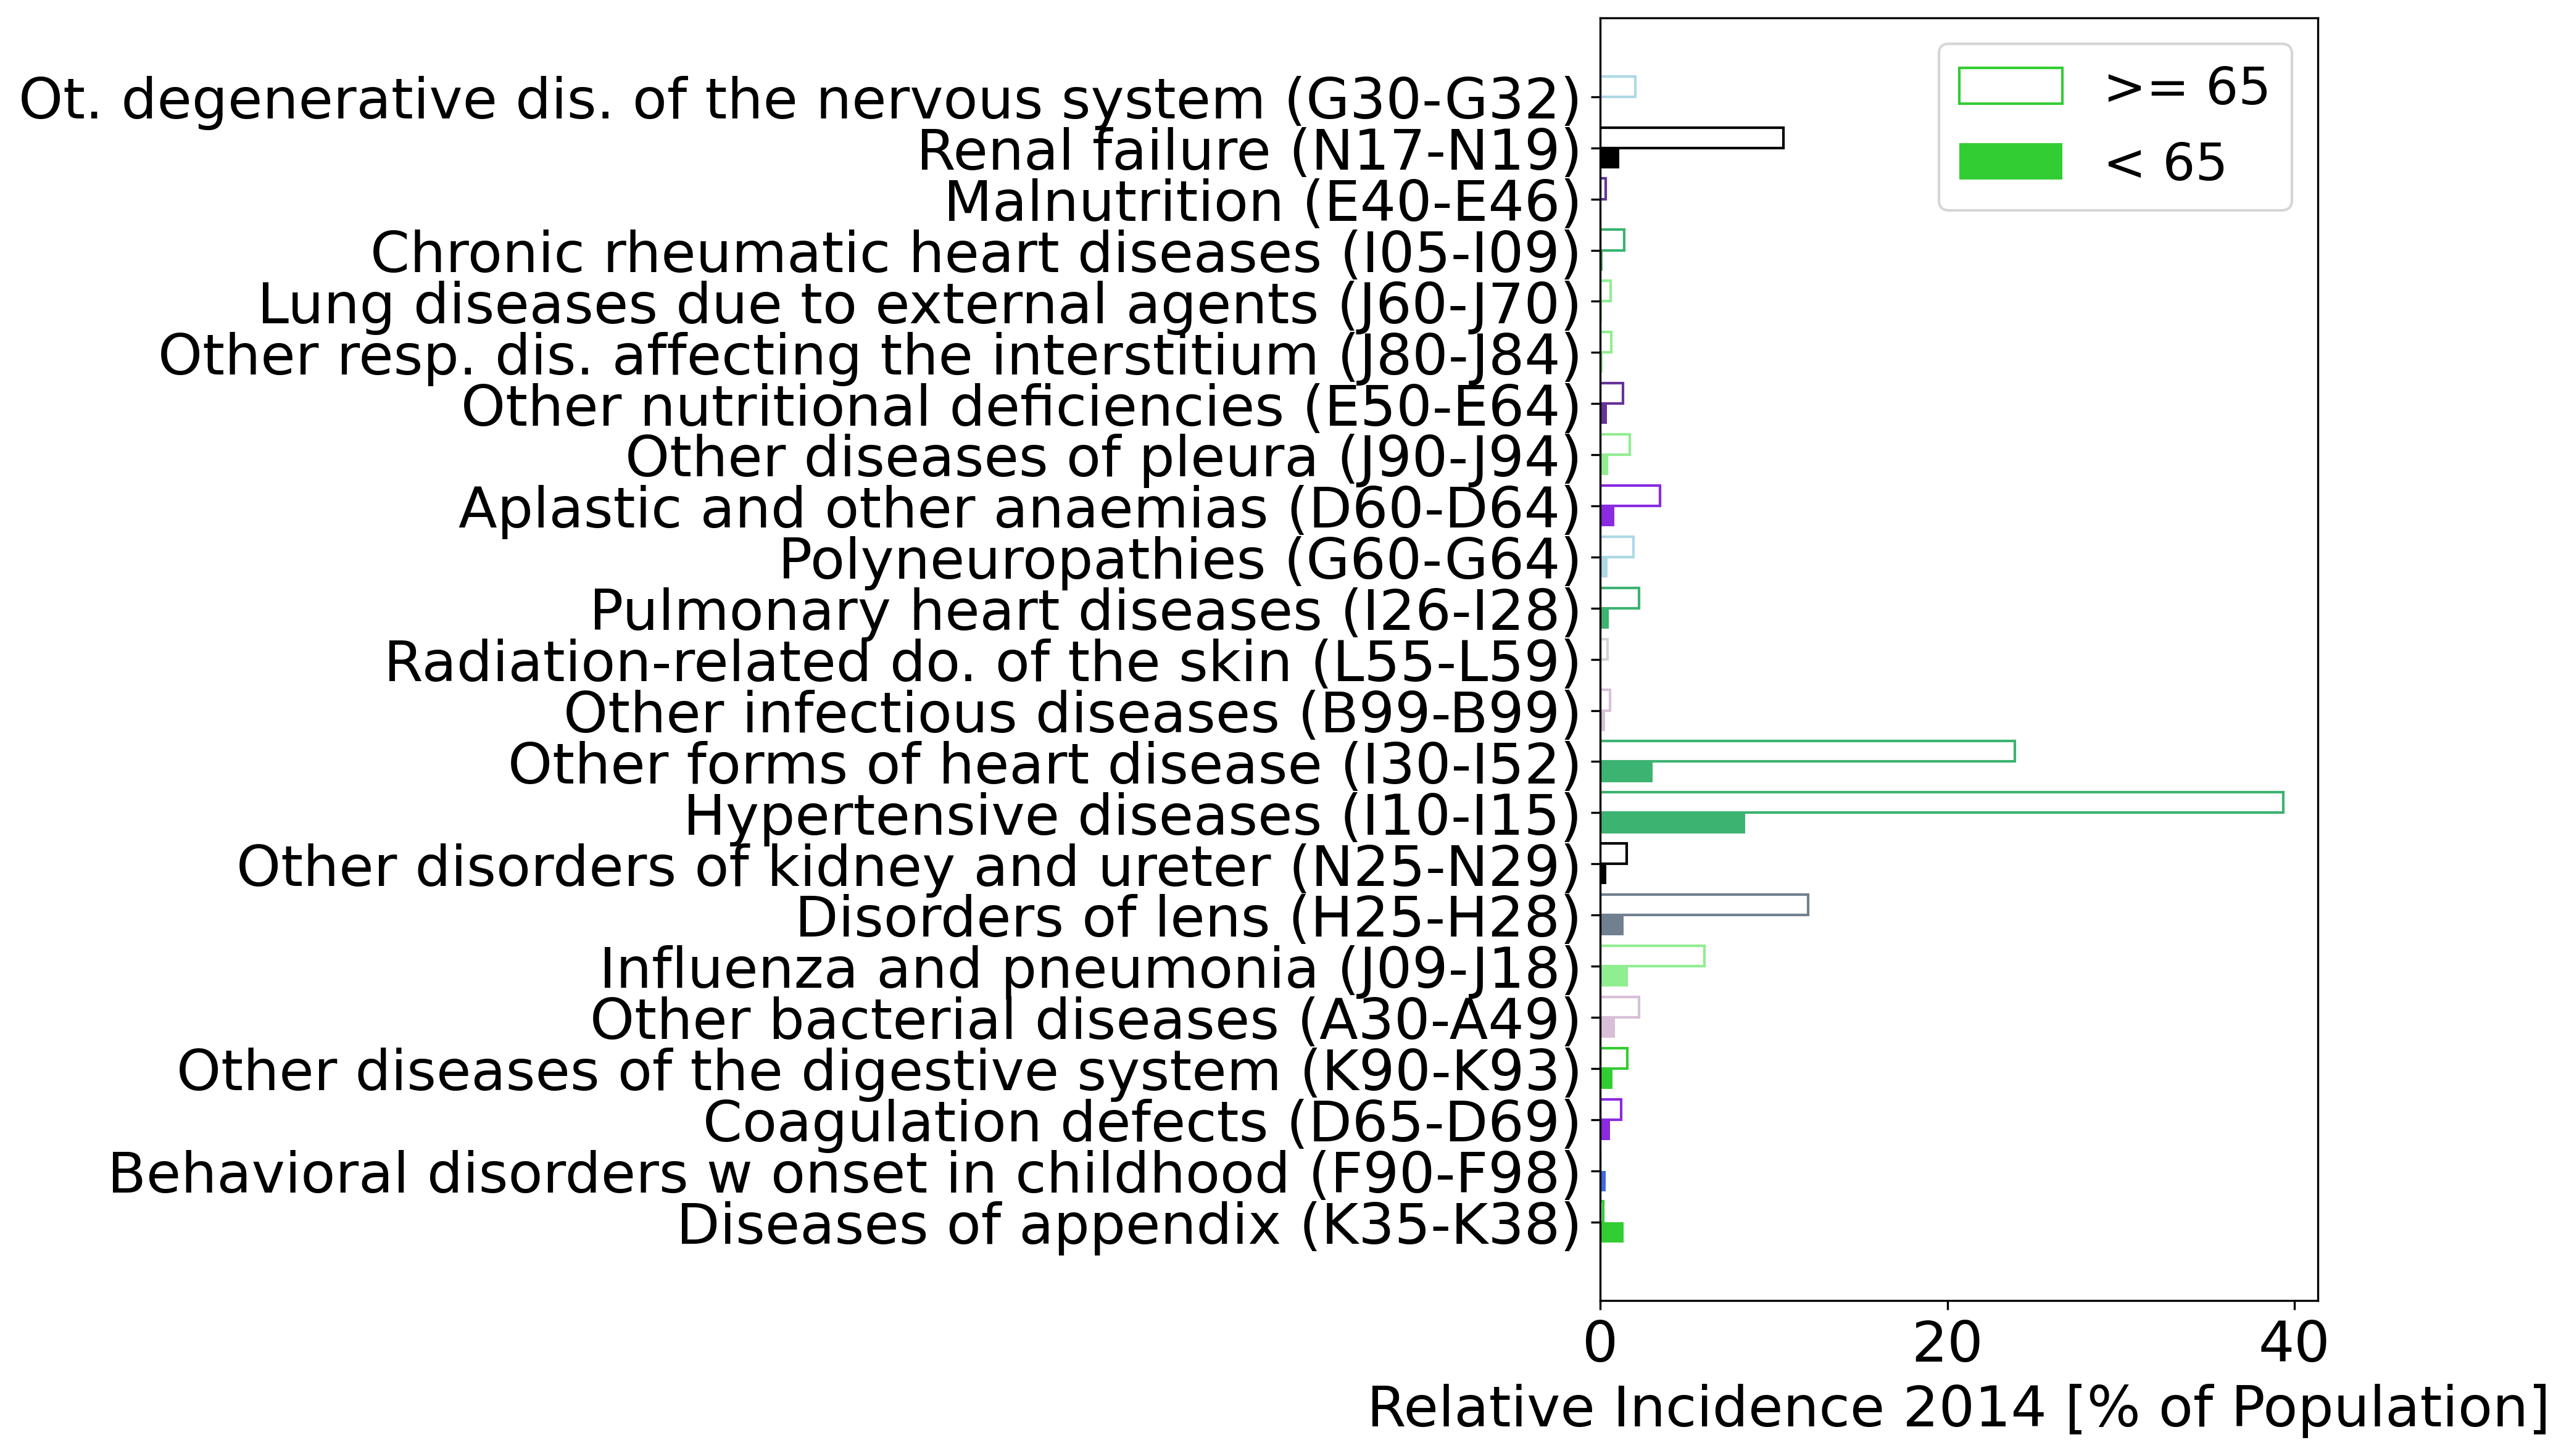
In our baseline scenario, where we simulate the projected changes in births, migration, and deaths as forecasted by the national statistics office, without considering alterations in mortality rates, diagnostics, etc., we observe a relative increase in the incidence of chronic diseases affecting the nervous system, genitourinary system, metabolic diseases, and those impacting the cardiovascular system. In Figure S3, the relative incidence stratified by above/below 65 shows that these diagnoses are more common among individuals above 65. In contrast, the diagnose groups where we observe a decrease in relative incidence, behavioral disorders with onset in childhood (F90-F98) and diseases of appendix (K35-K38) are more common among individuals under 65.
The model allows us to examine not only changes in the annual incidence of individual diagnoses, but also changes in the incidence of multimorbidity patterns over time. We observed that the 20 most common multimorbidity clusters that individuals transitioned to in 2015 all showed an increase in relative occurrence (transitioning from one cluster to another) in 2030. 18 out of the 20 most common clusters describe disease patterns including hypertensive diseases (I10-I15), among these are also the most pronounced increases from 2015 to 2030 such as a disease pattern describing hypertensive diseases (I10-I15), other forms of heart disease (I30-I52) and renal failure (N17-N19). This finding is in line with existing literature, which consistently identifies hypertension as one of the most prevalent chronic conditions, either in isolation or in combination with other chronic conditions such as diabetes, hyperlipidemia, ischemic heart disease and chronic kidney disease [46, 47, 48].
The CDTM now enables us to provide concrete quantitative estimates for the future development of such multimorbidity clusters under certain conditions. From 2015 to 2030, an average increase of 0.7% in the occurrence of clusters where individuals have at least four diseases is expected. This means that by 2030, 20,700 more individuals will transition to a cluster describing a disease pattern encompassing four or more diseases compared to 2015. This indicates a notable escalation in the complexity of health conditions within the population, suggesting a heightened disease burden that may necessitate more comprehensive healthcare management strategies.
Healthcare costs of multimorbidity are difficult to estimate, as the costs of single diseases are not necessarily additive and are likely to depend which diseases co-occurr [49]. Using estimates from a systematic review on the costs of multimorbidity and our results on the occurrence of multimorbidity clusters we can approximate an the expected cost increase for selected multimorbidity clusters. We estimate increased costs of I$ 8.7 million (95% CI: I$ 8.5 million - I$ 8.9 million) for hypertensive diseases and dorsopathies and I$ 29.8 million (29.1 million-30.5 million) for hypertensive diseases and arthropathies (average annual direct medical costs of I$ 13,300 (13,000-13,600 95% CI) for hypertension and musculoskeletal disorders) in 2030 compared to 2015. For hypertensive diseases and diabetes mellitus we estimate an increase of I$ 13.1 million (12.8 million-13.5 million) (average annual direct medical costs of I$ 14,300 (13,900-14,700) for hypertension and type 2 diabetes) and an increase of I$ 37.2 million (36.4 million -38 million) for hypertensive diseases and other forms of heart disease (I$ 17,900 (17,500-18,300) for hypertensive diseases and heart/vascular conditions) [49].
The largest differences in the relative occurrence increase between men and women is observed in disease patterns involving renal failure, with men experiencing a larger increase. This aligns with existing literature indicating that while chronic kidney disease (CKD, N18) is more prevalent among women, the combination of CKD with cardiovascular diagnoses is more commonly observed among men [50, 51].
Using the novel model, we develop a framework to study the effectiveness of mitigation efforts (such as vaccinations or other preventive measures) in reducing causes of death. For each diagnosis, to mimic a prevention measure, we impose a 5% reduction in the transition probability for each individual who would be diagnosed in the following timestep with the respective diagnosis. We also reduce the externally imposed incidence of that diagnosis by 5%. We find the largest reduction in deaths for each prevented diagnose for diseases affecting the circulatory system (hypertensive diseases (I10-I15), ischaemic heart diseases (I20-I25), cerebrovascular diseases (I60-I69) and diseases of veins (I80-I89)), malignant neoplasms (C00-C97), endocrine, nutritional diseases (metabolic disorders (E70-E90), diabetes mellitus (E10-E14) and disorders of the thyroid gland (E00-E07)) and diseases of the respiratory system (acute respiratory infections (J00-J06)). We find that prevention efforts regarding these diagnoses have the potential to effectively promote healthy aging most optimally.
At a global level, high blood pressure was the 6th leading risk factor for disability-adjusted life years (DALYs) in women in 1990 and had risen to be the leading risk factor for women by 2019, followed by high fasting plasma glucose and high body mass index, thus representing the full spectrum of the metabolic syndrome [52]. In men, smoking was the third leading risk factor in 1990 and had risen to be the leading risk factor for by 2019, followed by high blood pressure and high fasting plasma glucose. In Austria, hypertension moved to the leading risk factor for DALYs in women, followed by smoking and high body-mass index. Smoking is the leading risk factor in men in Austria, followed by high blood pressure and alcohol use [52]. More than half of the population over the age of 60 suffer from increased blood pressure with many patients undetected and/or undertreated [53]. Hypertension relates to many other severe diseases and in combination with obesity, greatly increases the risk of heart failure and, in the presence of concomitant diabetes even more renal disease and vasculopathy [54]. Therefore, many diseases including cardiometabolic disorders could indeed be prevented by better screening, early diagnosis and better treatment of modifiable risk factors like blood pressure, LDL cholesterol, glucose and body weight and prevention of obesity, diabetes and hyperlipidemia [55, 56]. Many studies have shown that the majority of patients do not reach their target levels even under medication, probably because of drug side effects, lack of adherence or clinical inertia [57, 58, 59, 60].
Reducing smoking, especially among women, and alcohol consumption, especially among men, would also help to reduce multimorbidity and increase life expectancy in Austria [9]. In fact, the incidence of vascular diseases and many types of cancer could be reduced or prevented by increased public health efforts with a special focus on the prevention of infections, obesity, alcohol and smoking [55]. In addition, new and more effective drugs that reduce hyperglycaemia and obesity and additionally reduce the risk of cardiovascular disease, heart failure and renal failure, such as GLP-1 RA and SGLT2 inhibitors, could help to reduce multimorbidity and premature mortality in the future [61]. New lipid-lowering drugs with low adverse events and easy long-term use could also help reduce vascular and possibly neurodegenerative events [62]. We did not see a large effect of sex on our results of the development of multimorbidity patterns. Men show a slightly greater increase in morbidity and mortality due to renal failure. In fact, men are more likely to be on haemodialysis, although women are more likely to have mild or moderate renal impairment. Better screening for kidney disease and treatment of diabetes and vascular problems will reduce the risk of kidney failure in older people.
An interesting observation was that reduction of thyroid diseases would have great impact on reduction of multimorbidity and death rates. Thyroid dysfunctions particularly hypothyroidism are very common especially in women. These disorders can be easily detected and treated in most cases. Thyroid hormones are essential for controlling body temperature, energy expenditure and cardiometabolic function. Associations between thyroid function and arrhythmias are well known and a thyroid-cardiac axis has been proposed, which may explain the clinical observation of an association between thyroid function and mortality [63]. Hyperthyroidism and thyreotoxicosis can dramatically increase mortality risk [64]. Both hypothyroidism and hyperthyroidism have been associated with an increased risk of cardiovascular morbidity and mortality in epidemiological studies and meta-analyses. There are several possible pathophysiological mechanisms linking thyroid and cardiovascular disorders such as endothelial dysfunction, blood pressure changes, dyslipidemia, and low-grade systemic inflammation [65].
Venous disorders (I80-I89) are, like disorders of the thyroid gland a less common causes of death. However, they are common, especially in women, and represent a large health care burden. Our analysis revealed that a reduction of new onsets of diseases of veins leads to a reduction in potentially deadly sequelae. Venous disorders comprise conditions of varying severity and pathology, including venous thromboembolic disorders resulting from dysregulated coagulation as well as chronic venous disease resulting from tissue damage due to prolonged venous hypertension [66]. However varicose veins also dramatically increase the risk of deep venous thrombosis. In addition, the postthrombotic syndrome affects up to 60% of patients with deep venous thrombosis. In recent decades, there has been a steady increase in thromboembolic events, including pulmonary embolism, with high rates of recurrence and increased risk of mortality [67]. There are multiple risk factors such as increased age, obesity, prolonged immobility, fractures, hospitalisations and conditions associated with impaired haemostasis such as cancer, diabetes, autoimmune diseases and infections including Covid-19 and pregnancy. It is therefore plausible that a greater focus on possible preventive measures and the reduction of venous disease could imply a large reduction in healthcare costs and morbidity.
As a further demonstration of the versatility of the compartmental disease trajectory model (DCTM), we implement a Covid-19 Shock to estimate the long-term health impact of the Covid-19 pandemic on the Austrian population for both, a pessimistic and an optimistic scenario. Using hazard ratios for being diagnosed with certain sequelae of a SARS-CoV-2 infection drawn from multiple respective cohort studies (see table S1), we study the relative incidence difference of the baseline scenario and the two Covid-19 Shock scenarios. We find the most pronounced increase in incidence (2022-2030) compared to the baseline scenario for other respiratory diseases (43.12-56.17% and 7,700-10,900 diagnoses), for respiratory diseases affecting the interstitium (43.81-55.88% and 2,700-3,900 diagnoses), diseases of the liver (32.13-42.32% and 10,800-15,300 diagnoses) and organic, including symptomatic, mental disorders (28.75%-36.48% and 13,300-19,000 diagnoses). This aligns with our approach, as these sequelae are associated with the highest Hazard Ratios (HRs), except for diseases of the liver. This suggests that the increase in relative incidence of liver diseases is not solely a direct effect of the Covid-19 shock but may also be attributed to it being a sequelae of one of the other conditions. A study of the costs of multimorbidity found average annual direct medical costs of I$ 36,800 (36,400-37,300) for respiratory and mental health conditions and I$ 35,000 (34,900-35,300) for respartory and heart/vascular conditions [49]. We find that on average, individuals are diagnosed with organic, including symptomatic, mental disorders 0.8-1.1 years earlier in Covid-19 Shock scenarios 2 and 1 compared to the baseline scenario. For respiratory diseases affecting the interstitium, individuals are diagnosed up to 0.9-1.1 years earlier. This could potentially lead to an accumulation of more diagnoses as multimorbidity is more compressed towards older ages in simulations without the Covid-19 Shock.
The present study is subject to several limitations. One is limitations in data availability. The hospitalization dataset contains only information until up to 2014 and recent changes, such as medical advances concerning certain diseases, new medication or improvements in diagnostics are not covered. We partially mitigate this issue by evaluating the change in incidence of diagnoses without an error inflation over time, i.e. the difference between data and model incidence (the error) is not changing (in- or decreasing) by more than 1.3 in the last five years of the calibration phase. Another limitation is that it is not possible to distinguish from the data whether a patient did not require further hospitalizations for medical reasons or discontinued his or her treatment for other reasons. The model only examines cumulative health states. It is however reasonable to assume that, especially severe, chronic diseases affect the health state of a patient on a long-term basis. Another shortcoming is the lack of information on outpatient contacts, doctor visits, diagnoses for deaths outside the hospital, socio-economic status and prescribed medications is not available. Finally, the dataset was originally collected for billing purposes, which leads to a potential bias in terms of over- or under-representation of diagnoses.
Data on births, migration, deaths and causes of death are provided by official statistics, ’Statistics Austria’. The forecasts on number of births, migration and deaths (2022 onwards) are taken from the main scenario of Statistics Austria. Data on causes of death are only available up to 2019. We assume that the distribution of death numbers across the different causes remains constant after 2019. Therefore the model doesn’t capture changes in death rates by cause. In addition, the projected number of deaths from 2019 onwards assumes the age and sex distribution of deaths by cause in 2019, as the projected number of deaths, stratified by age and sex, are only available for scenarios that already include the effect of the Covid-19 pandemic. This means that the model accurately captures the total number of deaths, but it does not take into account the different trends in the age and sex distributions.
On a methodological level, we make two important adjustments to the multimorbidity network by Haug et al. (2020) [22]. First, we compute new probabilities of being diagnosed with disease, , given an assignment to cluster, , to calibrate the model at initialization to the incidences in the data in 2003. Second, we rescale the age- and sex-dependent transition probabilities overall (same scaling factor for each diagnosis) by an age-dependent factor , simulate from 2003-2014 and externally assign the difference per age-, sex- and diagnose group to calculate rates for the forecast period. Using the transition probabilities without adjustment does capture the development of incidence per diagnosis group in the calibration period 2003-2014. However, the use of unadjusted transition probabilities results in the model not correctly capturing the dynamics of multimorbidity (number of individuals diagnosed with 2 or more diseases) in the data. Note, that our population cohort differs from the cohort used to construct the network in [22], which consisted of individuals with no recorded diagnoses in 1997-2002. The population cohort studied here includes these individuals, hence adjustments in the transition rates are necessary.
The implementation of the Covid-19 Shock relies on assumptions taken over from the literature. These should be considered when interpreting the results. We assume, that each individual in the model population has been infected once by 2022. The HRs used are from different retrospective cohort studies [68, 69, 70, 71] which were mainly conducted early-on in the pandemic. Therefore, we assume a reduction of the HRs by 15% (scenario 1) and 40% (scenario 2) due to less severe virus variants and vaccination rollouts, respectively. We provide an estimated range of the impact of the pandemic on the healthcare burden and not exact incidence forecasts. Further studies on sequelae of SARS-CoV-2 can be used to make more precise estimates on how the Covid-19 pandemic affects the healthcare system in terms of chronic disease incidence and multimorbidity.
Additional research is required to investigate the progression of multimorbidity, particularly in the context of an aging population and socioeconomic factors. It has been found that the onset of multimorbidity occurs 10 to 15 years earlier for people living in socioeconomically disadvantaged regions [72, 73]. Applying the presented CDTM approach to a different country is not only essential for validation but also facilitates the discernment of disparities in multimorbidity attributed to variations in healthcare systems and the overall health status of the population. Furthermore, it would be of great interest to study the impact of different shocks on the burden of disease, such as heat waves or other climate change-related scenarios.
Author Contributions
PK conceptualized and supervised the project. PK and KL devised the analytic methods. KL carried out the analysis and produced the plots and graphics. KL and PK wrote the first draft of the manuscript. AK-W and ST made critical comments regarding the manuscript. AK-W contributed medical expertise regarding the medical interpretation of the findings and in developing medical hypotheses. AK-W, ST, KL and PK conducted reviewing and editing of the manuscript. All authors read and approved the final manuscript.
Data Availability Statement
This study was conducted using a pseudonymized research dataset only accessible for selected research partners under strict data protection regulations. Data on disease cluster and sex- and age-stratified transition rates between the different clusters is available from the authors upon request.
Competing Interests Statement
The authors have declared that no competing interests exist.
Code Availability
The underlying code for this study [and training/validation datasets] is not publicly available but may be made available to qualified researchers on reasonable request from the corresponding author.
References
- [1] World Health Organization “Global Health Estimates: Life expectancy and leading causes of death and disability” URL: https://www.who.int/data/gho/data/themes/mortality-and-global-health-estimates/ghe-life-expectancy-and-healthy-life-expectancy
- [2] Our World Data “Life Expectancy” URL: https://ourworldindata.org/life-expectancy
- [3] Statistics Austria “Healthy life expectancy”, 2024 URL: https://www.statistik.at/en/statistics/population-and-society/health/health-status/healthy-life-expectancy
- [4] Statistics Austria “Population projections for Austria and federal states”, 2024 URL: https://www.statistik.at/en/statistics/population-and-society/population/demographische-prognosen/population-projections-for-austria-and-federal-states
- [5] Norman Mukasa and Ronald Schoenmaeckers “Ageing policies – access to services in different Member States. Country study on Austria (Annex I)”, 2021, pp. 36
- [6] V Raleigh “Trends in life expectancy in EU and other OECD countries: Why are improvements slowing?”, 2019 DOI: https://doi.org/10.1787/223159ab-en
- [7] Statistics Austria “Healthy Life Years at birth since 1978 by self-perceived health status and sex - in years”, 2022 URL: https://www.statistik.at/en/statistics/population-and-society/health/health-status/healthy-life-expectancy
- [8] European Observatory Health Systems and Policies “Austria: Country Health Profile 2021”, 2021 URL: https://eurohealthobservatory.who.int/publications/m/austria-country-health-profile-2021
- [9] Florian Bachner et al. “Health System Review 2018”, 2018
- [10] Cheng Hwee Soh, Syed Wajih Ul Hassan, Julian Sacre and Andrea B. Maier “Morbidity Measures Predicting Mortality in Inpatients: A Systematic Review” In Journal of the American Medical Directors Association 21.4, 2020, pp. 462–468.e7 DOI: 10.1016/j.jamda.2019.12.001
- [11] Christopher J M Whitty et al. “Rising to the challenge of multimorbidity” In BMJ, 2020, pp. l6964 DOI: 10.1136/bmj.l6964
- [12] Jonathan Pearson-Stuttard, Majid Ezzati and Edward W Gregg “Multimorbidity—a defining challenge for health systems”, 2019, pp. e599–e600 DOI: 10.1016/S2468-2667(19)30222-1
- [13] Alessandra Marengoni, Bengt Winblad, Anita Karp and Laura Fratiglioni “Prevalence of Chronic Diseases and Multimorbidity Among the Elderly Population in Sweden” In American Journal of Public Health 98.7, 2008, pp. 1198–1200 DOI: 10.2105/AJPH.2007.121137
- [14] Ran Zhang et al. “Prevalence and patterns of multimorbidity among the elderly in China: a cross-sectional study using national survey data” In BMJ Open 9.8, 2019, pp. e024268 DOI: 10.1136/bmjopen-2018-024268
- [15] Hendrik Bussche et al. “Which chronic diseases and disease combinations are specific to multimorbidity in the elderly? Results of a claims data based cross-sectional study in Germany” In BMC Public Health 11.1, 2011, pp. 101 DOI: 10.1186/1471-2458-11-101
- [16] Martin Fortin, Catherine Hudon and Jeannie Haggerty “RPerseearvchaalrteicnle ce estimates of multimorbidity: a comparative study of two sources”, 2010, pp. 6
- [17] Anna J Koné Pefoyo et al. “The increasing burden and complexity of multimorbidity”, 2015, pp. 11
- [18] Miguel J. Divo, Carlos H. Martinez and David M. Mannino “Ageing and the epidemiology of multimorbidity” In European Respiratory Journal 44.4, 2014, pp. 1055–1068 DOI: 10.1183/09031936.00059814
- [19] Iris Szu-Szu Ho et al. “Examining variation in the measurement of multimorbidity in research: a systematic review of 566 studies” In The Lancet Public Health 6.8, 2021, pp. e587–e597 DOI: 10.1016/S2468-2667(21)00107-9
- [20] Kathryn Nicholson, José Almirall and Martin Fortin “The measurement of multimorbidity.” Place: US Publisher: American Psychological Association In Health Psychology 38.9, 2019, pp. 783–790 DOI: 10.1037/hea0000739
- [21] Anna Chmiel, Peter Klimek and Stefan Thurner “Spreading of diseases through comorbidity networks across life and gender” In New Journal of Physics 16.11, 2014, pp. 115013 DOI: 10.1088/1367-2630/16/11/115013
- [22] Nils Haug et al. “High-risk multimorbidity patterns on the road to cardiovascular mortality” In BMC Medicine 18.1, 2020, pp. 44 DOI: 10.1186/s12916-020-1508-1
- [23] César A. Hidalgo, Nicholas Blumm, Albert-László Barabási and Nicholas A. Christakis “A Dynamic Network Approach for the Study of Human Phenotypes” In PLoS Computational Biology 5.4, 2009, pp. e1000353 DOI: 10.1371/journal.pcbi.1000353
- [24] Alexia Giannoula et al. “Identifying temporal patterns in patient disease trajectories using dynamic time warping: A population-based study” In Scientific Reports, 2018 DOI: https://doi.org/10.1038/s41598-018-22578-1
- [25] Alexia Giannoula et al. “A system-level analysis of patient disease trajectories based on clinical, phenotypic and molecular similarities”, 2020 DOI: 10.1093/bioinformatics/btaa964
- [26] Alexia Giannoula et al. “Identifying Temporal Patterns in Healthcare Service-Use Trajectories of Long-Term Breast Cancer Survivors” In Proceedings of the 11th Annual Symposium on Global Cancer Research; Closing the Research-to-Implementation Gap, 2023
- [27] Anders Boeck Jensen et al. “Temporal disease trajectories condensed from population-wide registry data covering 6.2 million patients” In NATURE COMMUNICATIONS, 2014
- [28] Eugene Jeong, Kyungmin Ko, Seungbin Oh and Hyun Wook Han “Network-based analysis of diagnosis progression patterns using claims data” In Scientific Reports 7.1, 2017, pp. 15561 DOI: 10.1038/s41598-017-15647-4
- [29] Babak Fotouhi, Naghmeh Momeni, Maria A. Riolo and David L. Buckeridge “Statistical methods for constructing disease comorbidity networks from longitudinal inpatient data” In Applied Network Science 3.1, 2018, pp. 46 DOI: 10.1007/s41109-018-0101-4
- [30] Francisco S Roque et al. “Using Electronic Patient Records to Discover Disease Correlations and Stratify Patient Cohorts” In PLoS Computational Biology 7.8, 2011
- [31] Jessica X Hu et al. “A Large-Cohort, Longitudinal Study Determines Precancer Disease Routes across Different Cancer Types” In Cancer Research, 2019
- [32] Amalie D Haue, JJ Armenteros and P.C. Holm “Temporal patterns of multi-morbidity in 570157 ischemic heart disease patients: a nationwide cohort study”, 2022 DOI: https://doi.org/10.1186/s12933-022-01527-3
- [33] Mette K Beck et al. “Diagnosis trajectories of prior multi-morbidity predict sepsis mortality” In Scientific Reports, 2016 DOI: https://doi.org/10.1038/srep36624
- [34] G Savcisens et al. “Using sequences of life-events to predict human lives”, 2024 DOI: https://doi.org/10.1038/s43588-023-00573-5
- [35] Sandra H Oostrom et al. “Multimorbidity and comorbidity in the Dutch population – data from general practices” In BMC Public Health 12.1, 2012, pp. 715 DOI: 10.1186/1471-2458-12-715
- [36] Annemarie A. Uijen and Eloy H. Lisdonk “Multimorbidity in primary care: Prevalence and trend over the last 20 years” In European Journal of General Practice 14.sup1, 2008, pp. 28–32 DOI: 10.1080/13814780802436093
- [37] Christopher Harrison, Joan Henderson, Graeme Miller and Helena Britt “The prevalence of complex multimorbidity in Australia” In Australian and New Zealand Journal of Public Health 40.3, 2016, pp. 239–244 DOI: 10.1111/1753-6405.12509
- [38] Andrew Kingston, Adelina Comas-Herrera and Carol Jagger “Forecasting the care needs of the older population in England over the next 20 years: estimates from the Population Ageing and Care Simulation (PACSim) modelling study” In The Lancet Public Health 3.9, 2018, pp. e447–e455 DOI: 10.1016/S2468-2667(18)30118-X
- [39] Andrew Kingston et al. “Projections of multi-morbidity in the older population in England to 2035: estimates from the Population Ageing and Care Simulation (PACSim) model” In Age and Ageing 47.3, 2018, pp. 374–380 DOI: 10.1093/ageing/afx201
- [40] Barbara Fletcher, Meg Gulanick and Cindy Lamendola “Risk Factors for Type 2 Diabetes Mellitus:” In The Journal of Cardiovascular Nursing 16.2, 2002, pp. 17–23 DOI: 10.1097/00005082-200201000-00003
- [41] Gabriella Deli et al. “Diabetic Neuropathies: Diagnosis and Management” In Neuroendocrinology 98.4, 2013, pp. 267–280 DOI: 10.1159/000358728
- [42] Statistics Austria “Demographisches Jahrbuch 2019”, 2019
- [43] Bundesministerium für Soziales, Gesundheit, Pflege und Konsumentenschutz (BMSGPK) “COVID-19: Daten Covid19-Fälle je Altergruppe”, 2024 URL: https://www.data.gv.at/katalog/dataset/covid-19-daten-covid19-faelle-je-altergruppe
- [44] Statistics Austria “Causes of death”, 2024 URL: https://www.statistik.at/en/statistics/population-and-society/population/deaths/causes-of-death
- [45] Statistics Austria “Projected population structure for Austria 2020-2080”, 2022 URL: https://www.statistik.at/en/statistics/population-and-society/population/demographische-prognosen/population-projecions-for-austria-and-federal-states
- [46] Inge Kirchberger et al. “Patterns of Multimorbidity in the Aged Population. Results from the KORA-Age Study” In PLoS ONE 7.1, 2012
- [47] Marcel E. Salive “Multimorbidity in Older Adults”, 2013 DOI: 10.1093/epirev/mxs009
- [48] Grace Hawthorne et al. “Multimorbidity prevalence and patterns in chronic kidney disease: findings from an observational multicentre UK cohort study” In International Urology and Nephrology 55.8, 2023, pp. 2047–2057 DOI: 10.1007/s11255-023-03516-1
- [49] Phuong Bich Tran et al. “Costs of multimorbidity: a systematic review and meta-analyses”, 2022 DOI: https://doi.org/10.1186/s12916-022-02427-9
- [50] Stephanie M. Toth-Manikowski et al. “Sex Differences in Cardiovascular Outcomes in CKD: Findings From the CRIC Study” In American Journal of Kidney Diseases 78.2, 2021, pp. 200–209.e1 DOI: 10.1053/j.ajkd.2021.01.020
- [51] Kaitlin J. Mayne, Michael K. Sullivan and Jennifer S. Lees “Sex and gender differences in the management of chronic kidney disease and hypertension” In Journal of Human Hypertension 37.8, 2023, pp. 649–653 DOI: 10.1038/s41371-023-00843-9
- [52] Institute Health Metrics and Evaluation “Global Disease Burden (GBD Compare)” URL: https://vizhub.healthdata.org/gbd-compare/
- [53] Katherine T. Mills et al. “Global Disparities of Hypertension Prevalence and Control: A Systematic Analysis of Population-Based Studies From 90 Countries” In Circulation 134.6, 2016, pp. 441–450 DOI: 10.1161/CIRCULATIONAHA.115.018912
- [54] A Sillars et al. “Sex differences in the association of risk factors for heart failure incidence and mortality”, 2020, pp. 203–12 DOI: 10.1136/heartjnl-2019-314878
- [55] Ophira Ginsburg et al. “Women, power, and cancer: a Lancet Commission” In The Lancet 402.10417, 2023, pp. 2113–2166 DOI: 10.1016/S0140-6736(23)01701-4
- [56] The Global Cardiovascular Risk Consortium et al. “Global Effect of Modifiable Risk Factors on Cardiovascular Disease and Mortality” In New England Journal of Medicine 389.14, 2023, pp. 1273–1285 DOI: 10.1056/NEJMoa2206916
- [57] Pieter Vynckier et al. “Gender gap in risk factor control of coronary patients far from closing: results from the European Society of Cardiology EUROASPIRE V registry” In European Journal of Preventive Cardiology 29.2, 2022, pp. 344–351 DOI: 10.1093/eurjpc/zwaa144
- [58] Alexandra Kautzky-Willer, Michael Leutner and Jürgen Harreiter “Sex differences in type 2 diabetes” In Diabetologia 66.6, 2023, pp. 986–1002 DOI: 10.1007/s00125-023-05891-x
- [59] Giulia Ferrannini et al. “Gender differences in cardiovascular risk, treatment, and outcomes: a post hoc analysis from the REWIND trial” In Scandinavian Cardiovascular Journal 57.1, 2023, pp. 2166101 DOI: 10.1080/14017431.2023.2166101
- [60] Franck Mauvais-Jarvis et al. “Sex- and Gender-Based Pharmacological Response to Drugs” In Pharmacological Reviews 73.2, 2021, pp. 730–762 DOI: 10.1124/pharmrev.120.000206
- [61] AK Singh and Singh “Gender difference in cardiovascular outcomes with SGLT-2 inhibitors and GLP-1 receptor agonist in type 2 diabetes: A systematic review and meta-analysis of cardio-vascular outcome trials”, 2020 DOI: 10.1016/j.dsx.2020.02.012
- [62] Daniel Tobias Michaeli et al. “Established and Emerging Lipid-Lowering Drugs for Primary and Secondary Cardiovascular Prevention” In American Journal of Cardiovascular Drugs 23.5, 2023, pp. 477–495 DOI: 10.1007/s40256-023-00594-5
- [63] Patrick Müller, Melvin Khee-Shing Leow and Johannes W. Dietrich “Minor perturbations of thyroid homeostasis and major cardiovascular endpoints—Physiological mechanisms and clinical evidence” In Frontiers in Cardiovascular Medicine 9, 2022, pp. 942971 DOI: 10.3389/fcvm.2022.942971
- [64] Stavroula A. Paschou et al. “Thyroid disorders and cardiovascular manifestations: an update” In Endocrine 75.3, 2022, pp. 672–683 DOI: 10.1007/s12020-022-02982-4
- [65] P Poredos et al. “Endocrine Disorders and Peripheral Arterial Disease - A Series of Reviews Cushing Syndrome-Cortisol Excess” In Curr Vasc Pharmacol, 2023 DOI: 10.2174/0115701611272145231106053914
- [66] Richard A. Baylis, Nicholas L. Smith, Derek Klarin and Eri Fukaya “Epidemiology and Genetics of Venous Thromboembolism and Chronic Venous Disease” In Circulation Research 128.12, 2021, pp. 1988–2002 DOI: 10.1161/CIRCRESAHA.121.318322
- [67] Sean B. Smith et al. “Analysis of National Trends in Admissions for Pulmonary Embolism” In Chest 150.1, 2016, pp. 35–45 DOI: 10.1016/j.chest.2016.02.638
- [68] Ziyad Al-Aly, Yan Xie and Benjamin Bowe “High-dimensional characterization of post-acute sequelae of COVID-19” In Nature 594.7862, 2021, pp. 259–264 DOI: 10.1038/s41586-021-03553-9
- [69] Sarah E Daugherty et al. “Risk of clinical sequelae after the acute phase of SARS-CoV-2 infection: retrospective cohort study” In BMJ, 2021, pp. n1098 DOI: 10.1136/bmj.n1098
- [70] Evan Xu, Yan Xie and Ziyad Al-Aly “Long-term neurologic outcomes of COVID-19” In Nature Medicine, 2022 DOI: 10.1038/s41591-022-02001-z
- [71] Yan Xie, Evan Xu and Ziyad Al-Aly “Risks of mental health outcomes in people with covid-19: cohort study” In BMJ, 2022, pp. e068993 DOI: 10.1136/bmj-2021-068993
- [72] Karen Barnett et al. “Epidemiology of multimorbidity and implications for health care, research, and medical education: a cross-sectional study” In The Lancet 380.9836, 2012, pp. 37–43 DOI: 10.1016/S0140-6736(12)60240-2
- [73] Søren T. Skou et al. “Multimorbidity” In Nature Reviews Disease Primers 8.1, 2022, pp. 48 DOI: 10.1038/s41572-022-00376-4
- [74] Evan Xu, Yan Xie and Ziyad Al-Aly “Long-term gastrointestinal outcomes of COVID-19” In Nature Communications 14.1, 2023, pp. 983 DOI: 10.1038/s41467-023-36223-7
Supplementary Information
| Disease | Disease Group | Hazard | Source |
|---|---|---|---|
| Ratio | |||
| Anxiety Disorder | Neurotic, stress-related and somatoform disorders (F40-F48) | 1.38 | [70] |
| Depressive Disorder | Mood [affective] disorders (F30-F39) | 1.44 | [70] |
| Ischemic stroke | Cerebrovascular diseases (I60-I69) | 1.5 | [70] |
| Myocarditis | Other forms of heart disease (I30-I52) | 5.38 | [68] |
| Myocardial Infarction | Ischaemic heart diseases (I20-I25) | 1.63 | [68] |
| Angina | Ischaemic heart diseases (I20-I25) | 1.52 | [68] |
| Heart Failure | Other forms of heart disease (I30-I52) | 1.62 | [68] |
| Non-ischemic Cardiomyopthy | Other forms of heart disease (I30-I52) | 2.45 | [68] |
| Cardiac Arrest | Other forms of heart disease (I30-I52) | 2.43 | [68] |
| Pulmonary Embolism | Pulmonary heart disease and | 2.93 | [68] |
| diseases of pulmonary circulation (I26-I28) | |||
| Migraine | Episodic and paroxysmal disorders (G40-G47) | 1.21 | [70] |
| Peripheral Neuropathy | Polyneuropathies and other disorders | 1.34 | [70] |
| of the peripheral nervous system (G60-G64) | |||
| Encephalopathy | Other disorders of the nervous system (G90-G99) | 1.82 | [69] |
| Seizure | Episodic and paroxysmal disorders (G40-G47) | 1.8 | [70] |
| Dementia | Other degenerative diseases of the nervous system (G30-G32) | 4.00 | [69] |
| Organic, including symptomatic, mental disorders (F00-F09) | |||
| Type 2 Diabetes | Diabetes mellitus (E10-E14) | 1.4 | [71] |
| Liver Test Abnormality | Diseases of liver (K70-K77)& Diseases of veins, lymphatic vessels and | 1.70 | [69] |
| lymph nodes, not elsewhere classified (I80-I89)& Viral hepatitis (B15-B19) | [69] | ||
| Kidney Injury | Hypertensive diseases (I10-I15)& Renal failure (N17-N19) | 1.53 | [69] |
| Respiratory Failure | Other diseases of the respiratory system (J95-J99) | 3.67 | [69] |
| Interstitial Lung Disease | Other respiratory diseases principally affecting the interstitium (J80-J84) | 7.00 | [69] |
| Atopic Dermatitis | Dermatitis and eczema (L20-L30) | 1.11 | [69] |
| Urticaria | Urticaria and erythema (L50-L54) | 1.40 | [69] |
| Herpesviral vesicular dermatitis | Viral infections characterized by skin and mucous membrane lesions (B00-B09) | 1.43 | [69] |
| Sleep Apnea | Episodic and paroxysmal disorders (G40-G47) | 1.75 | [69] |
| Transient ischemic attacks | Episodic and paroxysmal disorders (G40-G47) | 1.62 | [70] |
| Hemorrhagic stroke | Cerebrovascular diseases (I60-I69) | 2.19 | [70] |
| Cerebral venous thrombosis | Cerebrovascular diseases (I60-I69) | 2.69 | [70] |
| Alzheimer | Other degenerative diseases of the nervous system (G30-G32) | 2.03 | [70] |
| Dysautonomie | Other disorders of the nervous system (G90-G99) | 1.3 | [70] |
| Bells palsy | Nerve, nerve root and plexus disorders (G50-G59) | 1.48 | [70] |
| Stress and adjustment disorder | Neurotic, stress-related and somatoform disorders (F40-F48) | 1.39 | [70] |
| Psychotic disorder | Schizophrenia, schizotypal and delusional disorders (F20-F29) | 1.51 | [70] |
| Joint pain | Arthropathies (M00-M25) | 1.34 | [70] |
| Myalgia | Soft tissue disorders (M60-M79) | 1.83 | [70] |
| Myopathy | Diseases of myoneural junction and muscle (G70-G73) | 2.76 | [70] |
| Guillan Barre Syndrome | Polyneuropathies and other disorders | 2.16 | [70] |
| of the peripheral nervous system (G60-G64) | |||
| Transverse Myelitis | Demyelinating diseases of the central nervous system (G35-G37) | 1.49 | [70] |
| Cholangitis | Disorders of gallbladder, biliary tract and pancreas (K80-K87) | 2.02 | [74] |
| IBS | Other diseases of intestines (K55-K63) | 1.54 | [74] |
| Acute Gastritis | Diseases of oesophagus, stomach and duodenum (K20-K31) | 1.47 | [74] |
| Functional Dyspepsie | Diseases of oesophagus, stomach and duodenum (K20-K31) | 1.36 | [74] |
| Acute Pancreatitis | Diseases of oesophagus, stomach and duodenum (K20-K31) | 1.46 | [74] |
| GERD | Diseases of oesophagus, stomach and duodenum (K20-K31) | 1.35 | [74] |
| PUD | Diseases of oesophagus, stomach and duodenum (K20-K31) | 1.62 | [74] |