NELA-PS: A Dataset of Pink Slime News Articles for the Study of Local News Ecosystems
Abstract
Pink slime news outlets automatically produce low-quality, often partisan content that is framed as authentic local news. Given that local news is trusted by Americans and is increasingly shutting down due to financial distress, pink slime news outlets have the potential to exploit local information voids. Yet, there are gaps in understanding of pink slime production practices and tactics, particularly over time. Hence, to support future research in this area, we built a dataset of over 7.9M articles from 1093 pink slime sources over 2.5 years. This dataset is publicly-available at https://doi.org/10.7910/DVN/YHWTFC.
Introduction
Local news outlets are vital in American’s information diets and to the broader media ecosystem (Hayes and Lawless 2015, 2018; Miller 2018; Le Quéré, Chiang, and Naaman 2022). Yet, despite this importance, many local news outlets have closed due to financial distress (Rashidian et al. 2019), leaving voids in local information spaces. More concretely, at least 1,800 local news outlets, roughly a quarter of all U.S. newspapers, have shut down since 2004 (Stites 2020). The loss in authentic local news coverage has been argued to have multiple negative impacts on American communities, such as sparse local coverage during the COVID-19 pandemic (Tim Franklin and Jacob 2021; Joseph et al. 2022) and a lack of local watchdogs, which may make local governments less efficient and transparent (Miller 2018).
A concern within this bigger picture is that inadequate information sources, or even malicious information sources, will fill these growing information voids. One particular type of information source that may fill local information voids are pink slime news outlets. Pink slime news outlets produce low-quality, often automated, content that is framed as local news (Bengani 2019). Of the few works that have studied pink slime news, they have shown that these outlets are often members of larger, coordinated networks that are controlled by central entities (Bengani 2019, 2020), and that they “prioritize the publication of state and national partisan content at the expense of local news” (Royal and Napoli 2022). Furthermore, these outlets have been said to lack funding transparency and may “engage in pay-for-play political influence operations” (Bengani 2019; Alba and Nicas 2020; Royal and Napoli 2022). This coordinated promotion of partisan agendas framed as authentic local news is particularly worrisome as Americans tend to trust local news (Nyhan 2019; Gottfried and Liedke 2021).
Despite the potential damage to American’s information diets being done by pink slime outlets, gaps exist in our understanding of these outlets operations and content production, particularly over long periods of time. Hence, to better support the study of pink slime news tactics, we construct a near complete dataset of over 7.9M articles from 1093 pink slime news outlets over 2.5 years. In this paper, we describe the dataset’s collection methods, publicly-available formats, and provide a brief, descriptive comparison of pink slime news and authentic local news.
Broader Perspectives, Ethics, and Competing Interests
We hope that work done with this dataset will create knowledge and tools to better support local news in the United States. While this dataset makes up only one part of this bigger picture, it covers a currently unfilled resource gap in this research agenda. Therefore, we believe that making this dataset available for research use can be a public benefit. NELA-PS only contains freely and publicly available articles. None of this data was scraped from outlets that have paywalls or other pay-to-access services. We also considered removing the author bylines from the dataset, but as shown by Royal and Napoli (2022), the author bylines are critical in understanding the use of automation, syndication, and outsourcing done by these networks. Therefore, for the sake of provenance and research use of the data, we kept the author bylines as they are on the public webpages. Other considerations can be found in the Paper Checklist. The authors declare no competing interests.
Related Work and Data Use Cases
While relatively little work has focused on pink slime news, the phenomenon is not unlike large telecommunications conglomerates taking ownership of many U.S. local news outlets. For example, critics have pointed out that when local news is apart of a national conglomerate, those outlets tend to cover the national news over local news (Martin and McCrain 2019). These outlets may also converge on style and sourcing. For example, Hedding et al. (2019) demonstrated that local television news owned by Sinclair Broadcast Group produced more stories with partisan sources and “dramatic elements”. Similarly, Martin and McCrain (2019) showed that ownership by a conglomerate shifted coverage of local news to be more ideologically right leaning. More broadly, the nationalization of local news is a major concern of media scholars as it has been associated with political polarization (Melusky and Richman 2020; Darr, Hitt, and Dunaway 2021), and it changes both the amount and selection of local news covered (Toff and Mathews 2021).
From what we understand so far, pink slime networks are akin to this phenomenon as they produce the much of the same, often national, content across locations, and they (at least those networks that have been studied so far) tend to produce more ideologically right leaning content and topics. For example, according to analysis done by Royal and Napoli (2022) on the Metric Media pink slime network, 76% of all human written content during the 2.5 months studied (between November 16, 2020 to February 1, 2021) was on U.S. election fraud. After the 2020 general election, stories on absentee ballot rejection rates were published across the network. The key difference between telecommunications conglomerates and pink slime networks is the heavy use of automation and outsourced authors. Again, according to analysis done by Royal and Napoli (2022) on the Metric Media pink slime network, the vast majority of content was automated and the median human author published stories across 9 states. These automated stories were largely not substantial local news (Royal and Napoli 2022). As discussed by Bengani (2019), many of the automated services on these sites “relied on data releases from federal programs” rather than producing novel local information.
Pink Slime networks are different than partisan national news organizations, such as Brietbart or NewsMax, in that they mascaraed as neutral, local organizations and are networked. Although, the political and financial backing of these organizations may be equally opaque (Bengani 2020).
NELA-PS is meant to support the continued research of these pink slime networks, as we still do not understand the long-term strategies of these outlets. For example, while Royal and Napoli (2022) provides a clear case study of 2020 U.S. election fraud coverage by these sources, questions remain about what other events cause an influx of both human written and automated partisan coverage among the generic automated content normally published by these outlets. NELA-PS not only allows for similar in-depth case study analysis but also longitudinal comparisons to other types of media, such as independent local news, conglomerate local news, national mainstream media, or hyper-partisan blogs. We provide a list of other datasets and resources that can be paired with NELA-PS for this type of analysis below.
| Network | # of Outlets | # of Articles | # of Locations (States) | # of IP Addresses |
| Metric Media | 967 | 6,996,161 | 50 | 5 |
| Metro Business Network (Franklin Archer) | 51 | 415,983 | 51 | 1 |
| LGIS | 35 | 415,296 | 3 | 1 |
| Record | 12 | 56,182 | 10 | 1 |
| Franklin Archer | 3 | 19,390 | 3 | 3 |
| American Catholic Tribune Media Network | 6 | 6,395 | 6 | 1 |
| Locality Labs | 3 | 1,295 | 1 | 2 |
| Local News Network (Franklin Archer) | 15 | 247 | 7 | 5 |
| Organisation | 1 | 16 | 1 | 1 |
| Total | 1,093 | 7,910,965 | 54 (unique) | 16 (unique) |


Related Datasets and Resources
There are several related news datasets that can be used in conjunction with NELA-PS to answer various research questions. First, the NELA-Local dataset can serve as comparison to work done using NELA-PS (Horne et al. 2022). NELA-Local is a dataset articles from 313 authentic U.S. local news outlets between April 2020 and December 2021. The dataset contains a range of county-level metadata, which could be aggregated to the state level for use with the NELA-PS dataset. Similarly, the NELA-GT datasets, which are yearly news datasets that cover national and fringe news (Nørregaard, Horne, and Adalı 2019; Gruppi, Horne, and Adalı 2020, 2021), can be used in conjunction with NELA-PS, depending on the research question. The hope is that given that both of these datasets are collected and stored using the same methods as NELA-PS, mixing and matching data across these sets should be easy.
Second, Media Cloud is a platform that has provided news data from a wide range of national and international outlets since 2011 (Roberts et al. 2021). Similar to the NELA datasets, Media Cloud collects news article data and publication metadata, but it does not provide the full text data. The metadata collected by Media Cloud can be a valuable resource to draw comparisons between pink slime and other types of news media.
Another valuable set of resources and data that can be used with NELA-PS are from US News Deserts Database (Abernathy 2016) at UNC and the Local News Initiative111localnewsinitiative.northwestern.edu at Northwestern. These projects have tracked closures of U.S. local news outlets and provide historical local news data by request. Both the data and analysis done in these projects can support research done with the NELA-PS dataset.
Lastly, while the data may not be publicly-available, it is worth noting that the data in NELA-PS should be approximately a continuation of the 2.5 months of data used in work by Royal and Napoli (2022), as a similar collection method is used across overlapping pink slime networks prior to the start of NELA-PS. Specifically, the data used in Royal and Napoli (2022)’s work covers 999 pink slime outlets from November 16th, 2020 to February 1, 2021. The NELA-PS collection start soon after this time frame on March 1st, 2021 and covers 1093 outlets, many of which should overlap with the outlets used by Royal and Napoli (2022). Both datasets contain data from the Metric Media and LGIS networks.
Collection Methods
Pink Slime Outlets
First, we gathered a list of pink slime networks from the invaluable work done by Bengani (2019, 2020). These networks included Metric Media, The Record Network, LGIS, Franklin Archer, Metro Business, Locality Labs, and the American Catholic Tribune Media Network. As described by Bengani (2019, 2020), the lines between these networks are blurry at best. Nonetheless, we gathered URLs for each outlet listed on these networks webpages and documented which network they come from. In addition, we document the location per outlet as determined by Bengani (2020).
News Article Collection
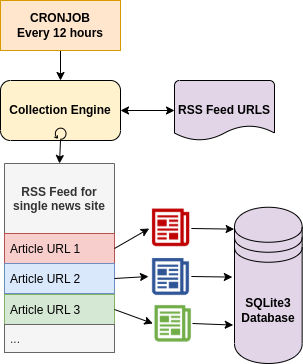
We searched for the RSS feeds in each of the outlets’ websites, which contained all of the articles by each source. The RSS feeds were searched by sending an HTTP request to each outlet domain appended by one of the following common RSS feed addresses: ‘/rss’, ‘/feed’, ‘/rss.xml’, ‘/atom’, ‘/?feed=rss2’, ‘/stories.rss’. If a valid response was obtained and the content could be parsed into XML, the respective address was included in the list of feeds to scrape.
Once all websites were processed, we set up the data collection to run twice a day, going over each of the collected feeds and scraping all articles in it that had not been collected before. This process follows the same approach as other NELA datasets (Nørregaard, Horne, and Adalı 2019; Gruppi, Horne, and Adalı 2020; Horne et al. 2022).
More specifically, as shown in Figure 1, the collection engine takes a list of RSS feeds as input, opens each news article URL in each RSS feed, scrapes the full article text and metadata from each webpage, and stores this data in an SQLite3 database. This process is ran every 12 hours to ensure all published data is captured. This collection of pink slime articles ran every day between March 1, 2021 and January 4, 2024, resulting in 7,910,965 articles from 1093 sources. While our original list of sources contained 1203 outlets, 110 of them did not have active RSS feeds, 6 of which were the top-level organization pages. Furthermore, some of the networks and outlets stopped producing articles during the collection. Given the stability of the live RSS feed collection method and our collection machines, we are confident that this dataset contains nearly every article produced by these sources over the 33 months.
IP Address Sharing Data
Following the findings of Bengani (2019), we collected the IP addresses from all the websites in the list. The IP collection took place on January 9th, 2024. The results of this IP collection align with the prior work by Bengani (2019), showing a massive overlap in the IP addresses used by the websites in NELA-PS. Across the full dataset, there were only 16 unique IP addresses for the 1072 outlets that still existed on January 9th, 2024. We include this data in NELA-PS as an anonymized identifier representing the IP address (i.e. IP_Address_10).
Data Description
To give readers a better sense of the dataset and how it aligns with the prior work by Bengani (2019, 2020), we describe the data in several ways. First, in Table 1, we show the number of outlets and number of articles per pink slime network. Note, these networks may overlap. For example, from Bengani (2019)’s work, there is evidence that all of these networks are connected, although the extent to which each are connected is unclear. The vast majority of these outlets fall under the Metric Media network.
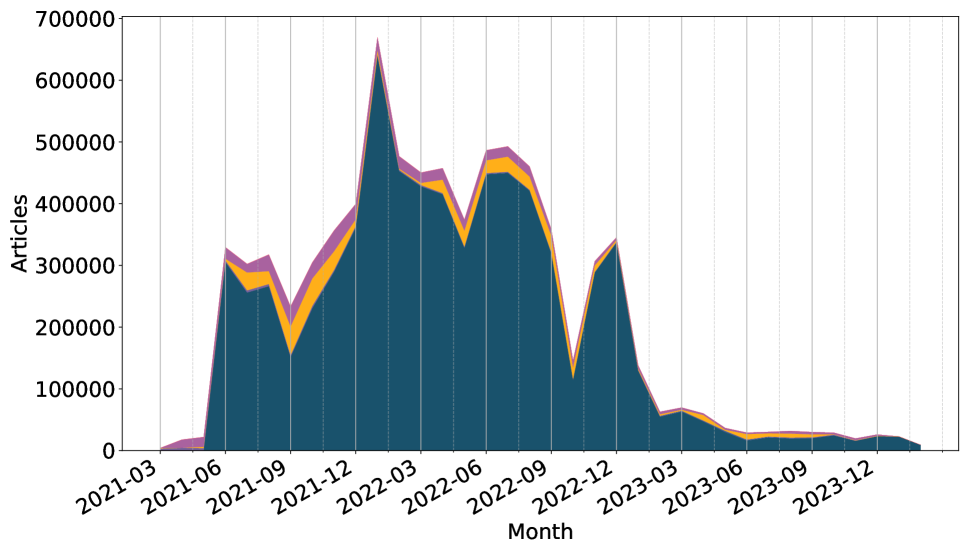
Second, in Figure 2(a), we show the number of articles per month in NELA-PS, broken down by the network those articles fall under. As expected, Metric Media dominates the production throughout the timeline. Notably, this production timeline is inconsistent throughout. This inconsistency is not due to missing data, but rather production changes by these outlets. While prior work has not examined production timelines of this size, it has been suggested that targeted events may drive the production patterns of these networks (Royal and Napoli 2022). Future work can investigate the drivers of these production changes.
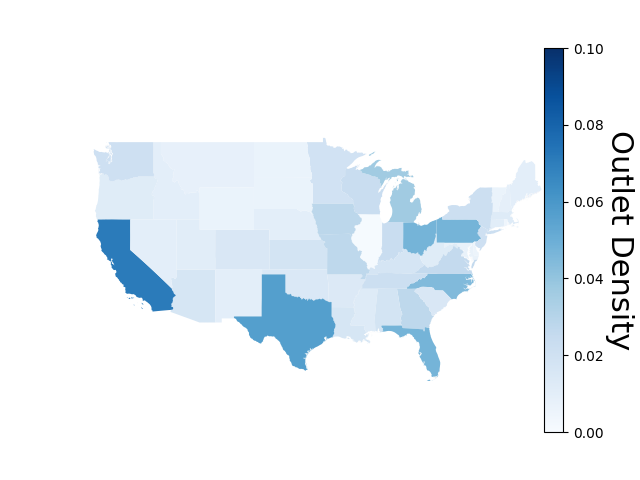
Lastly, in Figures 2(b) and 2(c), we show the density of articles and outlets per state. These maps closely follow the state statistics produced by Bengani (2020) on a smaller dataset. California had the most outlets, with 78 of the total outlets, followed by Texas with 62 and Pennsylvania, Ohio, and Florida with 52 outlets each. The number of articles produced per state is highly correlated with the outlet density per state (0.923 correlation coefficient).


A Brief Comparison Between Pink Slime and Authentic Local News
To further demonstrate that the data collected in NELA-PS is indeed different than authentic local news, we briefly draw comparison to an extended version of the NELA-Local dataset (Horne et al. 2022). NELA-Local is a dataset articles from 313 U.S. local news outlets. The original dataset covered local news between April 2020 and December 2021. We extend and cut this dataset to create an overlapping subset with NELA-PS (May 2021 to December 2023). This extend version of NELA-Local contains 2,193,331 articles. Importantly, the outlets in NELA-Local were vetted to be authentic local news outlets (Horne et al. 2022) and, as expected, zero outlets overlap between the two datasets.
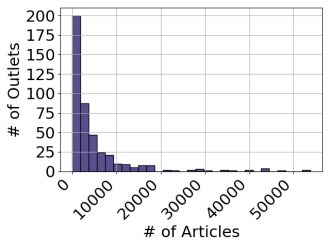
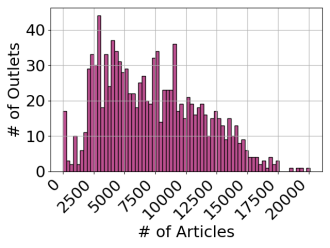
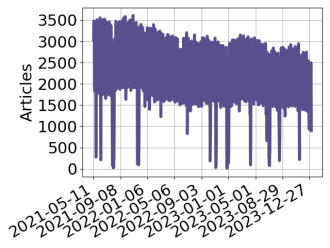
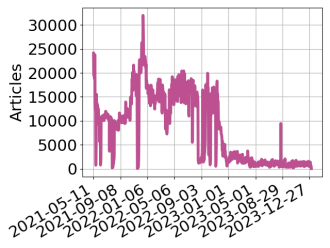
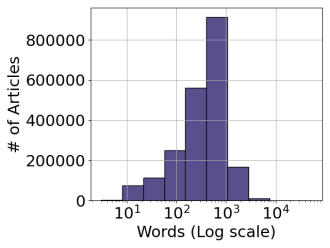
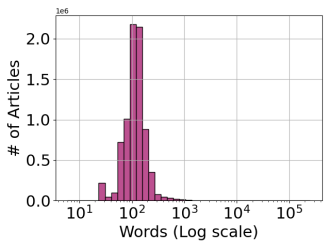
We compared these datasets in a few ways. First, we compared three distributions of production across the datasets: articles per source, articles per day, and words per article (Figure 3). This juxtaposition demonstrates the automated behavior found across NELA-PS. Most notably, shown in Figure 3(a) and (b), the distribution of the number of articles per source for NELA-PS is nearly a uniform distribution, while the distribution for NELA-Local is the skewed distribution that we expect from human behavior (Muchnik et al. 2013). In addition, we see that the number of articles produced per day in NELA-PS is magnitudes greater than the articles produced per day in NELA-Local. These timelines also show the relatively consistent publication pattern of authentic local news versus a spiking publication pattern of pink slime news (aligning with Figure 2(a)). For example, between May 2021 and May 2023, pink slime production ranged widely, from 30,000 to 1000 articles per day. However, for almost all of 2023, production ranged between approximately 1000 articles a day to 5000 articles per day. On the other hand, local news consistently produces between 1500 and 3500 articles per day, with some exceptions. Lastly, on average, the number of words per article is more in NELA-Local than in NELA-PS (517.00 words versus 133.78 words on average, respectively), reflecting the short, automated articles described by (Royal and Napoli 2022).
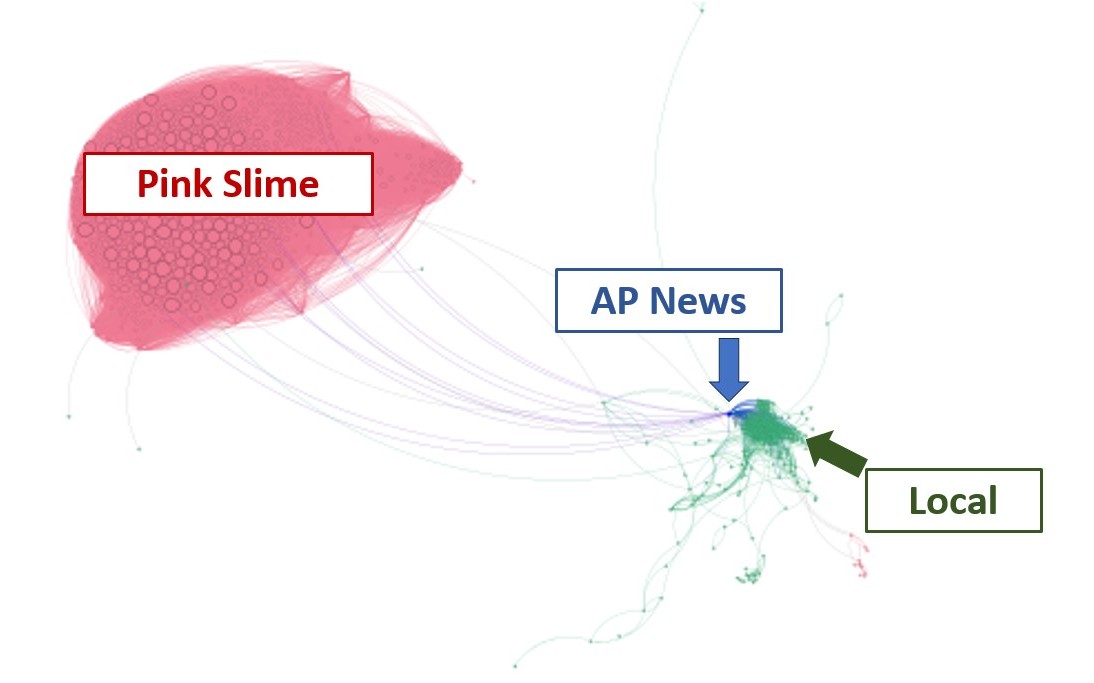
Second, we created Content Sharing Networks (CSN) across three time subsets of NELA-PS and the extended version of NELA-Local. These CSNs were built using the method described in (Horne, Nørregaard, and Adalı 2019). In short, we built a TFIDF matrix for every five days with in the three five-month subsets, created directed edges between articles which had a cosine similarity greater than (ordered by publication times), and aggregated these article-level links into outlets-level links. This process created three directed networks in which edges are weighted, directed edges representing the probability of articles being copied from one outlet to another, and nodes represent news outlets. The visualization of these networks shown in Figure 4. More details on this method can be found in Horne, Nørregaard, and Adalı (2019).
Pink slime outlets shared much of their content with other pink slime outlets, as shown by the large, tightly connected red communities in Figure 4. While authentic local news shared very little of their content with other local news outlets. Bridging the pink slime and local news communities is AP News, a commonly syndicated national news outlet (Horne, Nørregaard, and Adalı 2019). Although small in comparison to the number of copies within the pink slime community, there is both national and local news being imported into the pink slime community. Namely, across the three networks, 12,447 articles from AP News were copied by pink slime outlets and 36,063 articles from authentic local news outlets were copied by pink slime outlets. Perhaps unsurprisingly given the work by (Bengani 2019, 2020), despite NELA-PS covering multiple different pink slime networks, the community structure does not reflect this. This lack of community structure supports the blurry ownership and operation behind these networks. These patterns were consistent across all three time slices of the datasets.
Data Formats and Distribution
To ensure ease of access to many different scientist, we provide three different formats for the data: SQLite3 database, CSV, and JSON.
SQLite3 Database
The database schema follows a simple, single table format with the following columns:
-
•
id - Unique identifier for each article. This identifier is formatted the same as other NELA datasets: the source name, date, and first 100 characters of the title separated by two dashes.
-
•
date - The date of article publication according to the article webpage. This date is formatted as YYYY-MM-DD.
-
•
source - The source of the article, normalized to be all lower case with no spaces.
-
•
network - The network in which the source belongs to (i.e. Metric Media, etc.). This network mapping comes from Bengani (2020).
-
•
ip2024 - An source-level identifier to capture what outlets used the same IP addresses in 2024.
-
•
location - The state in which the outlet is “located” in. This state mapping comes from Bengani (2020).
-
•
title - The title of the article.
-
•
content - The full textual content of the article.
-
•
author - The author byline, if available on the webpage.
-
•
url - The original URL of the article.
-
•
published - Publication date time string as provided by source.
-
•
published_utc - Publication time as unix timestamp.
-
•
collection_utc - Collection time as unix timestamp.
We provide example code for data extraction and use in the following GitHub repository: https://github.com/MELALab/nela-pink-slime.
CSV
We replicate the yearly SQLite3 format as CSV files. The Comma Separated Value (CSV) format follows the same structure as the SQLite3 columns. We also provide sample data file with a random 200 articles as a CSV file.
JSON
In addition to the SQLite3 and CSV formats, the data is also provided in JavaScript Object Notation (JSON) form. In this version, the data is split into several JSON files, each corresponding to a news outlet, containing all articles published by that source.
Distribution and Maintenance
The dataset is publicly-available in the NELA Harvard Dataverse repository under CC BY-NC 4.0 License222https://dataverse.harvard.edu/dataset.xhtml?persistentId=doi:10.7910/DVN/YHWTFC. While the dataset described in this paper will remain static for provenance, the dataset will be supported by the authors. The authors have a track record of maintaining and supporting datasets for the research community (Nørregaard, Horne, and Adalı 2019; Gruppi, Horne, and Adalı 2020; Horne et al. 2022; Trujillo et al. 2022; Horne 2022). Any updates to the dataset will be documented and deposited in a separate repository.
FAIR Principles
NELA-PS follows FAIR principles. First, the data is Findable, as it is persistently stored on Harvard Dataverse and all metadata clearly include the identifier of the data they describe. The SQLite3 format is searchable using SQL or with a SQL browser (we recommend DB Browser for SQLite333https://sqlitebrowser.org/). The data is Accessible and Interoperable as we provide three widely-used, standard formats (SQLite3, CSV, JSON) with example code for data extraction. The data is retrievable through Harvard Dataverse’s GUI. Furthermore, we provide a list of other datasets that can be integrated with NELA-PS to answer a variety of research questions. The data is Re-usable as it is released with accessible data usage license and the data contains both URLs and documentation to maintain provenance.
Data Use Guidance
The data in NELA-PS is meant to be used for responsible research on media ecosystems. There are several important considerations regarding how this data is used. First, this data should not be used to train ”fake news” classifiers or be used with the assumption of ground truth. While there is evidence of malicious intent behind these pink slime networks, this does not mean the news reported by these outlets should be considered “fake” or “false”. Much of the information produced by these outlets is a mix of authentic news syndicated from national and local news outlets, along with automated articles that scrape from various real data sources. While there is certainly a large amount of partisan framing in the data, and there may even be false information in the data, the ground truth behind much of the dataset is likely nuanced. Second, since there is potential for offensive and false content in this dataset, introducing risks when using this dataset to train Large Language Models for conversational agents, hence, we argue that this data should not be used for that purpose.
Conclusion
In this paper, we describe the NELA-PS dataset, a publicly-available dataset of pink slime news articles and metadata. The dataset covers 7.9M articles from 1093 outlets over 33 months between March 2021 and January 2024. It includes metadata about author bylines, outlet’s audience location, and outlet IP addresses. The goal of the dataset is to support research on the long-term production strategies of these pink slime networks and to better understand their place in local information spaces. The dataset can be found at https://doi.org/10.7910/DVN/YHWTFC.
References
- Abernathy (2016) Abernathy, P. M. 2016. The rise of a new media baron and the emerging threat of news deserts. Center for Innovation and Sustainability in Local Media, University of North Carolina Chapel Hill.
- Alba and Nicas (2020) Alba, D.; and Nicas, J. 2020. As local news dies, a pay-for-play network rises in its place. The New York Times.
- Bastian, Heymann, and Jacomy (2009) Bastian, M.; Heymann, S.; and Jacomy, M. 2009. Gephi: an open source software for exploring and manipulating networks. In Proceedings of the international AAAI conference on web and social media, volume 3, 361–362.
- Bengani (2019) Bengani, P. 2019. Hundreds of “pink slime” local news outlets are distributing algorithmic stories and conservative talking points. Columbia Journalism Review.
- Bengani (2020) Bengani, P. 2020. As election looms, a network of mysterious “pink slime” local news outlets nearly triples in size. Columbia Journalism Review.
- Darr, Hitt, and Dunaway (2021) Darr, J. P.; Hitt, M. P.; and Dunaway, J. L. 2021. Home style opinion: How local newspapers can slow polarization. Cambridge University Press.
- Gebru et al. (2021) Gebru, T.; Morgenstern, J.; Vecchione, B.; Vaughan, J. W.; Wallach, H.; Iii, H. D.; and Crawford, K. 2021. Datasheets for datasets. Communications of the ACM, 64(12): 86–92.
- Gottfried and Liedke (2021) Gottfried, J.; and Liedke, J. 2021. Partisan divides in media trust widen, driven by a decline among Republicans.
- Gruppi, Horne, and Adalı (2020) Gruppi, M.; Horne, B. D.; and Adalı, S. 2020. NELA-GT-2019: A Large Multi-Labelled News Dataset for The Study of Misinformation in News Articles. arXiv preprint arXiv:2003.08444.
- Gruppi, Horne, and Adalı (2021) Gruppi, M.; Horne, B. D.; and Adalı, S. 2021. NELA-GT-2020: A Large Multi-Labelled News Dataset for The Study of Misinformation in News Articles. arXiv preprint arXiv:2102.04567.
- Hayes and Lawless (2015) Hayes, D.; and Lawless, J. L. 2015. As local news goes, so goes citizen engagement: Media, knowledge, and participation in US House Elections. The Journal of Politics, 77(2): 447–462.
- Hayes and Lawless (2018) Hayes, D.; and Lawless, J. L. 2018. The decline of local news and its effects: New evidence from longitudinal data. The Journal of Politics, 80(1): 332–336.
- Hedding et al. (2019) Hedding, K. J.; Miller, K. C.; Abdenour, J.; and Blankenship, J. C. 2019. The Sinclair effect: Comparing ownership influences on bias in local TV news content. Journal of Broadcasting & Electronic Media, 63(3): 474–493.
- Horne (2022) Horne, B. D. 2022. A Psycho-linguistic Analysis of BitChute. arXiv preprint arXiv:2204.08078.
- Horne et al. (2022) Horne, B. D.; Gruppi, M.; Joseph, K.; Green, J.; Wihbey, J. P.; and Adalı, S. 2022. NELA-Local: A Dataset of US Local News Articles for the Study of County-Level News Ecosystems. In Proceedings of the International AAAI Conference on Web and Social Media, volume 16, 1275–1284.
- Horne, Nørregaard, and Adalı (2019) Horne, B. D.; Nørregaard, J.; and Adalı, S. 2019. Different spirals of sameness: A study of content sharing in mainstream and alternative media. In Proceedings of the International AAAI Conference on Web and Social Media, volume 13, 257–266.
- Jacomy et al. (2014) Jacomy, M.; Venturini, T.; Heymann, S.; and Bastian, M. 2014. ForceAtlas2, a continuous graph layout algorithm for handy network visualization designed for the Gephi software. PloS one, 9(6): e98679.
- Joseph et al. (2022) Joseph, K.; Horne, B. D.; Green, J.; and Wihbey, J. P. 2022. Local news online and covid in the us: relationships among coverage, cases, deaths, and audience. In Proceedings of the International AAAI Conference on Web and Social Media, volume 16, 441–452.
- Le Quéré, Chiang, and Naaman (2022) Le Quéré, M. A.; Chiang, T.-W.; and Naaman, M. 2022. Understanding Local News Social Coverage and Engagement at Scale during the COVID-19 Pandemic. In Proceedings of the International AAAI Conference on Web and Social Media, volume 16, 560–572.
- Martin and McCrain (2019) Martin, G. J.; and McCrain, J. 2019. Local news and national politics. American Political Science Review, 113(2): 372–384.
- Melusky and Richman (2020) Melusky, B.; and Richman, J. 2020. When the local is national–A new high-water mark for nationalization in the 2018 United States state legislative elections. Regional & Federal Studies, 30(3): 441–460.
- Miller (2018) Miller, J. 2018. News deserts: No news is bad news. Urban policy, 2018: 59–76.
- Muchnik et al. (2013) Muchnik, L.; Pei, S.; Parra, L. C.; Reis, S. D.; Andrade Jr, J. S.; Havlin, S.; and Makse, H. A. 2013. Origins of power-law degree distribution in the heterogeneity of human activity in social networks. Scientific reports, 3(1): 1783.
- Nørregaard, Horne, and Adalı (2019) Nørregaard, J.; Horne, B. D.; and Adalı, S. 2019. Nela-gt-2018: A large multi-labelled news dataset for the study of misinformation in news articles. In Proceedings of the International AAAI Conference on Web and Social Media, volume 13, 630–638.
- Nyhan (2019) Nyhan, B. 2019. Americans trust local news. That belief is being exploited. The New York Times.
- Rashidian et al. (2019) Rashidian, N.; Brown, P. D.; Hansen, E.; Bell, E. J.; and Albright, J. R. 2019. Friend and foe: The platform press at the heart of journalism.
- Roberts et al. (2021) Roberts, H.; Bhargava, R.; Valiukas, L.; Jen, D.; Malik, M. M.; Bishop, C.; Ndulue, E.; Dave, A.; Clark, J.; Etling, B.; et al. 2021. Media Cloud: Massive Open Source Collection of Global News on the Open Web. arXiv preprint arXiv:2104.03702.
- Royal and Napoli (2022) Royal, A.; and Napoli, P. M. 2022. Local Journalism without Journalists Metric Media and the Future of Local News. Journal of Creative Industries and Cultural Studies-JOCIS, (8): 119–147.
- Stites (2020) Stites, T. 2020. A quarter of all U.S. newspapers have died in 15 years, a new UNC news deserts study found.
- Tim Franklin and Jacob (2021) Tim Franklin, P. M. A.; and Jacob, M. 2021. How the local news crisis affects coverage of COVID-19 and the climate … and vice versa.
- Toff and Mathews (2021) Toff, B.; and Mathews, N. 2021. Is social media killing local news? An examination of engagement and ownership patterns in US Community news on Facebook. Digital Journalism, 1–20.
- Trujillo et al. (2022) Trujillo, M. Z.; Gruppi, M.; Buntain, C.; and Horne, B. D. 2022. The MeLa BitChute Dataset. In Proceedings of the International AAAI Conference on Web and Social Media, volume 16, 1342–1351.
Paper Checklist
-
1.
For most authors…
-
(a)
Would answering this research question advance science without violating social contracts, such as violating privacy norms, perpetuating unfair profiling, exacerbating the socio-economic divide, or implying disrespect to societies or cultures? Yes, the collection and sharing of this dataset fills a resource gap in the study of media ecosystems without violating social contracts. NELA-PS only contains freely and publicly available articles. None of this data was scraped from outlets that have paywalls or other pay-to-access services.
-
(b)
Do your main claims in the abstract and introduction accurately reflect the paper’s contributions and scope? Yes, the abstract accurately represents the dataset presented in the paper and makes no claims outside of the scope of this paper.
-
(c)
Do you clarify how the proposed methodological approach is appropriate for the claims made? While we do not make any claims outside of describing the dataset, we do clearly outline the methodology for collecting and describing the data in the sections entitled “Collection Methods” and “Data Description”.
-
(d)
Do you clarify what are possible artifacts in the data used, given population-specific distributions? NA
-
(e)
Did you describe the limitations of your work? NA
-
(f)
Did you discuss any potential negative societal impacts of your work? Yes. We discuss potential negative uses of this data in the section entitled “Data Use Guidance”.
-
(g)
Did you discuss any potential misuse of your work? Yes. We provide guidance for responsible use of the data in the section entitled “Data Use Guidance”.
-
(h)
Did you describe steps taken to prevent or mitigate potential negative outcomes of the research, such as data and model documentation, data anonymization, responsible release, access control, and the reproducibility of findings? Yes. We have provided responsible guidelines for the data’s use and have anonymized the data as much as possible without detrimenting provenance and usefulness. For example, we anonymized the IP address of these outlets.
-
(i)
Have you read the ethics review guidelines and ensured that your paper conforms to them? Yes, we have carefully reviewed the ethics guidelines and ensured our paper and the release of this dataset conforms to them.
-
(a)
-
2.
Additionally, if your study involves hypotheses testing…
-
(a)
Did you clearly state the assumptions underlying all theoretical results? NA
-
(b)
Have you provided justifications for all theoretical results? NA
-
(c)
Did you discuss competing hypotheses or theories that might challenge or complement your theoretical results? NA
-
(d)
Have you considered alternative mechanisms or explanations that might account for the same outcomes observed in your study? NA
-
(e)
Did you address potential biases or limitations in your theoretical framework? NA
-
(f)
Have you related your theoretical results to the existing literature in social science? NA
-
(g)
Did you discuss the implications of your theoretical results for policy, practice, or further research in the social science domain? NA
-
(a)
-
3.
Additionally, if you are including theoretical proofs…
-
(a)
Did you state the full set of assumptions of all theoretical results? NA
-
(b)
Did you include complete proofs of all theoretical results? NA
-
(a)
-
4.
Additionally, if you ran machine learning experiments…
-
(a)
Did you include the code, data, and instructions needed to reproduce the main experimental results (either in the supplemental material or as a URL)? NA
-
(b)
Did you specify all the training details (e.g., data splits, hyperparameters, how they were chosen)? NA
-
(c)
Did you report error bars (e.g., with respect to the random seed after running experiments multiple times)? NA
-
(d)
Did you include the total amount of compute and the type of resources used (e.g., type of GPUs, internal cluster, or cloud provider)? NA
-
(e)
Do you justify how the proposed evaluation is sufficient and appropriate to the claims made? NA
-
(f)
Do you discuss what is “the cost“ of misclassification and fault (in)tolerance? NA
-
(a)
-
5.
Additionally, if you are using existing assets (e.g., code, data, models) or curating/releasing new assets, without compromising anonymity…
- (a)
-
(b)
Did you mention the license of the assets? Yes. We present the licensing of the released data in “Distribution and Maintenance”. There is no license information for any existing assets used.
-
(c)
Did you include any new assets in the supplemental material or as a URL? NA
-
(d)
Did you discuss whether and how consent was obtained from people whose data you’re using/curating? NA
-
(e)
Did you discuss whether the data you are using/curating contains personally identifiable information or offensive content? Yes. We have discussed the potential for offensive content in this data set and provide guidance related to that potential in the section entitled ”Data Use Guidance”.
-
(f)
If you are curating or releasing new datasets, did you discuss how you intend to make your datasets FAIR? Yes. Under the section entitled “FAIR Principles”, we discuss how we made our dataset FAIR.
-
(g)
If you are curating or releasing new datasets, did you create a Datasheet for the Dataset? No. While we did not create a separate datasheet for the dataset, we made sure to cover the questions asked in Gebru et al. (2021). In particular, we cover these questions in the section entitled “Data Formats and Distribution”.
-
6.
Additionally, if you used crowdsourcing or conducted research with human subjects, without compromising anonymity…
-
(a)
Did you include the full text of instructions given to participants and screenshots? NA
-
(b)
Did you describe any potential participant risks, with mentions of Institutional Review Board (IRB) approvals? NA
-
(c)
Did you include the estimated hourly wage paid to participants and the total amount spent on participant compensation? NA
-
(d)
Did you discuss how data is stored, shared, and deidentified? NA
-
(a)