From known to unknown: cosmic rays transition from the Sun, the Galaxy, and the Extra-Galaxy
Abstract
The Sun stands out as the closest and clearest astrophysical accelerator of cosmic rays, while other objects within and beyond the galaxy remain enigmatic. It is probable that the cosmic ray spectrum and mass components from these celestial sources share similarities, offering a novel approach to study their origin. In this study, we analyze of spectra and mass in the energy range from MeV to 10 EeV. We find: (1) the mean- logarithmicarithmic mass distribution with energy exhibits much clearer feature structures than the spectra; (2) a 100 TeV bump is presented in the distribution; (3) for protons, the knee is located at PeV, the boundary between the galaxy and extra-galaxy occurs at PeV, marked by a sharp dip; (4) the all-particle spectrum exhibits hardening at PeV due to the contribution of nearby galaxies, and the extra-galactic dominate EeV. We hope the LHAASO experiment can perform spectral measurements of individual species to validate our results.
I Introduction
The discovery of the cosmic ray (CR) PeVatron represents a significant milestone in understanding the origin of CRs [1], which is among the most pressing frontier scientific issues in modern astrophysics. Previously, it was widely believed that CRs with energies below the all-particle spectrum structure ”knee” (around 1 PeV) originated from celestial bodies within the Milky Way [2]. However, the Cygnus bubble suggests that the Milky Way is also capable of accelerating CRs beyond 10 PeV [3]. The crucial question raised is the location of the maximum acceleration limits of galactic sources. Energy spectra and mass composition are the most direct observables for solving this puzzle.
CRs originate from three spatial scales: the Sun, the galaxy, and the extra-galaxy. The Sun, being the closest celestial body, allows for observations and analysis to understand the physical processes within it. Compared to other celestial bodies, we have amassed the most experimental observation data on the Sun, providing researchers with a clear understanding of the temporal and spatial characteristics of each eruption event, the study of energy spectrum and features of high-energy events, and changes in composition and surrounding environments. The Sun has the capacity to accelerate ions to energies ranging from MeV to a few GeV. The energy spectrum of a solar energetic particle (SEP) is typically fitted as a power-law with an exponential [4], with the spectral ’knee’ occurring at around 1 GeV. Observations suggest that the spectrum of lighter elements begins to roll off at a lower energy per nucleon during the spectral steepening [5]. To date, the Sun is the most thoroughly studied object capable of accelerating CRs.
The galaxy is considered the next level for accelerating CRs beyond the solar system. Satellite experiments conduct fine spectral measurements of different species of CRs, revealing several observed fine structures, including the primary proton and helium hardening at around 200 GV, and a further bump at 10 TV [6, 7, 8, 9]. The 10 TeV spectral steepening, combined with anisotropy at around 100 TeV [10, 11], is considered the signature of a nearby hidden CR accelerator [12, 13]. Galactic CR spectra also exhibit the characteristics of a knee and a lighter cutoff, followed by heavier elements. However, with increasing energy, lower CR fluxes make detection more challenging and lead to a lesser understanding of them. The knee region and below presents some unresolved issues.
It is generally believed that extra-galactic CRs begin to dominate as we move to higher energy levels. However, the question of where extra-galactic CRs begin to dominate is still a matter of debate. Two spectral features, commonly referred to as the second knee at approximately 500 PeV [14], or the ankle at approximately 3 EeV [15, 16], are conventionally understood as points of transition from galactic to extra-galactic. However, explanations are highly dependent on the model [17]. Moreover, determining the mass number of individual CR primaries is very difficult due to large fluctuations; only the mean mass number A or a few groups of elements of the CR flux can be obtained. Therefore, the precise intricacies remain a subject of contention, leaving room for further measurements or the development of novel methods.
Given the extensive research on solar CRs and the detailed observations of the transition from the solar to the galactic systems, this study aims to investigate the transition from the galactic system to the extra-galactic system. By analyzing the energy spectrum and mass composition of particles ranging from MeV up to EeV, we aim to identify similarities between these transitions. Utilizing a wealth of datasets, we utilize a phenomenological function to describe the spectra of each individual element, as detailed in Section 2. Subsequently, in Section 3, we present the results related to the all-particle spectrum and mean logarithmic mass, emphasizing the common trends identified between these two transitions. Finally, Section 4 offers a concise summary of our findings.
II Component Morphology and Method
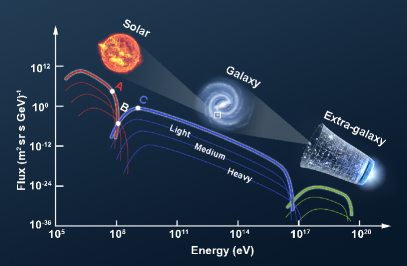
As mentioned earlier, solar CRs have been extensively studied, making them an ideal standard for investigating the relatively less understood GCRs and the transition from the galactic to the extra-galactic. As depicted in Figure 1, the spectra of each nucleus in SEP exhibit a maximum energy cut-off, with lighter nuclei dropping first, followed by intermediate ones, and ultimately iron-dominated nuclei. At higher energies, lighter galactic CRs begin to dominate. In other words, the signature of the transition in composition is the gradual disappearance of solar elements from proton to iron and the increase of a lighter or intermediate galactic component. We designate the energy where protons start to drop as point A, the interaction where solar protons and galactic iron intersect as point B, and the location dominated by galactic protons as point C. That means the mean mass with energy plots should start increasing at A, reaching the peak at point B, and falling back to a trough at point C. It is natural to assume and investigate whether there are similar structures and changes at the transition from within the Milky Way to outside the Milky Way.
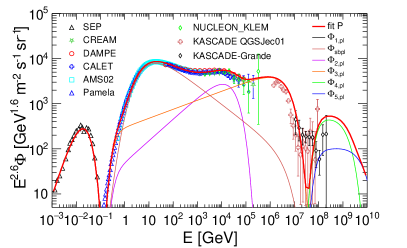
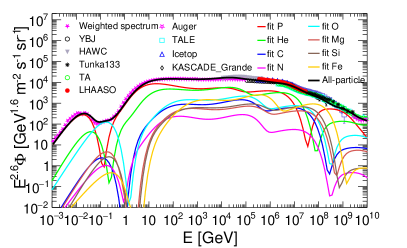
The observations for particles with energies ranging from MeV to 10 EeV are utilized as probes for following analysis. To be specific, two significant SEP events, occurring on 29 October 2003 and 25 August 1998 [18, 19], have been chosen for analysis, providing composition and energy spectra for key elements from hydrogen to iron with high statistical accuracy. For CRs outside the solar system, we utilize data from space satellite experiments such as AMS02, DAMPE, CREAM, etc., to obtain the nucleon spectrum. At higher energies, partial available nuclei (H, He, Fe) spectra, all-particle spectrum, as well as mean logarithmic mass distributions are adopted.
To achieve a consistent description, the energy spectra of individual elements (P, He, C, N, O, Mg, Si, Fe) within the MeV to 10 EeV range are described using a phenomenological function, i.e., multiple power-law segments. A cut-off power-law function is employed to capture the spectral features of solar energetic events, with three segments for galactic CRs and an additional two segments for the extra-galactic components. Each elemental spectrum is individually fitted with this complementary function. Mathematically, the overall fitting function is described by
| (1) |
with
| (2) |
| (3) |
The fitting result for the proton is depicted in the left panel of Figure A1, while the fitting for all key species are shown in different colors on the right. The sum of all fittings represents the all-particle spectrum, which is compared with experimental observations and also presented in Figure A1. The fitted parameters of each species are listed in Table 1. A hyperbolic cosine is adopted for the solar modulation which is approximately 450 MV, and a similar galactic modulation as 0.1 EeV in the data comparison.
The mean logarithmic mass, an often-used quantity to characterize the CR mass composition, below PeV could be calculated with fitting function as well as direct observational spectra data of each element, using
| (4) |
The trends could be compared with observations from ground-based facilities.
| Solar | Galactic | Extra-galactic | ||||||||||||
|---|---|---|---|---|---|---|---|---|---|---|---|---|---|---|
| P | 0.87 | -3.01 | 1.19 | 3.05 | 50 | 2.12 | 300 | 2.4 | 12 | 2.4 | 15 | 2.5 | ||
| He | 0.6 | -3.32 | 1.27 | 2.93 | 60 | 2.16 | 43 | 2.26 | 0.3 | 2.3 | 0.04 | 2.26 | ||
| C | 1000 | 0.7 | 47.4 | -4.07 | 1.90 | 3.26 | 8.10 | 2.16 | 5 | 2.26 | 0.01 | 2.3 | 0.002 | 2.26 |
| N | 90 | 1 | 12.14 | -3.89 | 1.9 | 3.44 | 2.27 | 2.16 | 0.1 | 2.26 | 0.001 | 2.3 | 2.26 | |
| O | 2000 | 0.7 | 9.84 | -4.03 | 1.91 | 3.24 | 13.70 | 2.16 | 3 | 2.26 | 0.05 | -2.3 | 0.003 | 2.26 |
| Mg | 500 | 0.7 | 0.26 | -4.08 | 1.91 | 3.25 | 4.53 | 2.16 | 2 | 2.26 | 0.1 | 2.3 | 2.26 | |
| Si | 400 | 0.6 | 0.06 | -4.15 | 1.91 | 3.18 | 5 | 2.16 | 3 | 2.26 | 0.001 | 2.3 | 2.26 | |
| Fe | 300 | 0.7 | -4.29 | 1.9 | 3.05 | 4.09 | 2.1 | 0.05 | 2 | 0.01 | 2.4 | 2.3 | ||
-
•
GeV and GeV for galactic and extra-galactic CRs, Z is the charge of each species.
To gain deeper insights into the intricacies of the energy spectrum and , changes are tracked and calculated alongside the energy using the equation:
| (5) |
This equation effectively captures the variations depicted in Figure 1, where points A, B, and C are annotated on the energy spectra, corresponding to changes in the mass component. It is important to note that in this context, the change in the energy spectrum is the value after being subjected to a double logarithm, while for , it is the value obtained from the logarithm and linear.
III Results
Figure 2 presents the spectra and , and their change vary with energies from MeV to 10 EeV. The first and second pad display the flux of all particles and protons, respectively. It can be seen that function described flux comparison with the observed spectrum from experiments, demonstrating fitting function well align with the experiment data. In both spectral plots, distinct colored shaded areas are utilized to delineate the entire energy spectrum structure. As previously mentioned, the CRs within the solar system are accurately represented by a truncated power-law spectrum, illustrated by the blue shaded area in the plot. The pink shaded area signifies the background spectrum of CRs within the galaxy, while the purple shaded area represents the contribution from nearby sources. Additionally, the green shaded area corresponds to the contribution from extra-galactic flux.
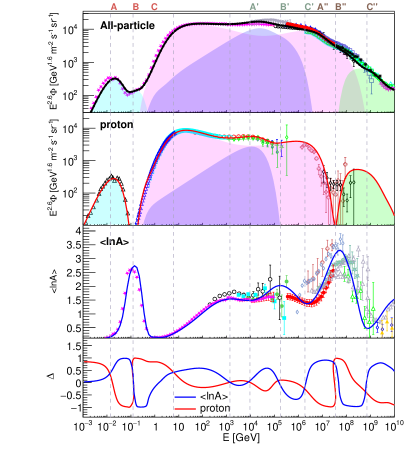
The third panel presents the mean logarithmic mass with energy, calculated using Eq. 4, and includes observations from ground-based detectors, including the latest data release from LHAASO [25]. It can be seen two significant peaks arise at around 0.1 GeV and 30 PeV, which indicate where the proton ratio is highest in the solar system and within the Milky Way, and one shallow peak presenting at near 200 TeV, which suggest the location of nearby source contributions. The features in distribution provides more evidence than that in the spectral plot.
To illustrate the variability of spectra and with energy, the changes in the spectra and distributions are presented at the bottom of Figure 2. The intersections of the distributions of proton spectra and are labeled and drawn with vertical lines across the entire canvas. A joint analysis of the intersections, spectral distribution, and the could provide a better understanding.
It is evident that three cross-points effectively describe a transition from the solar system to the galactic system, labeled as A-B-C. The proton ratio is highest at point A within the solar system. This is evident from the energy spectrum and distribution, where point A represents the peak flux in the energy spectrum and is located at the base of the mountain in the distribution. Point B, on the other hand, represents the opposite of point A, where the solar proton proportion decreases to the least and reaches the peak. From A to B, the flux of SEP is successively truncated from hydrogen to iron. As from B to C, the CR flux from the galaxy begins to increase, resulting in a transition of from being dominated by heavy nuclei to being dominated by light nuclei, where point C has the local maximum proton ratio. This transition occurred from the solar system to the galactic system, where the mass components and spectra are clearly known.
It is worth noting that two other similar transitions occur at A’-B’-C’ and A”-B”-C” regions. The A’-B’-C’ region indicates a relatively gradual process of transitioning from light to heavy and then back to light, suggesting that nearby source(s) in the Galaxy start to contribute at around several tens of TeV, the nearby iron reaches its peak at around 200 TeV, and the galactic proton flux cuts off at about 2 PeV. The A”-B”-C” region likely marks the transition from the galactic to the extra-galactic at around 30 PeV, also implying that the dominant flux contributions are from nearby galaxies at energies around 0.7 EV and above.
IV Summary
This study introduces a novel method for investigating the transition from the galaxy to the extra-galaxy, as well as the presence of local sources. We conducted a combined analysis of CR energy spectrum and mass composition with energies ranging from MeV to 10 EeV, defined a new variable to characterize the evolving structure, and identified three key points where intersections of the energy spectrum and could indicate a system transition. Since the transition of solar CR to galactic is evident, it serves as the standard for understanding nearby sources and the transition to the extra-galactic. Through this work, we found that the distribution of mass composition, , exhibits clearer trends compared to the energy spectrum. Each transition presents a peak in the , thus we expect a peak in the value near 200 TeV, likely resulting from contributions of nearby sources. Furthermore, the intersections A” (with a minimum ) represent the galactic proton knee location at 2 PeV, while the intersections B” (with a peak value) indicate the iron reaching its peak, where the transition occurs from galactic to extra-galactic at 30 PeV, with extra-galactic particles taking precedence over galactic ones at energies surpassing 0.7 EeV. We eagerly anticipate the latest observations on the 100 TeV-100 PeV energy spectra of individual species from LHAASO to validate our findings.
Acknowledgements.
This work is supported by the National Natural Science Foundation of China (Nos. 12275279, U2031110), the China Postdoctoral Science Foundation (No. 2023M730423).Appendix A Fitting results
The fitting results of proton spectrum and all-particle spectra are depicted in Figures A1.
References
- [1] Zhen Cao, F. A. Aharonian, Q. An, et al. Ultrahigh-energy photons up to 1.4 petaelectronvolts from 12 -ray Galactic sources. Nature, 594(7861):33–36, June 2021.
- [2] GV Kulikov and GB Khristiansen. On the size spectrum of extensive air showers. Sov. Phys. JETP, 35(8):441–444, 1959.
- [3] LHAASO Collaboration. An Ultrahigh-energy -ray Bubble Powered by a Super PeVatron. arXiv e-prints, page arXiv:2310.10100, October 2023.
- [4] T. von Rosenvinge and H. V. Cane. Solar Energetic Particles: An Overview. Geophysical Monograph Series, 165:103–114, October 2006.
- [5] Donald V Reames. Particle acceleration at the sun and in the heliosphere. Space Science Reviews, 90(3-4):413–491, 1999.
- [6] Y. S. Yoon, T. Anderson, A. Barrau, et al. Proton and Helium Spectra from the CREAM-III Flight. ApJ, 839(1):5, April 2017.
- [7] E. Atkin, V. Bulatov, V. Dorokhov, et al. New Universal Cosmic-Ray Knee near a Magnetic Rigidity of 10 TV with the NUCLEON Space Observatory. Soviet Journal of Experimental and Theoretical Physics Letters, 108(1):5–12, July 2018.
- [8] Q. An, R. Asfandiyarov, P. Azzarello, et al. Measurement of the cosmic ray proton spectrum from 40 GeV to 100 TeV with the DAMPE satellite. Science Advances, 5(9):eaax3793, September 2019.
- [9] F. Alemanno, Q. An, P. Azzarello, et al. Measurement of the Cosmic Ray Helium Energy Spectrum from 70 GeV to 80 TeV with the DAMPE Space Mission. Phys. Rev. Lett., 126(20):201102, May 2021.
- [10] M. Amenomori, S. Ayabe, S. W. Cui, et al. Large-Scale Sidereal Anisotropy of Galactic Cosmic-Ray Intensity Observed by the Tibet Air Shower Array. ApJ, 626(1):L29–L32, June 2005.
- [11] M. Aglietta, V. V. Alekseenko, B. Alessandro, et al. Evolution of the Cosmic-Ray Anisotropy Above 1014 eV. ApJ, 692(2):L130–L133, February 2009.
- [12] Wei Liu, Yi-Qing Guo, and Qiang Yuan. Indication of nearby source signatures of cosmic rays from energy spectra and anisotropies. J. Cosmology Astropart. Phys, 2019(10):010, October 2019.
- [13] Ottavio Fornieri, Daniele Gaggero, Daniel Guberman, et al. Diffusive origin for the cosmic-ray spectral hardening reveals signatures of a nearby source in the leptons and protons data. Phys. Rev. D, 104(10):103013, November 2021.
- [14] V. Berezinsky, A. Z. Gazizov, and S. I. Grigorieva. Dip in UHECR spectrum as signature of proton interaction with CMB [rapid communication]. Physics Letters B, 612(3-4):147–153, April 2005.
- [15] D. Allard, E. Parizot, A. V. Olinto, E. Khan, and S. Goriely. UHE nuclei propagation and the interpretation of the ankle in the cosmic-ray spectrum. A&A, 443(3):L29–L32, December 2005.
- [16] Noemie Globus, Denis Allard, and Etienne Parizot. A complete model of the cosmic ray spectrum and composition across the Galactic to extragalactic transition. Phys. Rev. D, 92(2):021302, July 2015.
- [17] M. Kachelrieß and D. V. Semikoz. Cosmic ray models. Progress in Particle and Nuclear Physics, 109:103710, November 2019.
- [18] R. Mewaldt, C. Cohen, G. Mason, et al. Solar Energetic Particle Spectral Breaks. In AGU Spring Meeting Abstracts, volume 2008, pages SH41A–10, May 2008.
- [19] R. A. Mewaldt. Solar Energetic Particle Composition, Energy Spectra, and Space Weather. In D. N. Baker, B. Klecker, S. J. Schwartz, R. Schwenn, and R. von Steiger, editors, Solar Dynamics and Its Effects on the Heliosphere and Earth. Series: Space Sciences Series of ISSI, volume 22, pages 303–316. 2007.
- [20] A. D. Panov, J. H. Adams, H. S. Ahn, et al. Energy spectra of abundant nuclei of primary cosmic rays from the data of ATIC-2 experiment: Final results. Bulletin of the Russian Academy of Sciences, Physics, 73(5):564–567, June 2009.
- [21] Pedro Abreu et al. Depth of Maximum of Air-Shower Profiles above eV Measured with the Fluorescence Detector of the Pierre Auger Observatory and Mass Composition Implications. PoS, ICRC2023:319, 2023.
- [22] T. Abu-Zayyad, K. Belov, D. J. Bird, et al. A measurement of the average longitudinal development profile of cosmic ray air showers between 10 17 and 10 18 eV. Astroparticle Physics, 16(1):1–11, October 2001.
- [23] T. Antoni, W. D. Apel, A. F. Badea, et al. KASCADE measurements of energy spectra for elemental groups of cosmic rays: Results and open problems. Astroparticle Physics, 24(1-2):1–25, September 2005.
- [24] S. F. Berezhnev, D. Besson, N. M. Budnev, et al. The Tunka-133 EAS Cherenkov light array: Status of 2011. Nuclear Instruments and Methods in Physics Research A, 692:98–105, November 2012.
- [25] Zhen Cao et al. Measurements of All-Particle Energy Spectrum and Mean Logarithmic Mass of Cosmic Rays from 0.3 to 30 PeV with LHAASO-KM2A. 3 2024.
- [26] M. G. Aartsen, M. Ackermann, J. Adams, et al. Cosmic ray spectrum and composition from PeV to EeV using 3 years of data from IceTop and IceCube. Phys. Rev. D, 100(8):082002, October 2019.
- [27] B. Bartoli, P. Bernardini, X. J. Bi, et al. Cosmic ray proton plus helium energy spectrum measured by the ARGO-YBJ experiment in the energy range 3-300 TeV. Phys. Rev. D, 91(11):112017, June 2015.
- [28] R. Alfaro, C. Alvarez, J. D. Álvarez, et al. All-particle cosmic ray energy spectrum measured by the HAWC experiment from 10 to 500 TeV. Phys. Rev. D, 96(12):122001, December 2017.
- [29] M. G. Aartsen, R. Abbasi, M. Ackermann, et al. Cosmic ray spectrum from 250 TeV to 10 PeV using IceTop. Phys. Rev. D, 102(12):122001, December 2020.
- [30] M. Aguilar, L. Ali Cavasonza, G. Ambrosi, et al. The Alpha Magnetic Spectrometer (AMS) on the international space station: Part II - Results from the first seven years. Phys. Rep., 894:1–116, February 2021.
- [31] V. Grebenyuk, D. Karmanov, I. Kovalev, et al. Energy spectra of abundant cosmic-ray nuclei in the NUCLEON experiment. Advances in Space Research, 64(12):2546–2558, December 2019.
- [32] O. Adriani, G. C. Barbarino, G. A. Bazilevskaya, et al. Time Dependence of the Proton Flux Measured by PAMELA during the 2006 July-2009 December Solar Minimum. ApJ, 765(2):91, March 2013.
- [33] W. D. Apel, J. C. Arteaga-Velázquez, K. Bekk, et al. KASCADE-Grande measurements of energy spectra for elemental groups of cosmic rays. Astroparticle Physics, 47:54–66, July 2013.
- [34] O. Adriani, Y. Akaike, K. Asano, et al. Observation of Spectral Structures in the Flux of Cosmic-Ray Protons from 50 GeV to 60 TeV with the Calorimetric Electron Telescope on the International Space Station. Phys. Rev. Lett., 129(10):101102, September 2022.
- [35] A. Aab, P. Abreu, M. Aglietta, et al. Measurement of the cosmic-ray energy spectrum above 2.5 ×10¹⁸ eV using the Pierre Auger Observatory. Phys. Rev. D, 102(6):062005, September 2020.
- [36] N. M. Budnev, A. Chiavassa, O. A. Gress, et al. The primary cosmic-ray energy spectrum measured with the Tunka-133 array. Astroparticle Physics, 117:102406, January 2020.
- [37] M. Aguilar, L. Ali Cavasonza, M. S. Allen, et al. Properties of Iron Primary Cosmic Rays: Results from the Alpha Magnetic Spectrometer. Phys. Rev. Lett., 126(4):041104, January 2021.
- [38] Y. S. Yoon, H. S. Ahn, P. S. Allison, et al. Cosmic-ray Proton and Helium Spectra from the First CREAM Flight. ApJ, 728:122, February 2011.
- [39] M. Amenomori, X. J. Bi, D. Chen, et al. The All-Particle Spectrum of Primary Cosmic Rays in the Wide Energy Range from 1014 to 1017 eV Observed with the Tibet-III Air-Shower Array. ApJ, 678(2):1165–1179, May 2008.
- [40] R. U. Abbasi, M. Abe, T. Abu-Zayyad, et al. The Cosmic Ray Energy Spectrum between 2 PeV and 2 EeV Observed with the TALE Detector in Monocular Mode. ApJ, 865(1):74, September 2018.