MOSEL survey: Spatially offset Lyman-continuum emission in a new emitter at z=3.088
Abstract
We present the discovery of a unique Lyman-continuum (LyC) emitter at . The LyC emission were detected using the Hubble Space Telescope (HST) WFC3/UVIS F336W filter, covering a rest-frame wavelength range of . The peak signal-to-noise ratio (SNR) of LyC emission is 3.9 in a aperture and is spatially offset by ( kpc) from the rest-UV emission peak (F606W). By combining imaging and spectroscopic data from the James Webb Space Telescope (JWST) JADES, FRESCO and JEMS surveys, along with VLT/MUSE data from the MXDF survey, we estimate that the probability of random alignment with an interloper galaxy causing the LyC emission is less than . The interstellar medium (ISM) conditions in the galaxy are similar to other LyC emitters at high redshift (, , ), although the single-peaked Lyman- profile and lack of rest-UV emission lines suggest an optically thick ISM. We think that LyC photons are leaking through a narrow cone of optically thin neutral ISM, most likely created by a past merger (as evidenced by medium-band F210M and F182M images). Using the escape fraction constraints from individual leakers and a simple model, we estimate that the opening half-angle of ionization cones can be as low as (2% ionised fraction) to reproduce some of the theoretical constraints on the average escape fraction for galaxies. The narrow opening angle required can explain the low number density of confirmed LyC leakers.
1 Introduction
Understanding the escape of ionizing photons from the first galaxies remains one of the biggest challenges for the models of galaxy formation and evolution. The past year of operations by the James Webb Space Telescope (JWST) has significantly transformed our understanding of early-universe galaxies. Nevertheless, the high opacity of the intergalactic medium prevents us from detecting the ionizing photons escaping from the first galaxies. Therefore, we need to rely on analogs of first galaxies to understand the mode of Lyman continuum (LyC) escape.
In the past decade, photometric observations revealed elevated emission line equivalent widths (EW) for galaxies (Labbé et al., 2013; Roberts-Borsani et al., 2016; Barro et al., 2019; Mainali et al., 2019; Endsley et al., 2020). Recent observations with JWST have confirmed this, demonstrating that 80-90% of galaxies within the first billion years of the universe have [Oiii] 5007+H EW , almost three times the EW of a typical star-forming galaxy at (Endsley et al., 2023; Cameron et al., 2023; Tang et al., 2023; Rinaldi et al., 2023; Boyett et al., 2024). Consequently, many observational programs focus on studying the detailed properties of extreme emission line galaxies (EELGs), where emission lines from gas contribute almost 40-50% to the total flux in certain photometric bands, both at low (Yang et al., 2017b; Yuma et al., 2019; Izotov et al., 2018; Lumbreras-Calle et al., 2022) and high redshifts (Atek et al., 2011; Maseda et al., 2014; Gupta et al., 2022). EELGs typically exhibit high specific star formation rates and high ionization parameters (Tang et al., 2019; Gupta et al., 2022) that could be linked with a high LyC escape fraction (Izotov et al., 2018).
Observations of dwarf star-forming galaxies (SFGs) in the nearby universe with HST Cosmic Origin Spectrograph have built a sizable population of local LyC leakers (Izotov et al., 2016b, a, 2018; Flury et al., 2022a). The escape fraction shows a weak positive correlation with [Oiii] 5007/[Oii] 3727 ratio and an inverse correlation with the velocity separation between the blue and red peaks of the Lyman- emission (Izotov et al., 2018; Flury et al., 2022b). These observations suggest that a harder ionizing field and/or a low neutral gas covering fraction are crucial to facilitate the leakage of LyC photons.
At , the stacking experiments with SFGs yield an escape fraction between (Steidel et al., 2018; Wang et al., 2023). The individual detection of LyC leakers at high redshifts is complicated by the higher chance of contamination from interloper galaxies (Vanzella et al., 2010, 2012) and attenuation by the partially neutral intergalactic medium (IGM) (Inoue et al., 2014; Bassett et al., 2021). Deep imaging campaigns with HST and u-band imaging on ground-based telescopes have created significant samples of candidate LyC leakers at cosmic noon (e.g., Meštrić et al., 2020; Kerutt et al., 2023). Recently, Wang et al. (2023) used deep UVIS imaging from the UVCANDELS survey to report a tentative discovery of five LyC leakers between redshift , some of them showing . However, follow-up spectroscopy is required to rule out any possible foreground contaminant.
The A2218-Flanking and the Sunburst arc are two gravitationally lensed LyC leakers at . In A2218-Flanking, LyC radiation is leaking from a compact dwarf galaxy (Bian et al., 2017), whereas in the Sunburst Arc, LyC radiation is leaking from a compact star-forming region that could be a young massive star cluster (Rivera-Thorsen et al., 2019). Ion1 (Vanzella et al., 2012; Ji et al., 2020), Ion2 (de Barros et al., 2016; Vanzella et al., 2016, 2020), Ion3 (Vanzella et al., 2018, 2020), and Q1549-C25 (Shapley et al., 2016) are a few examples of non-lensed LyC leakers, each showing a wide array of interstellar medium conditions and escape fractions. For some of these galaxies, escape fractions can be higher than 50% (Vanzella et al., 2016; de Barros et al., 2016; Saxena et al., 2022; Marques-Chaves et al., 2022; Rivera-Thorsen et al., 2022). Recently, Kerutt et al. (2023) discovered five new LyC leakers using the MUSE-Wide survey (Urrutia et al., 2019) by searching for LyC emission within a small aperture () spatially coincident with peak rest-UV emission in Lyman- emitters.
The Lyman- emission profile for high redshift LyC leakers exhibits a range, contrary to the classic double-peaked Lyman- emission observed in most LyC leakers at . A few LyC emitters show 3-4 peaks in Lyman- emission indicative of multiple kinematic components in the neutral interstellar medium (ISM) (Vanzella et al., 2020). Lyman- emission is only single-peaked in Q1549-C25 (Shapley et al., 2016) and appears in absorption in Ion1 (), indicative of a highly optically thick ISM (Ji et al., 2020). For Ion1, the LyC emission is spatially offset by from the peak UV emission suggesting that the ionizing photons might be leaking from a small part of the galaxy. Kerutt et al. (2023) find a huge scatter between the properties of Lyman- emission and escape fraction for high redshift LyC emitters.
This paper reports the discovery of a new LyC leaker at in the Chandra Deep Field South (CDFS, Giacconi et al., 2002) and analyzes its ISM conditions using the wealth of ancillary data from the JWST and MUSE spectrograph (Bunker et al., 2023; Bacon et al., 2023). The paper is organized as follows. Section 2 describes the photometric and spectroscopic data analysed here. In section 3.1 and 3.2, we discuss the spectral energy distribution fitting, the LyC detection and escape fraction measurements. In sections 3.4 and 3.5, we report properties of ISM derived from JWST/NIRSpec and MUSE spectrum respectively. We discuss our results in Section 4 and present a simple model to derive the opening angle of the ionization cone. The paper uses a flat CDM cosmology with km s-1 Mpc-1, , and .
2 Data
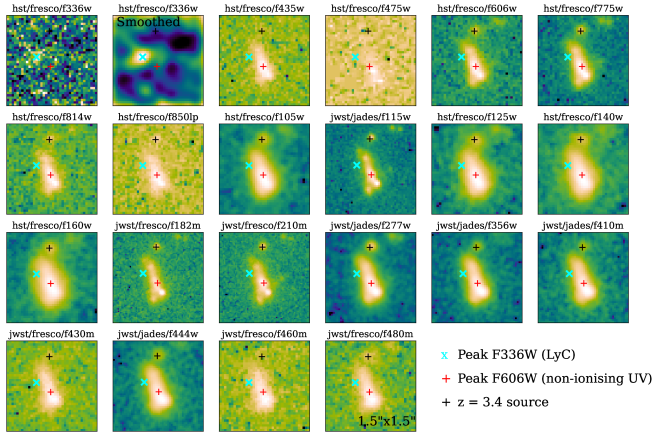
The galaxy z19863 (RA=53.1699, DEC=-27.7684) was identified as an EELG by Forrest et al. (2018) using photometric data from the FourStar Galaxy Evolution survey (ZFOURGE; Straatman et al., 2016). It is part of the Multi-Object Spectroscopy of Emission Line (MOSEL; Tran et al., 2020; Gupta et al., 2022) survey of galaxies, with aims to analyse the properties of EELGs at . The galaxy lies in the Hubble Ultra Deep Field (HUDF), providing us access to a multitude of ancillary data from both HST and JWST (Figure 1).
We combine NIRCam imaging from the JWST Advanced Deep Extragalactic Survey (JADES, Bunker et al., 2023; Hainline et al., 2023; Rieke & the JADES Collaboration, 2023; Eisenstein et al., 2023), the FRESCO survey (Oesch et al., 2023), and the JWST Extragalactic Medium-band Survey (JEMS, Williams et al., 2023), giving us extensive broad and medium band coverage. Additionally, the FRESCO survey has released astrometrically aligned mosaics based on the archival photometry on the Hubble Legacy Fields including the UVIS/F336W imaging (Illingworth et al., 2016; Whitaker et al., 2019).
The galaxy has a spectroscopic redshift of determined from the deep NIRSpec spectrum from the JADES (Bunker et al., 2023). We also use the data from the MUSE eXtremely Deep Field (MXDF, Bacon et al., 2023) to rule out interloper galaxies and analyse the Lyman- emission profile. At , the UVIS/F336W filter covers rest-frame wavelengths between , and therefore should have no contamination from non-ionising photons.
3 Analysis
3.1 Spectral energy distribution
We convolve the images down to a common PSF of the NIRCam/F444W filter and use a threshold to create a segmentation map based on the F444W image. The fluxes are extracted within an aperture defined by KRON parameters of 2.0. A slightly lower KRON parameter is used here to minimize the contamination from a nearby background source at . We estimate errors by taking the root mean square of flux at random locations within the same aperture for each image.
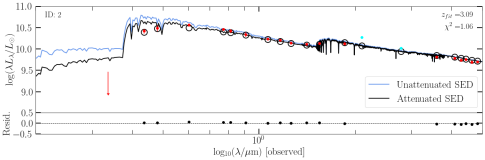
We use the MAGPHYS (da Cunha et al., 2008, 2015) spectral energy distribution (SED) fitting code with the BC03 stellar population synthesis model (Bruzual & Charlot, 2003), delayed exponentially declining star formation history model, and Charlot & Fall (2000) dust attenuation law to derive physical properties. We only use filters that are not contaminated by bright nebular emission lines such as [Oiii] 5007 and H (all except F210M and F277W, Figure 2). We also do not include an IGM absorption model.
3.2 LyC Detection
We use the HST UVIS/F336W mosaics released by the FRESCO survey (Oesch et al., 2023), created using the Hubble Legacy Fields photometry (Teplitz et al., 2013; Rafelski et al., 2015; Illingworth et al., 2016; Whitaker et al., 2019), to visually search for LyC emission around MOSEL targets. The mosaic relies on the archival HST imaging and hence has non-uniform coverage and depth across the FRESCO field of view (FOV). Out of 76 EELGs identified by Forrest et al. (2018) in the CDFS, 54 fall within the FRESCO FOV. We only found significant emission around one EELGs that happen to fall in the deepest region in the F336W image. Figure 1 shows the multi-band imaging for z19863, along with the unconvolved and PSF convolved F336W imaging, clearly indicating the possible LyC emission towards the NE side of the galaxy.
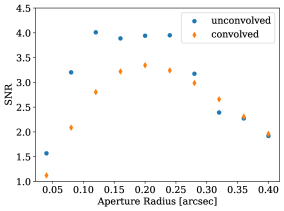
We estimate the signal-to-noise ratio (SNR) of LyC emission by placing an aperture of variable size at the pixel corresponding the peak emission in both the unconvolved and PSF-convolved F336W images (Figure 3). In the unconvolved image, we reach a maximum SNR of within an aperture of , corresponding to . The SNR drops marginally to 3.95 at corresponding to the , a slightly larger aperture size than the FWHM () of the F336W filter. The SNR drops to 2.4 at and results in a marginal drop in flux (). In the PSF-convolved image, the SNR reaches a maximum of 3.3 within an aperture of . The PSF-convolved image does indicated some weak evidence of extended LyC emission. Using an elliptical aperture (), results in only a marginal increase in the SNR; therefore, significant flux is not lost by the choice of a circular aperture.
| RA | 53.1699 |
| DEC | -27.7684 |
| z | 3.088 |
| SFR [M⊙/yr] | |
| SFRSED [M⊙/yr] | |
| , MAGPHYS | |
| , lower limit | |
3.2.1 Detection reliability test
To test the reliability of our detection, we check for the growth curve at random locations in the region covering the deepest F336W data. We use the F160W segmentation map to mask out all bright targets in the F336W image. We then place two circular apertures of at 20,000 random locations. We only measure the growth curve if the percentage of unmasked pixel within the largest aperture was greater than 90%. Only one random location out of nearly 16470 possible locations had S/N within aperture and S/N within aperture. There is clear emission in the F606W image at the same random location, indicating that the false detection is an interloper galaxy. We do not detect any signature of any interlopers in either HST or JWST imaging and MUSE datacube coincident with the LyC detection. Thus the probability of randomly detecting a similar source is less than .
3.2.2 Spatial offset of ionising emission
The peak non-ionizing UV emission (F606W) and ionizing emission have a spatial offset of or kpc at . We checked for astrometric alignment between the F336W and F606W images by estimating the difference in the centroids of the 20 brightest sources in the deepest FOV F336W image. The average difference in x-centroid [y-centroid] is [] pixels, significantly smaller than the peak separation ( pixels) between ionizing and non-ionizing emission from our target. Therefore, the astrometric inaccuracies cannot account for the spatial offset.
3.2.3 LyC escape fraction
The escape fraction is defined as the ratio of ionizing ( at ) divided by the non-ionizing flux density ( typically at , Steidel et al., 2001). We use the standard procedure to calculate escape fraction (e.g., Siana et al., 2007; Ji et al., 2020). As mentioned earlier, we use the F606W filter (rest-frame ) to measure non-ionizing photon flux density. The ionizing photons can sometimes escape from certain parts of the galaxy (Verhamme et al., 2015), therefore we use the same aperture to estimate flux for both ionizing and non-ionizing UV components. Using an aperture centered at the peak LyC flux and gives nJy and nJy. If we use an aperture of , then nJy and nJy. Thus, within the aperture and within the aperture. This is done after convolving the F336W and F606W images to a common PSF of F606W.
We need precise measurements of intrinsic non-ionizing to ionizing photon luminosity (), accurate IGM attenuation () at the redshift of our galaxy, and the dust attenuation () to estimate relative and absolute escape fraction. We use the IGM transmission of at calculated by Kerutt et al. (2023), which uses the mean transmission from the 5% of the brightest sightlines based on the Inoue et al. (2014) model. The adopted sits comfortably in the range calculated for Lyman- emitters by (Bassett et al., 2021, see their Figure 6), taking into account the bias of detected LyC emitters along clean lines in the IGM.
Using (see section 3.4.1) and the extinction curve for the Small Magellanic Cloud (SMC) from Gordon et al. (2003), we obtain . We note that the NIRSpec spectra do not cover the region where LyC emission is detected. The region occupying the bulk of gas emitting H and H emission lines can be different from the region with bright OB-type stars, as has been postulated by other studies (Vanzella et al., 2020, 2022; Meštrić et al., 2023). Therefore, the extinction towards the LyC region could be significantly different.
Finally, the intrinsic luminosity ratio can vary between depending on the assumptions in the stellar population model (Leitherer et al., 1999; Eldridge et al., 2017). The best-fit SED model from MAGPHYS (Section 3.1) gives , resulting in , and . An escape fraction is unphysical because it implies the galaxy is leaking more than the ionizing photons produced in this ionization cone. Note that the properties of the stellar population might not be the same throughout the galaxy. Even assuming a more typically used , we get and . Using the lower limit on gives us the most conservative estimate on the relative escape fraction of and a corresponding . A future paper will analyze the resolved stellar population properties of z19863 and test the impact different stellar population models have on the escape fraction measurements.
3.3 Merger activity
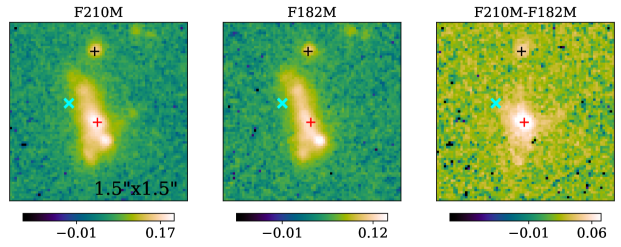
We use medium-band filters F210M and F182M to analyze the merger activity of our source. At , the medium-band filter F210M would contain emission from stars and the [Oiii] 5007+H emission lines, whereas filter F182M would only have stellar emission. Therefore, the difference image between the two filters provides a spatially resolved distribution of gas emission ([Oiii] 5007+H) from the target (Figure 4). We use StatMorph (Rodriguez-Gomez et al., 2019) to estimate non-parametric quantities for all three filters (more details in Gupta et al., in prep.) .
The Gini-M20 statistics (Lotz et al., 2008) classify z19863 as a merger based on the stellar emission (F182M) but a non-merger based on the gas emission (F210M-F182M). The peak gas emission (F210M-F182M) is coincident with the peak non-ionizing UV emission (F606W), whereas the peak stellar emission (F182M) is SW of the non-ionizing UV emission (F606W). The lack of merger signs in the gas emission could be because hydrodynamical cooling results in faster settling time for the gas compared to stars after a merger event (See Gupta et al., in prep. for more discussion). The gas emission (F210M-F182M) seems to be extended towards the position of the LyC detection, indicating that LyC photons could be escaping from a recently star-forming part of the galaxy. A detailed analysis of spatially-resolved spectral properties of z19863 is beyond the scope of this paper and will be part of future analysis
3.4 JADES/NIRSpec observations
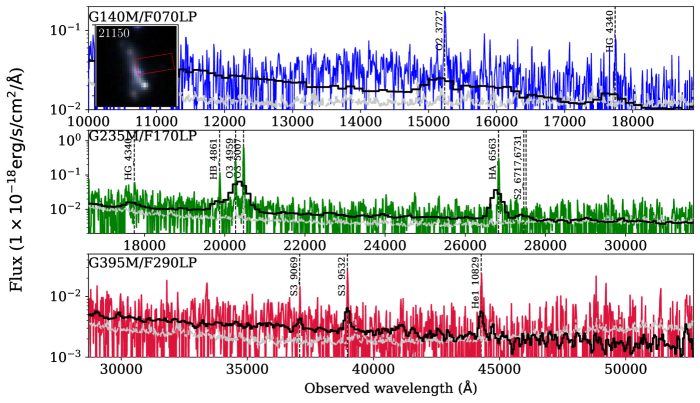
Figure 5 shows the JWST/NIRSpec spectrum for z19863 from the JADES (NIRSpec ID = 21150, NIRCam ID = 211968; Bunker et al., 2023) spanning all the way from , showing multiple bright emission lines. Note that the microshutter only partially covers the galaxy and only on the side opposite to the LyC detection. We cannot use the NIRSpec spectra to rule out if the emission in the F336W image is due to an interloper galaxy. Even with this partial coverage, we are able to detect a whole suite of emission lines to estimate the gas-phase metallicity and ionization conditions in the galaxy.
The emission lines fluxes in the JADES catalogs have been aperture-corrected using the location of micro-shutter on the NIRCam imaging. The analysis in the following subsections assumes that the gas has similar properties across the entire galaxy, which might not be correct. Neither [Nii] 6583 or [Sii] 6717,6731 are detected at S/N with grism, therefore we rely on the JADES prism catalogs to estimate ISM conditions.
3.4.1 Dust Extinction and star formation
We use the Gordon et al. (2003) extinction curve for the Small Magellanic Cloud to correct for dust extinction, following similar approach used in previous studies of high redshift galaxies (Reddy et al., 2023; Cameron et al., 2023). We use the Balmer decrement based on the ratio of H and H emission lines to estimate the color excess using the equation:
| (1) |
The Balmer decrement for z19863 is , which results in .
The dust-corrected SFR based on H and using the Kennicutt Jr & Evans II (2012) relation, is /yr for this galaxy, placing it within the main-sequence at (Popesso et al., 2022). It’s important to note that the H luminosity used for this calculation is rescaled based on the position of the microshutter on the NIRCam image of the galaxy. However, the pseudo [Oiii] 5007 emission map reveals that the microshutter misses the most star-forming part of the galaxy (Figure 4). Therefore, the total H luminosity and the instantaneous SFR of z19863 may differ significantly from the value estimated here.
3.4.2 ionization conditions
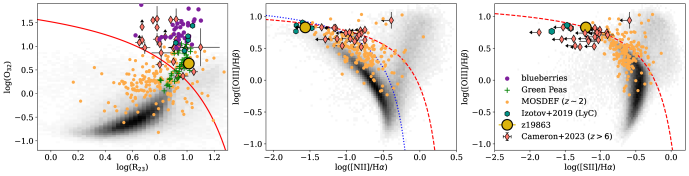
The left panel in Figure 6 displays the extinction-corrected versus relation of z19863 compared to other LyC emitter samples and galaxies at , where:
To correct for dust extinction for low redshift samples, we apply the CCM89 extinction curve (, Cardelli et al., 1989). The and ratios of z19863 are higher than those of typical star-forming galaxies both in the local universe (Aihara et al., 2011) and at (Shapley et al., 2014; Kriek et al., 2015). The emission line ratios of z19863 resemble those of other extreme galaxy populations such as green peas and blueberries in the local universe. However, its ratio is not as high as that of other LyC emitters at . z19863 also exhibits a low , where
compared to typical star-forming galaxies at , which has also been indicated as a marker for LyC leakers (Ramambason et al., 2020).
Interestingly, we have detections of both [Siii] 9069,9531 and [Sii] 6717,6731 in the prism spectrum of z19863. Therefore, we can use the ratio defined as:
to estimate the ionization parameter, a metallicity- and pressure-independent ionization parameter diagnostic. Traditionally, the ratio is used to estimate the ionization parameter because [Siii] 9069,9531 either redshifts into the near-infrared at or beyond at , making it difficult to observe. However, ionization parameters based on are highly dependent on the choice of stellar template (Sanders et al., 2015). Sanders et al. (2019) used stacked measurements of [Siii] 9069,9531 in galaxies to and confirmed its weaker dependence on metallicity compared to . Recent observations have started to use [Siii] 9069,9531 to estimate the ionization conditions in galaxies (Mingozzi et al., 2020; Kumari et al., 2021).
The ratio of z19863 is constraining the ionization parameter to . This suggests that z19863 has a similar ionization parameter to typical SFGs at (Sanders et al., 2015), and significantly lower than galaxies at . Again, we note that NIRSpec observations only cover a small portion of the galaxy. Spatially resolved observations of star-bursting galaxies find significant variations in metallicity and ionization parameter (del Valle-Espinosa et al., 2023), indicating that NIRSpec spectra might not be representative of the average gas conditions in the galaxy.
3.4.3 Gas-phase Metallicity
The [Nii] 6583 emission line is not detected in either the grism or prism spectrum, indicative of very low metallicity. We use the grism spectra to estimate an upper limit on [Nii] 6583 because [Nii] 6583 is blended with H in the prism spectrum. The [Nii] 6583/H versus [Oiii] 5007/H diagram (Figure 6) places the galaxy well within the region occupied by low-metallicity star-forming galaxies both in the low and high-redshift universe.
We use the S23 diagnostic from (Kewley et al., 2019) to estimate the gas-phase metallicity, where
due to its sensitivity at lower metallicity and the lack of [Nii] 6583 detection. Using an ratio of and , we estimate the gas-phase metallicity at ( Z⊙). Thus, the gas-phase metallicity of our galaxy is fairly consistent with gas-poor galaxies detected at higher redshifts (Tang et al., 2023; Boyett et al., 2024).
3.5 Rest-UV spectrum
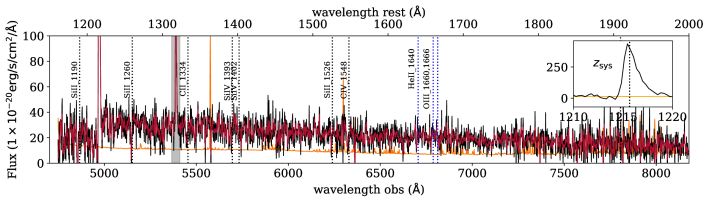
We extract the rest-UV spectrum of our target using the mosaic datacube from the MXDF survey (Bacon et al., 2023). The mosaic datacube reaches a total integration time of 12 hours at the position of our target (peak flux in F606W filter). We search for emission around the expected Lyman- wavelength at , and identify the peak wavelength. We sum over flux within around the peak Lyman- wavelength to create a line map and add spaxels above to extract the 1D spectrum (Figure 7). The peak Lyman- emission has a spatial offset of with respect to peak flux in F606W filter, which is similar to the typical FWHM of the MUSE observations.
The Lyman- emission is highly asymmetric with an undetected blue-side, similar to other high-redshift Lyman- emitters (Gronke & Dijkstra, 2016). The red peak of the Lyman- emission has a marginal velocity offset from the systematic redshift of the galaxy (approximately 100 km/s). There is significant contamination in the rest-UV spectrum from another Lyman- emitter at , which is only from the F606W peak (indicated as a black plus in Figure 1). The high spatial resolution of HST and JWST ensures negligible contamination in the photometry of z19863 from this source at any wavelengths including the F336W image. We have clear detections of many low (Siii, Siii, Cii, Siii) and high ionization (Siiv, Civ) metal absorption features. Interestingly, we do not detect any high ionization emission lines such as [Oiii] 1660,1666, Heii 1640, [Ciii] 1907,1909, which are commonly detected in other LyC emitters (Vanzella et al., 2019). Ji et al. (2020) also report a tentative detection of Heii 1640 (S/N) in Ion1, indicating the need for a deeper rest-UV spectrum.
4 Discussion
4.1 Curious case of z19863
This paper presents the discovery of a new LyC emitter candidate, z19863 at redshift , combining archival data from deep imaging campaigns conducted on the HST and JWST (Figure 1). Detailed information about the source is provided in Table 1. Using the deep NIRSpec spectrum from JADES we find that z19863 has characteristics similar to other LyC emitters across different redshift ranges (see Figure 6), including a moderate ionization parameter (), a low gas-phase metallicity (12+(O/H) = ), and a high ratio (). Notably, the LyC emission is spatially offset by (equivalent to pixels or approximately 2.2 kpc) from the peak rest-UV (non-ionizing) emission (Figure 1). The astrometric misalignment is insufficient to account for the spatial offset ( pixel). We do not detect any interloper galaxy co-incident with the LyC detection in extremely deep spectroscopy from the MXDF survey (Figure 7). We estimate the probability of randomly detecting a similar source within a similar aperture () in the F336W image is .
Most observations focused on detecting LyC photons typically search for emission at co-spatial with the non-ionising UV emission. For example, Kerutt et al. (2023) look for LyC emission within aperture around the non-ionising rest-UV emission, and therefore would miss a source similar to z19863 with about offset between the ionising and non-ionising emission peaks. Ion1 () is another know LyC emitter that exhibits a spatial offset between the peak rest-UV and LyC emission ( kpc, Ji et al., 2020).
Additionally, z19863 has a single peaked Lyman- emission profile z19863 (Figure 7), atypical to LyC emitters in the local universe where a double-peaked profile with a narrow velocity separation is common (Izotov et al., 2018, 2022; Flury et al., 2022b). Models of LyC and Lyman- escape suggest that a narrow velocity separation is indicative of an optically thin neutral ISM, which, in turn, facilitates the escape of ionising photons (Izotov et al., 2018). The green pea galaxies with high ratios (are more likely to leak LyC photons) have lower HI gas mass, suggesting they are more likely to be optically thin (Kanekar et al., 2021). However, LyC emitters at high redshift exhibit a range of Lyman- profiles, including 3-4 peaks (Izotov et al., 2022), single peaked for Q1549-C25 (Shapley et al., 2016), and absorption rather than emission for Ion1 (Ji et al., 2020). Kerutt et al. (2023) uses a larger sample of LyC emitters between and find no correlation between the Lyman- emission and the escape fraction. It is possible that at higher redshifts, most ionising photons escape because of the inhomogeneities in the ISM rather than an optically thin ISM.
4.2 Mergers driving the LyC escape
We currently have two models explaining LyC escape: through an optically thin ISM and the picket-fence model (Zackrisson et al., 2013). In the picket-fence model, LyC photons escape through a few optically thin channels in an otherwise optically thick ISM. These channels are typically created by star-formation-triggered outflows capable of blowing out neutral gas. LyC emitters in the local universe often show a significant correlation between the escape fraction and the strength of ionized gas outflows, suggesting that star formation feedback is responsible for creating these ionized gas channels (Amorín et al., 2024).
However, the mass loading factors for most high-redshift galaxies are similar to those of local dwarf galaxies, even if their star formation rates (SFRs) are ten times higher (Gupta et al., 2022; Concas et al., 2022; Llerena et al., 2023; Carniani et al., 2023). Some semi-analytic models of star-formation-driven galactic winds suggest that outflowing gas in super star-forming conditions might start radiatively cooling on a relatively short timescale (Gyr, Lochhaas et al., 2018). This rapid cooling might hinder the creation of large-scale channels of optically thin neutral gas solely from star formation alone.
Mergers and galaxy-galaxy interactions are known to tidally strip gas and stars, leading to the formation of highly inhomogeneous galaxies (Toomre & Toomre, 1972; Cox et al., 2008; Spilker et al., 2022). Very few LyC emitters in the local universe are close enough to spatially map their neutral gas density. Deep 21cm observations on Haro 11, a local LyC emitter, revealed pockets of optically thin neutral hydrogen most likely created by a recent merger event (Reste et al., 2023). The large spatial offset (6 kpc) between the peak neutral gas density and the LyC emitting clump suggests that LyC photons are most likely leaking through these optically thin channels (Reste et al., 2023). On the other hand, two other local LyC leakers with 21cm observations exhibit either only an upper limit on HI mass (Puschnig et al., 2017) or very high gas mass (Haynes et al., 2018), indicating a wide range in the properties LyC emitters in the local universe.
Recent work by Gupta et al. (2023) finds that EELGs at , analogs of galaxies at , are more likely to encounter major mergers and/or strong interactions. Other observations (e.g., Duncan et al., 2019) also find increased merger activity at higher redshifts. For z19863, medium band images from the FRESCO survey indicate that the galaxy might have encountered a merger recently (Figure 4). Bassett et al. (2018) suggest that the lack of correlation between the O32 ratio and escape fraction could be due to anisotropic neutral gas coverage. In fact, all of their LyC candidates with the lowest O32 ratios showed evidence of disturbed morphology. The Lyman- emission peak for the candidate LyC emitters in Kerutt et al. (2023) is spatially offset by from the peak LyC emission, indicating a mismatch between the peak neutral gas density and ionising stars. We suspect that inhomogeneities created by a merger event in the neutral ISM might have played a significant role in aiding LyC photons to escape at higher redshifts.
We think in z19863 ISM is neither optically thin everywhere nor has a complete picket-fence structure with many optically thin ionizations cone. Here the ISM most likely has a single optically thin ionization cone of neutral ISM created by a recent merger event. The ionising photons are leaking through this single channel, and by happenstance, its alignment along our line of sight ensures that we can detect the faint signature of ionising radiation leaking from this single ionization cone.
4.3 Modelling the opening angle of ionising channels
If LyC radiation leak through a few optically thin ionization cones, similar to z19832, for most galaxies, then their random alignment along the line of sight will dictate the number of confirmed detections of LyC emitters. Estimating the total covering fraction of optically thin ISM in high-redshift galaxies is extremely challenging. Lyman- photons get fluorescently scattered by neutral hydrogen, and thus, a Lyman- emission profile provides some hints about the neutral gas density. A small velocity separation and a large ratio of total flux between the blue and red peaks usually indicate an optically thin ISM (Erb et al., 2018; Blaizot et al., 2023; Mukherjee et al., 2023). However, spatially resolving Lyman- emission is only possible for a small number of Lyman- emitters at , until future spectrographs such as MAVIS (McDermid et al., 2020) become available.
Stacking experiments with large samples of SFGs at have provided some constraints on the average (Steidel et al., 2018; Wang et al., 2023). Theoretical models using various observations about the reionization history of the universe, such as neutral gas density, UV luminosity function etc., constrain the average required (Naidu et al., 2020; Bera et al., 2023; Mutch et al., 2023). However, some individual LyC emitters can have escape fraction as high as 100% (Rivera-Thorsen et al., 2022; Kerutt et al., 2023).
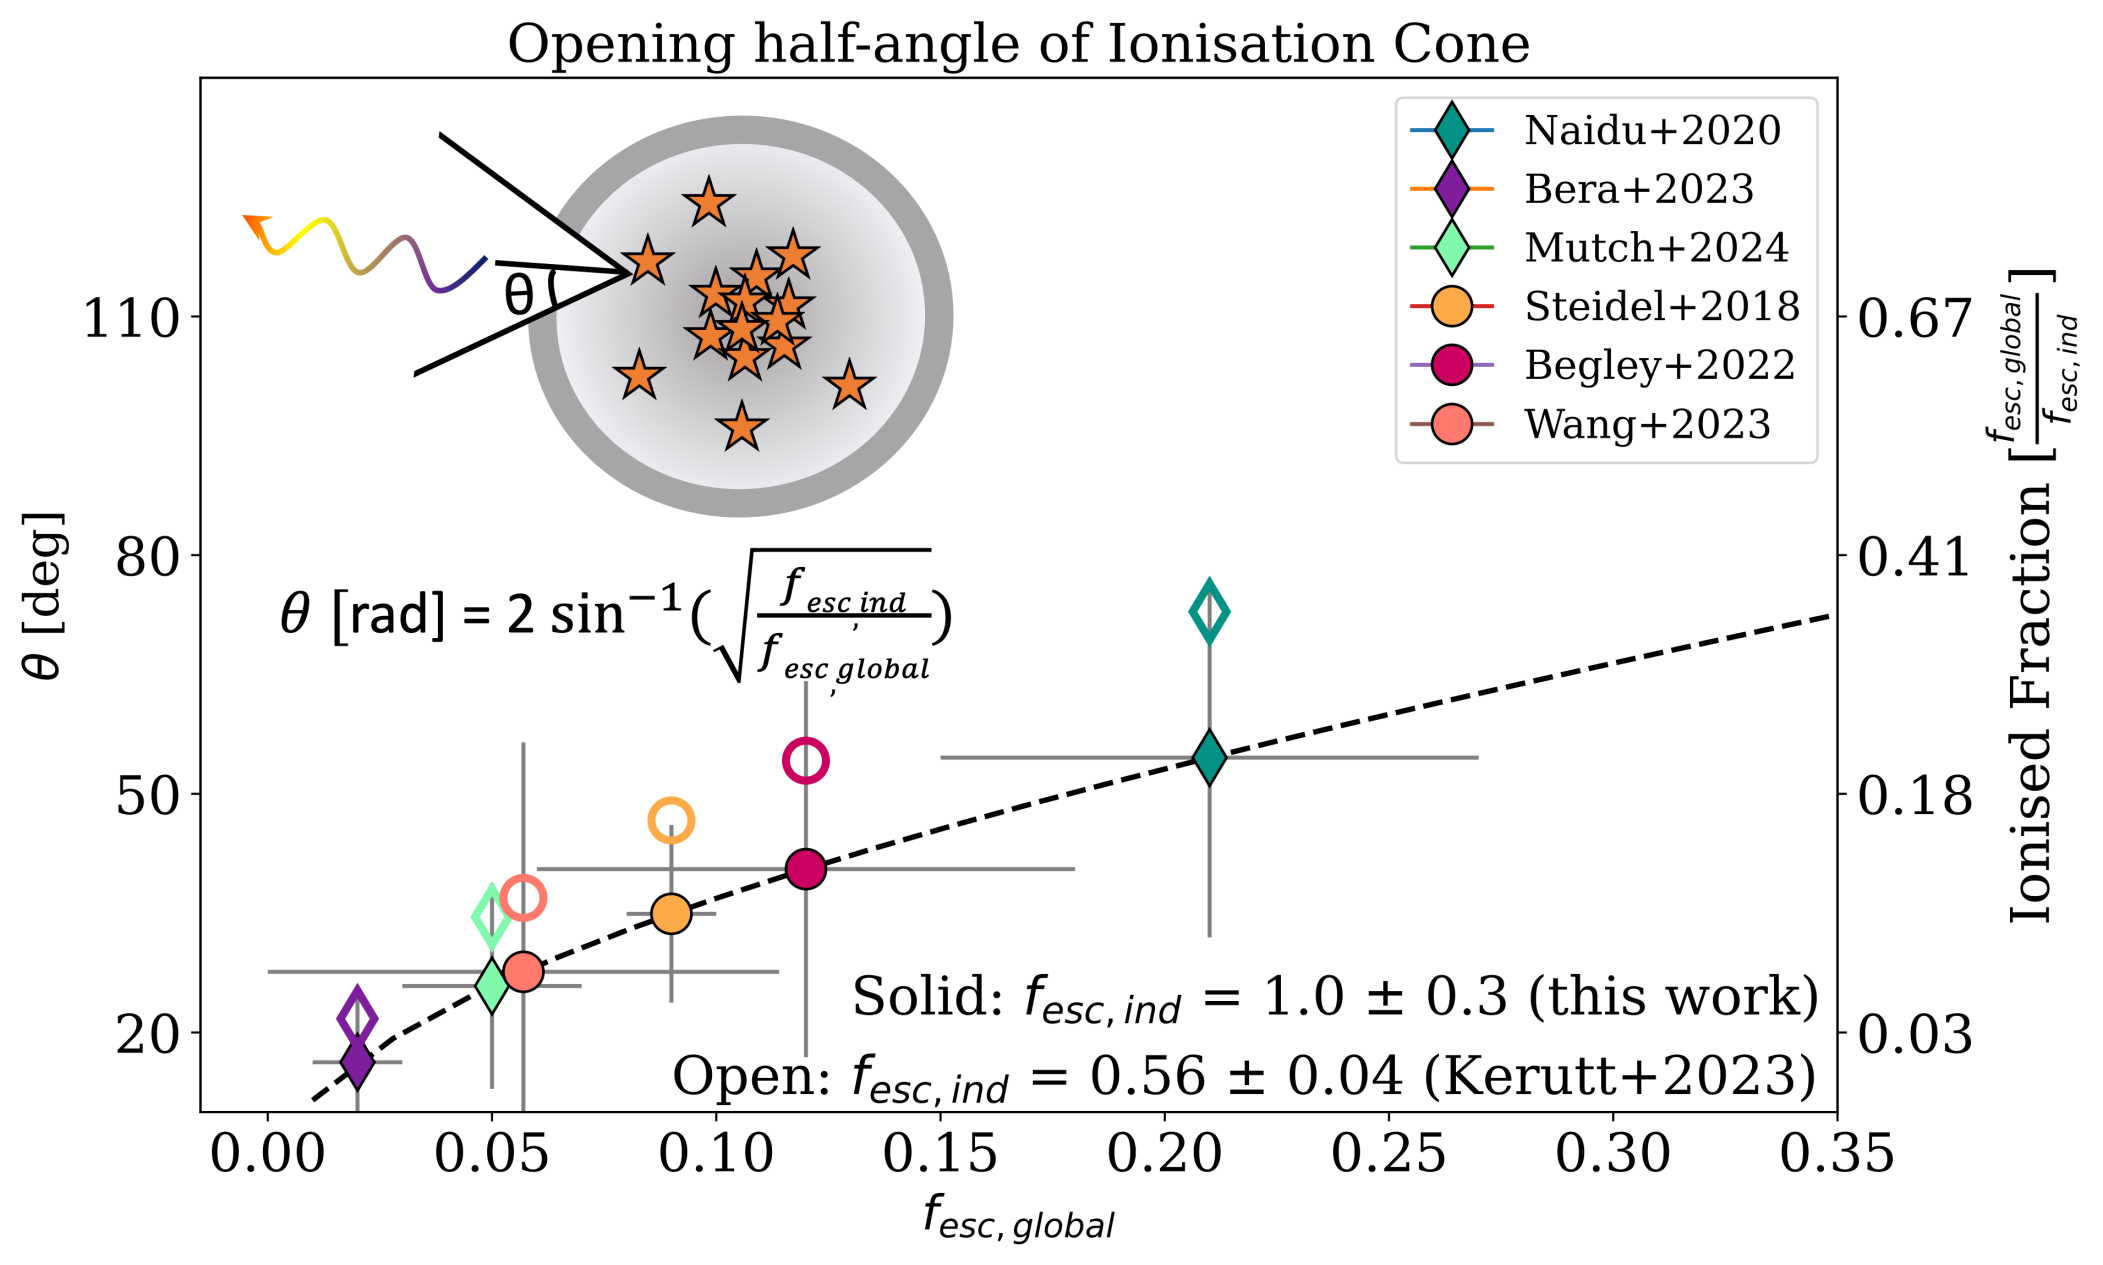
We can use individual measurements to develop a simple model for the total covering fraction or the opening angle of the ionization cone required to reach global values. We assume that all galaxies in the universe have on average an ionization cone with solid angle and escape fraction . The following equation balances the total ionization flux from a single ionization cone with the average escape fraction expected over the entire galaxy ()
| (2) |
For a cone with apex half angle of , the total solid angle is
| (3) |
Therefore, the half-angle of ionization cone would be
| (4) |
Figure 8 shows the average half-angle estimated using equation 4 based on of z19863 and various measurements of from observations (Steidel et al., 2018; Wang et al., 2023) and theory (Naidu et al., 2020; Bera et al., 2023; Mutch et al., 2023). By definition the escape fraction cannot be greater than 1, therefore we assume an absolute escape fraction of rather than estimated value of in Section 3.2. Additionally, the opening half-angle is estimated using based on the average escape fraction for the five gold LyC emitter candidates from Kerutt et al. (2023).
Our simple model can help distinguish between more likely global escape fraction measurements. For instance, if the global escape fraction is constrained to be very low, such as (Bera et al., 2023), an ionization cone with an opening half-angle of approximately may be sufficient to account for this small escape fraction. Even if only 50% of ionizing photons leak from the ionization cone of most galaxies, the opening half-angle would only need to increase to approximately . This scenario could provide an explanation for the limited number of LyC emitter detections at higher redshifts. On the other hand, to achieve a global escape fraction of (Naidu et al., 2020), ionization cones with [] will need to have opening half-angle of []. Such large opening angles imply that a significant fraction (20-50%) of the galaxy would need to be leaking ionizing radiations. However, if this were the case, one might expect a larger success rate in building a larger sample of confirmed LyC leakers.
We only need an opening half-angle of for fully ionised cone and for ionization cone with 50% escape fraction to explain the typically observed from observations (Steidel et al., 2018; Wang et al., 2023). It’s worth noting that even at , a partially neutral intergalactic medium (IGM) can absorb a considerable fraction of ionizing radiations (Bassett et al., 2021), further complicating the detection of LyC emission. Altering the median opening angle of escaping ionising photons would have an impact on the topology of reionization, and a more sophisticated model would explore the effects of this change on the progress of reionization.
5 Summary
This paper presents discovery of a new candidate LyC emitter (z19863) at , where LyC emission is detected using the F336W/UVIS filter on the HST. The galaxy is part of the EELG sample in the MOSEL survey (Tran et al., 2020; Gupta et al., 2022). The LyC emission is spatially offset by kpc from the peak rest-UV emission (F606W). Based on the NIRSpec spectra from the JADES, we estimate that the galaxy has low metallicity, high ionization parameter, and low dust attenuation (See Table 1), similar to other LyC emitters at both low and high redshifts.
The deep rest-UV spectrum of the galaxy from the MXDF survey (12 hour integration) exhibit a single peaked Lyman- emission profile, and a range of low- and high- ionization absorption features (Figure 7). The lack of the rest-UV emission lines such as [Oiii] 1660,1666 Civ 1550, [Ciii] 1907,1909 etc. that are typically used as proxy for LyC emission (Schaerer et al., 2022), suggest an ISM conditions in this galaxy are dissimilar to a typical LyC emitter in the local universe. Further analyses of the absorption profiles of various species and their correlation with LyC emission (Mauerhofer et al., 2021) is beyond the scope of this paper and will be part of future work.
We propose that LyC photons in z19863 are leaking through a narrow cone of optically thin ISM, likely created by a recent merger event as indicated by the disturbed morphology in the medium band imaging (see section 3.3). The ionization cone is spatially offset by from the non-ionising UV emission and its chance alignment along the line of sight ensures its detection by us. A source similar to z19863 would be missed by studies looking for LyC emission co-incident with peak UV emission (e.g., Kerutt et al., 2023). Using a simple toy model, we estimate that the opening half-angle of ionization cones can be as low as to explain some of the global measurements of escape fraction, indicating that very small fraction of the galaxy needs to be leaking ionising radiation. Such small opening angle would also explain the relatively low number of confirmed LyC emitters at high redshifts.
6 Acknowledgments
This research were supported by the Australian Research Council Centre of Excellence for All Sky Astrophysics in 3 Dimensions (ASTRO 3D), through project number CE170100013.
References
- Aihara et al. (2011) Aihara, H., Allende Prieto, C., An, D., et al. 2011, The Astrophysical Journal Supplement Series, 193, 29, doi: 10.1088/0067-0049/193/2/29
- Amorín et al. (2024) Amorín, R. O., Rodríguez-Henríquez, M., Fernández, V., et al. 2024, Astronomy & Astrophysics, 682, L25, doi: 10.1051/0004-6361/202449175
- Atek et al. (2011) Atek, H., Siana, B., Scarlata, C., et al. 2011, The Astrophysical Journal, 743, 121, doi: 10.1088/0004-637X/743/2/121
- Bacon et al. (2023) Bacon, R., Brinchmann, J., Conseil, S., et al. 2023, Astronomy and Astrophysics, 670, A4, doi: 10.1051/0004-6361/202244187
- Barro et al. (2019) Barro, G., Pérez-González, P. G., Cava, A., et al. 2019, The Astrophysical Journal Supplement Series, 243, 22, doi: 10.3847/1538-4365/ab23f2
- Bassett et al. (2021) Bassett, R., Ryan-Weber, E. V., Cooke, J., et al. 2021, Monthly Notices of the Royal Astronomical Society, 502, 108, doi: 10.1093/mnras/stab070
- Bassett et al. (2018) —. 2018, Monthly Notices of the Royal Astronomical Society, 483, 5223, doi: 10.1093/mnras/sty3320
- Begley et al. (2022) Begley, R., Cullen, F., McLure, R. J., et al. 2022, Monthly Notices of the Royal Astronomical Society, 513, 3510, doi: 10.1093/mnras/stac1067
- Bera et al. (2023) Bera, A., Hassan, S., Smith, A., et al. 2023, The Astrophysical Journal, 959, 2, doi: 10.3847/1538-4357/ad05c0
- Bian et al. (2017) Bian, F., Fan, X., McGreer, I., Cai, Z., & Jiang, L. 2017, The Astrophysical Journal, 837, L12, doi: 10.3847/2041-8213/aa5ff7
- Blaizot et al. (2023) Blaizot, J., Garel, T., Verhamme, A., et al. 2023, Monthly Notices of the Royal Astronomical Society, 523, 3749, doi: 10.1093/mnras/stad1523
- Boyett et al. (2024) Boyett, K., Bunker, A. J., Curtis-Lake, E., et al. 2024, Extreme Emission Line Galaxies Detected in JADES JWST/NIRSpec I: Inferred Galaxy Properties, arXiv, doi: 10.48550/arXiv.2401.16934
- Bruzual & Charlot (2003) Bruzual, G., & Charlot, S. 2003, Monthly Notices of the Royal Astronomical Society, 344, 1000, doi: 10.1046/j.1365-8711.2003.06897.x
- Bunker et al. (2023) Bunker, A. J., Cameron, A. J., Curtis-Lake, E., et al. 2023, JADES NIRSpec Initial Data Release for the Hubble Ultra Deep Field: Redshifts and Line Fluxes of Distant Galaxies from the Deepest JWST Cycle 1 NIRSpec Multi-Object Spectroscopy, doi: 10.48550/arXiv.2306.02467
- Cameron et al. (2023) Cameron, A. J., Saxena, A., Bunker, A. J., et al. 2023, JADES: Probing Interstellar Medium Conditions at $z\sim5.5-9.5$ with Ultra-Deep JWST/NIRSpec Spectroscopy, doi: 10.48550/arXiv.2302.04298
- Cardelli et al. (1989) Cardelli, J. A., Clayton, G. C., & Mathis, J. S. 1989, The Astrophysical Journal, 345, 245, doi: 10.1086/167900
- Carniani et al. (2023) Carniani, S., Venturi, G., Parlanti, E., et al. 2023, JADES: The Incidence Rate and Properties of Galactic Outflows in Low-Mass Galaxies across 3 z 9, arXiv, doi: 10.48550/arXiv.2306.11801
- Charlot & Fall (2000) Charlot, S., & Fall, S. M. 2000, The Astrophysical Journal, 539, 718, doi: 10.1086/309250
- Concas et al. (2022) Concas, A., Maiolino, R., Curti, M., et al. 2022, Monthly Notices of the Royal Astronomical Society, 513, 2535, doi: 10.1093/mnras/stac1026
- Cox et al. (2008) Cox, T. J., Jonsson, P., Somerville, R. S., Primack, J. R., & Dekel, A. 2008, Monthly Notices of the Royal Astronomical Society, 384, 386, doi: 10.1111/j.1365-2966.2007.12730.x
- da Cunha et al. (2008) da Cunha, E., Charlot, S., & Elbaz, D. 2008, Monthly Notices of the Royal Astronomical Society, 388, 1595, doi: 10.1111/j.1365-2966.2008.13535.x
- da Cunha et al. (2015) da Cunha, E., Walter, F., Smail, I. R., et al. 2015, The Astrophysical Journal, 806, 110, doi: 10.1088/0004-637X/806/1/110
- de Barros et al. (2016) de Barros, S., Vanzella, E., Amorín, R., et al. 2016, Astronomy & Astrophysics, 585, A51, doi: 10.1051/0004-6361/201527046
- del Valle-Espinosa et al. (2023) del Valle-Espinosa, M. G., Sánchez-Janssen, R., Amorín, R., et al. 2023, Monthly Notices of the Royal Astronomical Society, 522, 2089, doi: 10.1093/mnras/stad1087
- Duncan et al. (2019) Duncan, K., Conselice, C. J., Mundy, C., et al. 2019, The Astrophysical Journal, 876, 110, doi: 10.3847/1538-4357/ab148a
- Eisenstein et al. (2023) Eisenstein, D. J., Willott, C., Alberts, S., et al. 2023, Overview of the JWST Advanced Deep Extragalactic Survey (JADES), doi: 10.48550/arXiv.2306.02465
- Eldridge et al. (2017) Eldridge, J. J., Stanway, E. R., Xiao, L., et al. 2017, Publications of the Astronomical Society of Australia, 34, e058, doi: 10.1017/pasa.2017.51
- Endsley et al. (2020) Endsley, R., Stark, D. P., Chevallard, J., & Charlot, S. 2020, Monthly Notices of the Royal Astronomical Society, 500, 5229, doi: 10.1093/mnras/staa3370
- Endsley et al. (2023) Endsley, R., Stark, D. P., Whitler, L., et al. 2023, The Star-forming and Ionizing Properties of Dwarf Z~6-9 Galaxies in JADES: Insights on Bursty Star Formation and Ionized Bubble Growth, arXiv, doi: 10.48550/arXiv.2306.05295
- Erb et al. (2018) Erb, D. K., Steidel, C. C., & Chen, Y. 2018, The Astrophysical Journal Letters, 862, L10, doi: 10.3847/2041-8213/aacff6
- Flury et al. (2022a) Flury, S. R., Jaskot, A. E., Ferguson, H. C., et al. 2022a, The Astrophysical Journal Supplement Series, 260, 1, doi: 10.3847/1538-4365/ac5331
- Flury et al. (2022b) —. 2022b, The Astrophysical Journal, 930, 126, doi: 10.3847/1538-4357/ac61e4
- Forrest et al. (2018) Forrest, B., Tran, K.-v. H., Broussard, A., et al. 2018, The Astrophysical Journal, 863, 131, doi: 10.3847/1538-4357/aad232
- Giacconi et al. (2002) Giacconi, R., Zirm, A., Wang, J., et al. 2002, The Astrophysical Journal Supplement Series, 139, 369, doi: 10.1086/338927
- Gordon et al. (2003) Gordon, K. D., Clayton, G. C., Misselt, K. A., Landolt, A. U., & Wolff, M. J. 2003, The Astrophysical Journal, 594, 279, doi: 10.1086/376774
- Gronke & Dijkstra (2016) Gronke, M., & Dijkstra, M. 2016, The Astrophysical Journal, 826, 14, doi: 10.3847/0004-637x/826/1/14
- Gupta et al. (2022) Gupta, A., Tran, K.-V., Mendel, T., et al. 2022, Monthly Notices of the Royal Astronomical Society, 519, 980, doi: 10.1093/mnras/stac3548
- Gupta et al. (2023) Gupta, A., Jaiswar, R., Rodriguez-Gomez, V., et al. 2023, The Astrophysical Journal Letters, 957, L35, doi: 10.3847/2041-8213/ad0788
- Hainline et al. (2023) Hainline, K. N., Johnson, B. D., Robertson, B., et al. 2023, The Cosmos in Its Infancy: JADES Galaxy Candidates at z 8 in GOODS-S and GOODS-N, doi: 10.48550/arXiv.2306.02468
- Haynes et al. (2018) Haynes, M. P., Giovanelli, R., Kent, B. R., et al. 2018, The Astrophysical Journal, 861, 49, doi: 10.3847/1538-4357/aac956
- Illingworth et al. (2016) Illingworth, G., Magee, D., Bouwens, R., et al. 2016, The Hubble Legacy Fields (HLF-GOODS-S) v1.5 Data Products: Combining 2442 Orbits of GOODS-S/CDF-S Region ACS and WFC3/IR Images, doi: 10.48550/arXiv.1606.00841
- Inoue et al. (2014) Inoue, A. K., Shimizu, I., Iwata, I., & Tanaka, M. 2014, Monthly Notices of the Royal Astronomical Society, 442, 1805, doi: 10.1093/mnras/stu936
- Izotov et al. (2022) Izotov, Y. I., Chisholm, J., Worseck, G., et al. 2022, Monthly Notices of the Royal Astronomical Society, 515, 2864, doi: 10.1093/mnras/stac1899
- Izotov et al. (2016a) Izotov, Y. I., Orlitová, I., Schaerer, D., et al. 2016a, Nature, 529, 178, doi: 10.1038/nature16456
- Izotov et al. (2016b) Izotov, Y. I., Schaerer, D., Thuan, T. X., et al. 2016b, Monthly Notices of the Royal Astronomical Society, 461, 3683, doi: 10.1093/mnras/stw1205
- Izotov et al. (2018) Izotov, Y. I., Worseck, G., Schaerer, D., et al. 2018, Monthly Notices of the Royal Astronomical Society, 478, 4851, doi: 10.1093/mnras/sty1378
- Ji et al. (2020) Ji, Z., Giavalisco, M., Vanzella, E., et al. 2020, The Astrophysical Journal, 888, 109, doi: 10.3847/1538-4357/ab5fdc
- Kanekar et al. (2021) Kanekar, N., Ghosh, T., Rhoads, J., et al. 2021, The Astrophysical Journal, 913, L15, doi: 10.3847/2041-8213/abfb76
- Kauffmann et al. (2003) Kauffmann, G., Heckman, T. M., Tremonti, C., et al. 2003, Monthly Notices of the Royal Astronomical Society, 346, 1055, doi: 10.1111/j.1365-2966.2003.07154.x
- Kennicutt Jr & Evans II (2012) Kennicutt Jr, R. C., & Evans II, N. J. 2012, Annual Review of Astronomy and Astrophysics, 50, 531, doi: 10.1146/annurev-astro-081811-125610
- Kerutt et al. (2023) Kerutt, J., Oesch, P. A., Wisotzki, L., et al. 2023, Lyman Continuum Leaker Candidates at $z\sim3-4$ in the HDUV Based on a Spectroscopic Sample of MUSE LAEs, arXiv, doi: 10.48550/arXiv.2312.08791
- Kewley et al. (2001) Kewley, L. J., a. Dopita, M., Sutherland, R. S., a. Heisler, C., & Trevena, J. 2001, The Astrophysical Journal, 556, 121, doi: 10.1086/321545
- Kewley et al. (2019) Kewley, L. J., Nicholls, D. C., Sutherland, R., et al. 2019, The Astrophysical Journal, 880, 16, doi: 10.3847/1538-4357/ab16ed
- Kriek et al. (2015) Kriek, M., Shapley, A. E., Reddy, N. A., et al. 2015, The Astrophysical Journal Supplement Series, 218, 15, doi: 10.1088/0067-0049/218/2/15
- Kumari et al. (2021) Kumari, N., Amorín, R., Pérez-Montero, E., Vílchez, J., & Maiolino, R. 2021, Monthly Notices of the Royal Astronomical Society, 508, 1084, doi: 10.1093/mnras/stab2495
- Labbé et al. (2013) Labbé, I., Oesch, P. A., Bouwens, R. J., et al. 2013, The Astrophysical Journal, 777, L19, doi: 10.1088/2041-8205/777/2/L19
- Lamareille et al. (2004) Lamareille, F., Mouhcine, M., Contini, T., Lewis, I., & Maddox, S. 2004, Monthly Notices of the Royal Astronomical Society, 350, 396, doi: 10.1111/j.1365-2966.2004.07697.x
- Leitherer et al. (1999) Leitherer, C., Schaerer, D., Goldader, J. D., et al. 1999, The Astrophysical Journal, 123, 3, doi: 10.1086/313233
- Llerena et al. (2023) Llerena, M., Amorín, R., Pentericci, L., et al. 2023, Ionized Gas Kinematics and Chemical Abundances of Low-Mass Star-Forming Galaxies at $z\sim 3$, doi: 10.48550/arXiv.2303.01536
- Lochhaas et al. (2018) Lochhaas, C., Thompson, T. A., Quataert, E., & Weinberg, D. H. 2018, Monthly Notices of the Royal Astronomical Society, 481, 1873, doi: 10.1093/mnras/sty2421
- Lotz et al. (2008) Lotz, J. M., Davis, M., Faber, S. M., et al. 2008, The Astrophysical Journal, 672, 177, doi: 10.1086/523659
- Lumbreras-Calle et al. (2022) Lumbreras-Calle, A., López-Sanjuan, C., Sobral, D., et al. 2022, Astronomy and Astrophysics, 668, A60, doi: 10.1051/0004-6361/202142898
- Mainali et al. (2019) Mainali, R., Stark, D. P., Tang, M., et al. 2019, Monthly Notices of the Royal Astronomical Society, 494, 719, doi: 10.1093/mnras/staa751
- Marques-Chaves et al. (2022) Marques-Chaves, R., Schaerer, D., Amorín, R. O., et al. 2022, Astronomy and Astrophysics, 663, L1, doi: 10.1051/0004-6361/202243598
- Maseda et al. (2014) Maseda, M. V., Van Der Wel, A., Rix, H. W., et al. 2014, Astrophysical Journal, 791, 17, doi: 10.1088/0004-637X/791/1/17
- Mauerhofer et al. (2021) Mauerhofer, V., Verhamme, A., Blaizot, J., et al. 2021, Astronomy & Astrophysics, 646, A80, doi: 10.1051/0004-6361/202039449
- McDermid et al. (2020) McDermid, R. M., Cresci, G., Rigaut, F., et al. 2020, 1, doi: 10.25949/zdaw-rx65
- Meštrić et al. (2020) Meštrić, U., Ryan-Weber, E. V., Cooke, J., et al. 2020, Monthly Notices of the Royal Astronomical Society, 494, 4986, doi: 10.1093/mnras/staa920
- Meštrić et al. (2023) Meštrić, U., Vanzella, E., Upadhyaya, A., et al. 2023, Astronomy & Astrophysics, 673, A50, doi: 10.1051/0004-6361/202345895
- Mingozzi et al. (2020) Mingozzi, M., Belfiore, F., Cresci, G., et al. 2020, Astronomy & Astrophysics, 636, A42, doi: 10.1051/0004-6361/201937203
- Mukherjee et al. (2023) Mukherjee, T., Zafar, T., Nanayakkara, T., et al. 2023, Compact to Extended Lyman-$\alpha$ Emitters in MAGPI: Strong Blue Peak Emission at $z\gtrsim3$, https://arxiv.org/abs/2311.07019v1
- Mutch et al. (2023) Mutch, S. J., Greig, B., Qin, Y., Poole, G. B., & Wyithe, J. S. B. 2023, Dark-Ages Reionization and Galaxy Formation Simulation – XXI. Constraining the Evolution of the Ionizing Escape Fraction, arXiv, doi: 10.48550/arXiv.2303.07378
- Naidu et al. (2020) Naidu, R. P., Tacchella, S., Mason, C. A., et al. 2020, The Astrophysical Journal, 892, 109, doi: 10.3847/1538-4357/ab7cc9
- Oesch et al. (2023) Oesch, P. A., Brammer, G., Naidu, R. P., et al. 2023, The JWST FRESCO Survey: Legacy NIRCam/Grism Spectroscopy and Imaging in the Two GOODS Fields, arXiv, doi: 10.48550/arXiv.2304.02026
- Popesso et al. (2022) Popesso, P., Concas, A., Cresci, G., et al. 2022, Monthly Notices of the Royal Astronomical Society, 519, 1526, doi: 10.1093/mnras/stac3214
- Puschnig et al. (2017) Puschnig, J., Hayes, M., Östlin, G., et al. 2017, Monthly Notices of the Royal Astronomical Society, 469, 3252, doi: 10.1093/mnras/stx951
- Rafelski et al. (2015) Rafelski, M., Teplitz, H. I., Gardner, J. P., et al. 2015, The Astronomical Journal, 150, 31, doi: 10.1088/0004-6256/150/1/31
- Ramambason et al. (2020) Ramambason, L., Schaerer, D., Stasińska, G., et al. 2020, Astronomy and Astrophysics, 644, A21, doi: 10.1051/0004-6361/202038634
- Reddy et al. (2023) Reddy, N. A., Topping, M. W., Sanders, R. L., Shapley, A. E., & Brammer, G. 2023, The Astrophysical Journal, 948, 83, doi: 10.3847/1538-4357/acc869
- Reste et al. (2023) Reste, A. L., Cannon, J. M., Hayes, M. J., et al. 2023, Tidally Offset Neutral Gas in Lyman Continuum Emitting Galaxy Haro 11, arXiv, doi: 10.48550/arXiv.2301.02676
- Rieke & the JADES Collaboration (2023) Rieke, M., & the JADES Collaboration. 2023, JADES Initial Data Release for the Hubble Ultra Deep Field: Revealing the Faint Infrared Sky with Deep JWST NIRCam Imaging, doi: 10.48550/arXiv.2306.02466
- Rinaldi et al. (2023) Rinaldi, P., Caputi, K. I., Costantin, L., et al. 2023, The Astrophysical Journal, 952, 143, doi: 10.3847/1538-4357/acdc27
- Rivera-Thorsen et al. (2022) Rivera-Thorsen, T. E., Hayes, M., & Melinder, J. 2022, Astronomy and Astrophysics, 666, A145, doi: 10.1051/0004-6361/202243678
- Rivera-Thorsen et al. (2019) Rivera-Thorsen, T. E., Dahle, H., Chisholm, J., et al. 2019, Science, 366, 738, doi: 10.1126/science.aaw0978
- Roberts-Borsani et al. (2016) Roberts-Borsani, G. W., Bouwens, R. J., Oesch, P. A., et al. 2016, The Astrophysical Journal, 823, 143, doi: 10.3847/0004-637x/823/2/143
- Rodriguez-Gomez et al. (2019) Rodriguez-Gomez, V., Snyder, G. F., Lotz, J. M., et al. 2019, Monthly Notices of the Royal Astronomical Society, 483, 4140, doi: 10.1093/mnras/sty3345
- Sanders et al. (2015) Sanders, R. L., Shapley, A. E., Kriek, M., et al. 2015, The Astrophysical Journal, 816, 23, doi: 10.3847/0004-637X/816/1/23
- Sanders et al. (2019) Sanders, R. L., Jones, T., Shapley, A. E., et al. 2019, The Astrophysical Journal Letters, 888, L11, doi: 10.3847/2041-8213/ab5d40
- Saxena et al. (2022) Saxena, A., Pentericci, L., Ellis, R. S., et al. 2022, Monthly Notices of the Royal Astronomical Society, 511, 120, doi: 10.1093/mnras/stab3728
- Schaerer et al. (2022) Schaerer, D., Izotov, Y. I., Worseck, G., et al. 2022, Astronomy & Astrophysics, 658, L11, doi: 10.1051/0004-6361/202243149
- Shapley et al. (2016) Shapley, A. E., Steidel, C. C., Strom, A. L., et al. 2016, The Astrophysical Journal, 826, L24, doi: 10.3847/2041-8205/826/2/L24
- Shapley et al. (2014) Shapley, A. E., Reddy, N. A., Kriek, M., et al. 2014, Astrophysical Journal, 801, 88, doi: 10.1088/0004-637X/801/2/88
- Siana et al. (2007) Siana, B., Teplitz, H. I., Colbert, J., et al. 2007, The Astrophysical Journal, 668, 62, doi: 10.1086/521185
- Spilker et al. (2022) Spilker, J., Suess, K., Setton, D., et al. 2022, The Astrophysical Journal Letters, 936, L11, doi: 10.3847/2041-8213/ac75ea
- Steidel et al. (2018) Steidel, C. C., Bogosavljević, M., Shapley, A. E., et al. 2018, The Astrophysical Journal, 869, 123, doi: 10.3847/1538-4357/aaed28
- Steidel et al. (2001) Steidel, C. C., Pettini, M., & Adelberger, K. L. 2001, The Astrophysical Journal, 546, 665, doi: 10.1086/318323
- Straatman et al. (2016) Straatman, C. M. S., Spitler, L. R., Quadri, R. F., et al. 2016, The Astrophysical Journal, 830, 1, doi: 10.3847/0004-637X/830/1/51
- Tang et al. (2019) Tang, M., Stark, D. P., Chevallard, J., & Charlot, S. 2019, Monthly Notices of the Royal Astronomical Society, 489, 2572, doi: 10.1093/mnras/stz2236
- Tang et al. (2023) Tang, M., Stark, D. P., Chen, Z., et al. 2023, JWST/NIRSpec Spectroscopy of $z=7-9$ Star Forming Galaxies with CEERS: New Insight into Bright Ly$\alpha$ Emitters in Ionized Bubbles, arXiv, doi: 10.48550/arXiv.2301.07072
- Teplitz et al. (2013) Teplitz, H. I., Rafelski, M., Kurczynski, P., et al. 2013, The Astronomical Journal, 146, 159, doi: 10.1088/0004-6256/146/6/159
- Toomre & Toomre (1972) Toomre, A., & Toomre, J. 1972, The Astrophysical Journal, 178, 623, doi: 10.1086/151823
- Tran et al. (2020) Tran, K.-V. H., Forrest, B., Alcorn, L. Y., et al. 2020, The Astrophysical Journal, 898, 45, doi: 10.3847/1538-4357/ab8cba
- Urrutia et al. (2019) Urrutia, T., Wisotzki, L., Kerutt, J., et al. 2019, Astronomy & Astrophysics, 624, A141, doi: 10.1051/0004-6361/201834656
- Vanzella et al. (2010) Vanzella, E., Giavalisco, M., Inoue, A. K., et al. 2010, The Astrophysical Journal, 725, 1011, doi: 10.1088/0004-637X/725/1/1011
- Vanzella et al. (2012) Vanzella, E., Guo, Y., Giavalisco, M., et al. 2012, The Astrophysical Journal, 751, 70, doi: 10.1088/0004-637X/751/1/70
- Vanzella et al. (2016) Vanzella, E., Barros, S. D., Cupani, G., et al. 2016, The Astrophysical Journal, 821, L27, doi: 10.3847/2041-8205/821/2/L27
- Vanzella et al. (2018) Vanzella, E., Nonino, M., Cupani, G., et al. 2018, Monthly Notices of the Royal Astronomical Society: Letters, 476, L15, doi: 10.1093/mnrasl/sly023
- Vanzella et al. (2019) Vanzella, E., Caminha, G. B., Calura, F., et al. 2019, Monthly Notices of the Royal Astronomical Society, 000, doi: 10.1093/mnras/stz2286
- Vanzella et al. (2020) —. 2020, Monthly Notices of the Royal Astronomical Society, 491, 1093, doi: 10.1093/mnras/stz2286
- Vanzella et al. (2022) Vanzella, E., Castellano, M., Bergamini, P., et al. 2022, Astronomy and Astrophysics, 659, A2, doi: 10.1051/0004-6361/202141590
- Verhamme et al. (2015) Verhamme, A., Orlitová, I., Schaerer, D., & Hayes, M. 2015, Astronomy and Astrophysics, 578, 1, doi: 10.1051/0004-6361/201423978
- Wang et al. (2023) Wang, X., Teplitz, H. I., Smith, B. M., et al. 2023, The Lyman Continuum Escape Fraction of Star-forming Galaxies at $2.4\lesssim Z\lesssim3.7$ from UVCANDELS, doi: 10.48550/arXiv.2308.09064
- Whitaker et al. (2019) Whitaker, K. E., Ashas, M., Illingworth, G., et al. 2019, The Astrophysical Journal Supplement Series, 244, 16, doi: 10.3847/1538-4365/ab3853
- Williams et al. (2023) Williams, C. C., Tacchella, S., Maseda, M. V., et al. 2023, JEMS: A Deep Medium-Band Imaging Survey in the Hubble Ultra-Deep Field with JWST NIRCam & NIRISS, doi: 10.48550/arXiv.2301.09780
- Yang et al. (2017a) Yang, H., Malhotra, S., Rhoads, J. E., & Wang, J. 2017a, The Astrophysical Journal, 847, 38, doi: 10.3847/1538-4357/aa8809
- Yang et al. (2017b) Yang, H., Malhotra, S., Gronke, M., et al. 2017b, The Astrophysical Journal, 844, 171, doi: 10.3847/1538-4357/aa7d4d
- Yuma et al. (2019) Yuma, S., Ouchi, M., Fujimoto, S., Kojima, T., & Sugahara, Y. 2019, The Astrophysical Journal, 882, 17, doi: 10.3847/1538-4357/ab2f87
- Zackrisson et al. (2013) Zackrisson, E., Inoue, A. K., & Jensen, H. 2013, Astrophysical Journal, 777, doi: 10.1088/0004-637X/777/1/39